Low doses of the organic insecticide spinosad trigger lysosomal defects, elevated ROS, lipid dysregulation, and neurodegeneration in flies
- School of BioSciences, The University of Melbourne, Australia
- Department of Molecular and Human Genetics, Baylor College of Medicine, United States
- Department of Integrative Biology and Pharmacology, McGovern Medical School at the University of Texas Health Sciences Center, United States
- Neurological Research Institute, Texas Children Hospital, United States
- Howard Hughes Medical Institute, Baylor College of Medicine, United States
Figures
Figure 1

Low doses of spinosad are lethal and fail to increase Ca2+ levels in neurons.
(A) Dose–response to spinosad in Line14 wild-type larvae by an assay of larval movement over time, expressed in terms of relative movement ratio (n = 100 larvae/treatment). (B) Adult eclosion rate after Line14 larvae were subjected to a 2 hr exposure to 2.5 parts per million (ppm) spinosad, rinsed and placed back onto insecticide-free medium (n = 100 larvae/treatment). (C) Adult eclosion rate of Canton-S and Canton-S Dα6 KO larvae subjected to a 2 hr exposure at 2.5 ppm spinosad, rinsed and placed back onto insecticide-free medium (n = 100 larvae/treatment). (D) Cytosolic [Ca2+] measured by GCaMP in neurons expressing Dα6. Measurement is expressed as a ratio of the signals of GCaMP5G signal and tdTomato. Spinosad (2.5 ppm or 25 ppm) was added to the bath solution at 1 min after recording started. At 6 min and 8 min, the spinosad-exposed and unexposed groups were stimulated with 100 µM carbachol and 5 µM thapsigargin, respectively. Each point represents the average of at least 50 cells. (E) Peak [Ca2+] responses to spinosad and carbachol. Error bars in (A) and (E) represent mean ± SEM and in (B) and (C) mean ± SD. (A, E) One-way ANOVA followed by Tukey’s honestly significant difference test; (B, C) Student’s unpaired t-test. *p<0.05, ***p<0.001.
Figure 2
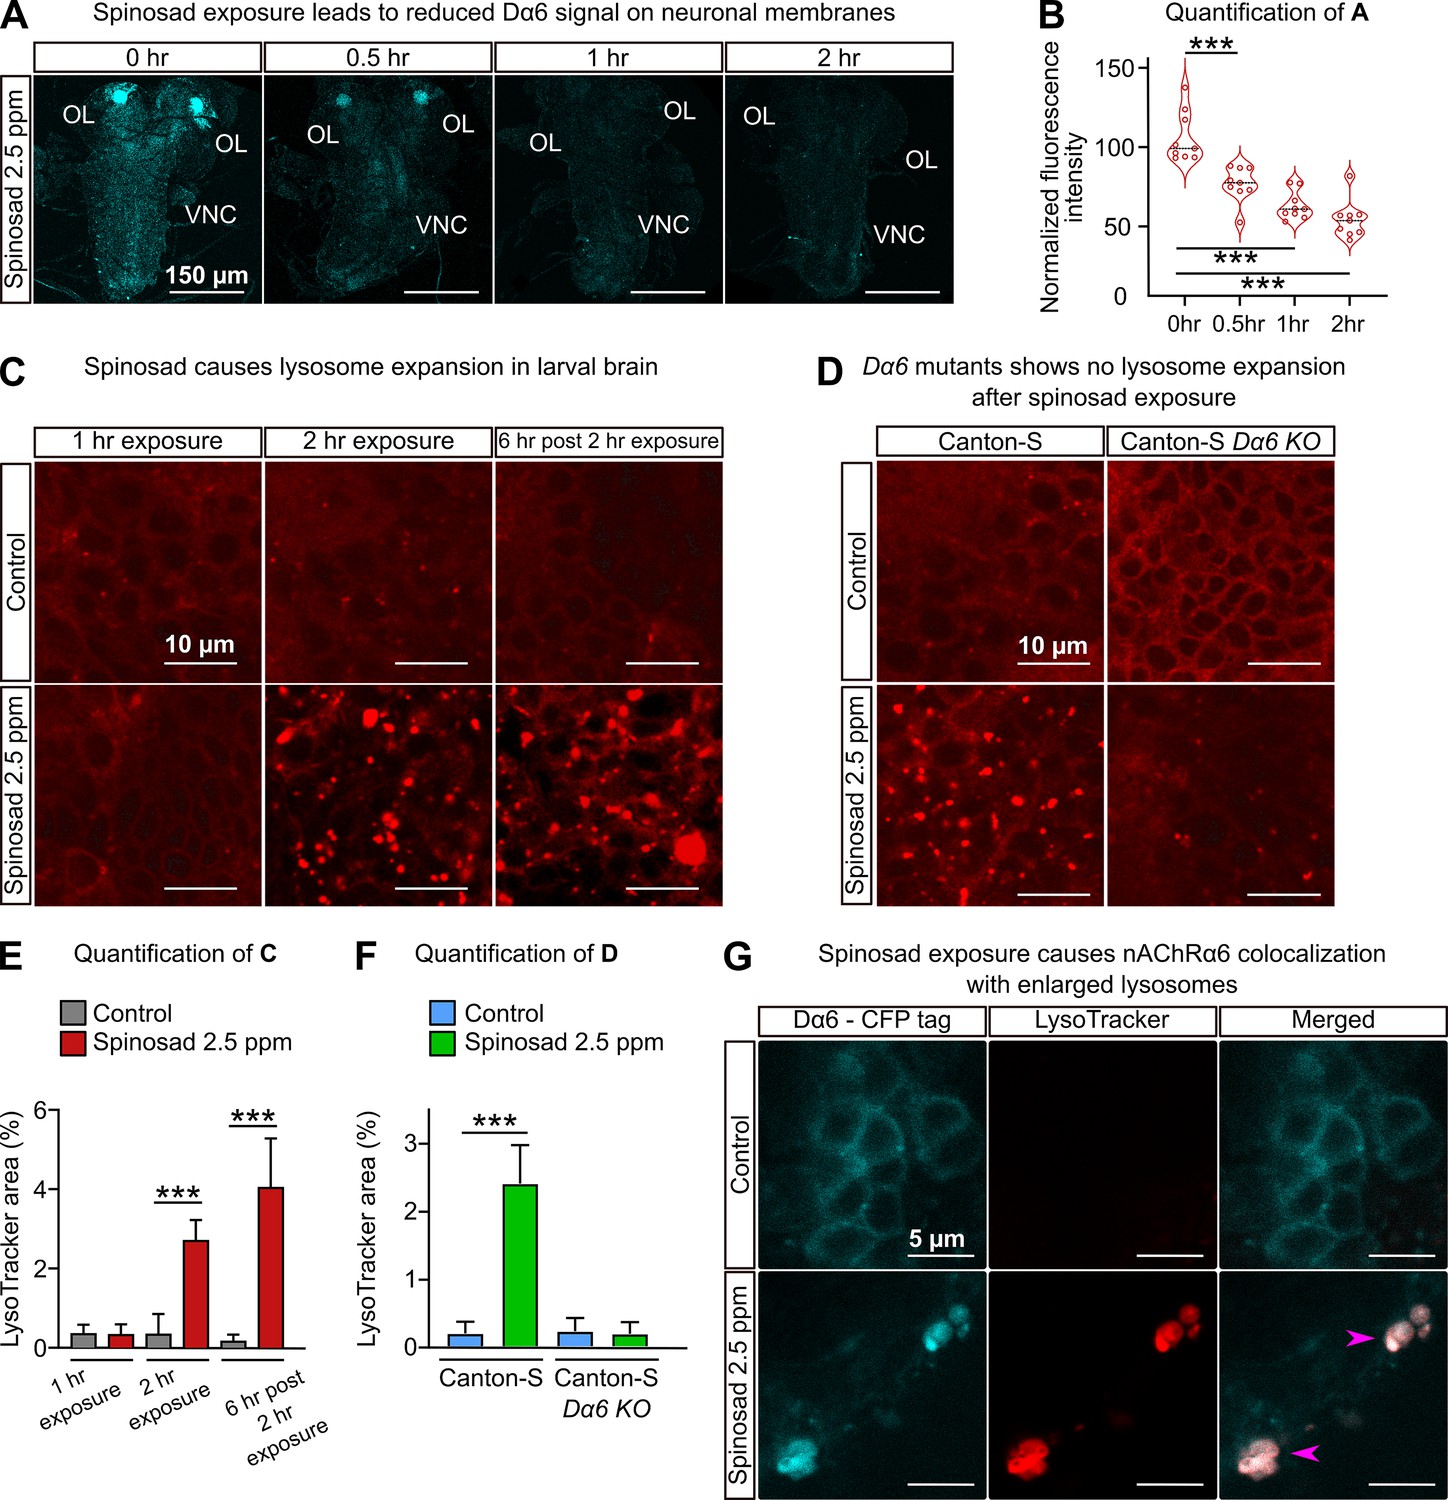
Spinosad exposure causes lysosomal expansion, and Dα6 colocalizes with enlarged lysosomes.
(A) Dα6 signal in larval brains exposed to 2.5 parts per million (ppm) spinosad for 30 min, 1 hr, or 2 hr. Larvae obtained by crossing UAS-Dα6 (CFP tagged) in the Line14 Dα6nx loss-of-function mutant background to a native Da6 driver (the Gal4-L driver) in the same background. OL, optic lobe; VNC, ventral nerve cord. (B) Quantification of (A) (n = 3 larvae/condition; three brain sections/larva). (C) LysoTracker staining shows lysosome expansion in the brain of Line14 larvae exposed to 2.5 ppm spinosad for 1 hr, 2 hr, or 6 hr post the 2 hr exposure. (D) LysoTracker staining shows lysosomes in the brain of Canton-S and Canton-S Dα6 KO larvae exposed to 2.5 ppm spinosad for 2 hr. (E) Quantification of (C), LysoTracker area (%) (n = 7 larvae/treatment; three optic lobe sections/larva). (F) Quantification of (D), LysoTracker area (%) (n = 7 larvae/treatment; three optic lobe sections/larva). (G) Larvae expressing Dα6 tagged with CFP exposed to 2.5 ppm spinosad for 2 hr show colocalization of the Dα6 and lysosomal signals. Pink arrowheads indicate Dα6 CFP signal colocalizing with lysosomes identified with LysoTracker staining. Microscopy images were obtained with a Leica SP5 Laser Scanning Confocal Microscope. Error bars in (E) and (F) represent mean ± SD. (B, E, F) One-way ANOVA followed by Tukey’s honestly significant difference test. ***p<0.001.
Figure 3 with 1 supplement
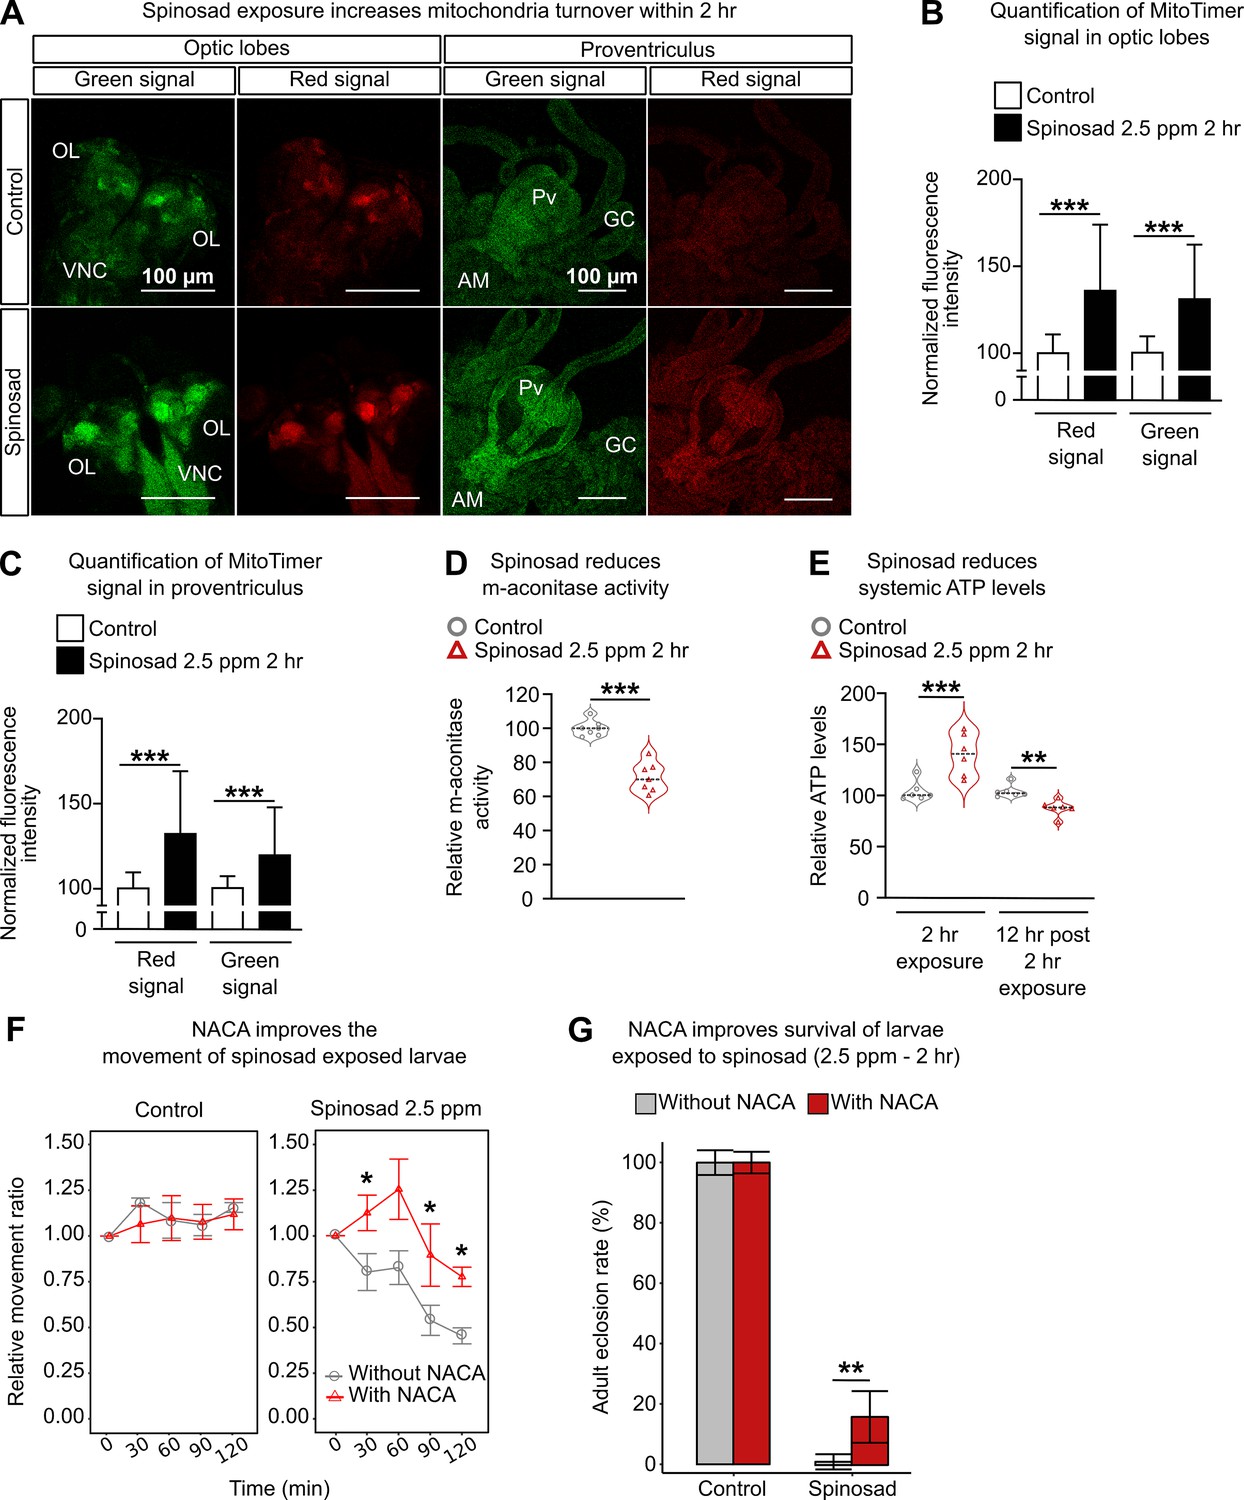
Spinosad exposure impacts mitochondria and energy metabolism, and antioxidant treatment reduces spinosad toxicity.
(A) Optic lobes of the brain and proventriculus of MitoTimer reporter expressing larvae. 2.5 parts per million (ppm) spinosad exposure for 2 hr increased the signal of healthy (green) and unhealthy (red) mitochondria. (B) Normalized mean fluorescence intensity of MitoTimer signals in optic lobes (n = 20 larvae/treatment; three image sections/larva). (C) Normalized mean fluorescence intensity of MitoTimer signals in proventriculus (n = 20 larvae/treatment; three image sections/larva). (D) Relative m-aconitase activity in whole Line14 larvae exposed to 2.5 ppm spinosad for 2 hr (n = 25 larvae/replicate; six replicates/treatment). (E) Relative systemic ATP levels in Line14 larvae immediately after the 2 hr exposure to 2.5 ppm spinosad and 12 hr post 2 hr exposure (n = 20 larvae/ replicate; six replicates/ treatment). (F) Pretreatment with N-acetylcysteine amide (NACA) improves the movement of spinosad-exposed Line14 larvae. Dose–response to insecticide by an assay of larval movement over time, expressed in terms of relative movement ratio (n = 25 larvae/replicate; four replicates/treatment). (G) Pretreatment with NACA improves survival of Line14 larvae exposed to spinosad. Adult eclosion rate (%) (n = 100 larvae/treatment). OL, optic lobe; VNC, ventral nerve cord; Pv, proventriculus; GC, gastric caeca; AM, anterior midgut. Error bars in (B) and (C) represent mean ± SD; in (F), mean ± SEM; and in (G), corrected percentage survival (Abbot’s correction). Microscopy images were obtained with a Leica SP5 Laser Scanning Confocal Microscope. (B, C, E) One-way ANOVA followed by Tukey’s honestly significant difference test; (D, F, G) Student’s unpaired t-test. **p<0.01, ***p<0.001.
Figure 3—figure supplement 1
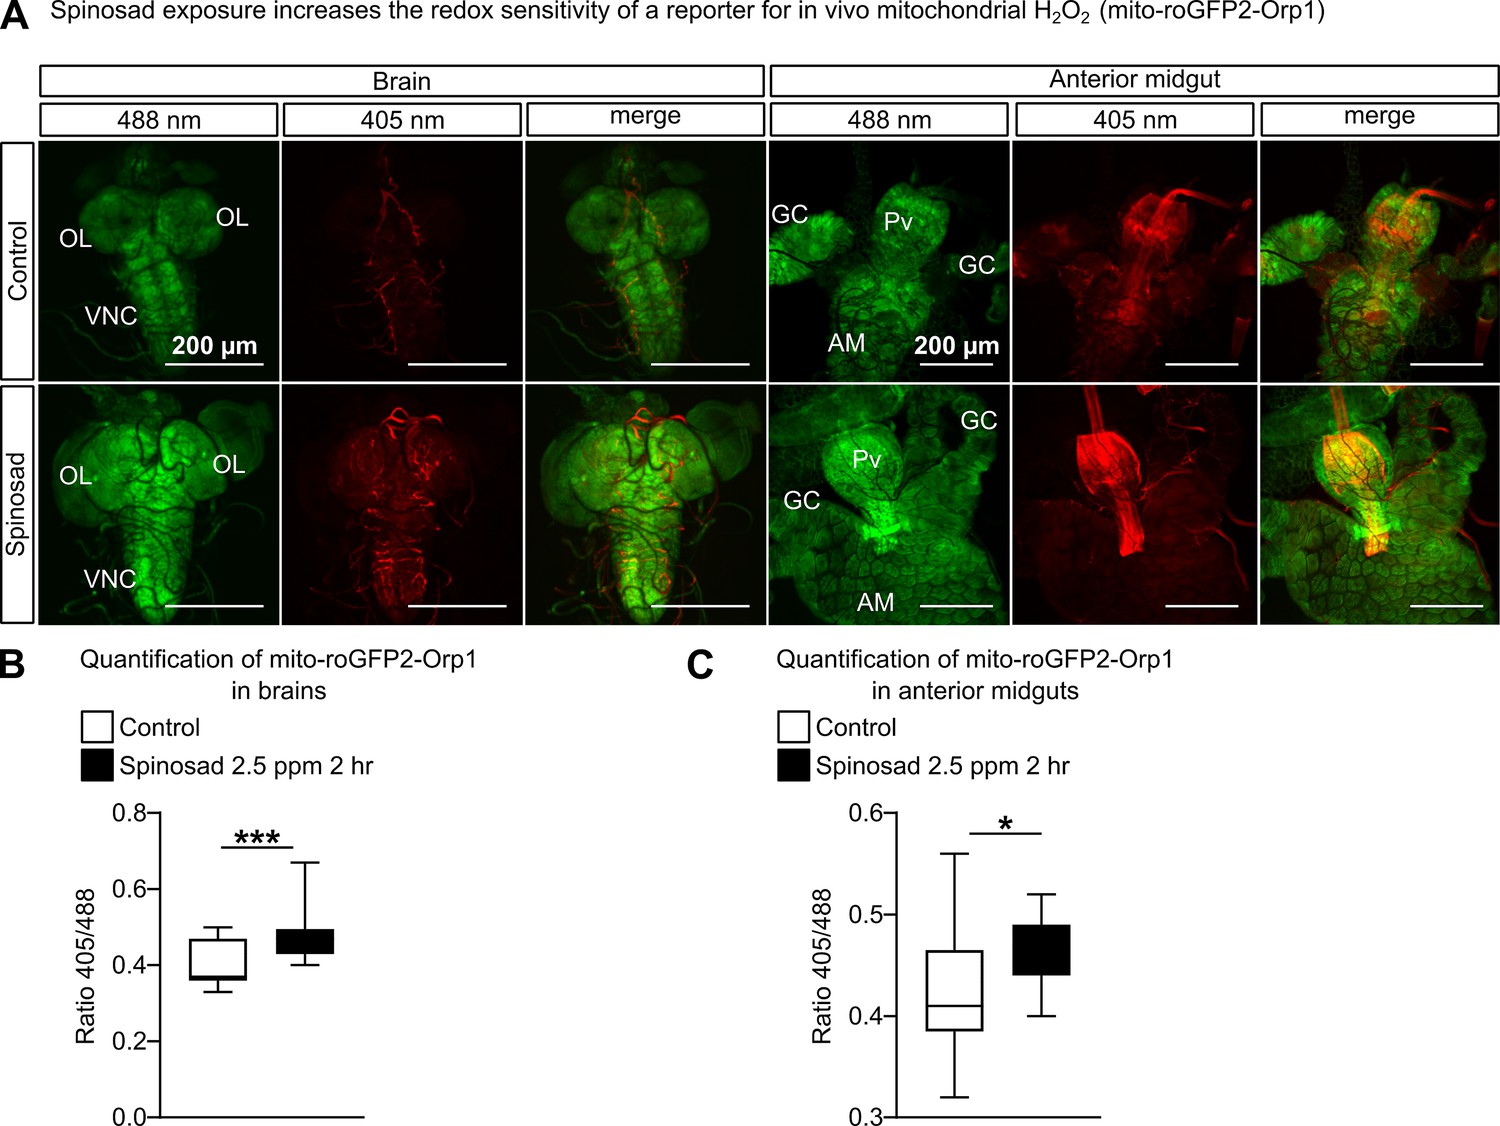
Spinosad exposure increases mitochondrial reactive oxygen species (ROS) signal.
(A) Mito-roGFP2-Orp1 signal in brain and anterior midgut of larvae exposed to 2.5 parts per million (ppm) spinosad for 2 hr. An increase in the signal of both reduced (488 nm – green) and oxidized (405 nm – red) mitochondria is observed. A significant increase in the ratio 405/488 points to the rise of H2O2 generation in mitochondria. (B) Quantification of ratio 405/488 in brains (n = 7 larvae/genotype/treatment; three sections/larva). (C) Quantification of ratio 405/488 in anterior midguts (n = 7 larvae/genotype/treatment; three sections/larva). Microscopy images were obtained with a Leica SP5 Laser Scanning Confocal Microscope. Student’s unpaired t-test. *p<0.05, ***p<0.001.
Figure 4 with 1 supplement
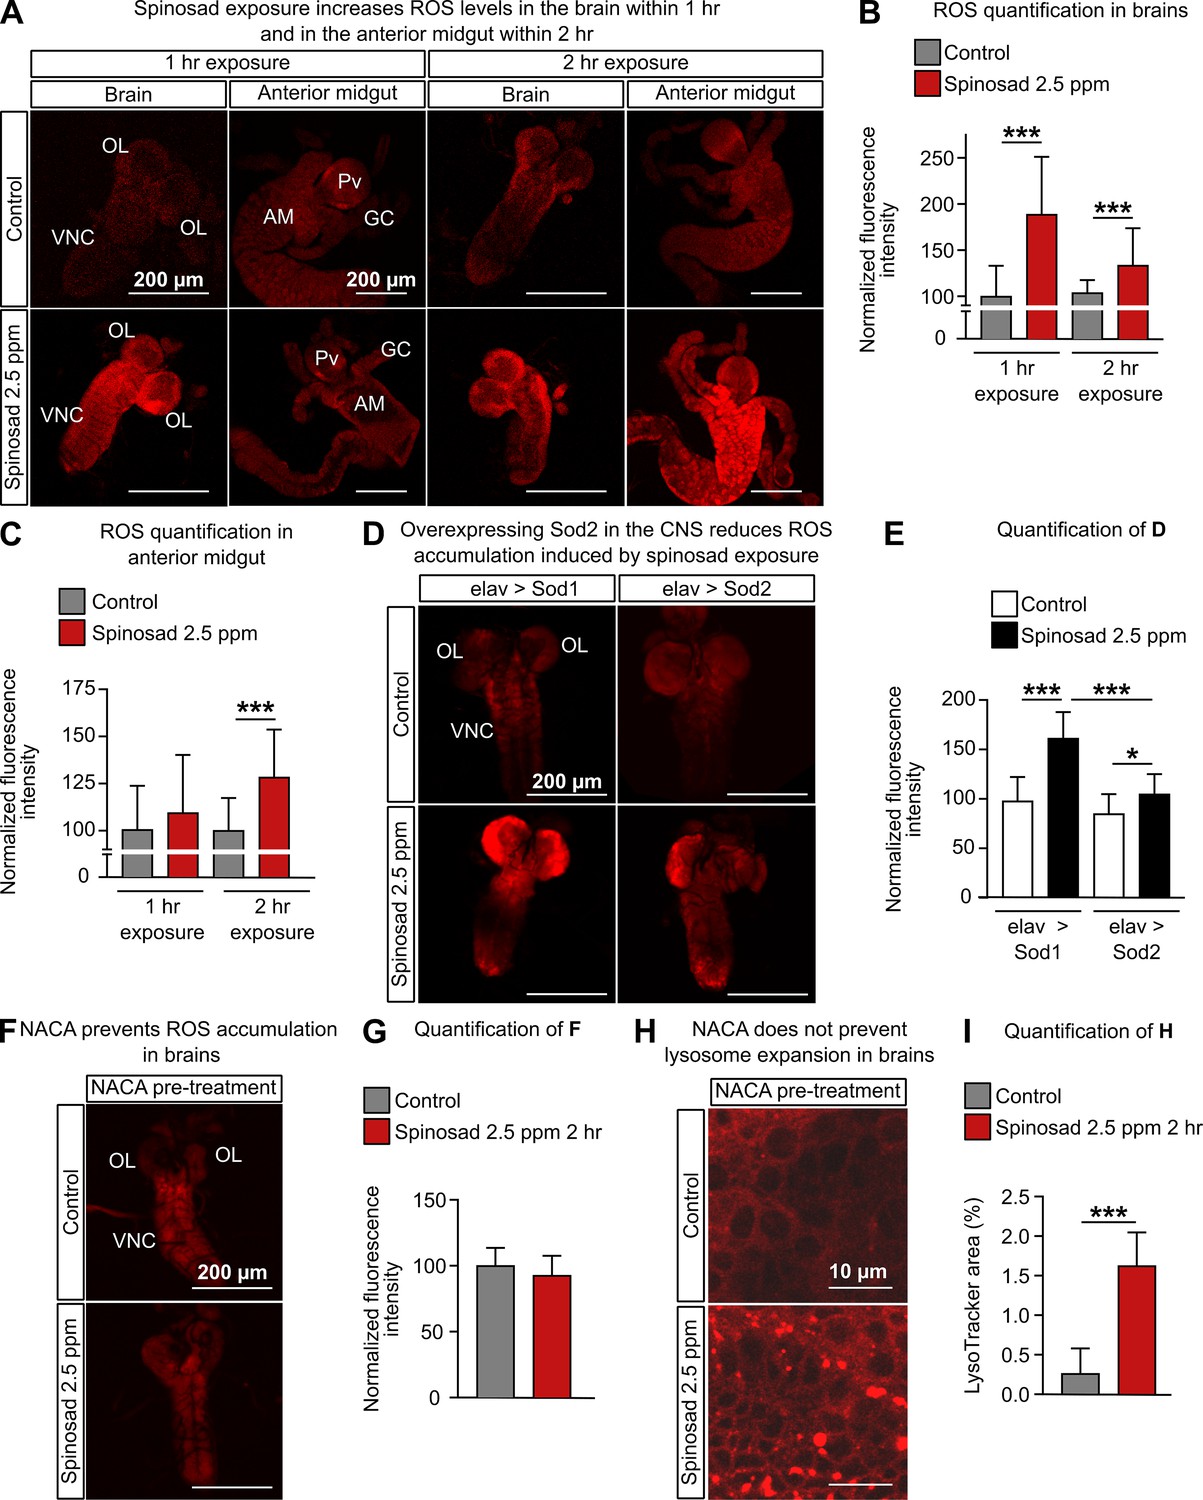
Spinosad exposure increases oxidative stress, and antioxidants prevent reactive oxygen species (ROS) accumulation, but not lysosome expansion.
(A) Dihydroethidium (DHE) staining of ROS levels in the brain and anterior midgut of Line14 larvae exposed to 2.5 parts per million (ppm) spinosad for either 1 hr or 2 hr. (B) DHE normalized fluorescence intensity in brains (n = 15 larvae/treatment; three sections/larva). (C) DHE normalized fluorescence intensity in anterior midgut (n = 15 larvae/treatment; three sections/larva). (D) DHE staining of ROS levels in the brains of larvae expressing Sod2 (elav-Gal4>UAS-Sod2) or Sod1 (control cross; elav-Gal4>UAS-Sod1) in the central nervous system and exposed to 2.5 ppm spinosad for 2 hr. (E) DHE normalized fluorescence intensity in brains (n = 7 larvae/genotype/treatment; three sections/larva). (F) DHE staining of ROS levels in the brain of Line14 larvae treated with N-acetylcysteine amide (NACA) and exposed to 2.5 ppm spinosad for 2 hr. (G) DHE normalized fluorescence intensity in brains (n = 8 larvae/treatment; three sections/larva). (H) LysoTracker staining showing lysosomes in brains of Line14 larvae treated with NACA and exposed to 2.5 ppm spinosad for 2 hr. (I) LysoTracker area (%) (n = 8 larvae/treatment; three optic lobe sections/larva). OL, optic lobe; VNC, ventral nerve cord; Pv, proventriculus; GC, gastric caeca; AM, anterior midgut. Error bars represent mean ± SD. Microscopy images were obtained with a Leica SP5 Laser Scanning Confocal Microscope. (B, C, E) One-way ANOVA followed by Tukey’s honestly significant difference test; (G, I) Student’s unpaired t-test. *p<0.05, ***p<0.001.
Figure 4—figure supplement 1
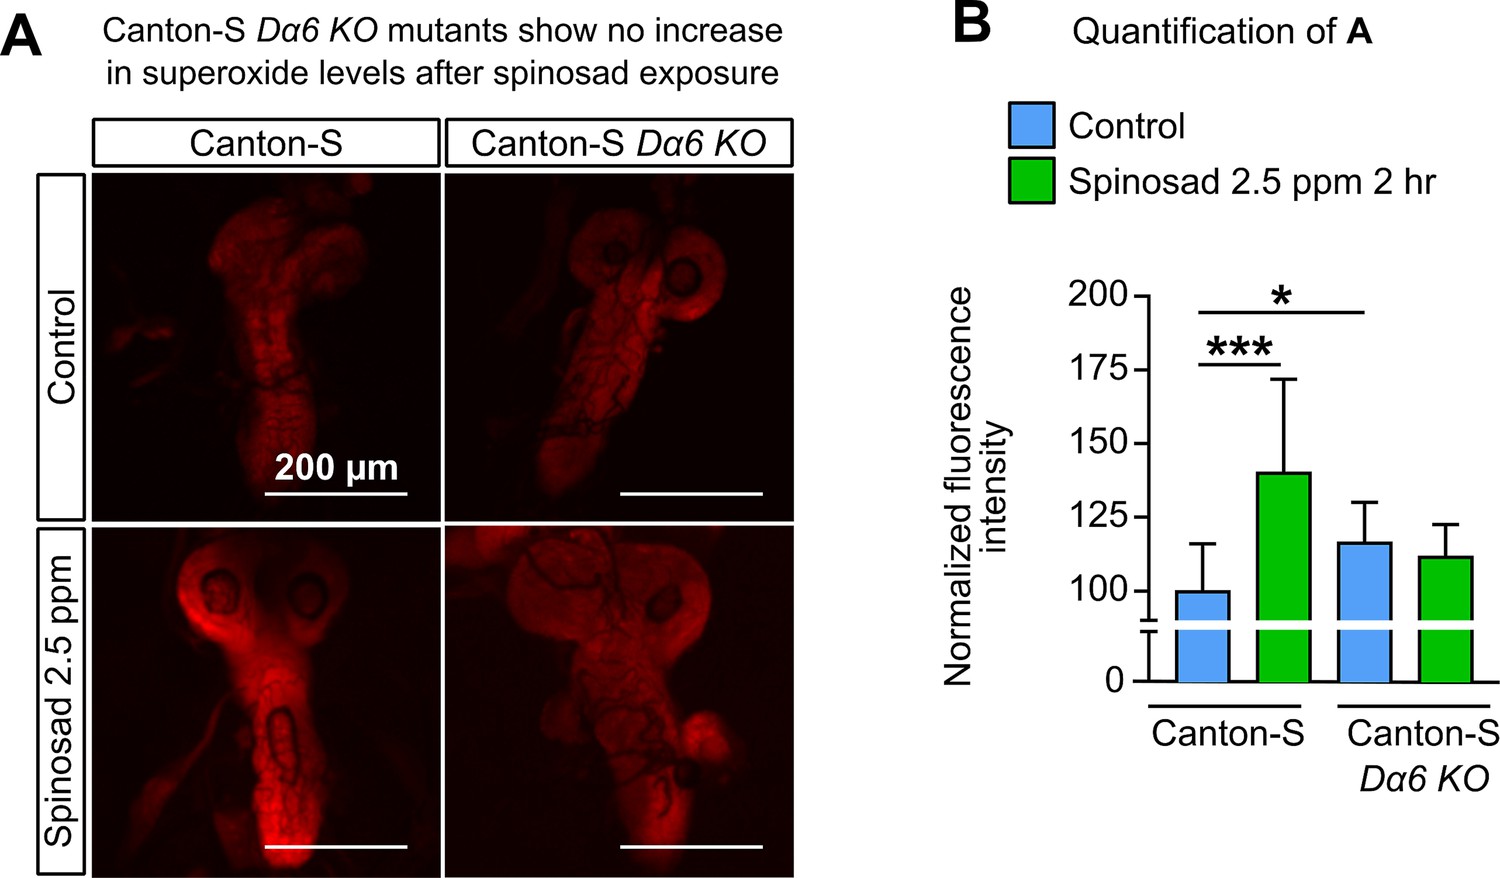
Dα6 KO mutants show no increase in ROS levels after spinosad exposure.
(A) Dihydroethidium (DHE) staining of ROS levels in the brains of Canton-S and Canton-S Dα6 KO larvae exposed to 2.5 parts per million (ppm) spinosad for 2 hr. (B) DHE normalized fluorescence intensity in brains (n = 8 larvae/genotype/treatment; three sections/larva). Microscopy images were obtained with a Leica SP5 Laser Scanning Confocal Microscope. One-way ANOVA followed by Tukey’s honestly significant difference test.
Figure 5 with 2 supplements
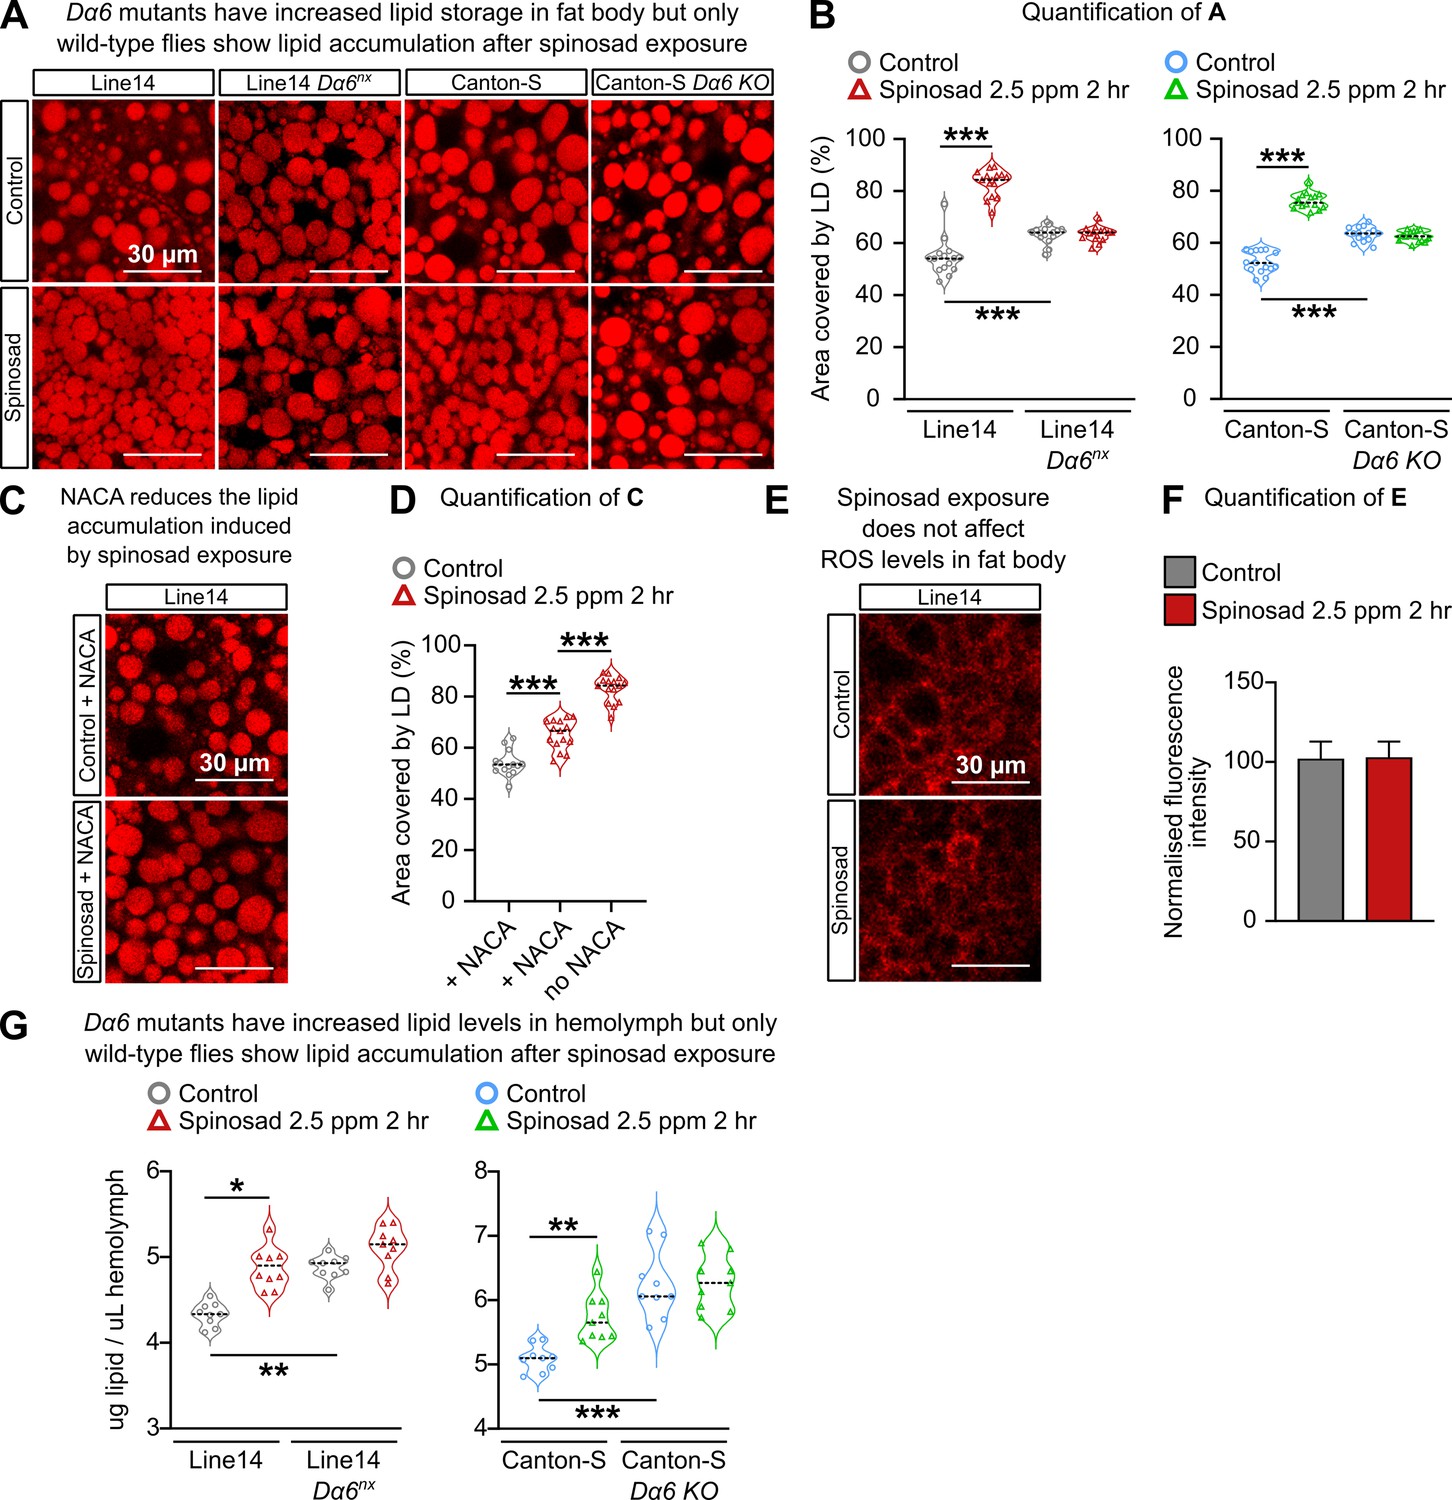
Spinosad triggers reactive oxygen species (ROS)-driven lipid changes in metabolic tissues of wild-type larvae but not Dα6 loss-of-function larvae.
(A) Nile Red staining showing lipid droplets in larval fat bodies of Line14 and Canton-S strains and their respective Dα6 loss-of-function mutant strains. Larvae exposed to 2.5 parts per million (ppm) spinosad for 2 hr. (B) Area covered by lipid droplets in fat body (%) (n = 3 larvae/treatment/genotype; five image sections/larva). (C) Nile Red staining showing lipid droplets in fat bodies of Line14 larvae treated with N-acetylcysteine amide (NACA) and exposed to 2.5 ppm spinosad for 2 hr. (D) Area covered by lipid droplets in fat body (%) (n = 3 larvae/treatment; five image sections/larva). (E) Dihydroethidium (DHE) staining of ROS levels in the fat body of Line14 larvae exposed to 2.5 ppm spinosad for 2 hr. (F) DHE normalized fluorescence intensity in fat body (n = 3 larvae/treatment; five sections/larva). (G) Amount of lipids in hemolymph (µg/µL) by colorimetric vanillin assay of Line14 and Canton-S larvae and their respective Dα6 loss-of-function mutants. Larvae exposed to 2.5 ppm spinosad for 2 hr (n = 10 replicates/treatment/time point; 30 larvae/replicate). Microscopy images were obtained with a Leica SP5 Laser Scanning Confocal Microscope. Error bars in (F) represent mean ± SD. (B, D, G) One-way ANOVA followed by Tukey’s honestly significant difference test; (F) Student’s unpaired t-test. *p<0.05, **p<0.01, ***p<0.001.
Figure 5—figure supplement 1
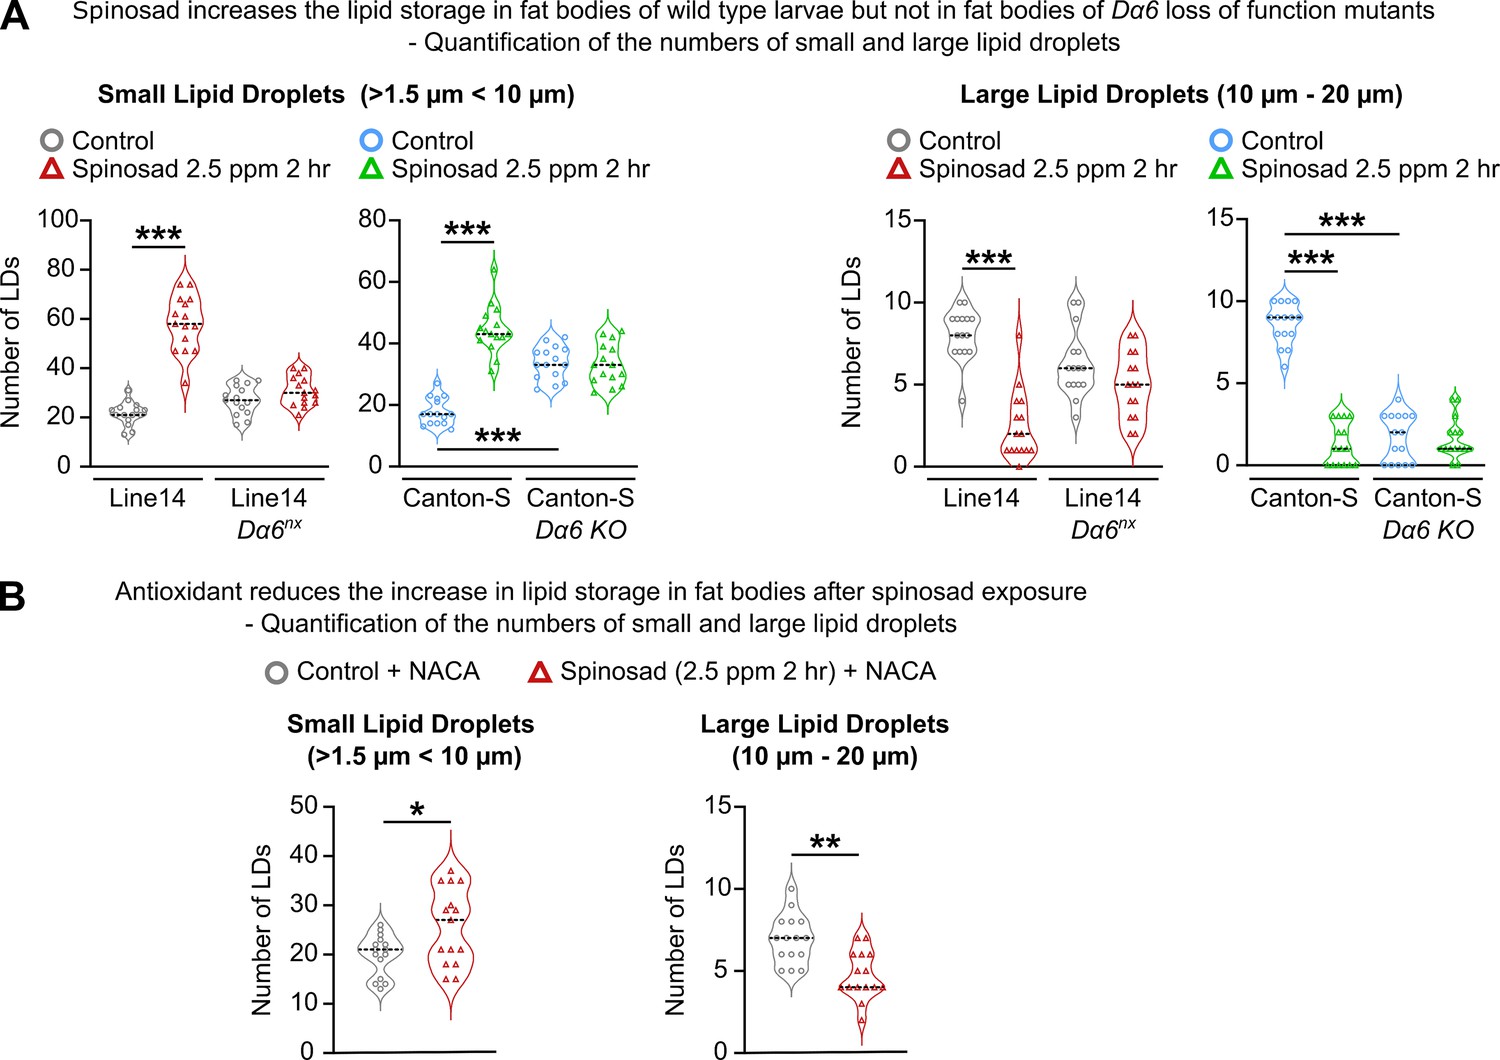
Impact of spinosad exposure on lipid droplets dynamics in fat body.
(A) Number of small (>1.5 µm < 10 µm) and large (10–20 µm) lipid droplets in the fat body of Line14 and Canton-S larvae and respective Dα6 loss-of-function mutants exposed to 2.5 parts per million (ppm) spinosad for 2 hr (n = 3 larvae/treatment/genotype; five image sections/larva). (B) Number of small and large lipid droplets in the fat body of Line14 larvae treated with N-acetylcysteine amide (NACA) and exposed to 2.5 ppm spinosad for 2 hr (n = 3 larvae/treatment; five image sections/larva). (A) One-way ANOVA followed by Tukey’s honestly significant difference test; (B) Student’s unpaired t-test. *p<0.05, **p<0.01, ***p<0.001.
Figure 5—figure supplement 2
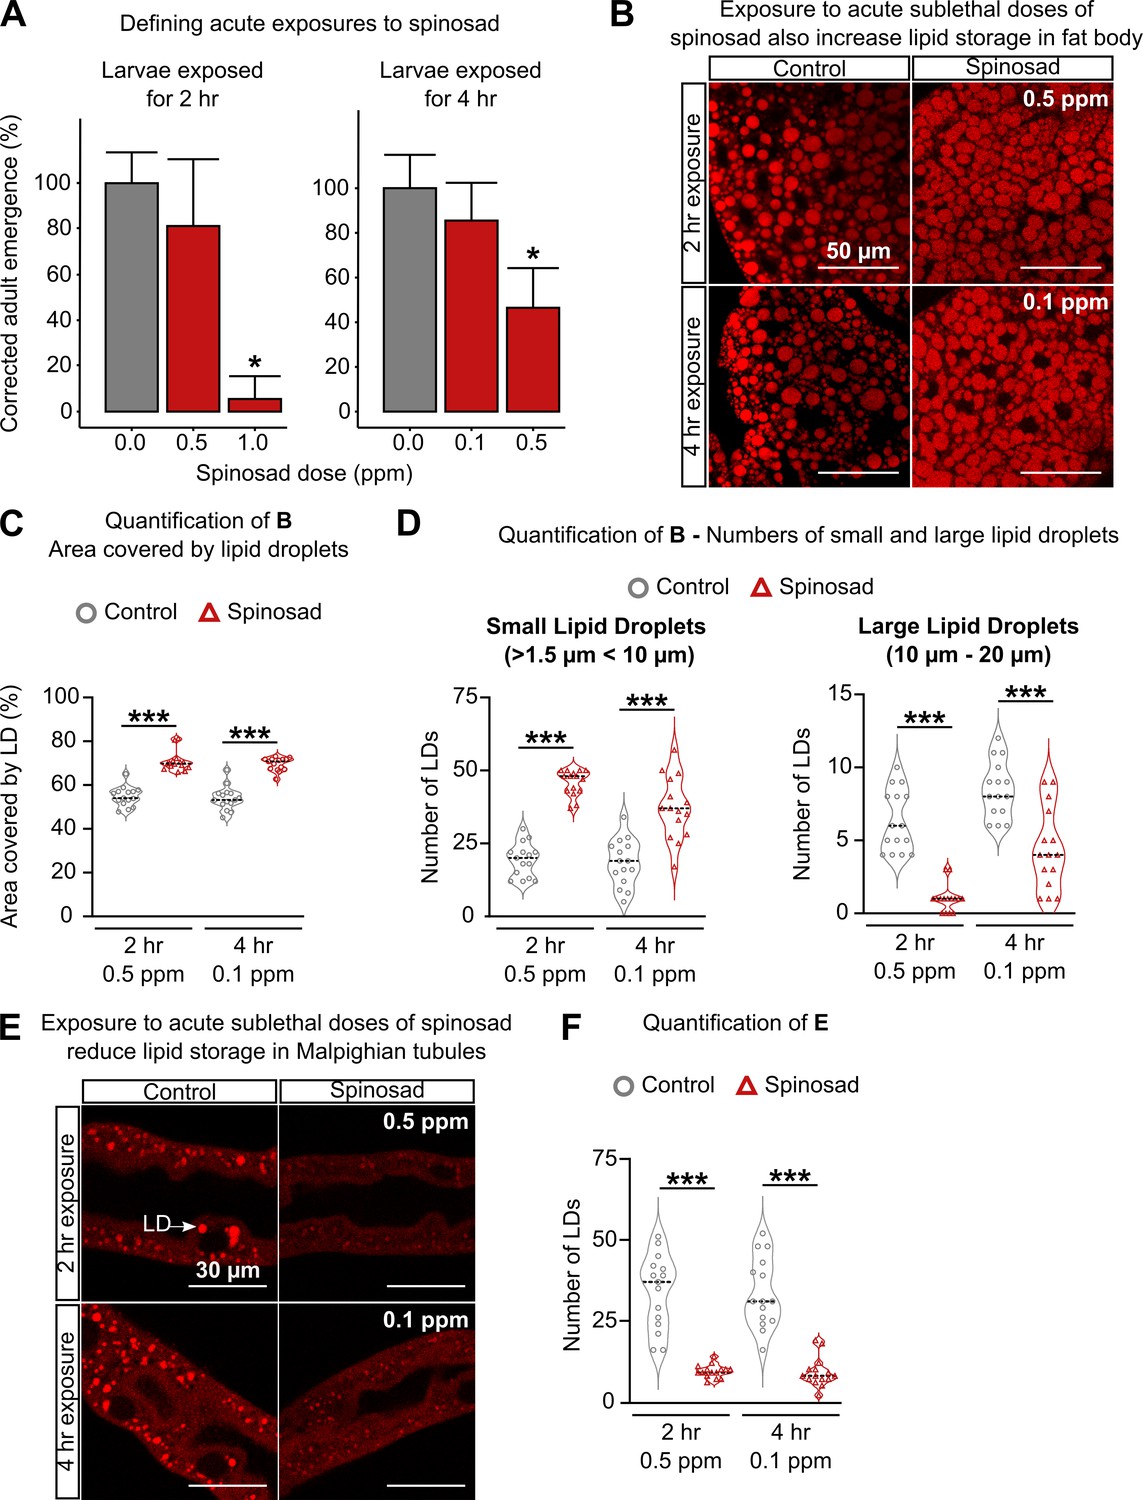
Spinosad doses that do not affect survival impact the larval lipid environment.
(A) Corrected adult emergence relative to controls – larvae exposed to different spinosad doses were rinsed in 5% sucrose and placed back onto insecticide-free media for quantification of adult emergence. 0.5 parts per million (ppm) for 2 hr and 0.1 ppm for 4 hr were determined as the highest doses that do not affect survival. (B) Nile Red staining of lipid droplets in the fat body of larvae in response to the highest doses that do not affect survival. (C) Percentage of area occupied by lipid droplets in fat body (n = 3 larvae/treatment; five image sections/larva). (D) Number of small (>1.5 µm < 10 µm) and large (10–20 µm) lipid droplets in the fat body of larvae in response to the highest doses that do not affect survival (n = 3 larvae/treatment; five image sections/larva). (E) Nile Red staining of lipid storage in Malpighian tubules of larvae exposed to the highest doses that do not affect survival. White arrow indicates a lipid droplet. (F) Number of lipid droplets per Malpighian tubule section (n = 3 larvae/treatment; five sections/larva). (G) Nile Red staining of posterior midgut. White arrow indicates cluster of lipid droplets. Zones with lipid droplet accumulation were only found in nonexposed animals (n = 3 larvae/ treatment). Microscopy images were obtained with a Leica SP5 Laser Scanning Confocal Microscope. Error bars in (A) indicate 95% confidence interval. (A, C, D, F) One-way ANOVA followed by Tukey’s honestly significant difference test. *p<0.05, ***p<0.001.
Figure 6
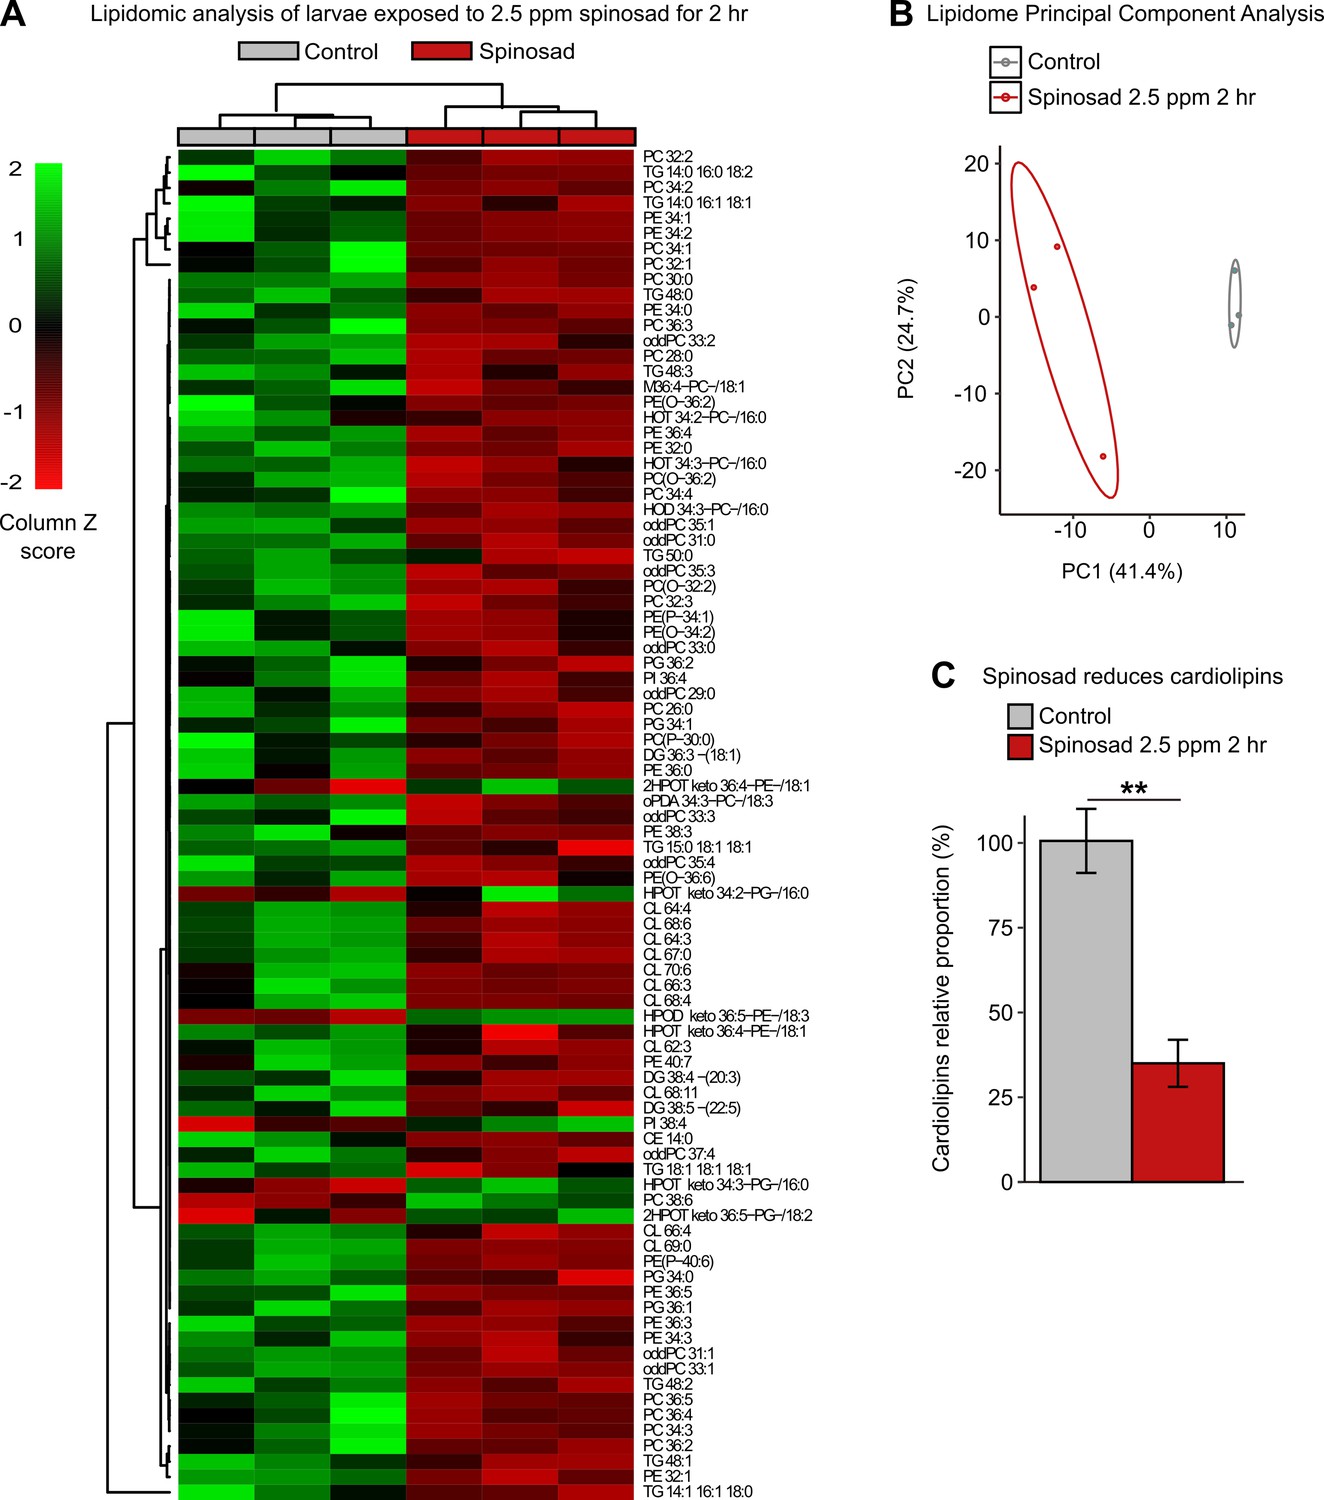
Spinosad disturbs the lipid profile of exposed larvae.
Lipidomic profile of larvae exposed to 2.5 parts per million (ppm) spinosad for 2 hr (n = 10 larvae/replicate; three replicates/treatment). (A) 88 lipid species out of the 378 identified were significantly affected by insecticide treatment (one-way ANOVA, Turkey’s honestly significant difference test, p<0.05). The cell colors represent the z-scores, that is, the standardized scores on the same scale, calculated by dividing a score’s deviation by the standard deviation in the row. The features are color-coded by row with red indicating low intensity and green indicating high intensity. (B) Principal component analysis of 378 lipid species. Each dot represents the lipidome data sum of each sample. First component explains 41.4% of variance and second component explains 24.7% of variance. (C) Relative proportion of cardiolipins in exposed animals versus control. Error bars represent mean ± SEM, Student’s unpaired t-test, **p<0.01.
-
Figure 6—source data 1
Impact of spinosad on the lipidomic profile.
Lipidomic profile of larvae exposed to 2.5 parts per million (ppm) spinosad or control (equivalent dose of dimethyl sulfoxide) for 2 hr as detected by liquid chromatography-mass spectrometry. Values are expressed as peak intensity area normalized to sample weight.
- https://cdn.elifesciences.org/articles/73812/elife-73812-fig6-data1-v1.docx
Figure 7
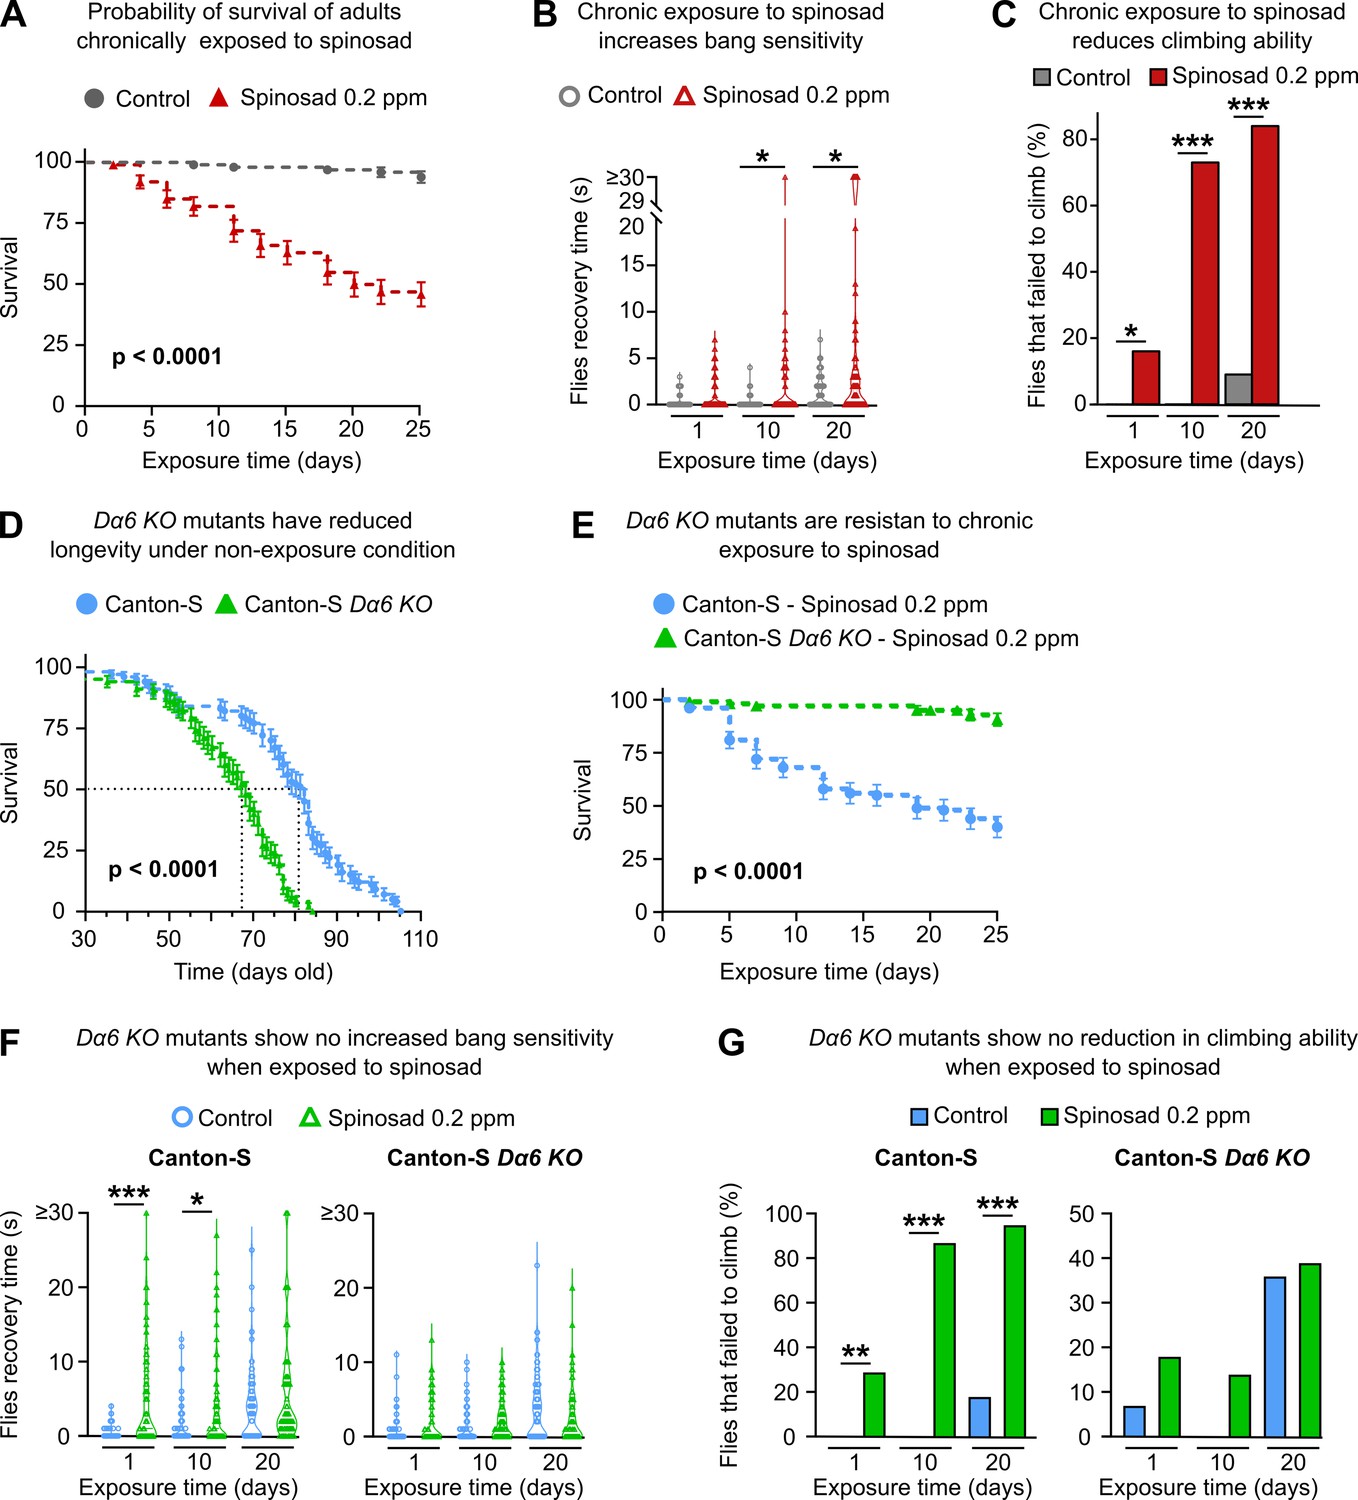
Chronic effects of spinosad exposure are more severe than loss of Dα6 expression in adult virgin females.
(A) A chronic exposure to 0.2 parts per million (ppm) spinosad kills 50% of flies within 25 days (n = 25 flies/replicate; four replicates/treatment). (B) Chronic exposure to 0.2 ppm spinosad increases bang sensitivity after 10 and 20 days of exposure. Time to regain normal standing posture (seconds) after flies were vortexed in a clear vial for 10 seconds (n = 100 flies/time point/treatment). (C) Chronic exposure to 0.2 ppm spinosad reduces climbing ability. Percentage of flies that failed to climb after 1, 10, and 20 days of exposure (n = 100 flies/time point/treatment). (D) Longevity of unexposed Canton-S and Canton-S Dα6 KO mutants (n = 100 flies/genotype). (E) Chronic exposure to 0.2 ppm spinosad for 25 days has no impact on survival of Canton-S Dα6 KO mutants (n = 25 flies/replicate; four replicates/genotype). (F) Chronic exposure to 0.2 ppm spinosad does not increase bang sensitivity of Canton-S Dα6 KO mutants. Time to regain normal standing posture (seconds) after flies were vortexed in a clear vial for 10 s (n = 100 flies/time point/genotype/treatment). (F) Chronic exposure to 0.2 ppm spinosad does not reduce climbing ability of Canton-S Dα6 KO mutants. Percentage of flies that failed to climb (n = 100 flies/time point/genotype/treatment). Error bars in (A), (D), and (E) represent mean ± SEM. (A, D, E) Kaplan–Meier method and the log-rank Mantel–Cox test. (B, C, F, G) Kruskal–Wallis followed by Dunn’s multiple comparisons test. *p<0.05, ***p<0.001.
Figure 8
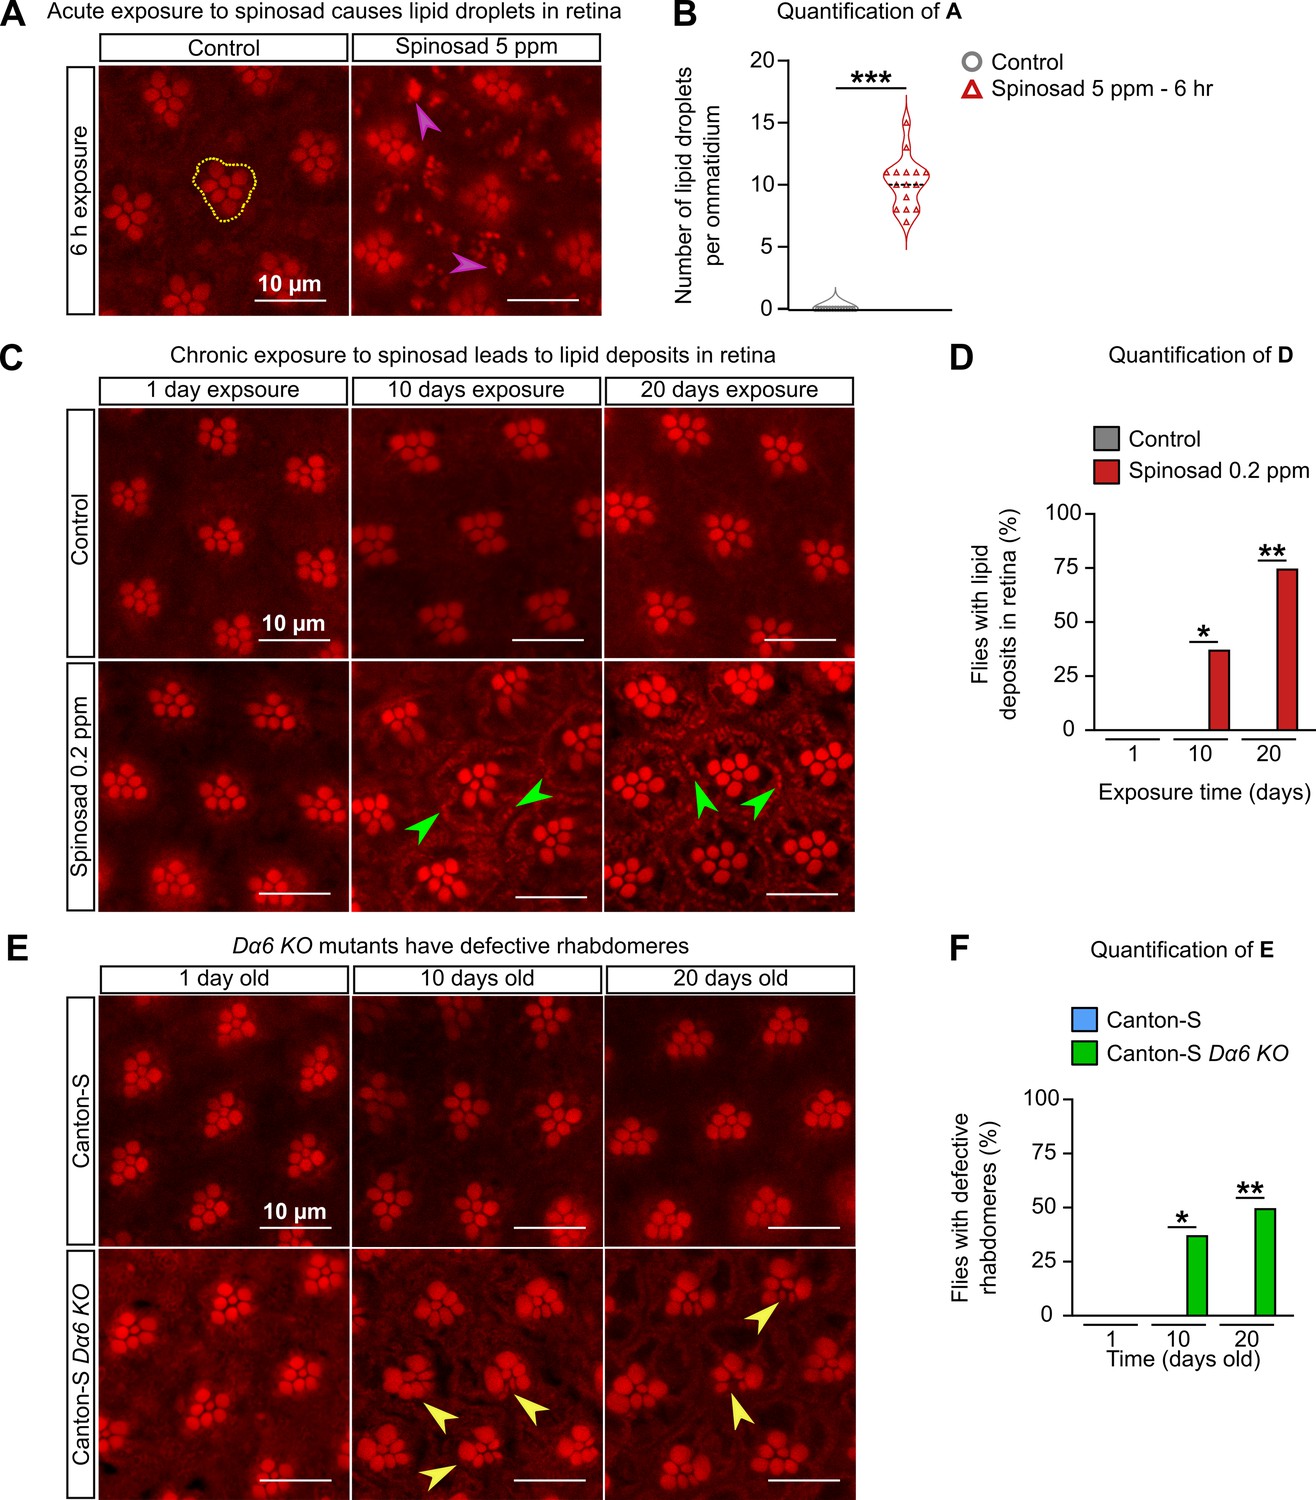
Chronic exposure to spinosad causes lipid deposits in retinas.
(A) Nile Red staining of lipid droplets in the retinas of virgin females exposed to 5 parts per million (ppm) spinosad for 6 hr. Cluster of rhabdomeres delimited with yellow dotted line, purple arrowheads point to lipid droplets. (B) Number of lipid droplets per ommatidium (n = 5 flies/treatment; three image sections/retina). (C) Nile Red staining of lipid deposits in retinas of virgin females exposed to 0.2 ppm spinosad for 1, 10, and 20 days. Green arrowheads point to lipid deposits. (D) Percentage of flies with lipid deposits in retinas (n = 8 flies/time point/treatment). (E) Nile Red staining of defective rhabdomeres in retinas of virgin females Canton-S and Canton-S Dα6 KO mutants 1, 10, and 20 days old. Yellow arrowheads point to defective rhabdomeres. (F) Percentage of flies that show defective rhabdomeres (n = 8 flies/time point/genotype). Microscopy images were obtained with a Leica TCS SP8 Laser Scanning Confocal Microscope. (B) Student’s unpaired t-test; (D, F) one-way ANOVA followed by Tukey’s honestly significant difference test. *p<0.05, **p<0.01, ***p<0.001.
Figure 9
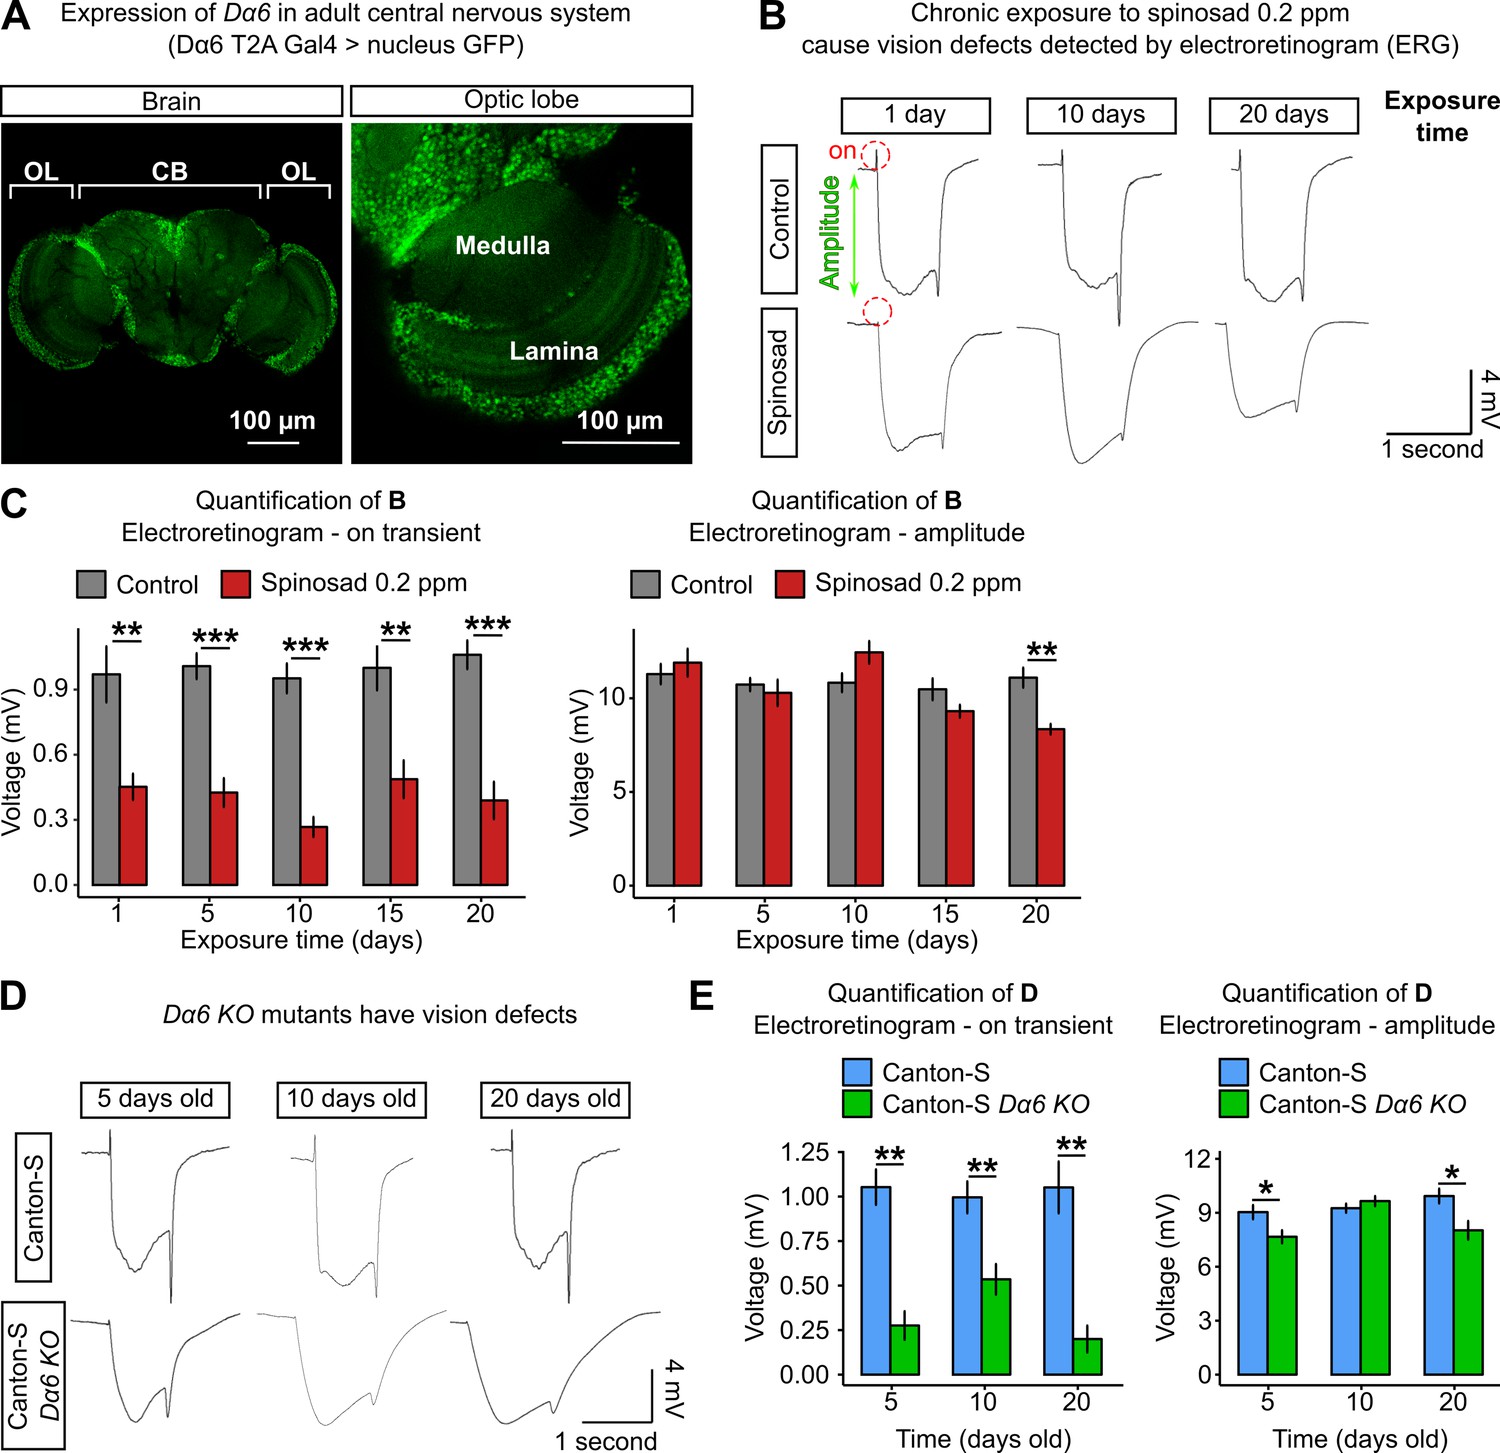
Chronic exposure to spinosad impairs the visual system.
(A) Expression pattern of Dα6 in the Drosophila adult female brain (Dα6 T2A Gal4>UASGFP.nls). Detail of the expression in lamina and medulla (optic lobe). OL,-optic lobe; CB, central brain. (B) Electroretinograms (ERGs) of virgin females exposed to 0.2 parts per million (ppm) spinosad for 1, 10, and 20 days. Red dotted circles indicate the on-transient signal, and green arrow indicates the amplitude. (C) Measurements of on-transient signal and amplitude after 1, 5, 10, 15, and 20 days of exposure to 0.2 ppm spinosad (n = 8–10 flies/time point/treatment). (D) ERGs of virgin females Canton-S and Canton-S Dα6 KO mutants 5, 10, and 20 days old. (E) Measurements of on-transient signal and amplitude in Canton-S and Canton-S Dα6 KO mutants (n = 8–10 flies/time point/genotype). Microscopy images were obtained with a Leica TCS SP8 Laser Scanning Confocal Microscope. (C, E) One-way ANOVA followed by Tukey’s honestly significant difference test. *p<0.05, **p<0.01, ***p<0.001.
Figure 10
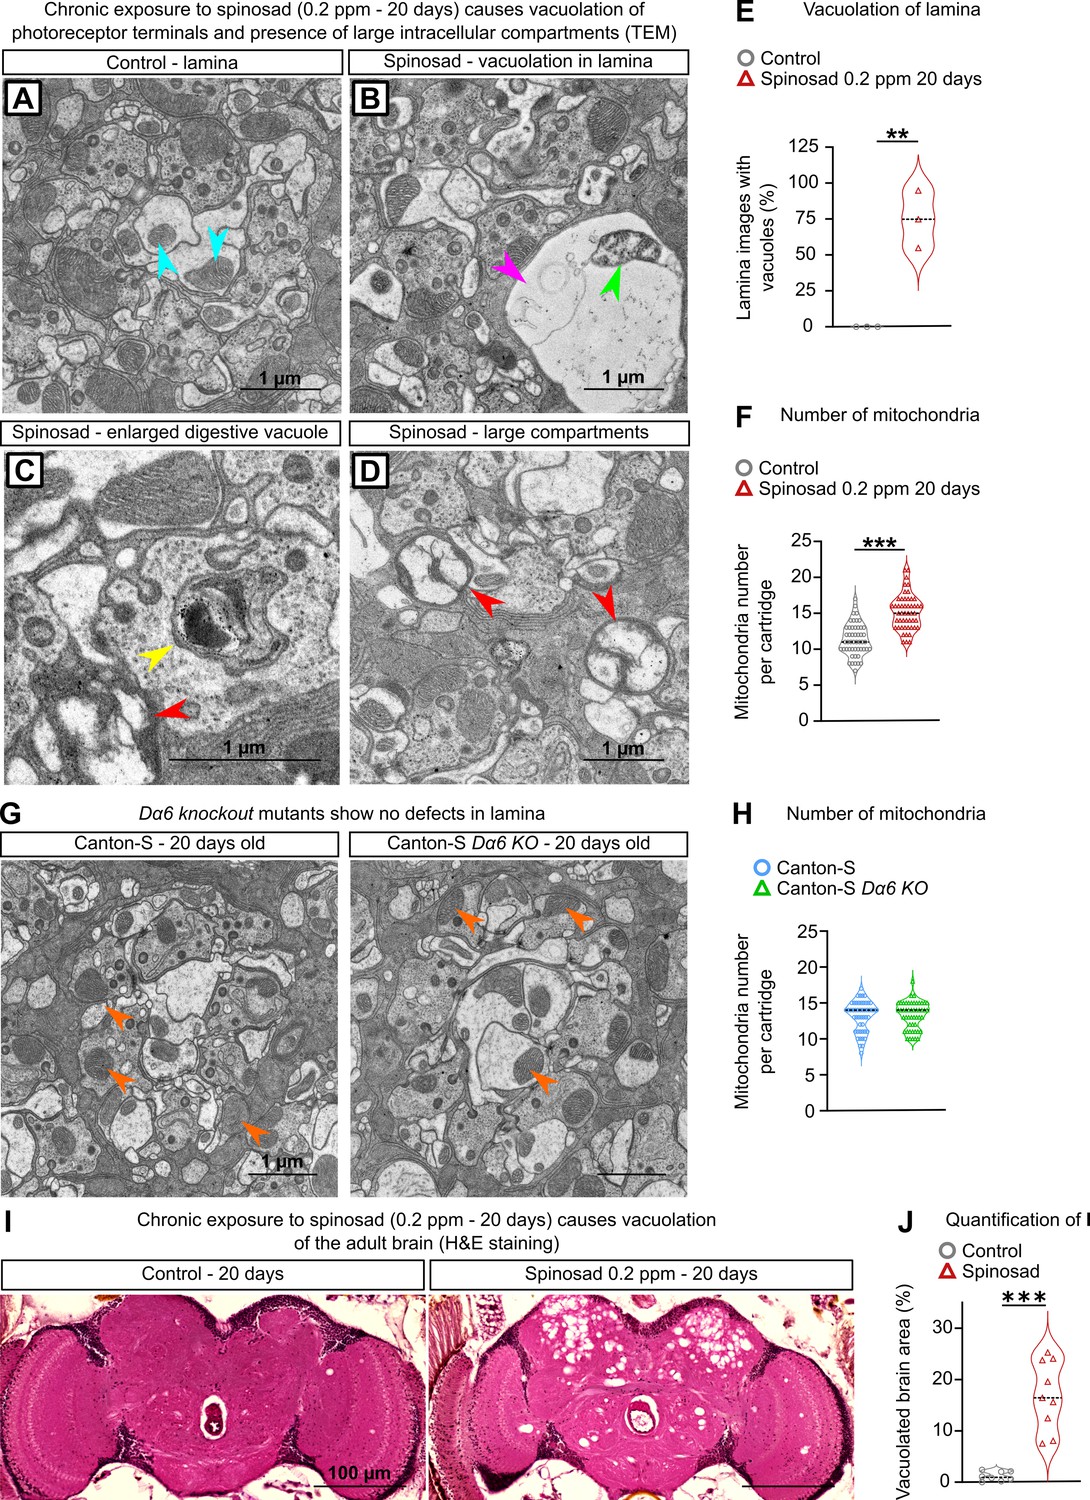
Chronic exposure to spinosad leads to neurodegeneration.
(A–D) Transmission electron microscopy (TEM) of the lamina of virgin females exposed to 0.2 parts per million (ppm) spinosad for 20 days. (A) A regular cartridge of a control fly; blue arrowheads indicate normal mitochondria. (B) Cartridge of an exposed fly; pink arrowhead indicates a vacuole and green arrowhead indicates a defective mitochondrion. (C, D) Cartridges of exposed flies indicating an enlarged digestive vacuole (yellow arrowhead) and the presence of large intracellular compartments (red arrowheads). (E) Percentage of images showing vacuoles in lamina cartridges of exposed flies (10 images/fly; three flies/treatment). (F) Number of mitochondria per cartridge of exposed flies (n = 3 flies/treatment; 16 cartridges/fly). (G) TEM of the lamina of virgin 20-day-old females Canton-S and Canton-S Dα6 KO mutant. (H) Number of mitochondria per cartridge (n = 3 flies/genotype; 16 cartridges/fly). (I) Hematoxylin and eosin (H&E) staining of adult brain of virgin females exposed to 0.2 ppm spinosad for 20 days. (J) Quantification of neurodegeneration in terms of percentage of brain area vacuolated (n = 3 flies/treatment). (E, F, H, J) Student’s unpaired t-test. **p<0.01, ***p<0.001.
Figure 11
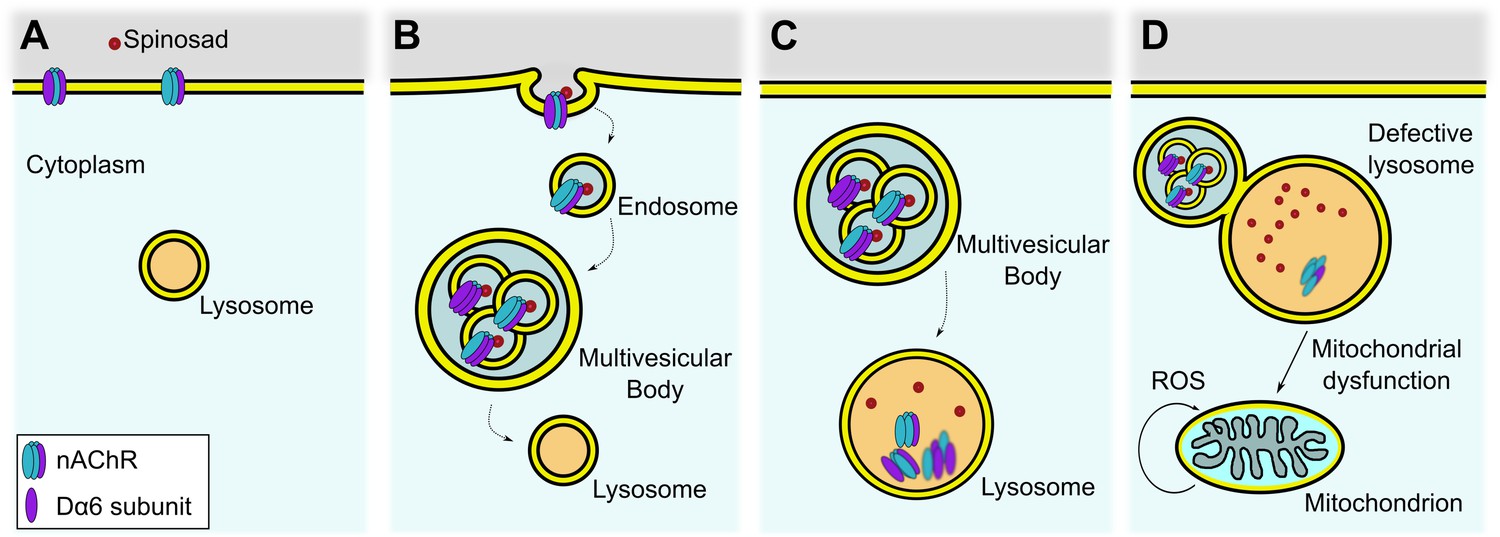
Proposed mechanism for internalization of spinosad after binding to Dα6 targets.
(A) Spinosad binds to Dα6 subunit of nicotinic acetylcholine receptors (nAChRs) in the neuronal cell membranes. (B) The binding of spinosad leads to Dα6-containing nAChR blockage, endocytosis, and trafficking to lysosome. (C) Spinosad accumulates in lysosomes, while receptors and other membrane components are digested. (D) Expanded lysosomes due to accumulation of undigested material do not function properly, leading to cellular defects that may include mitochondrial dysfunction, increased mitochondrial reactive oxygen species (ROS) production, and eventually cell vacuolation and neurodegeneration.
Tables
Key resources table
| Reagent type (species) or resource | Designation | Source or reference | Identifiers | Additional information |
|---|---|---|---|---|
| Genetic reagent(Drosophila melanogaster) | Armenia60 | Drosophila Genomics Resource Center | DGRC #103394 | Line14 is an isofemale line derived from Armenia60 |
| Genetic reagent(D. melanogaster) | nAChRα6 T2A Gal4 | Bloomington Drosophila StockCenter | BDSC #76137 | RRID:BDSC_76137 |
| Genetic reagent(D. melanogaster) | UAS-GFP.nls | Bloomington Drosophila StockCenter | BDSC #4775 | RRID:BDSC_4775 |
| Genetic reagent(D. melanogaster) | mito-roGFP2-Orp1 | Bloomington Drosophila StockCenter | BDSC #67672 | RRID:BDSC_67672 |
| Genetic reagent(D. melanogaster) | UAS-Sod2 | Bloomington Drosophila StockCenter | BDSC #24494 | RRID:BDSC_24494 |
| Genetic reagent(D. melanogaster) | UAS-Sod1 | Bloomington Drosophila StockCenter | BDSC #24750 | RRID:BDSC_24750 |
| Genetic reagent(D. melanogaster) | Elav-Gal4 | Bloomington Drosophila StockCenter | BDSC #458 | RRID:BDSC_458 |
| Genetic reagent(D. melanogaster) | Canton-S | Bloomington Drosophila StockCenter | BDSC #64349 | RRID:BDSC_64349 |
| Genetic reagent(D. melanogaster) | Canton-S Dα6 KO;Canton-S nAChRα6 knockout | This paper | Mutant strain generated by CRISPR and maintained in T. Perry Lab | |
| Genetic reagent(D. melanogaster) | Line14 Dα6 loss-of-function mutant;Line14 Dα6nx | Perry et al., 2015 (doi:10.1016/j.ibmb.2015.01.017) | Mutant strain generated by EMS and maintained in T. Perry Lab | |
| Genetic reagent(D. melanogaster) | GCaMP5G:tdTomato cytosolic [Ca2+] sensor | Bloomington Drosophila StockCenter | BDSC #80079 | RRID:BDSC_80079 |
| Chemical compound, drug | Spinosad | Sigma-Aldrich | Product #33706 | |
| Chemical compound, drug | Antioxidant N-acetylcysteine amide;NACA | Liu et al., 2015 (doi:10.1016/j.cell.2014.12.019) | Provided by Hugo J. Bellen Lab | |
| Chemical compound, drug | DHE | Sigma-Aldrich | Product #D7008 | |
| Chemical compound, drug | Nile Red | Sigma-Aldrich | Product #N3013 | |
| Chemical compound, drug | LysoTracker Red DND-99 (1:10,000) | Invitrogen | Cat #L7528 | |
| Commercial assay, kit | Mitochondrial aconitase activity kit | Sigma-Aldrich | Product #MAK051 | |
| Commercial assay, kit | ATP assay kit | Abcam | Product #ab83355 |
Additional files
Download links
A two-part list of links to download the article, or parts of the article, in various formats.
Downloads (link to download the article as PDF)
Open citations (links to open the citations from this article in various online reference manager services)
Cite this article (links to download the citations from this article in formats compatible with various reference manager tools)
Low doses of the organic insecticide spinosad trigger lysosomal defects, elevated ROS, lipid dysregulation, and neurodegeneration in flies
eLife 11:e73812.
https://doi.org/10.7554/eLife.73812


