Positive feedback regulation of frizzled-7 expression robustly shapes a steep Wnt gradient in Xenopus heart development, together with sFRP1 and heparan sulfate
- Department of Life Sciences, Graduate School of Arts and Sciences, The University of Tokyo, Japan
- Department of Biological Sciences, Graduate School of Science, The University of Tokyo, Japan
- Institute of Medical Sciences, The University of Aberdeen, United Kingdom
Figures
Figure 1 with 1 supplement
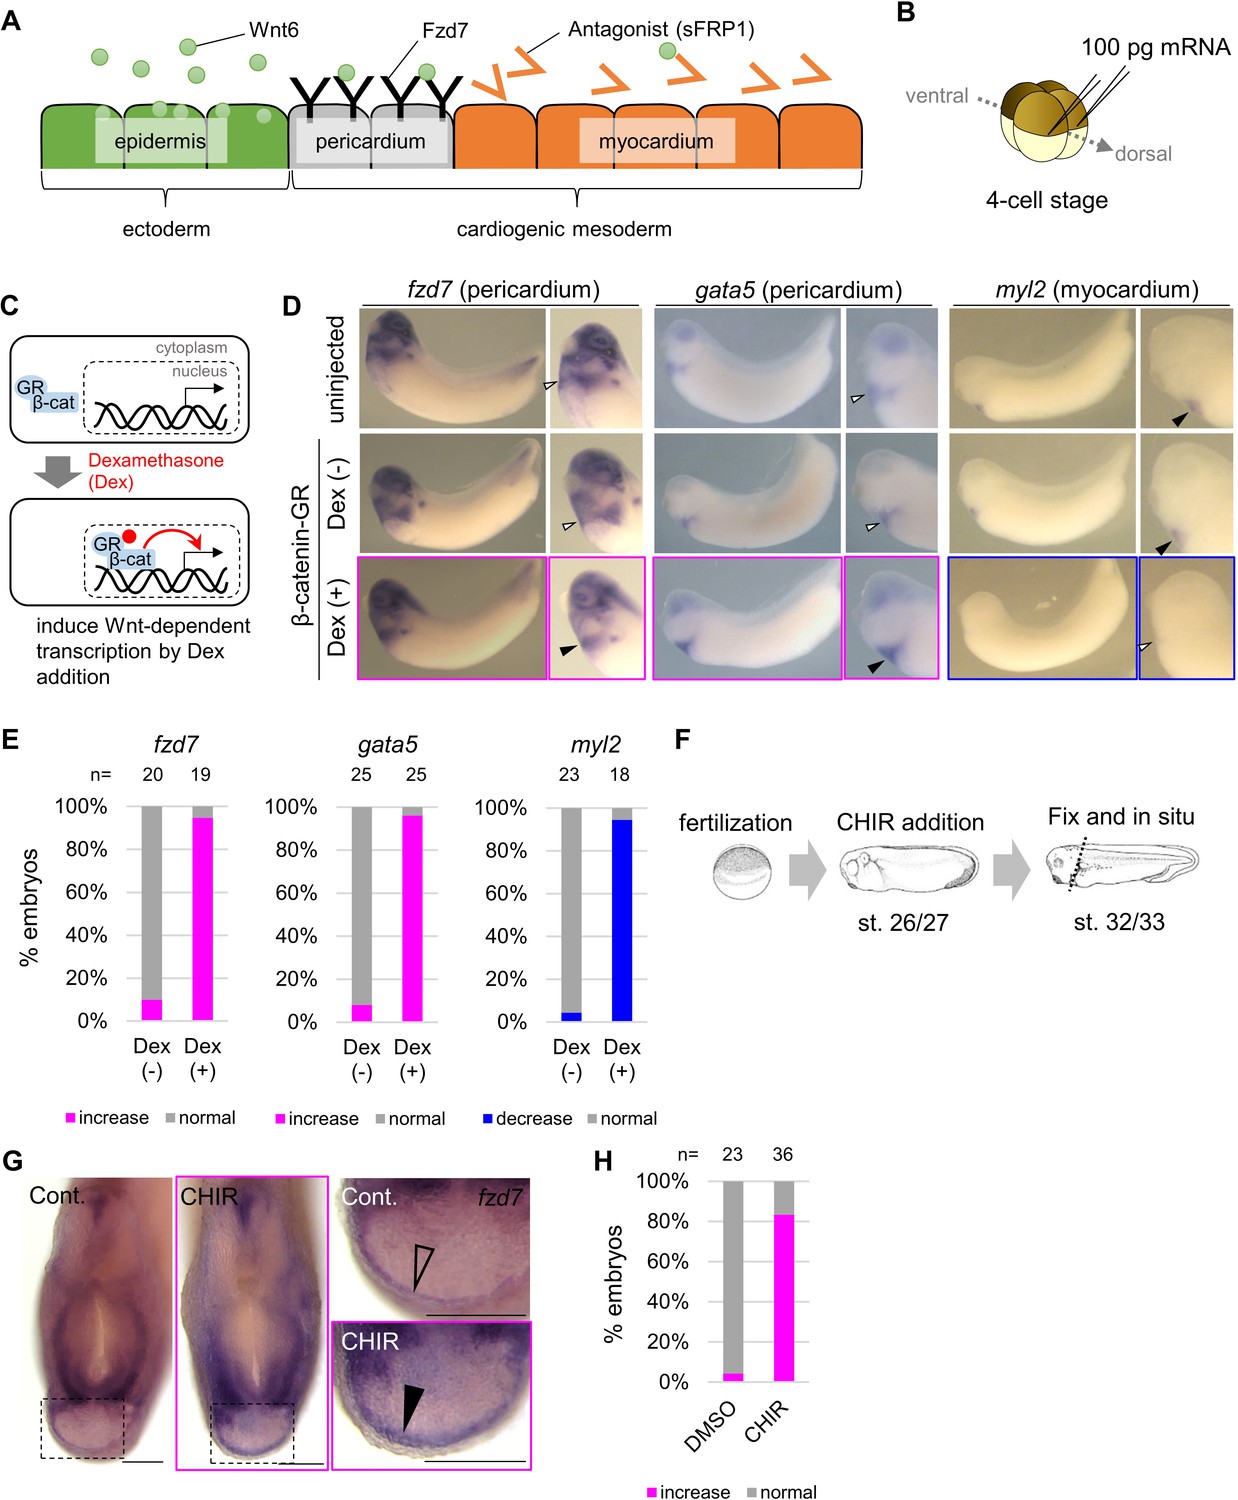
Wnt6/β-catenin signaling induces fzd7 expression during Xenopus heart development.
(A) Schematic figure showing distributions of Wnt6, Fzd7, and sFRP1 in heart development. Wnt6 is secreted from the epidermis (outside the embryo). Its antagonist, sFRP1, is secreted from prospective myocardium (inside the embryo). Expression of the Wnt receptor, Fzd7 becomes localized to the pericardium region as in Figure 1—figure supplement 1B. The pericardial cavity will subsequently form between the pericardium and the myocardium. (B–E) β-catenin activation increased fzd7 expression. mRNA encoding an inducible β-catenin protein (β-catenin fused with the hormone-binding domain of the human glucocorticoid receptor (GR)) was injected into two dorsal blastomeres at the four-cell stage (B). The GR-fused protein can be translocated into the nucleus with dexamethasone (Dex) and induces Wnt/β-catenin signal-dependent transcription (C). Dex addition (β-catenin activation) at the tailbud stage (st.22–23) resulted in an increase in fzd7 and gata5 expression and a decrease in myl2 expression (arrowhead, Dex (+)) (D) as quantified in E (Fisher’s exact test, p=5.8 x 10⁻⁸ (fzd7), 1.2 × 10⁻¹⁰ (gata5), 2.1 × 10⁻⁹ (myl2)). (F–H) Embryos were treated with a Wnt agonist, CHIR99021 (5 μM; control DMSO) from st. 26/27, just before the onset of Wnt6 expression, to st. 32/33 (F). The fzd7 expression area became broader with CHIR treatment (G, arrowhead), but not in DMSO controls (G, open arrowhead), as quantified in H. Scale bar = 200 μm.
Figure 1—figure supplement 1
Wnt-dependent fzd7 expression and differentiation of the pericardium.
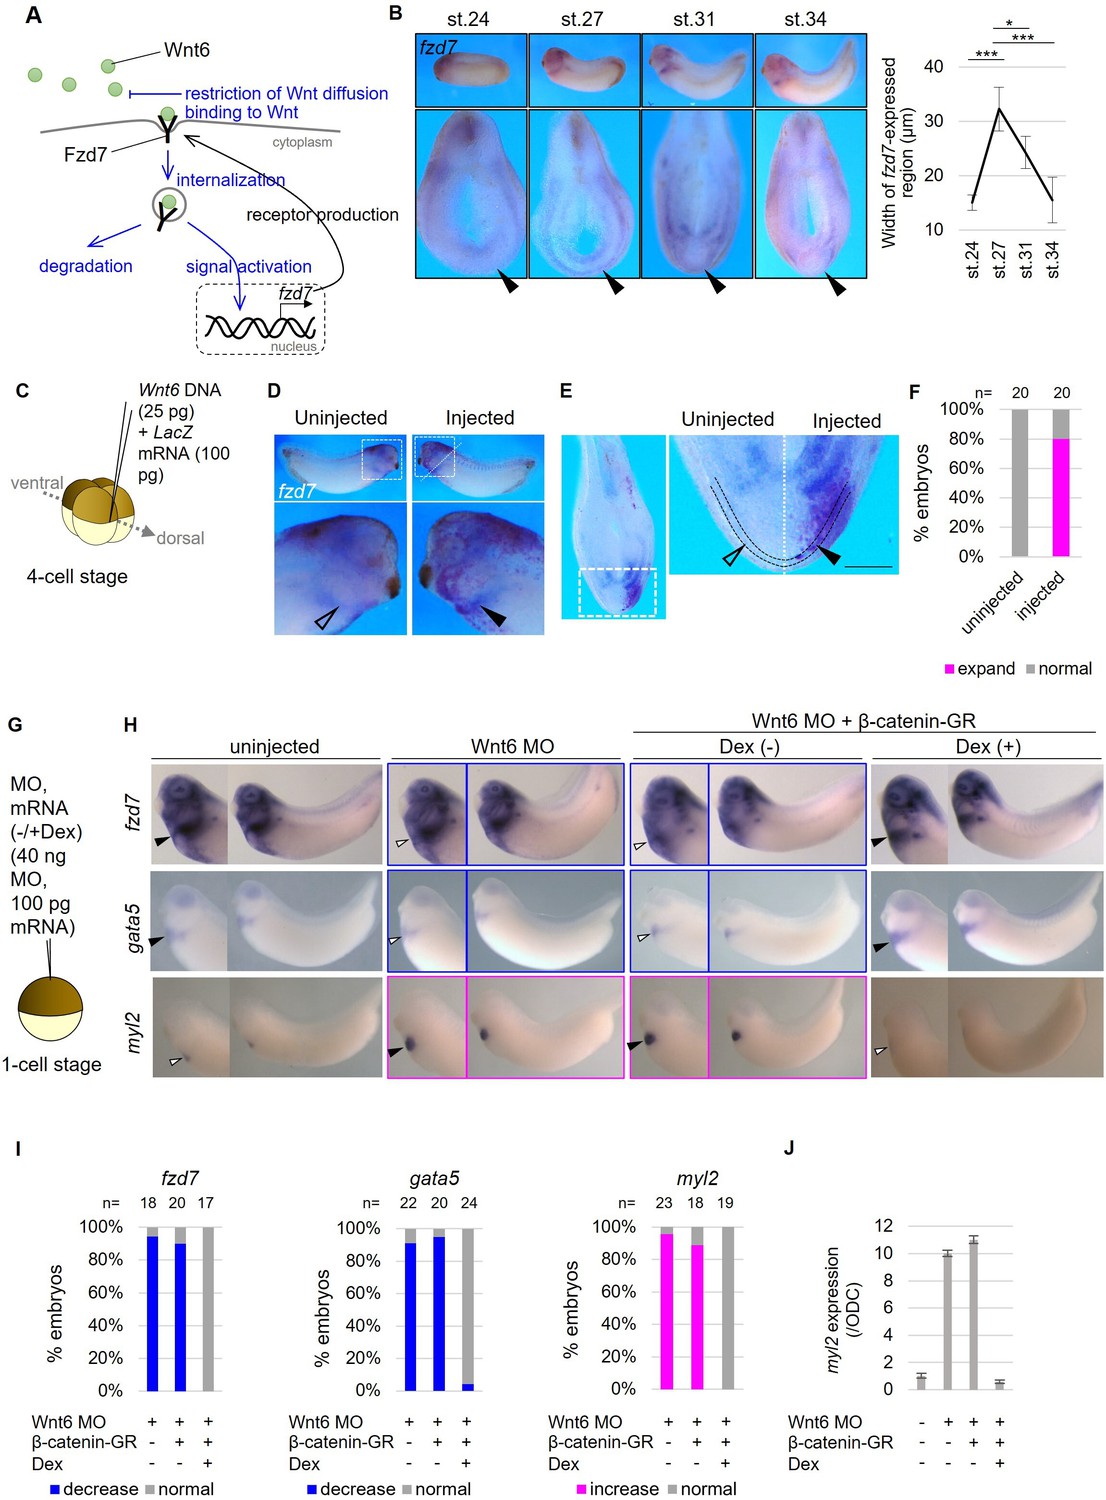
(A) Schematic figure of Fzd7 receptor functions. Fzd7 binds to Wnt6. This binding itself restricts Wnt diffusion. In addition, Wnt-Fzd complex is internalized, and it decreases the amount of Wnt6 in the intercellular matrix, leading to restriction of Wnt distribution. Furthermore, Fzd7 activates Wnt signaling, resulting in the transcription of fzd7, forming a positive feedback loop to enhance the above restriction effects of Wnt distribution. (B) fzd7 expression during embryogenesis in Xenopus. fzd7-expressed region in prospective pericardium region is indicated by arrowheads and the width was quantified as shown in the graph. The expression was faintly observed at st. 24 and increased and expanded to st. 27. The expression was gradually decreased from st. 27 to st. 34. *, *** indicates p<0.05, 0.001, respectively (p=1.9 x 10⁻⁹, 1.9 × 10⁻², 1.2 × 10⁻³, left to right in the graph; n=4 each). (C–F) Wnt6 DNA (25 pg) was injected into the marginal zone of one of dorsal blastomeres at the four-cell stage as indicated (C). LacZ mRNA was coinjected as a tracer in situ hybridization using fzd7 probe (D–E). The specimen was cut at the position of dashed line to make hemi-section (D). Around 80% of specimens showed expansion of fzd7 expression area in the injected side (arrowhead), which was not observed in the uninjected side (open arrowhead) (E, F; Fisher’s exact test, p=1.5 x 10⁻⁷). The pericardial region is the area between the dotted lines (E). Scale bar, 0.1 mm. (G–J) Wnt6 MO and β-catenin-GR mRNA were injected into the animal pole at the one-cell stage. β-catenin-GR was activated at the tailbud stage with Dex (the schematic view of β-catenin-GR/Dex function was shown in Figure 1C). (H–I) The pericardium region (fzd7/gata5-expressed region) was restricted by wnt6 knockdown as previously reported and it was rescued by β-catenin activation as quantified in I (Fisher’s exact test, p=9.4 x 10⁻³, 9.9 × 10⁻⁵, respectively). Myocardium region (myl2-expressed region) was expanded by Wnt inhibition as reported and it was rescued by β-catenin activation as quantified in I (Fisher’s exact test, p=2.5 x 10⁻⁴). This result was confirmed by qRT-PCR (J; normalized by an internal control, ODC (ornithine decarboxylase). Bars represent standard deviation). The picture of uninjected control of gata5 is the same for Figure 1D.
Figure 2 with 1 supplement
Wnt6 distribution is restricted by Fzd7.
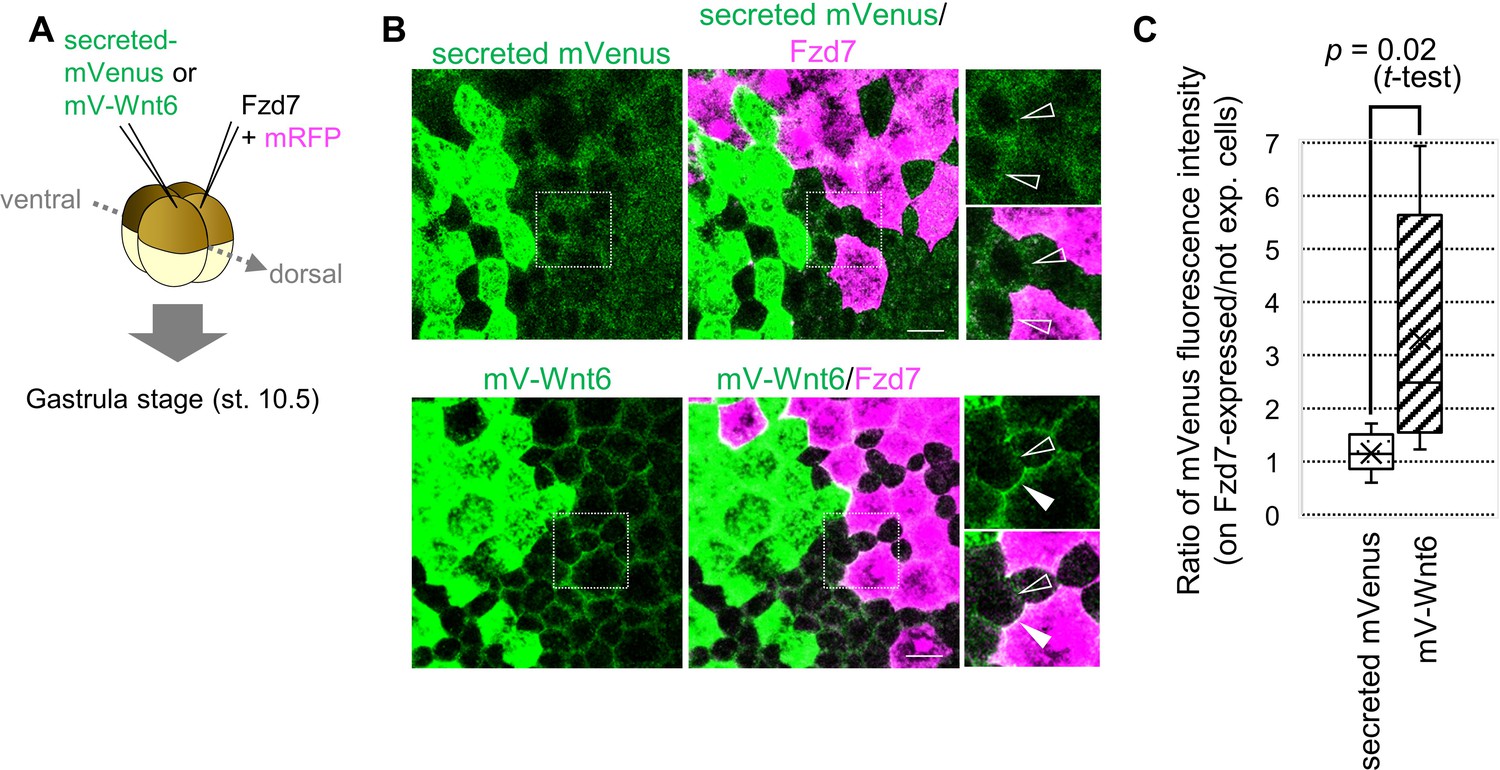
(A) Schematic view of the experiment. 500 pg of secreted mVenus (signal-peptide-fused mVenus) or mV-Wnt6 mRNA and Fzd7 mRNA (with mRFP) were injected into different blastomeres at the four-cell stage, and specimens were fixed at st.10.5 (gastrula stage). (B) mV-Wnt6 accumulated on Fzd7-expressing cells, whereas secreted mVenus did not (confocal image). mV-Wnt6 (green) accumulated on Fzd7-overexpressed cells (magenta cells; arrowhead), but not on intact cells (open-arrowhead). The distribution of secreted mVenus remained unchanged even when Fzd7 was overexpressed (open arrowheads). An enlarged view of the area indicated by squares on the left figure is shown on the right (the top, mVenus; the bottom, merged). Scale bar, 30 μm. (C) A box plot of the ratio of mVenus fluorescence intensity between neighboring cells (Fzd7-expressing cells / not Fzd7-overexpressed cells, n=7 pairs (secreted mVenus), 8 pairs (mV-Wnt6)). The horizontal line indicates the median. Edges of boxes indicate the first and third quartiles. The cross indicates the mean, and whiskers indicate the minimum and maximum.
Figure 2—figure supplement 1
Biological activity of mVenus-tagged Wnt6 and confirmation of the secretion of secreted mVenus.
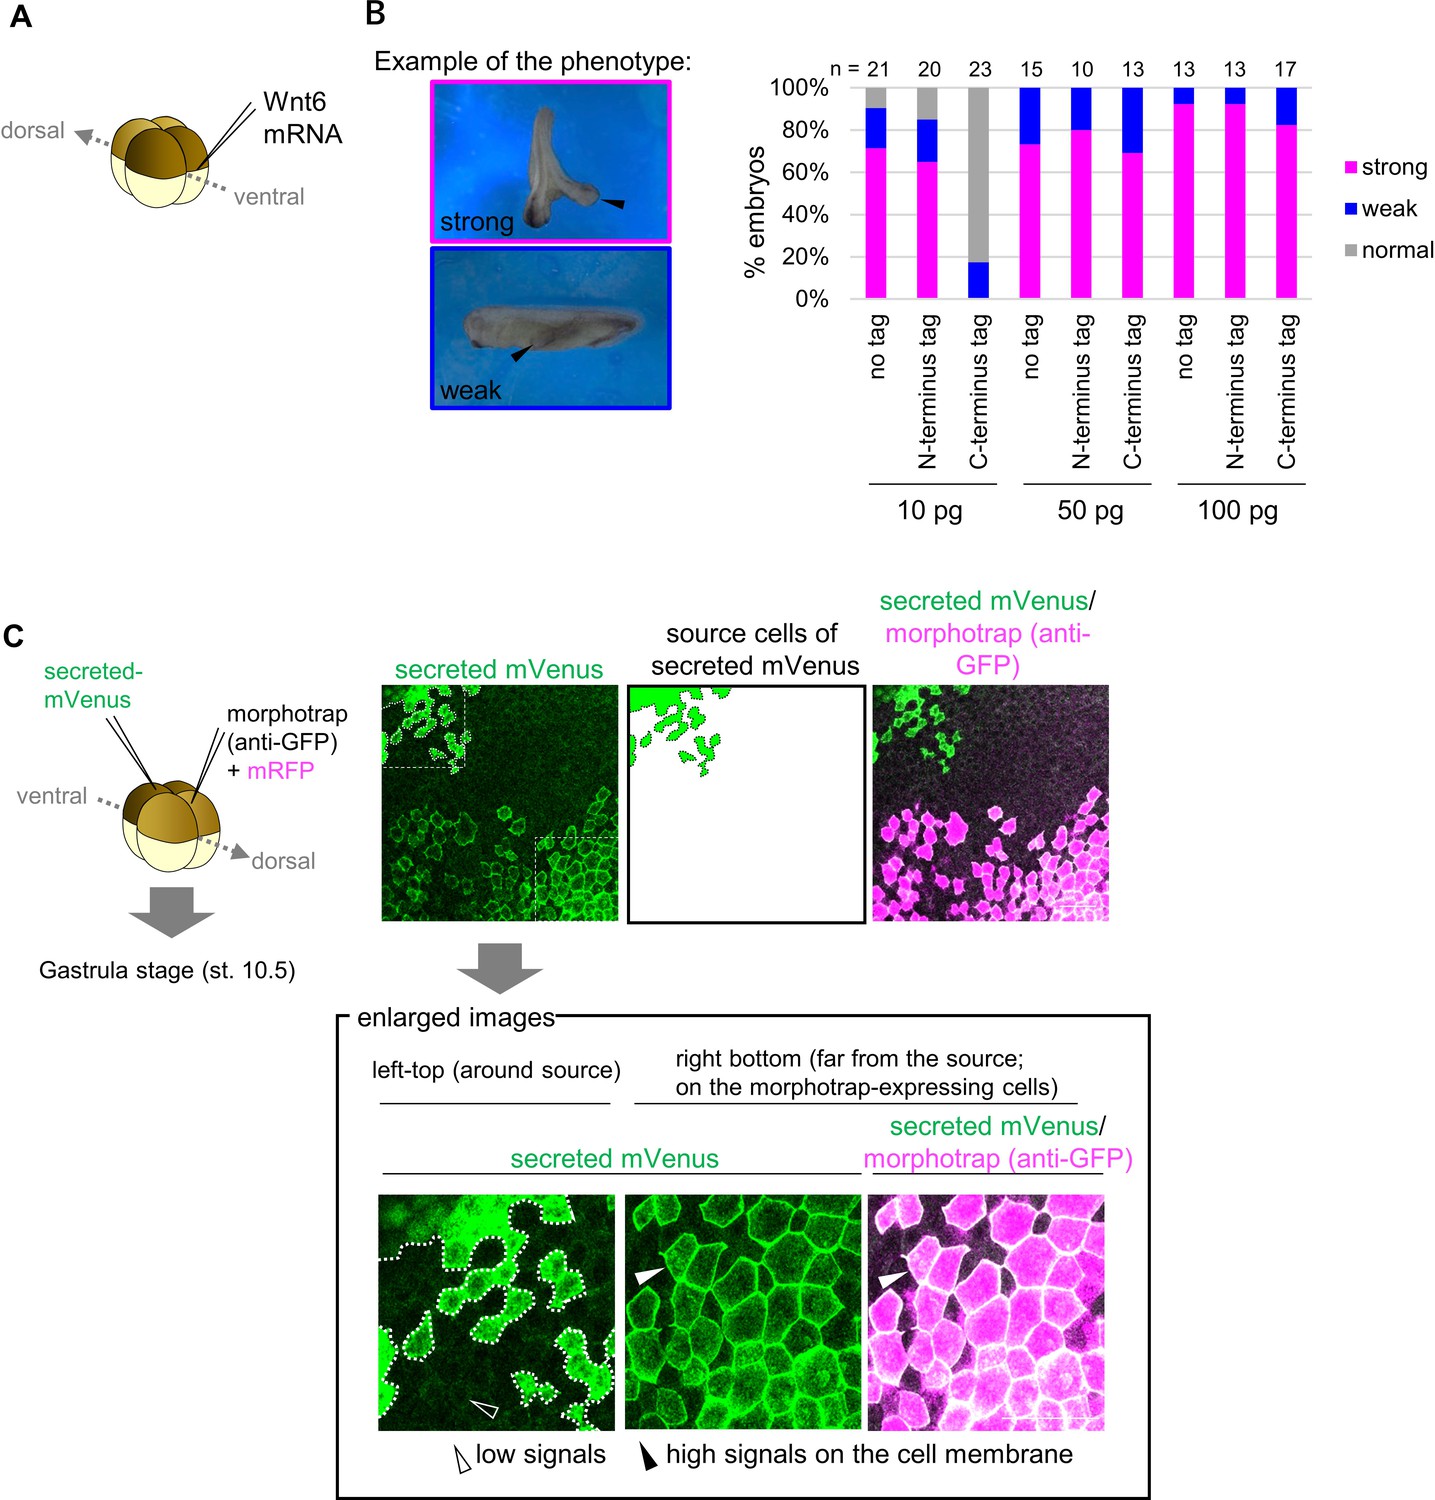
(A) Each mRNA was injected into the marginal region of a ventral blastomere at the four-cell stage and the specimens were counted at the tailbud stage. (B) The biological activity of mVenus-tagged Wnt6 indicated by secondary axis formation with different doses of the injected mRNA (the doses and the number of the specimen were indicated in the graph). The criteria of ‘strong’ or ‘weak’ is indicated in the left. N-terminus tagged Wnt6 showed higher activity as that of untagged Wnt6 (no tag), compared to that of C-terminus tagged one. (C) Schematic view of the experiment. 500 pg of secreted mVenus (signal-peptide-fused mVenus) and morphotrap (anti-GFP antibody) mRNA (with mRFP) were injected into different blastomeres at the four-cell stage, and the specimens were fixed at st.10.5 (gastrula stage). Fluorescence intensity of secreted mVenus was lower around the source cells but higher on the morphotrap-expressing cells (magenta colored cells; which expresses anti-GFP antibody on the cell membrane). Source cells of secreted mVenus are surrounded by dotted lines (the left panel) and illustrated in the middle panel. Enlarged views (where was indicated by squares (the left panel)) are on the bottom. Scale bar, 100 μm.
Figure 3 with 8 supplements
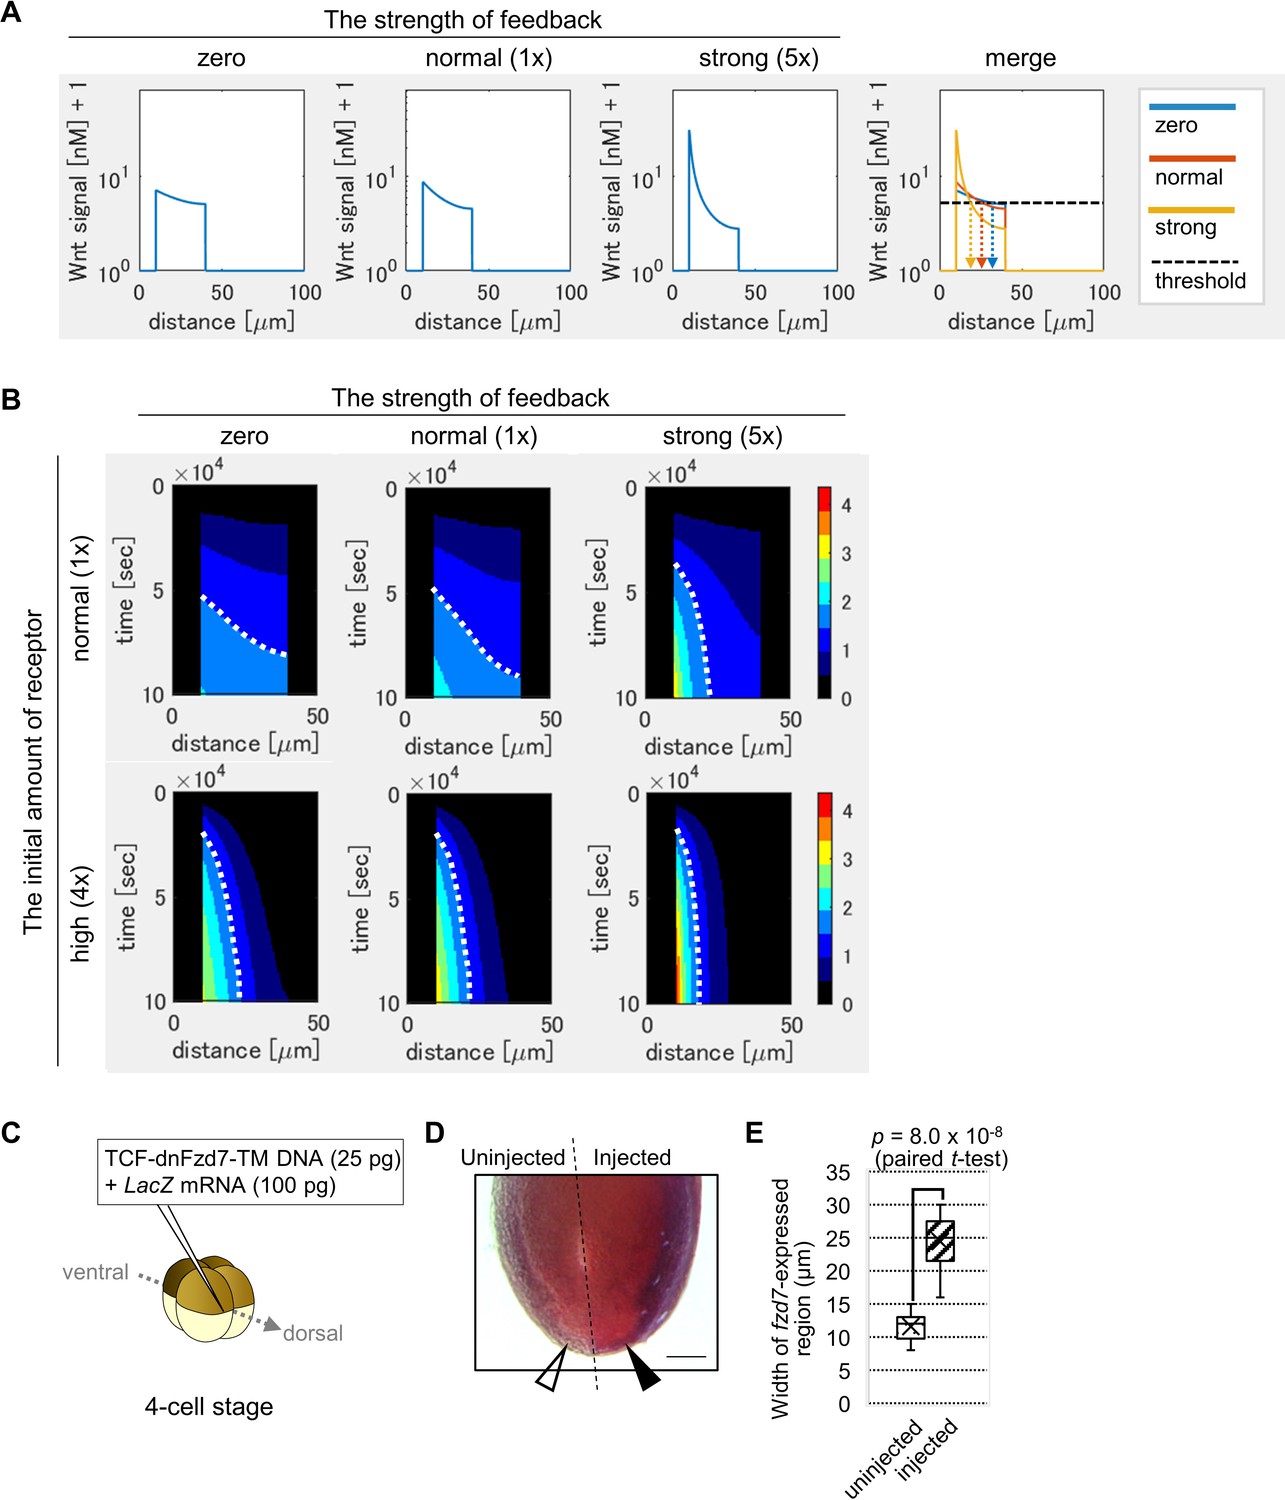
Feedback regulation of fzd7 expression restricts the Wnt signal active region.
(A) Wnt-dependent expression of fzd7 increased Wnt signal activity near the Wnt source and decreased Wnt signal activity far from the source, making a steep gradient. An example of the threshold of Wnt signal activity to determine the edge of Wnt-signal-active region is shown by a dashed line (merge). Arrows show the edge of the activated region in each condition. ‘strong’ means 5-times higher strength of feedback than ‘normal’. These figures correspond to a column in Figure 3—figure supplement 1B (‘the initial amount of receptor = normal‘). (B) Heatmap of Wnt signaling activity. The y-axis represents time elapsed from top to bottom (Figure 3—figure supplement 3 for the detail). The dotted line shows an example of temporal changes of the edge of the Wnt-signal-active region. The line became nearly vertical under strong feedback with a ‘normal’ initial amount of receptor, indicating that a system with strong feedback quickly reaches a steady state. In the presence of high initial expression (4-times higher than the ‘normal’), the slope of contour was nearly perpendicular, even without feedback. These figures correspond to a column in Figure 3—figure supplement 4A (‘the initial amount of receptor’ = ‘normal’ or ‘4 times’). (C) TCF-dnFzd7-TM plasmid (25 pg) was injected into the marginal region of a dorsal blastomere at the four-cell stage with a tracer, LacZ mRNA (100 pg). (D) In situ hybridization using a fzd7 intracellular domain probe. The probe recognizes the intracellular domain of fzd7, which the dominant negative fzd7 lacks. Thus, it visualizes endogenous expression of full-length fzd7 (pericardium region), or the Wnt signal active region. The fzd7 expression area, or Wnt signal active region, was expanded (arrowhead) by injection of TCF-dnFzd7-TM plasmids, as quantified in E. (E) A box plot of the width of fzd7-expressing region in the uninjected side (open arrowhead) and the injected side (arrowhead). The horizontal line indicates the median. Edges of boxes indicate the first and third quartiles. The cross indicates the mean, and whiskers indicate the minimum and maximum (n=14 each).
Figure 3—figure supplement 1
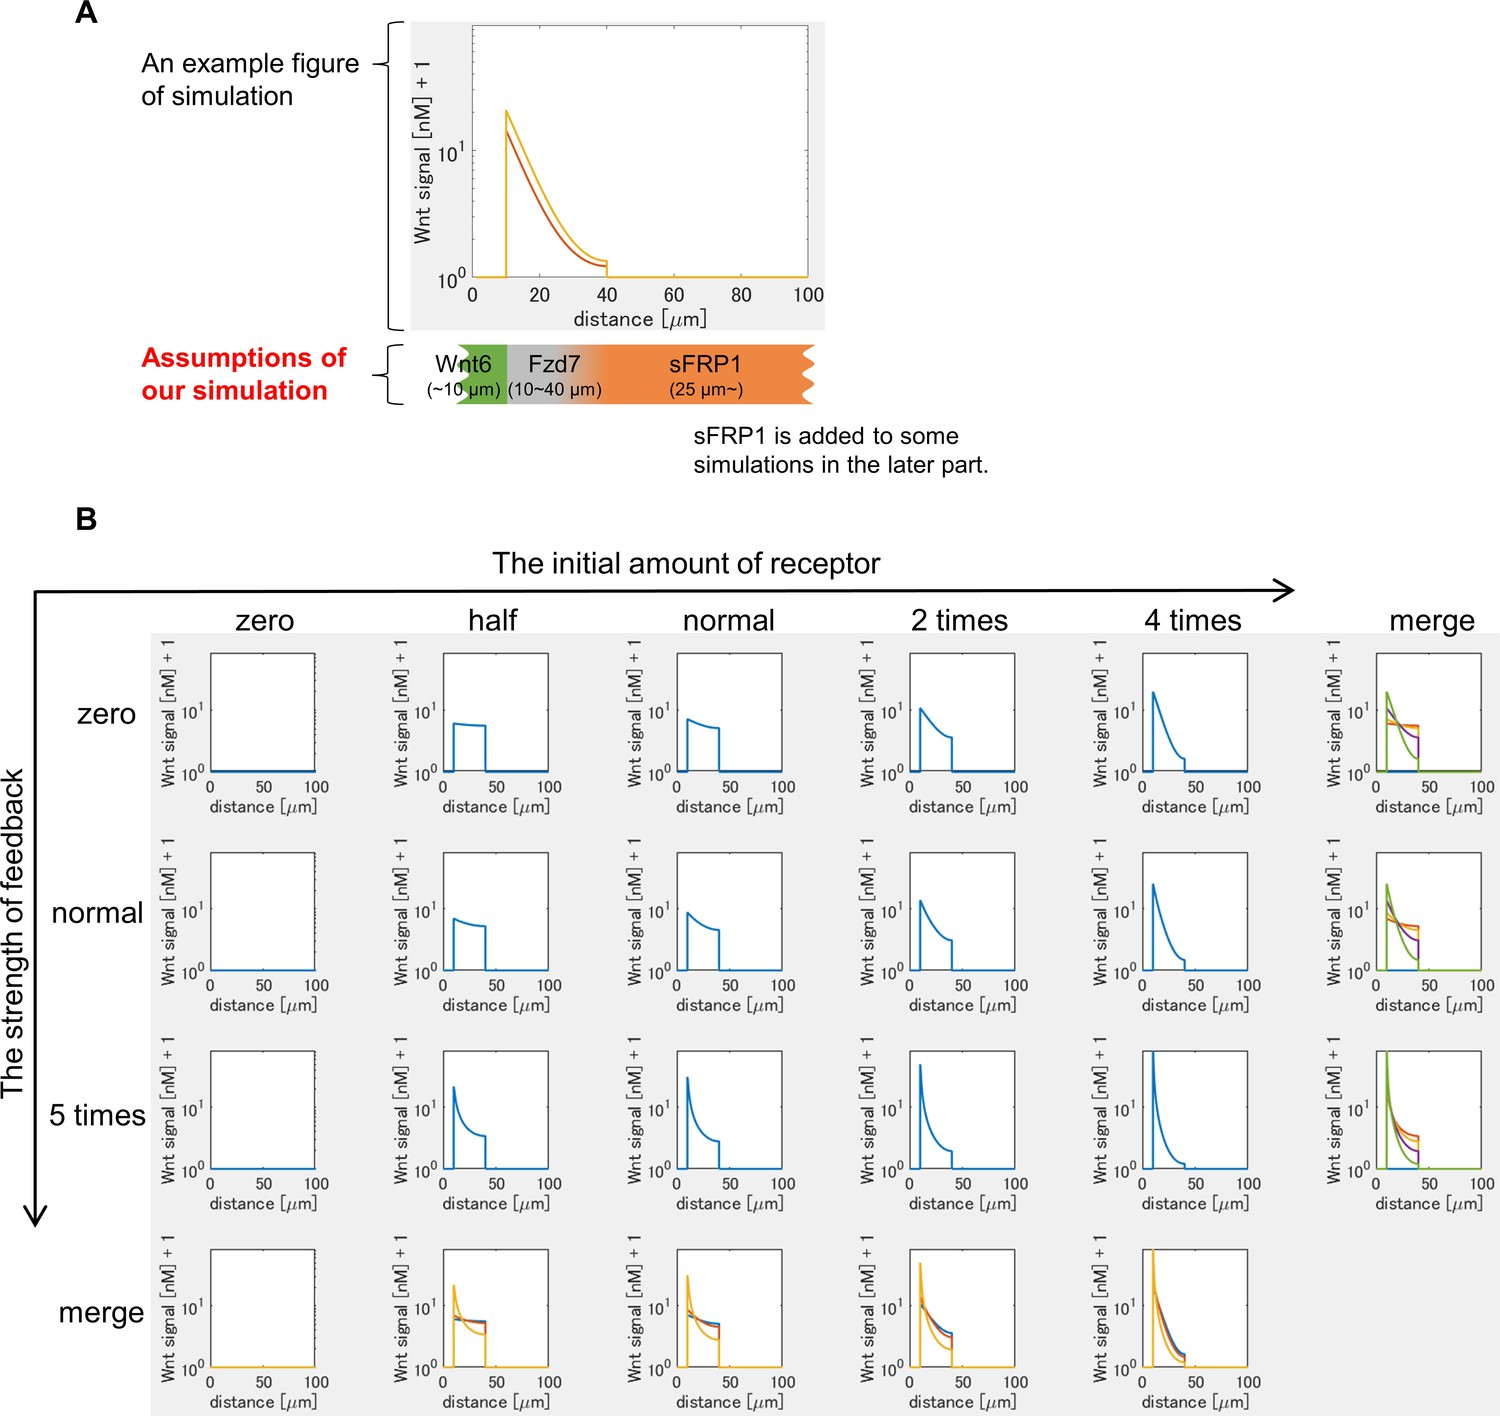
Mathematical modeling of Wnt signaling activity in the heart region.
(A) Design of mathematical modeling. An example of Wnt signaling activity is shown in the graph. We assumed that (i) Wnt6 is expressed from the left side (and sFRP1 from the right side), (ii) the initial expression of Fzd7 is set in the middle region (30 μm width (10~40 μm from the left end in the figure)) according to the observation of Xenopus embryos (Figure 1—figure supplement 1B), (iii) the distribution of N-acetyl HS is the same as that of Fzd7, (iv) sFRP1 is expressed at >25 μm as suggested by the expansion of sFRP1 expression in the myocardium region in the wnt6-knocked-down embryos (Lavery et al., 2008b). (B) Wnt signaling activity in various settings of the receptor amount was shown at t=tmax = 105 sec (~1 day after the onset of the simulation). The Wnt-independent initial amount of receptor increases toward the right, and the strength of feedback (the receptor amount is Wnt-dependent) increases toward the bottom. In the merged figure, each line from different settings was displayed with different colors.
Figure 3—figure supplement 2
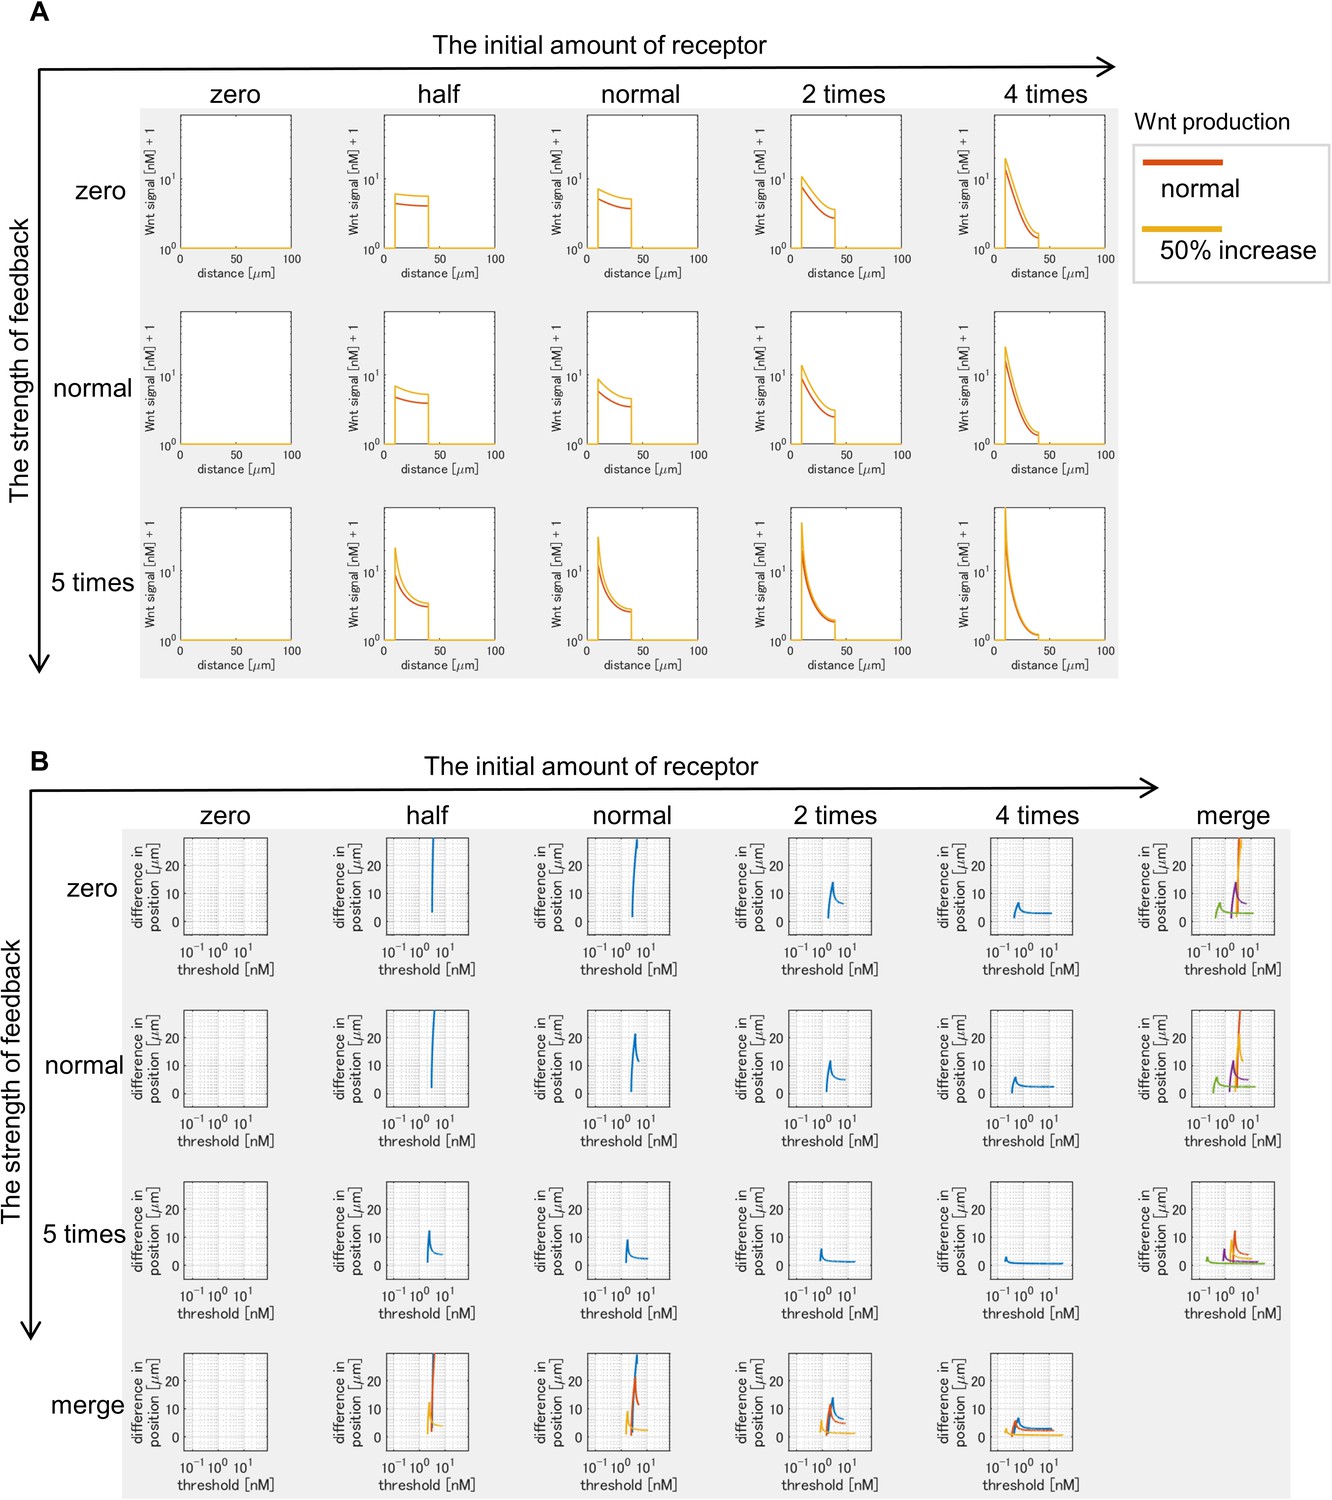
Changes in Wnt signaling activity due to varying Wnt production.
(A) Two lines in each graph shows Wnt signaling activity with a different Wnt production rate (normal and 50% increase) at t=tmax = 105 sec (~1 day after the onset of the simulation). (B) The vertical axis in each graph shows the difference of positions of the edges of Wnt-signal-active regions when Wnt production rate is changed (normal to 50% increase). The horizontal axis indicates threshold values of Wnt signal activation.
Figure 3—figure supplement 3
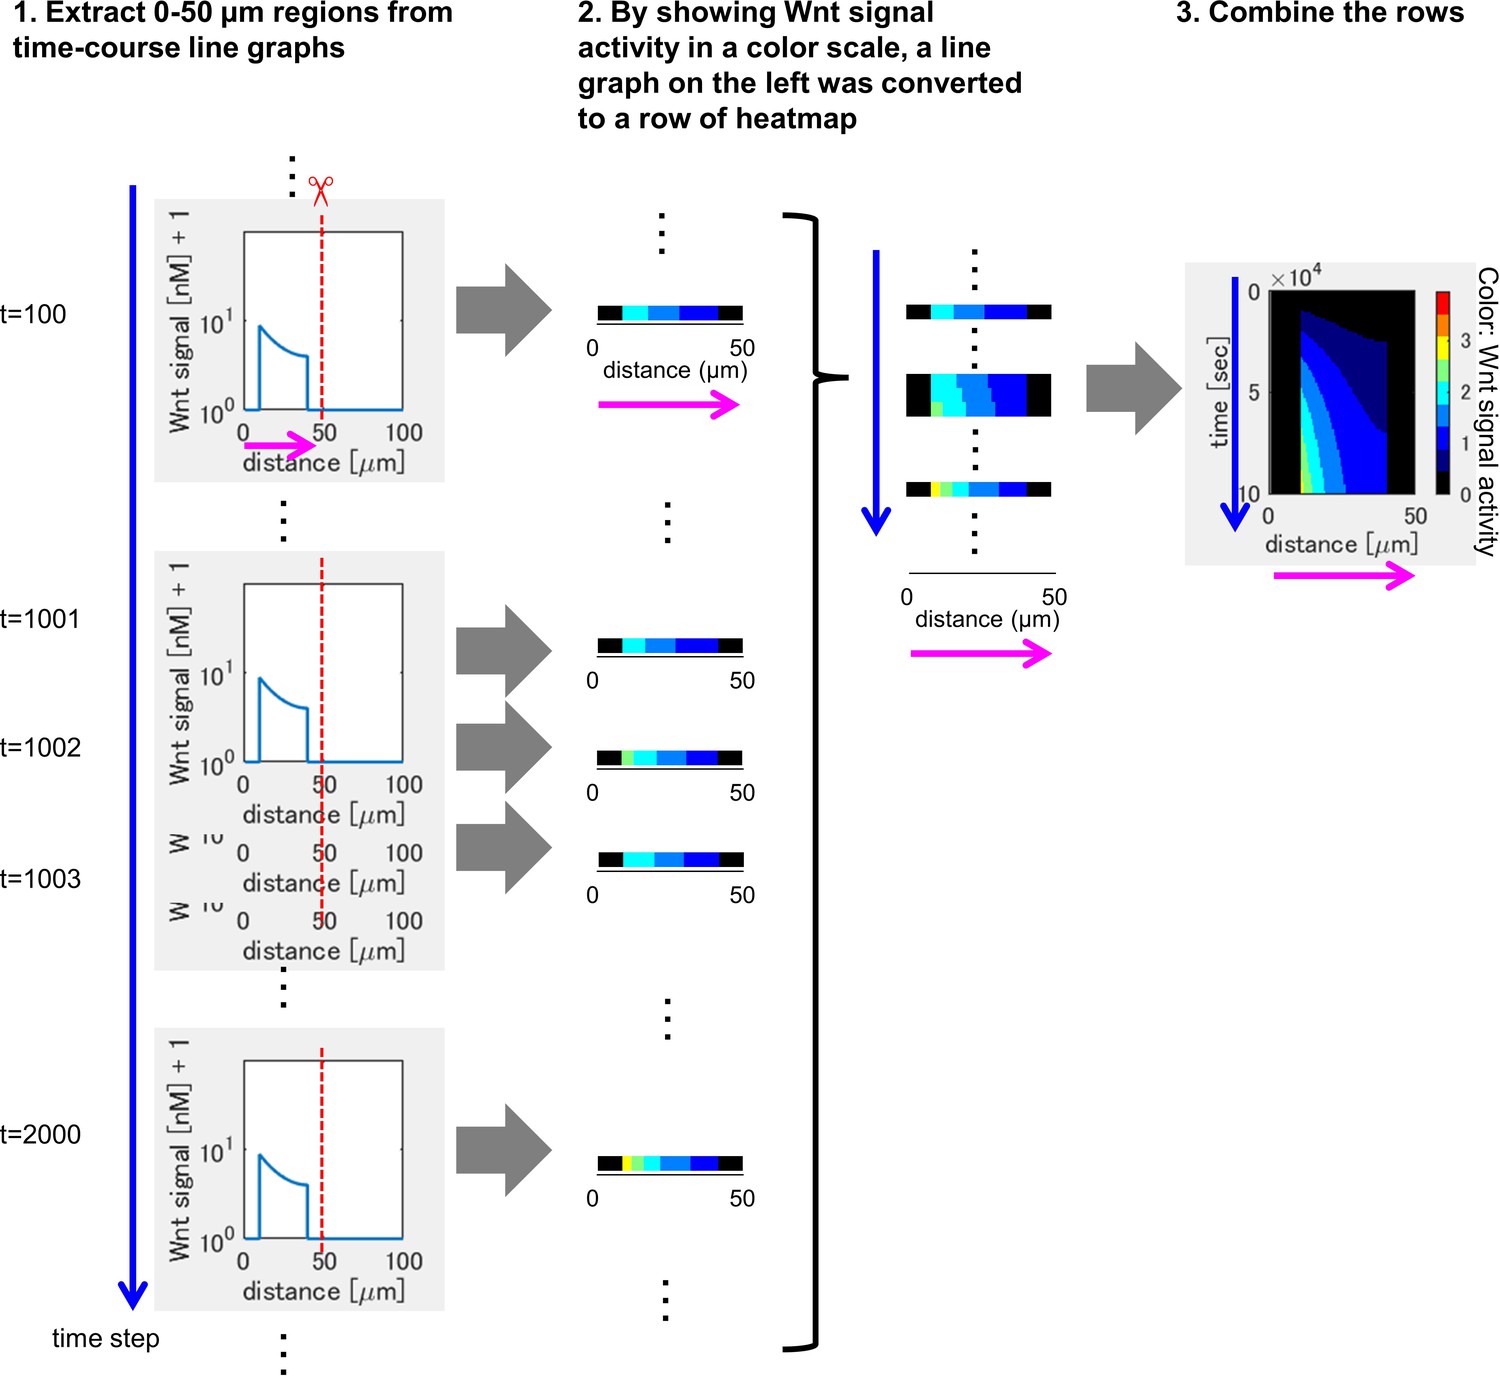
Method of heatmap drawing.
(1) We extracted 0-50 μm regions from the line chart at each time point (time proceeds from upper to bottom). (2) By showing Wnt signaling activity in a color scale, a line chart on the left was converted to a row of heatmap. (3) By combining the rows in (2), heatmap was drawn.
Figure 3—figure supplement 4
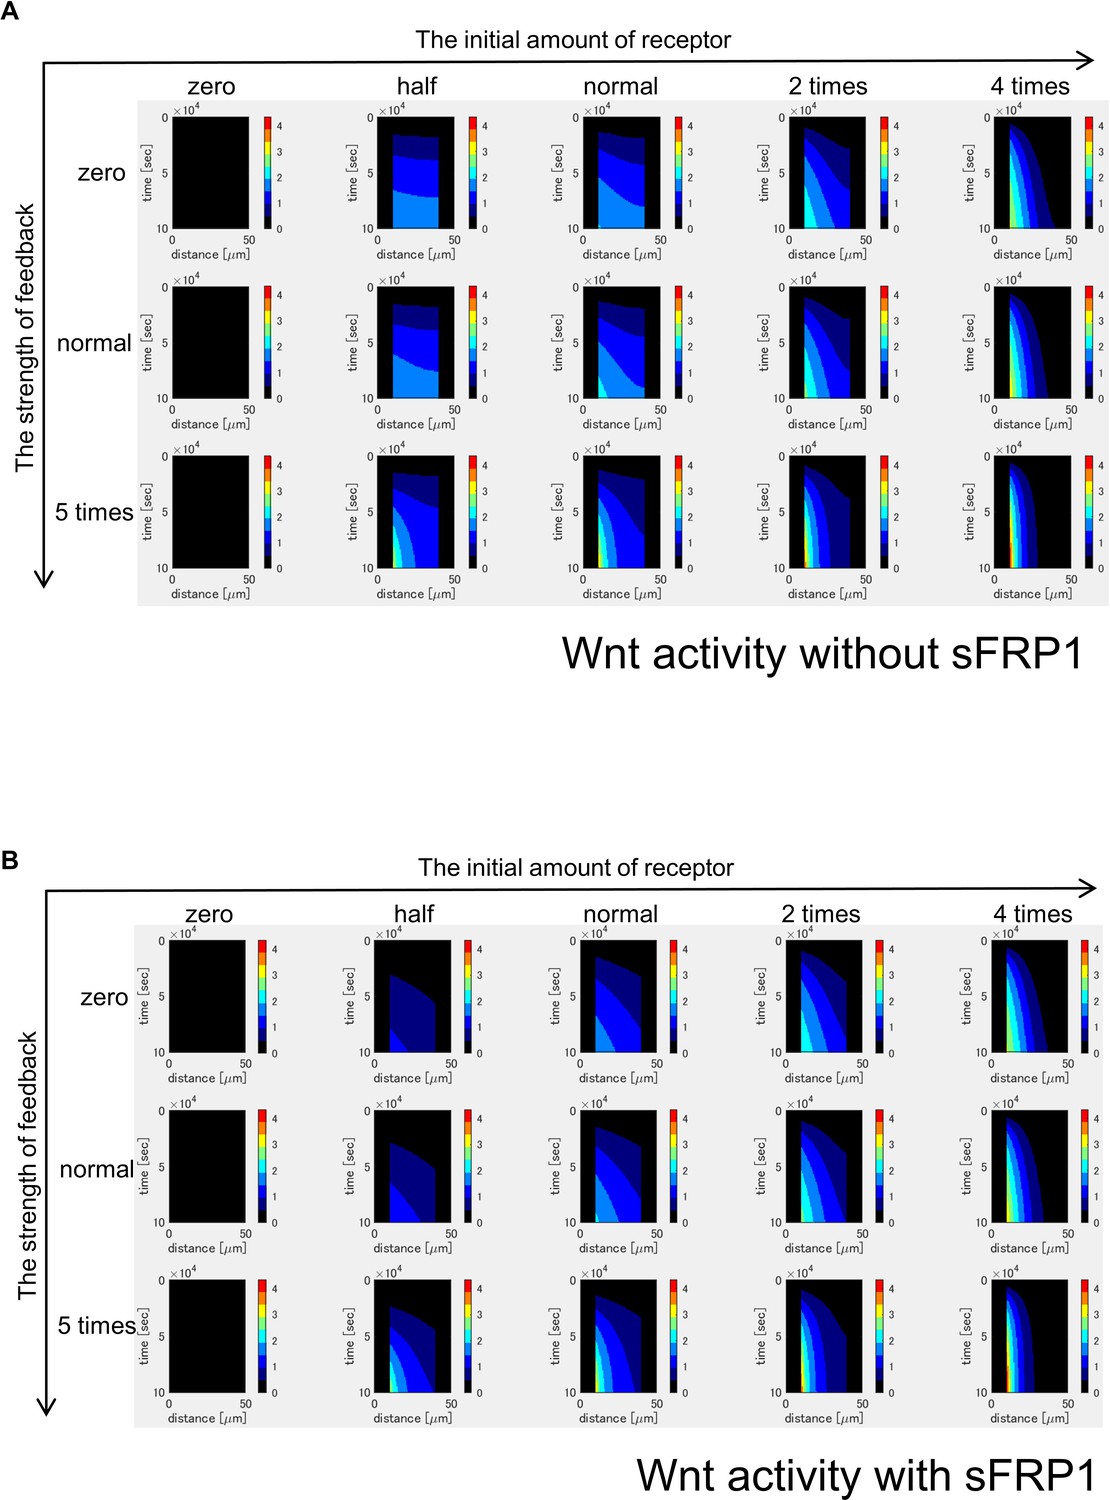
Time changes of Wnt signaling activity without sFRP1 (A) or with sFRP1 (B).
Wnt signaling activity is decreased by sFRP1 expression. The steady state is reached earlier with sFRP1 than without sFRP1. Changes of Wnt signal activity shows patterns similar to those of the amount of free receptor (Figure 3—figure supplement 6).
Figure 3—figure supplement 5
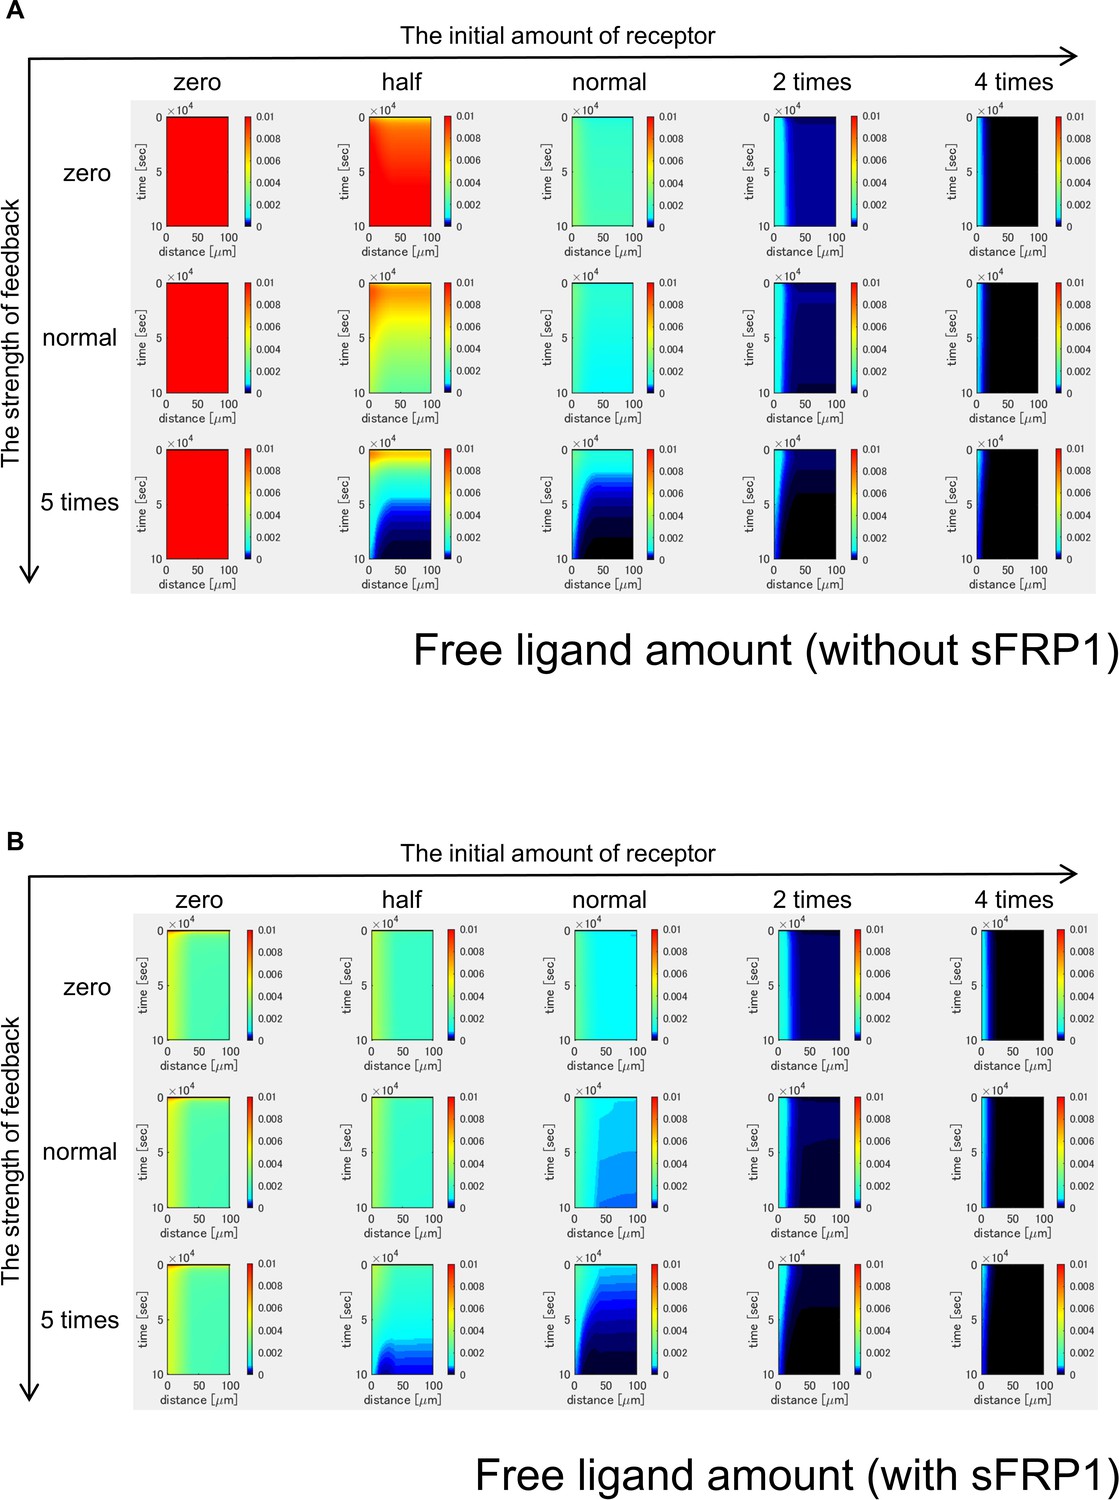
Time changes of free ligand amount without sFRP1 (A) or with sFRP1 (B).
The amount of free ligand was higher with low initial amount of receptor and no feedback. However, with the feedback, the amount was gradually reduced.
Figure 3—figure supplement 6
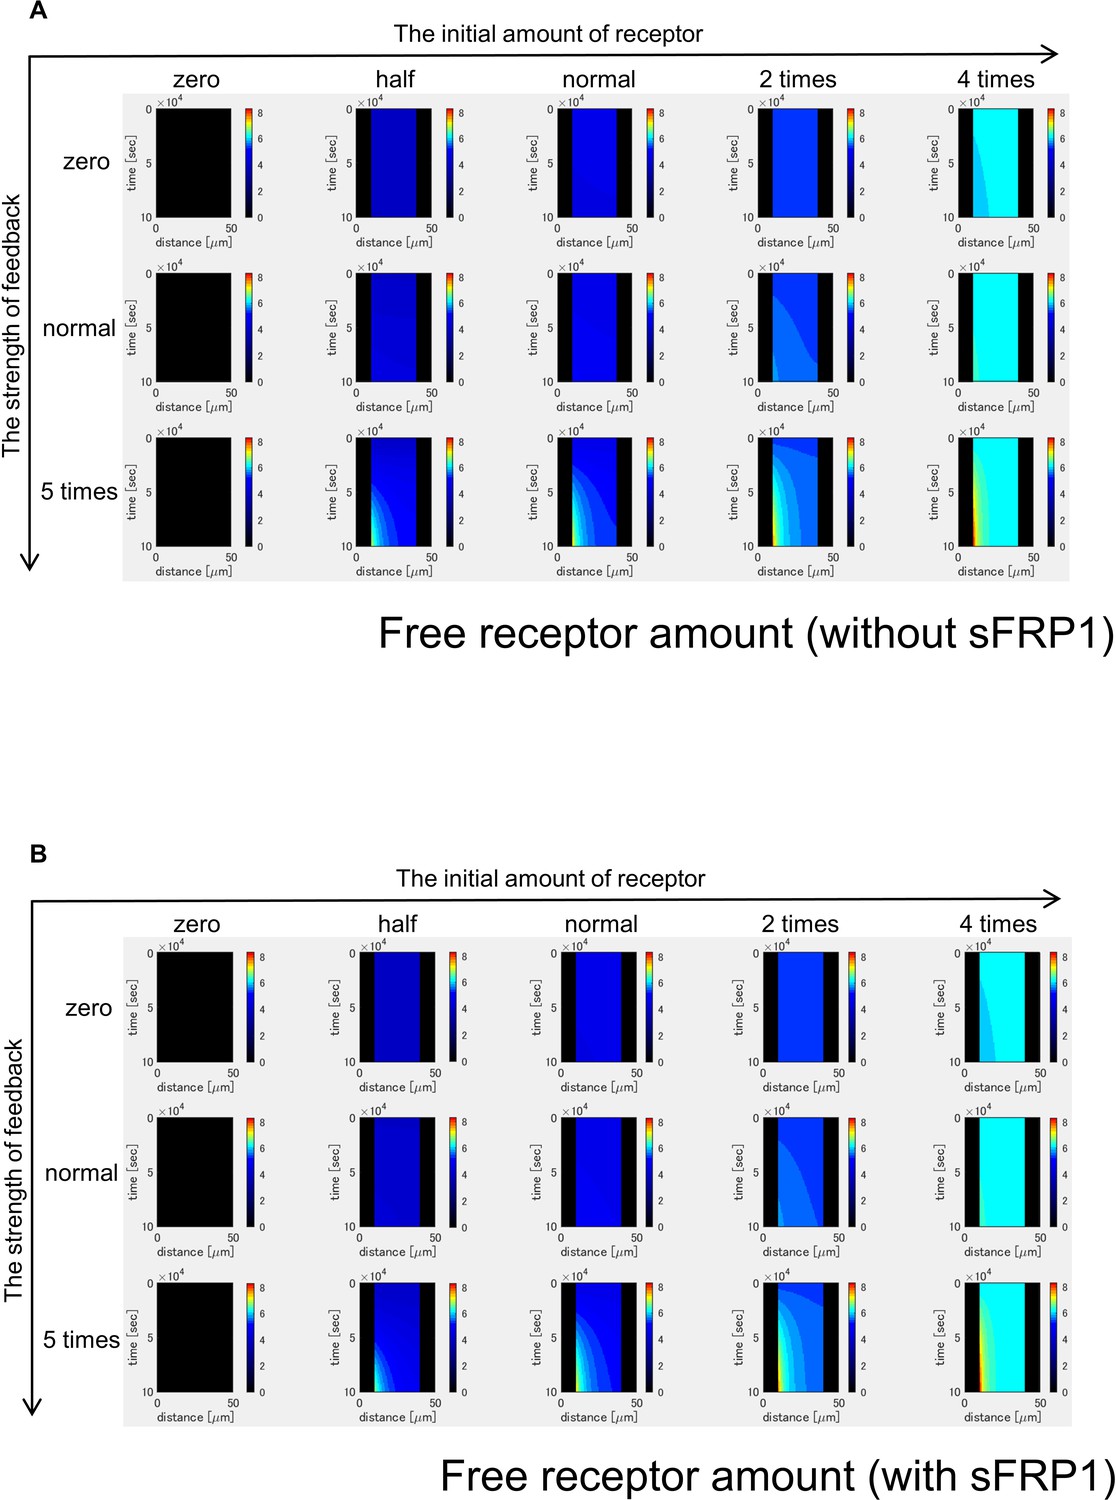
Time changes of free receptor amount without sFRP1 (A) or with sFRP1 (B).
Changes of the amount of free receptor shows patterns similar to those of Wnt signal activity (Figure 3—figure supplement 4).
Figure 3—figure supplement 7
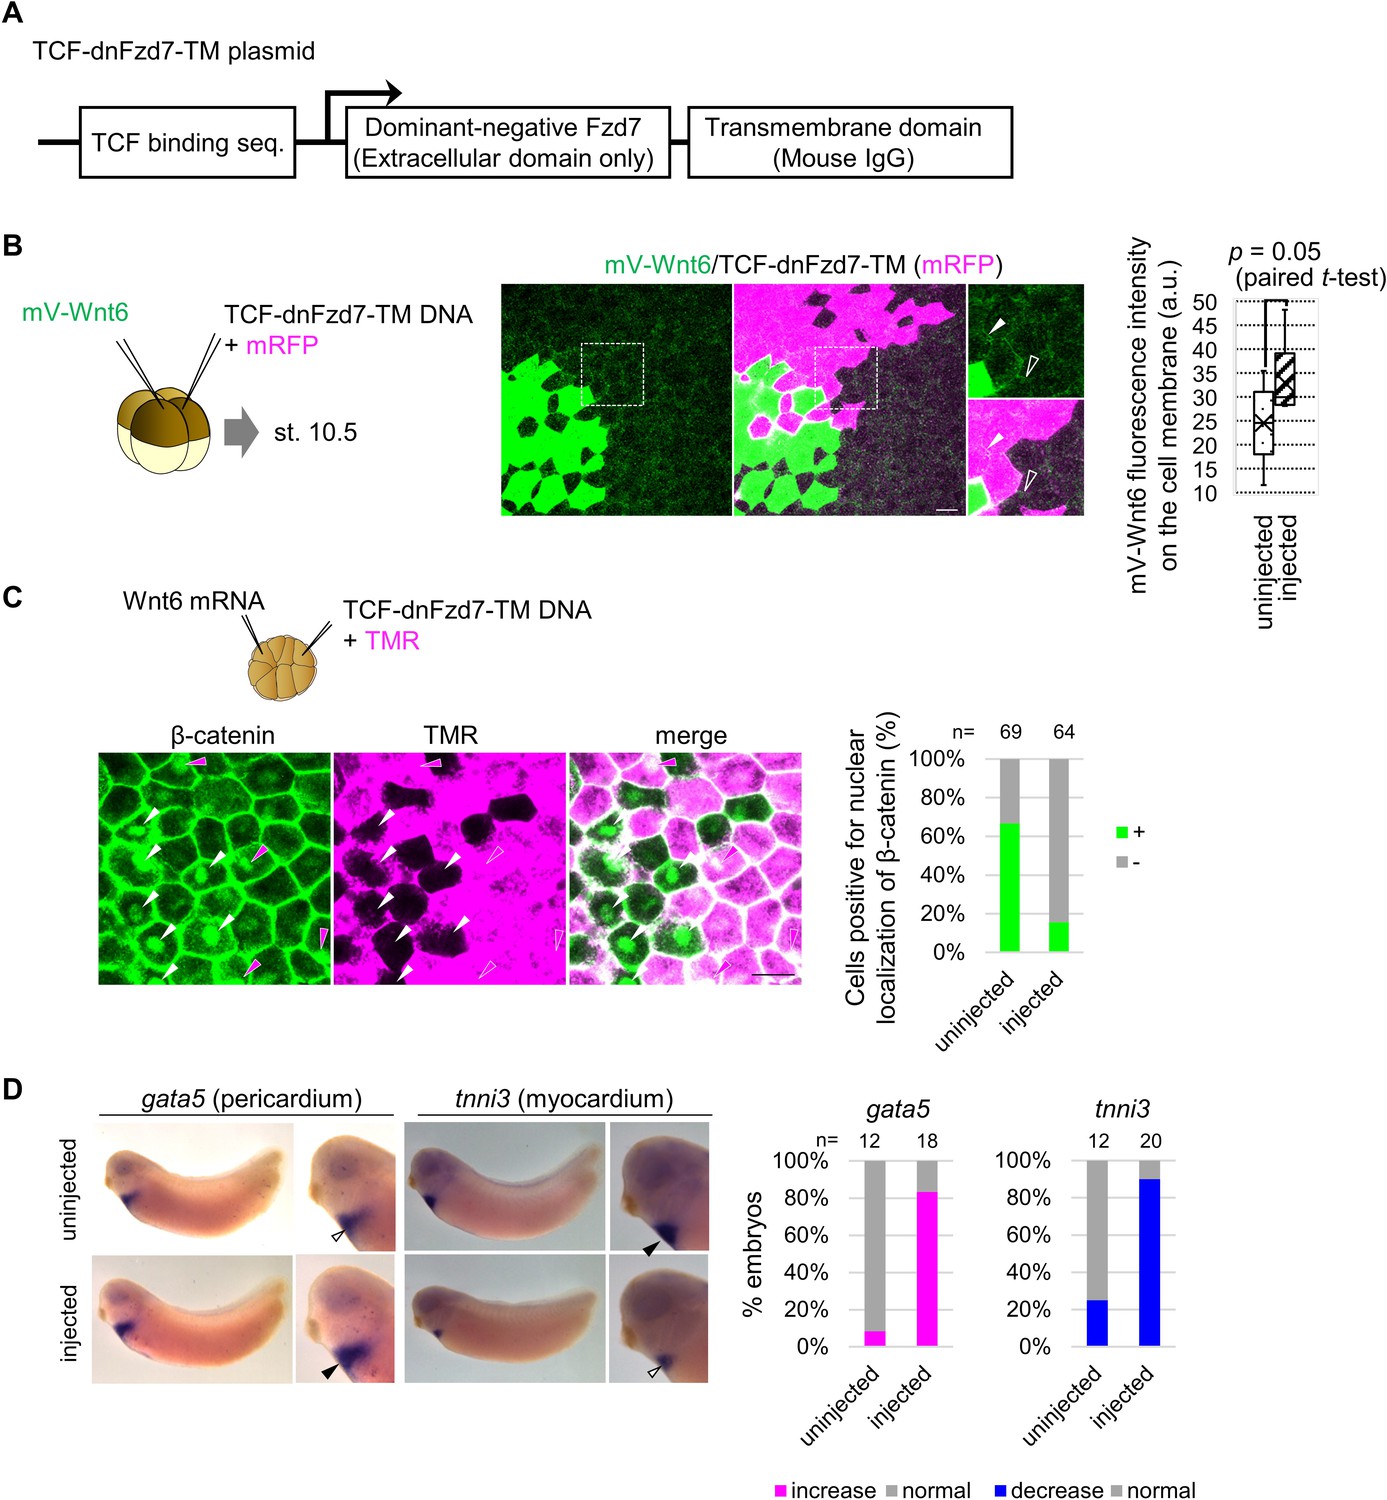
TCF-dnFzd7-TM accumulates Wnt6 protein but cell-autonomously inhibits Wnt signaling.
(A) Schematic figure of the construct (TCF-dnFzd7-TM) inhibiting Fzd7 function in a Wnt-dependent manner. Luciferase sequence in TOPFlash plasmid was replaced with the sequence of dnFzd7, which is the extracellular domain of Fzd7, and mouse IgG transmembrane. (B) mV-Wnt6 mRNA and TCF-dnFzd7-TM plasmid (with mRFP mRNA) were injected into different blastomeres at the four-cell stage (as indicated in the left). mV-Wnt6 signal was high (arrowhead) on the cell membrane between cells with TCF-dnFzd7-TM plasmid injected (magenta), compared to that between intact cells (open arrowhead) as quantified in the graph. mVenus fluorescence intensity on the cell membrane was discretely measured on mRFP-positive cells (injected) and mRFP-negative cells (uninjected). Fluorescence intensities measured on neighboring cells were tested by paired t-test (n=5). The horizontal line indicates the median. Edges of boxes indicate the first and third quartiles. The cross indicates the mean, and whiskers indicate the minimum and maximum. These results indicate dnFzd7-TM can accumulate Wnt6 in a cell-autonomous manner. (C) Wnt6 mRNA and TCF-dnFzd7-TM plasmid (with a tracer, tetramethylrhodamine-dextran (TMR)) were injected into different blastomeres at the 16-cell stage. The hallmark of activated Wnt signaling, nuclear localization of β-catenin was reduced in the TCF-dnFzd7-TM injected cells magenta region, compared to the intact cells (non-magenta region) as quantified in the graph (Fisher’s exact test, p=2.7 x 10⁻⁹). Nuclear localizations of β-catenin are indicated by arrowheads (intact cells, white; dnFzd7-expressed cells, magenta). It should be noted that DNA injection generally induces mosaic expression, thus only some of the injected cells express dnFzd7-TM. (E) Injection of TCF-dnFzd7-TM induced gata5 expression (pericardium) and reduced tnni3 expression (myocardium) as quantified in the graph (Fisher’s exact test, p=1.4 x 10⁻⁵, 2.3 × 10⁻⁶, respectively). TCF-dnFzd7-TM was injected into two blastomere (prospective heart region) at the four-cell stage and fixed at st. 32.
Figure 3—figure supplement 8
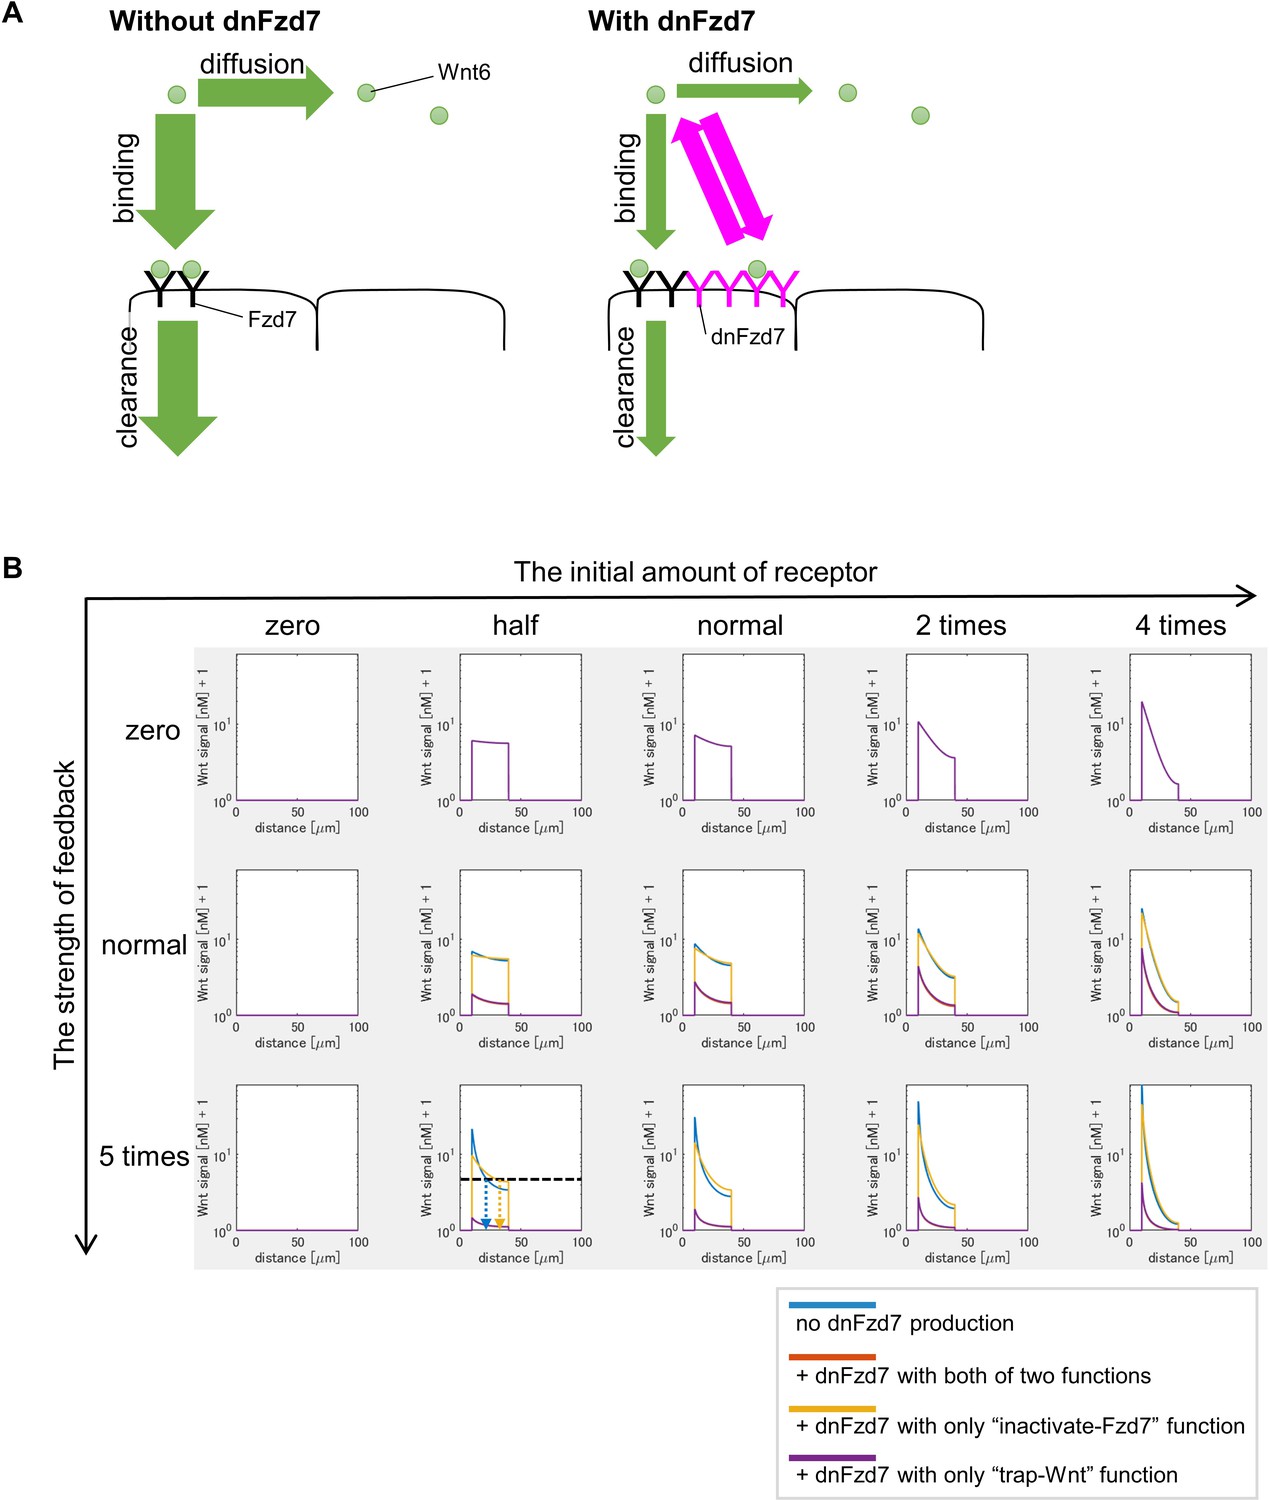
dnFzd7 with only ‘trap-Wnt’ function does not expand Wnt-signal-active region but dnFzd7 with only ‘inactivate-Fzd7’ function does.
(A) Schematic figure shows that ‘trapper’ prevents Wnt from diffusing and being degraded at the same time. Circle represents Wnt6. ‘Y’ represents receptors (black, Fzd7; magenta, ‘trapper’ (dnFzd7 with only ‘trap-Wnt’ function)). Arrows represent events (Wnt binding to the receptor, Wnt clearance, Wnt diffusion). Magenta arrows represents the rate of Wnt binding to the trapper or Wnt dissociation from the ‘trapper’. The width of the arrows indicates the rate of these events. Without the ‘trapper’ (left panel), Wnt binds to Fzd7 or diffuses. The ‘trapper’ (right panel) binds to Wnt, and consequently inhibits Wnt clearance and diffusion at the same time. Thus, dnFzd7 that only has ‘trap-Wnt’ function does not promote Wnt diffusion. (B) dnFzd7 with only ‘trap-Wnt’ function greatly reduced Wnt signaling level but dnFzd7 with only ‘inactivate-Fzd7’ function expanded the signaling range. Wnt signaling activity was shown at t=tmax = 105 s (~1 day after the onset of the simulation). The initial amount of receptor increases toward the right, and the strength of feedback increases toward the bottom. Each colored line indicates Wnt signal activity with/without dnFzd7 of various types (blue, no dnFzd7 production; orange,+dnFzd7 with both of two functions; yellow,+dnFzd7 with only ‘inactivate-Fzd7’ function; purple,+dnFzd7 with only ‘trap-Wnt’ function). However, when ‘the strength of feedback’ is zero, dnFzd7 is not expressed. Thus, all lines with/without dnFzd7 showed the same results in the top panels. When ‘the strength of feedback’ was greater than zero (especially when ‘the initial amount of receptor’ was smaller), dnFzd7 with only ‘inactivate-Fzd7’ expanded the Wnt signal active region. In the panel of ‘the initial amount of receptor = half’ and ‘the strength of feedback = 5 times’, we showed an example of threshold of Wnt signal activity to determine the edge of Wnt-signal-active region (shown by a dashed line), and the arrows show the edge of the activated region in each condition. dnFzd7 with both of the two functions does not expand the Wnt signal active region, indicating that dnFzd7 in wet experiment should have lower Wnt affinity than Fzd7.
Figure 4 with 2 supplements

Contributions of sFRP1 and heparan sulfate in Xenopus heart development.
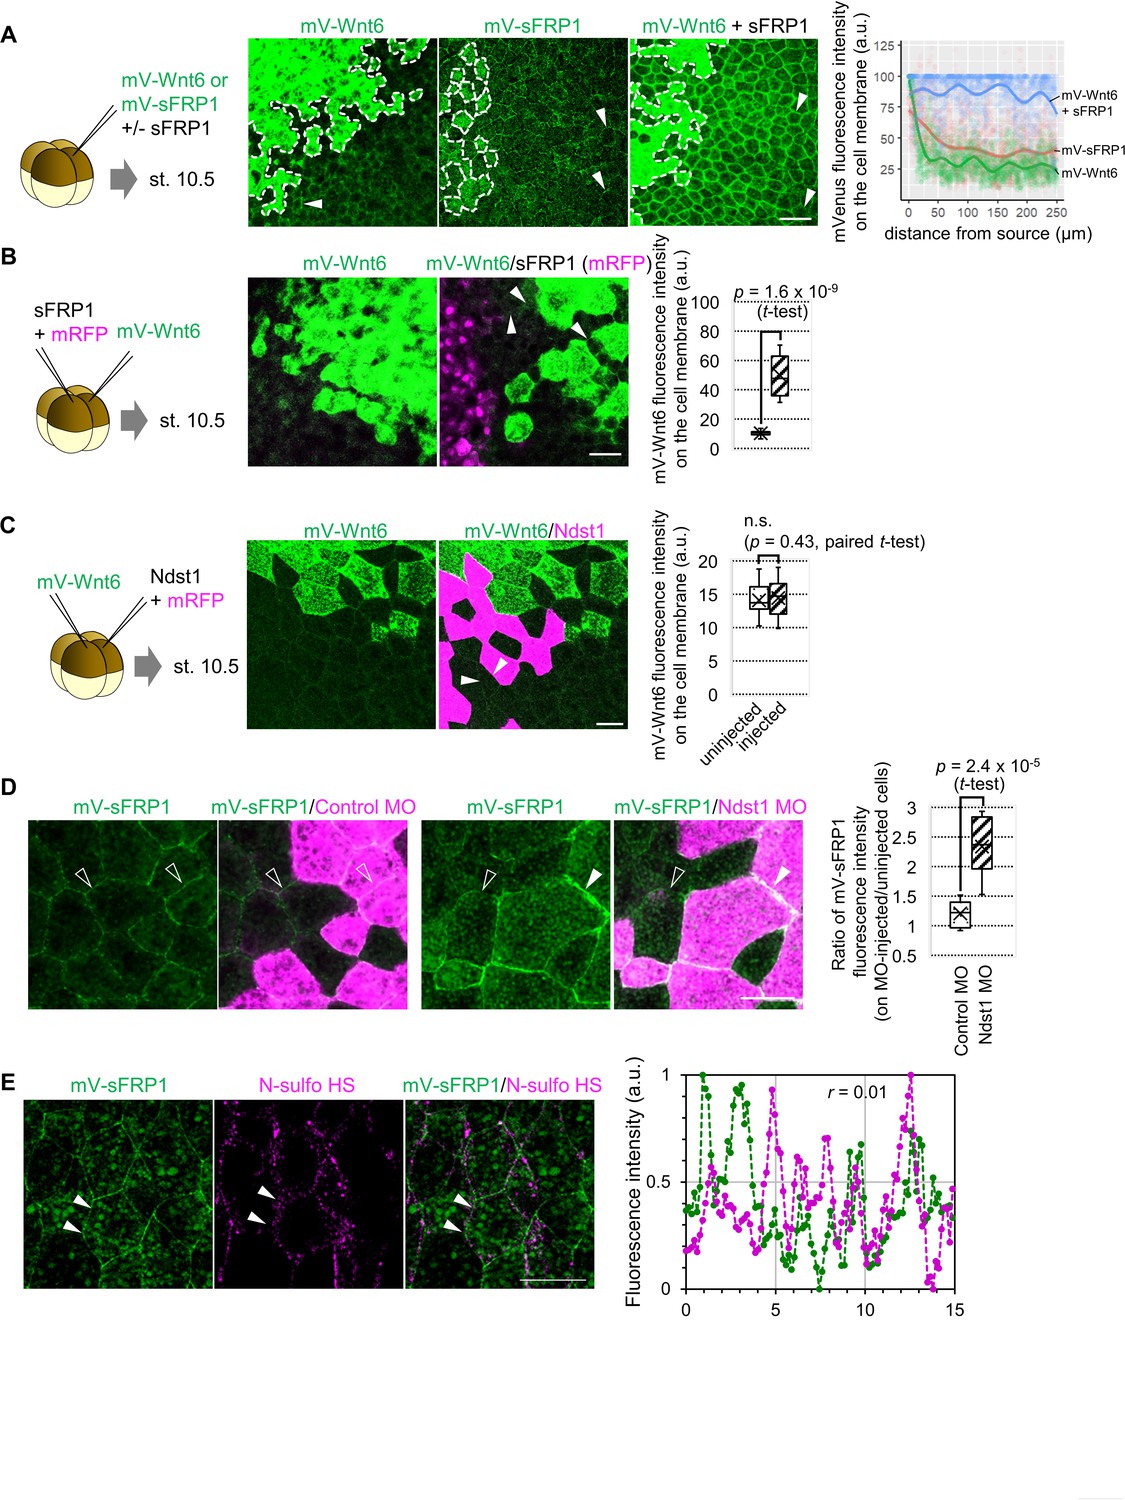
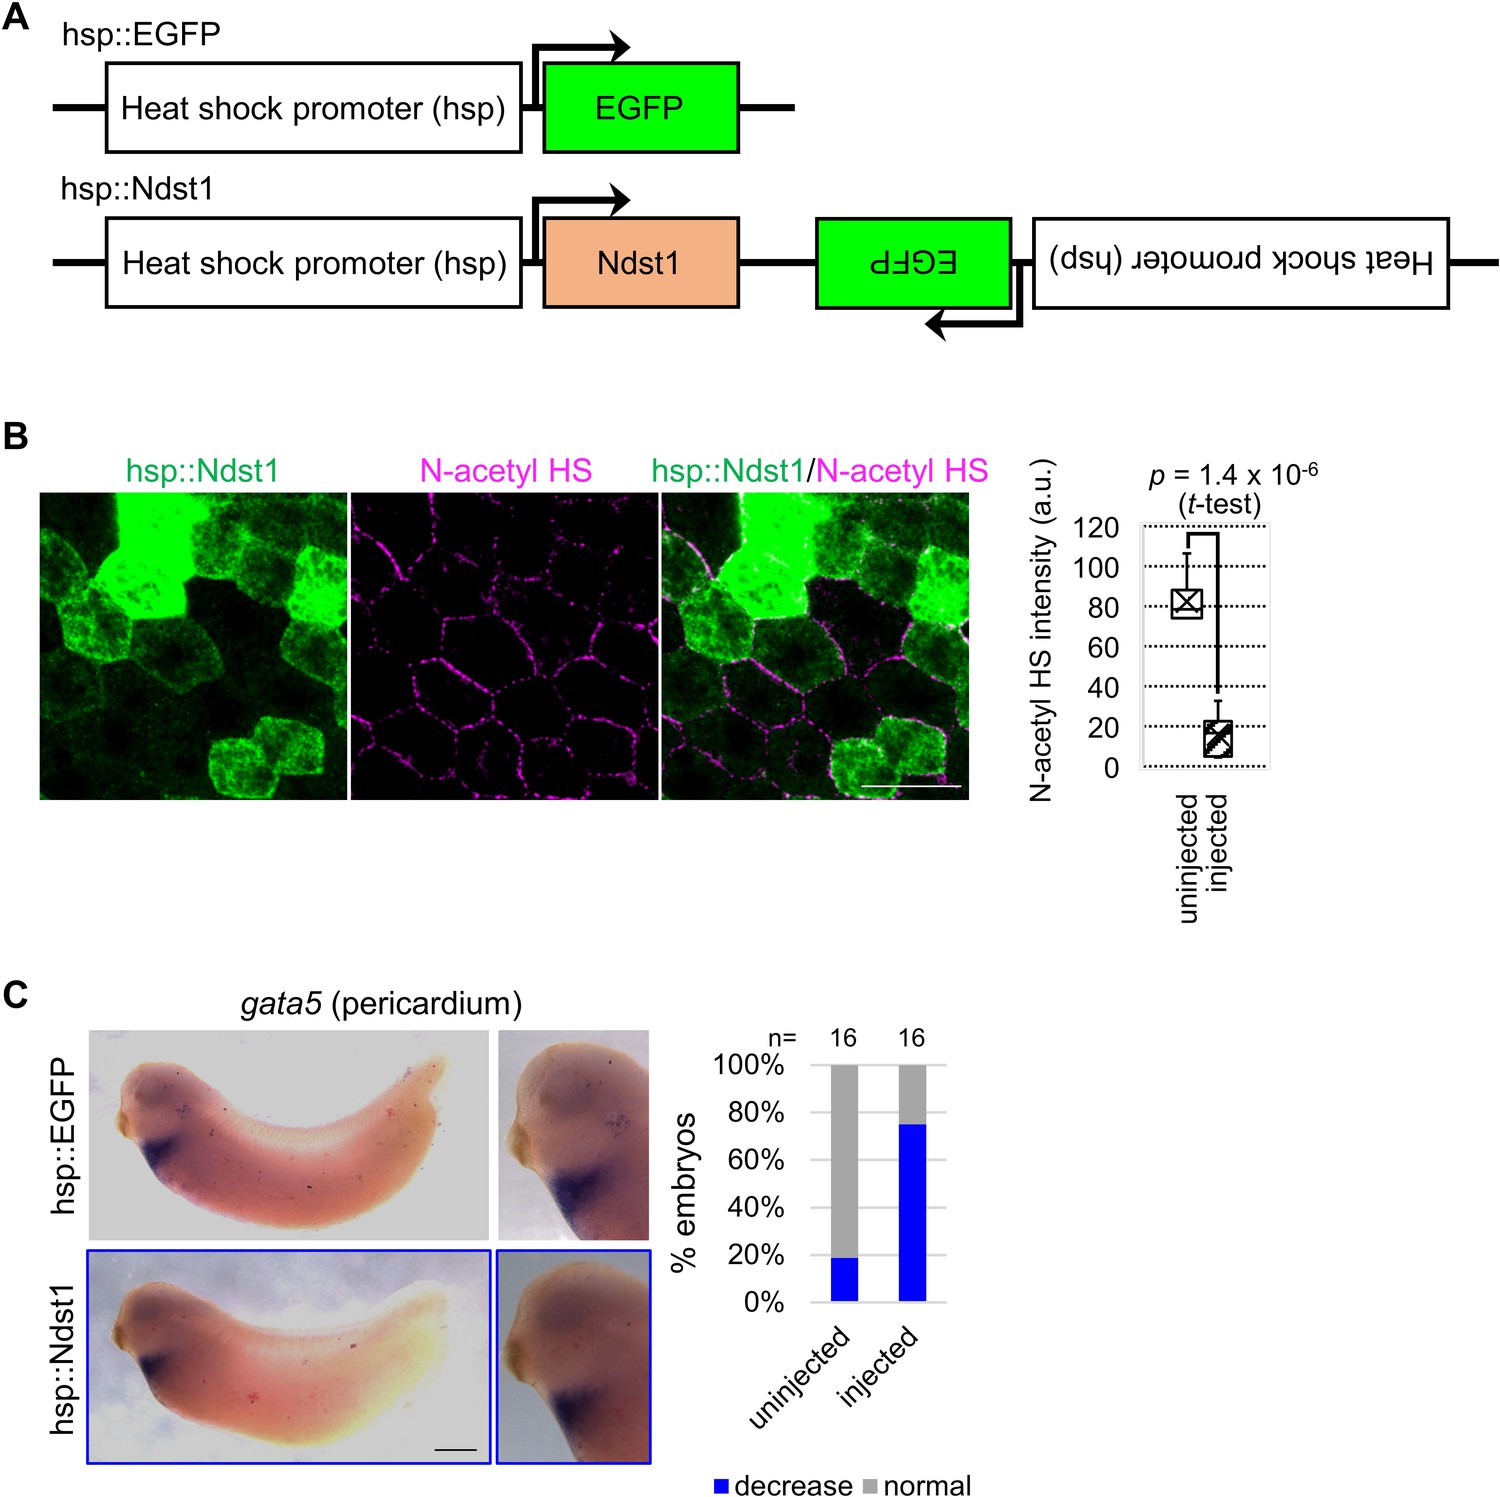
(A) sFRP1 did not accumulate on ndst1-expressing cells (open arrowhead), compared to intact cells (arrowhead). Indicated mRNAs were injected into different blastomeres at the four-cell stage. ndst1 was expressed in magenta-colored cells. mVenus fluorescence intensity on cell membranes is shown in the box plot. The horizontal line indicates the median. Edges of boxes indicate the first and third quartiles. The cross indicates the mean, and whiskers indicate the minimum and maximum. Scale bar, 30 μm. (B) sFRP1 was highly localized on N-acetyl-rich HS. mV-sFRP1 mRNA was injected into one blastomere at the four-cell stage. N-acetyl-rich HS was visualized with IHC. Signal intensity is quantified in C-D. Scale bar, 20 μm. (C) A typical result of a signal intensity measurement (between the two arrowheads in B) (green, mV-sFRP1; magenta, N-acetyl-rich HS). (D) Quantification of the colocalization between sFRP1 and N-acetyl-rich HS or N-sulfo-rich HS. A box plot of Pearson’s r value, calculated from measurements, as in C (n=10 (N-acetyl-rich HS), 11 (N-sulfo-rich HS)), The p-value from Student’s t-test is shown. (E) The distribution of N-acetyl-rich and N-sulfo-rich HS in heart tissue. IHC for N-acetyl-rich and N-sulfo-rich HS. The dotted line in the left figure shows the position of the magnified image on the right. N-acetyl-rich HS was highly localized in the outer region of cardiogenic mesoderm (prospective pericardium). Scale bar, 0.1 mm. (F) Heat-induced expression of ndst1 expanded tnni3 expression (myocardium). hsp::Ndst1 or hsp::EGFP (Figure 4—figure supplement 2A) was injected into the prospective heart region at the four-cell stage, and heat shock (33°C, 15 min x 3 times) was induced at st. 24. In situ hybridization against tnni3 (cardiac troponin I) was performed at st. 32 as quantified in the graph (Fisher’s exact test, p=2.8 x 10⁻¹¹). Scale bar, 0.5 mm. (G) Heatmap of Wnt signaling activity with/without sFRP1. The time change is shown as kymographs, in which time advances from top to bottom. The dotted line (white, no sFRP1; magenta, with sFRP1) shows an example of the threshold in Wnt signaling activity. The line became nearly vertical faster with sFRP1 (the change of the contour by addition of sFRP1 is indicated by a white arrow). These figures correspond to parts of Figure 3—figure supplement 4 (‘the initial amount of receptor’ = ‘normal’, ‘the strength of feedback’ = ‘normal’). (H) Schematic view of Wnt signaling in heart tissue. Wnt ligand is secreted from the epidermis (left cells). Before the onset of Wnt6 expression, the receptor (Fzd7) is broadly expressed around the prospective pericardium region. Wnt signaling is activated in a concentration-dependent manner (circular arrows), which induces Fzd7 expression and restricts Wnt ligand spreading. sFRP1 is secreted from the prospective myocardium region. This sFRP1 expression is inhibited by Wnt signaling. sFRP1 protein distribution is restricted by N-acetyl HS, which is abundant in the outer region of cardiogenic mesoderm.
Figure 4—figure supplement 1
Distribution and function of sFRP1.
(A) sFRP1 can lengthen the distributional range of Wnt6. mV-Wnt6 with/without sFRP1 or mV-sFRP1 was injected into a ventral blastomere at the four-cell stage and observed at st. 10.5. Cells surrounded by dotted line are the source cells. Wnt6 distributional range was seemed to be short, whereas sFRP1 was long. To examine this, mVenus fluorescence intensity on the cell membrane was measured (n=3 each). The intensity was normalized by setting the maximum intensity within 5 μm near the source as 100. Dots indicate each value, and regression curves were fitted (calculated by geom_smooth function in ggplot2 package version 3.3.5 in R version 4.1.0). Wnt showed a steeper gradient and sFRP1 showed a shallower gradient. mV-Wnt6 intensity on the cell membrane was increased by sFRP1. (B) The distribution of Wnt6 on the cell membrane was enhanced by sFRP1, which was expressed even at a distance from Wnt6 source. mV-Wnt6 and sFRP1 were injected into different blastomeres, different from A. mVenus intensity on the cell membrane around the source was measured as in the box plot (n=13 (mV-Wnt6), 11 (mV-Wnt6+sFRP1)). When mV-Wnt6 was injected, the distribution on the cell membrane other than the source cell was not clearly observed. The distribution can be seen when sFRP1 was injected (arrowheads). (C) Wnt6 was not substantially accumulated on ndst1-expressing cells. Indicated mRNAs were injected into different blastomeres at the four-cell stage. ndst1 was expressed in magenta-colored cells. Averaged fluorescence intensity of mVenus on lines along cell membrane of uninjected and injected cells was measured and shown in the box plot (n=12 each). The fluorescence intensities were not significantly different between on ndst1-injected and uninjected cells. (D) sFRP1 was highly accumulated on ndst1-knocked-down cells. mV-sFRP1 mRNA and ndst1 MO (with a tracer, TMR) were injected different blastomeres at the four-cell stage. Averaged fluorescence intensity of mVenus on lines along cell membrane was measured on neighboring cells of MO-injected and uninjected cells. Ratio of them was shown in the box plot (n=8, 9, respectively). (E) sFRP1 was not localized on N-sulfo-rich HS. An example figure for Figure 4D. mV-sFRP1 mRNA was injected into one blastomere at the four-cell stage. N-sulfo-rich HS was visualized by IHC. Signal intensity was showed in the graph, which was measured between two arrowheads (green, mV-sFRP1; magenta, N-sulfo-rich HS). Pearson’s correlation coefficient (r) was shown in the graph. Scale bar: 50 μm (A, B), 30 μm (C, D, E).
Figure 4—figure supplement 2
Heat-induced expression of ndst1 reduces N-acetyl HS and restricts gata5 expression.
(A) Schematic figure of HSP constructs. (B) Ndst1 expression induced by hsp::Ndst1 reduces N-acetyl-rich HS. hsp::Ndst1 was injected into one blastomere at the four-cell stage. Heat shock was induced at st. 8/9 and IHC was performed at the gastrula stage (st. 11.5). Signal intensity of N-acetyl-rich HS on each membrane (injected, hsp::Ndst1 injected (green); uninjected (black)) was quantified as shown in the graph (n=6 each). The horizontal line indicates the median. Edges of boxes indicate the first and third quartiles. The cross indicates the mean, and whiskers indicate the minimum and maximum. (C) Heat-induced expression of ndst1 restricted gata5 expression (pericardium). hsp::Ndst1 or hsp::EGFP was injected into prospective heart region at the four-cell stage, and heat shock (33°C, 15 min x 3 times) was applied at st. 24. In situ hybridization against gata5 were performed at st. 32 as quantified in the graph (Fisher’s exact test, p=3.8 x 10⁻³). Scale bar: 30 μm (B), 0.5 mm (C).
Additional files
-
Supplementary file 1
RNA probe synthesis for in situ hybridization.
- https://cdn.elifesciences.org/articles/73818/elife-73818-supp1-v3.docx
-
Supplementary file 2
PCR primers used in this study.
- https://cdn.elifesciences.org/articles/73818/elife-73818-supp2-v3.docx
-
Transparent reporting form
- https://cdn.elifesciences.org/articles/73818/elife-73818-transrepform1-v3.pdf
-
Source code 1
Computer simulation code written in MATLAB.
Running this code in MATLAB (version: R2020a) generates all the computer simulation results in this article. Figures are named using following indices for different parameter sets. ‘indexWntproduction = 1, 2, 3’ indicate 50% decrease, normal, and 50% increase of Wnt production, respectively. ‘indexRinitialcondition = 1, 2, 3, 4, 5’ indicate zero, half, normal, 2 times, and 4 times of ‘the initial amount of receptor’, respectively. ‘indexRproduction = 1, 2, 3’ indicate zero, normal, and 5 times of ‘the strength of feedback’, respectively. ‘indexSFRPproduction = 1, 3’ indicate ‘without sFRP1’, ‘with sFRP1’, respectively. ‘indexDproduction = 1, 2’ indicate ‘without dnFzd7’, ‘with dnFzd7’, respectively. ‘indexDfunction = 1, 2, 3’ indicates (1) dnFzd7 has normal dnFzd7 function, (2) has only ‘inactivate-Fzd7’ function, (3) has only ‘trap-Wnt’ function, respectively.
- https://cdn.elifesciences.org/articles/73818/elife-73818-code1-v3.zip
Download links
A two-part list of links to download the article, or parts of the article, in various formats.
Downloads (link to download the article as PDF)
Open citations (links to open the citations from this article in various online reference manager services)
Cite this article (links to download the citations from this article in formats compatible with various reference manager tools)
Positive feedback regulation of frizzled-7 expression robustly shapes a steep Wnt gradient in Xenopus heart development, together with sFRP1 and heparan sulfate
eLife 11:e73818.
https://doi.org/10.7554/eLife.73818


