SDR enzymes oxidize specific lipidic alkynylcarbinols into cytotoxic protein-reactive species
- Institut de Pharmacologie et de Biologie Structurale, IPBS, CNRS, Université de Toulouse, France
- Leiden Institute of Chemistry, Leiden University, Netherlands
- Department of Chemistry, Technical University of Munich, Germany
- SPCMIB, UMR5068, CNRS, Université de Toulouse, UPS, France
- LCC-CNRS, Université de Toulouse, CNRS, UPS, France
- INRAE, UR 875 Unité de Mathématique et Informatique Appliquées, Genotoul Bioinfo Auzeville, France
- Equipe labellisée la Ligue contre le Cancer 2018, France
- Department of Organic and Inorganic Chemistry, Science Center, Federal University of Ceará, Brazil
- INRAE, US 1426 GeT-PlaGe, F-31326, France
Figures
Figure 1 with 5 supplements
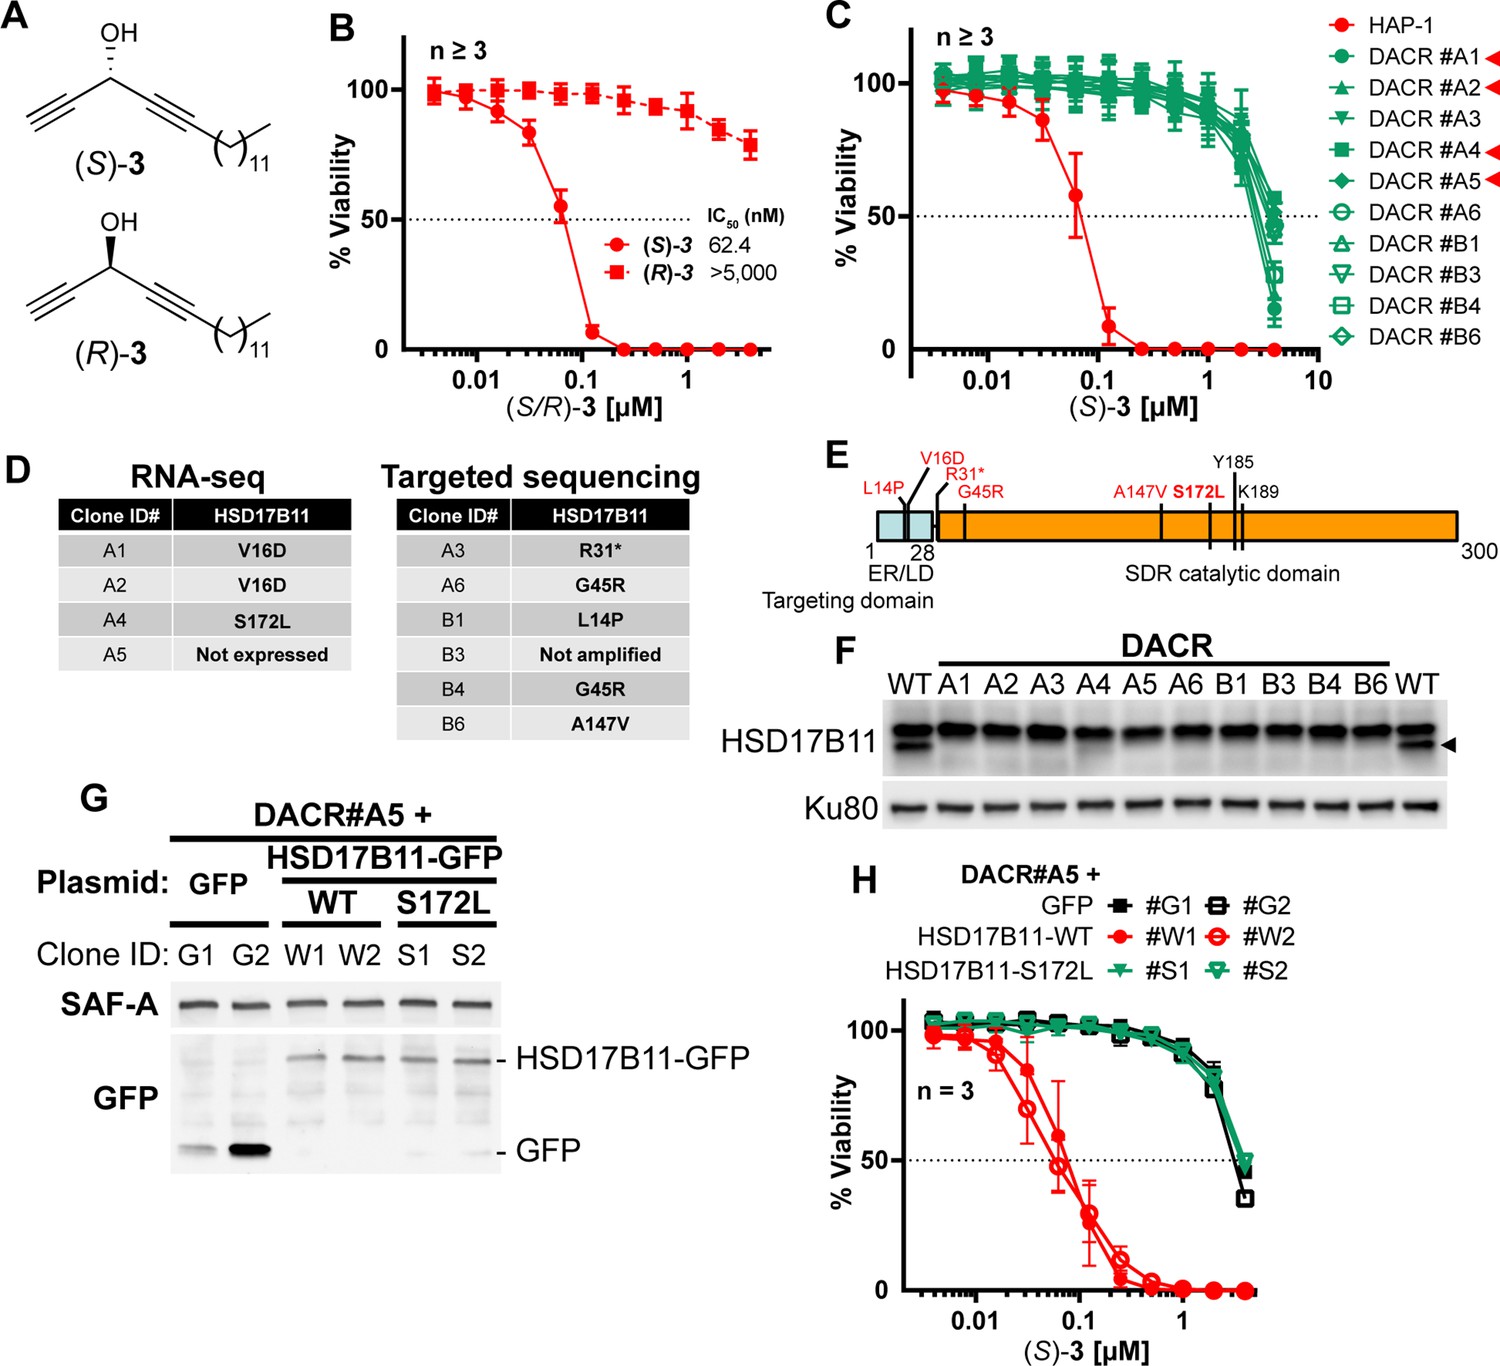
HSD17B11 is necessary for DAC (S)–3 cytotoxic activity.
(A) DAC (S)–3 and (R)–3 structures. (B) Cell viability analysis of HAP-1 or U2OS cells treated for 72 h with the indicated concentrations of (S)- or (R)–3. (C) Cell viability analysis of individual DAC-resistant clones or wild-type HAP-1 treated for 72 hr with the indicated concentrations of (S)–3. (D) List of mutations identified by RNA-seq or targeted sequencing of HSD17B11 in individual DAC-resistant clones. (E) Schematic representation of HSD17B11 functional domains. The positions of the identified mutations are indicated in red. The Y185, K189 (indicated in black), and S172 amino acids are critical for catalysis. (F) Analysis by immunoblotting of HSD17B11 levels in wild-type HAP-1 and DAC-resistant clones. Ku80 was used as a loading control. The black arrow indicates HSD17B11 position. (G) Analysis by immunoblotting of HSD17B11-GFP levels in individual clones of DAC-resistant clone A5 complemented with GFP, wild-type or S172L mutant HSD17B11-GFP. SAF-A and total H2AX were used as loading controls. (H) Cell viability analysis of individual clones of DAC-resistant clone A5 complemented with GFP, wild-type or S172L mutant HSD17B11-GFP treated for 72 h with the indicated concentrations of (S)–3.
-
Figure 1—source data 1
Source data related to Figure 1F.
The tiff files correspond to uncropped pictures of the chemiluminescent signal acquired on a BioRad Chemidoc. The regions used to generate the figure are highlighted by back squares in the jpg file, which also contains at the bottom an overlay with a picture of the membrane to locate the protein ladder positions.
- https://cdn.elifesciences.org/articles/73913/elife-73913-fig1-data1-v1.zip
-
Figure 1—source data 2
Source data related to Figure 1G.
The tiff files correspond to uncropped pictures of the chemiluminescent signal acquired on a BioRad Chemidoc. The regions used to generate the figure are highlighted by back squares in the jpg file, which also contains at the bottom an overlay with a picture of the membrane to locate the protein ladder positions.
- https://cdn.elifesciences.org/articles/73913/elife-73913-fig1-data2-v1.zip
Figure 1—figure supplement 1
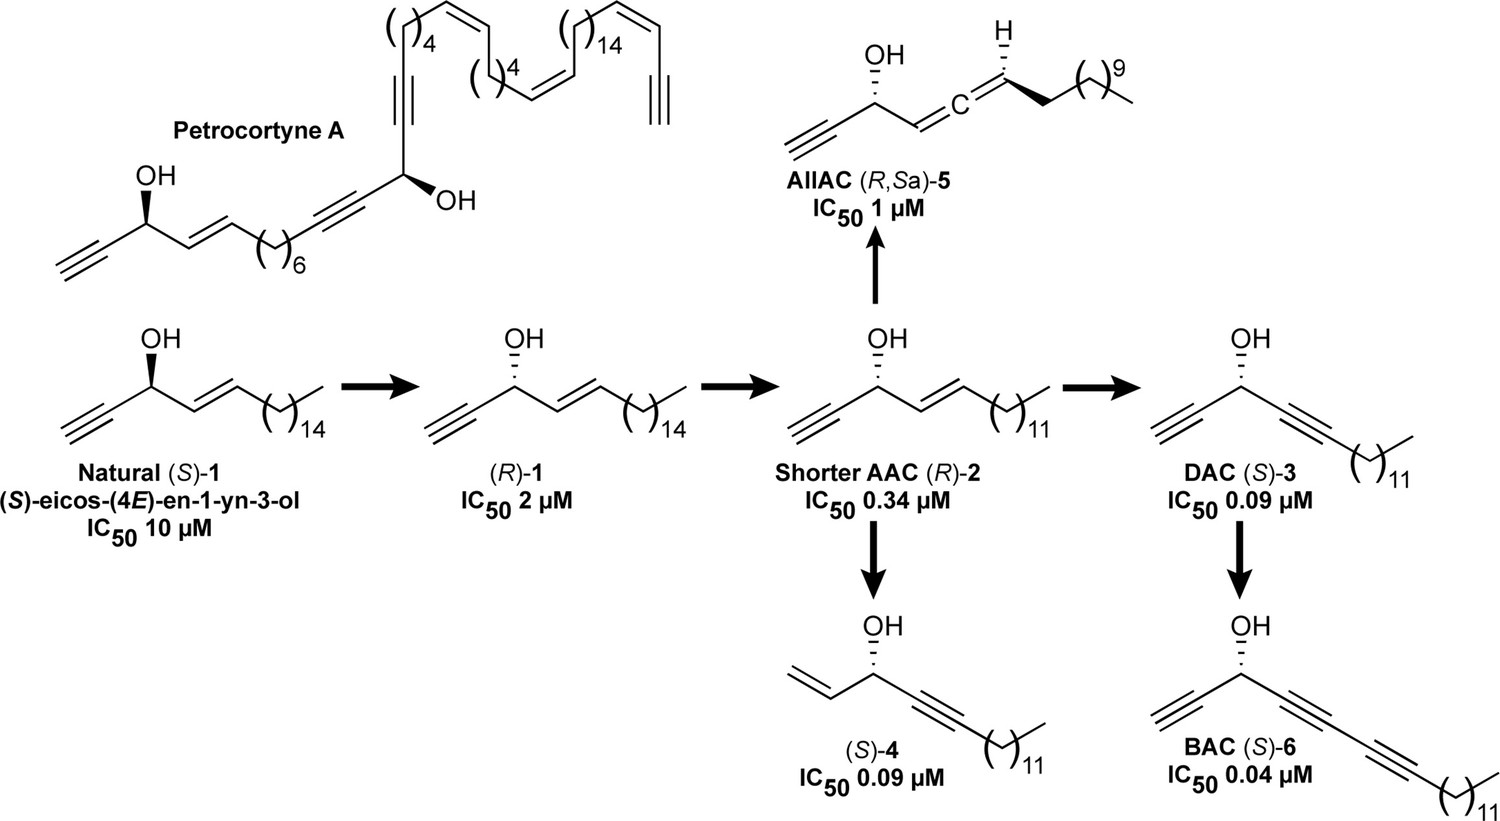
Representative structures of natural and bioinspired synthetic alkynylcarbinol-containing cytotoxic molecules.
Previously reported IC50 values, evaluated in HCT116 cells, are indicated when available.
Figure 1—figure supplement 2
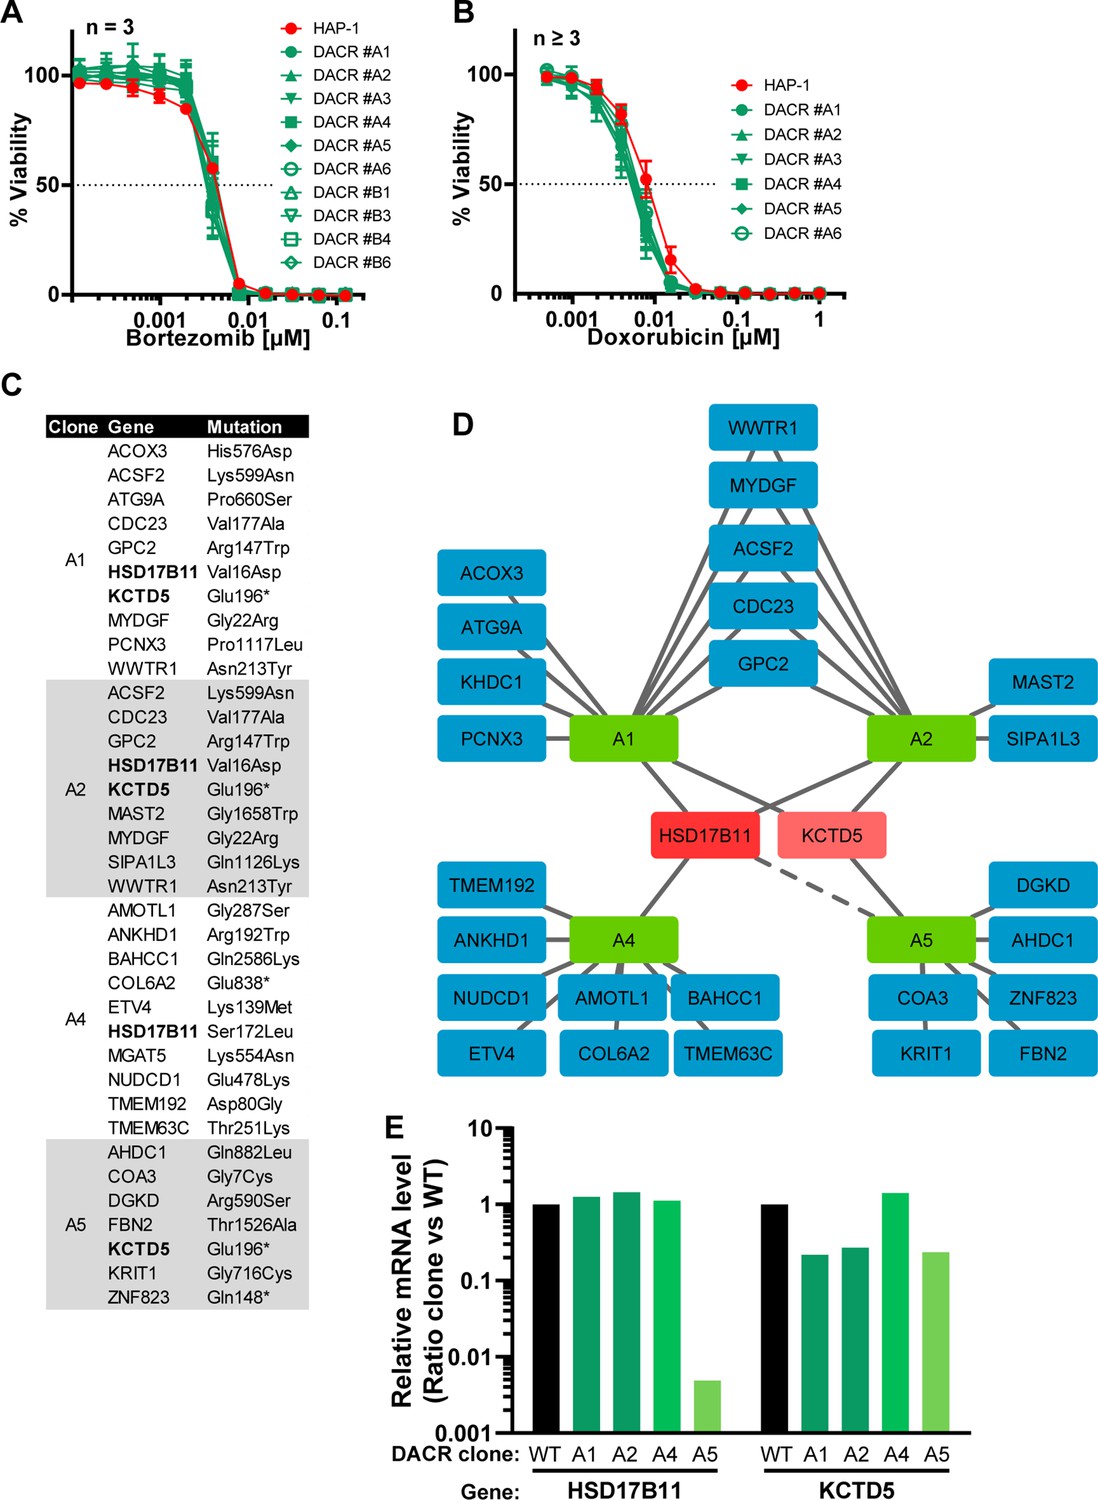
Characterization of DACR clones.
(A) Cell viability analysis of DAC-resistant clones (DACR) or wild-type HAP-1 treated for 72 h with indicated concentrations of the proteasome inhibitor bortezomib. (B) Cell viability analysis of DAC-resistant clones (DACR) or wild-type HAP-1 treated for 72 h with indicated concentrations of the DNA damaging agent doxorubicin. (C) List of genes carrying near homozygous non- or mis-sense mutations in each clone. For each gene, the impact on the protein sequence is specified. (D) Graphical representation of the genes identified as mutated in each clone. The genes mutated in more than two clones are highlighted in red. The dashed line indicates that HSD17B11 is not expressed in the DACR#A5 clone. (E) Histogram representing the ratio between the normalized levels (Reads Per Kilobase Million) of HSD17B11 and KCTD5 mRNAs in each mutant clone as compared to the wild-type HAP-1. Reduced KCTD5 levels in DACR#A1, #A2 and #A5 might result from the KCTD5 mRNA, which carries a premature stop codon, being recognized and processed by non-sense-mediated decay.
Figure 1—figure supplement 3
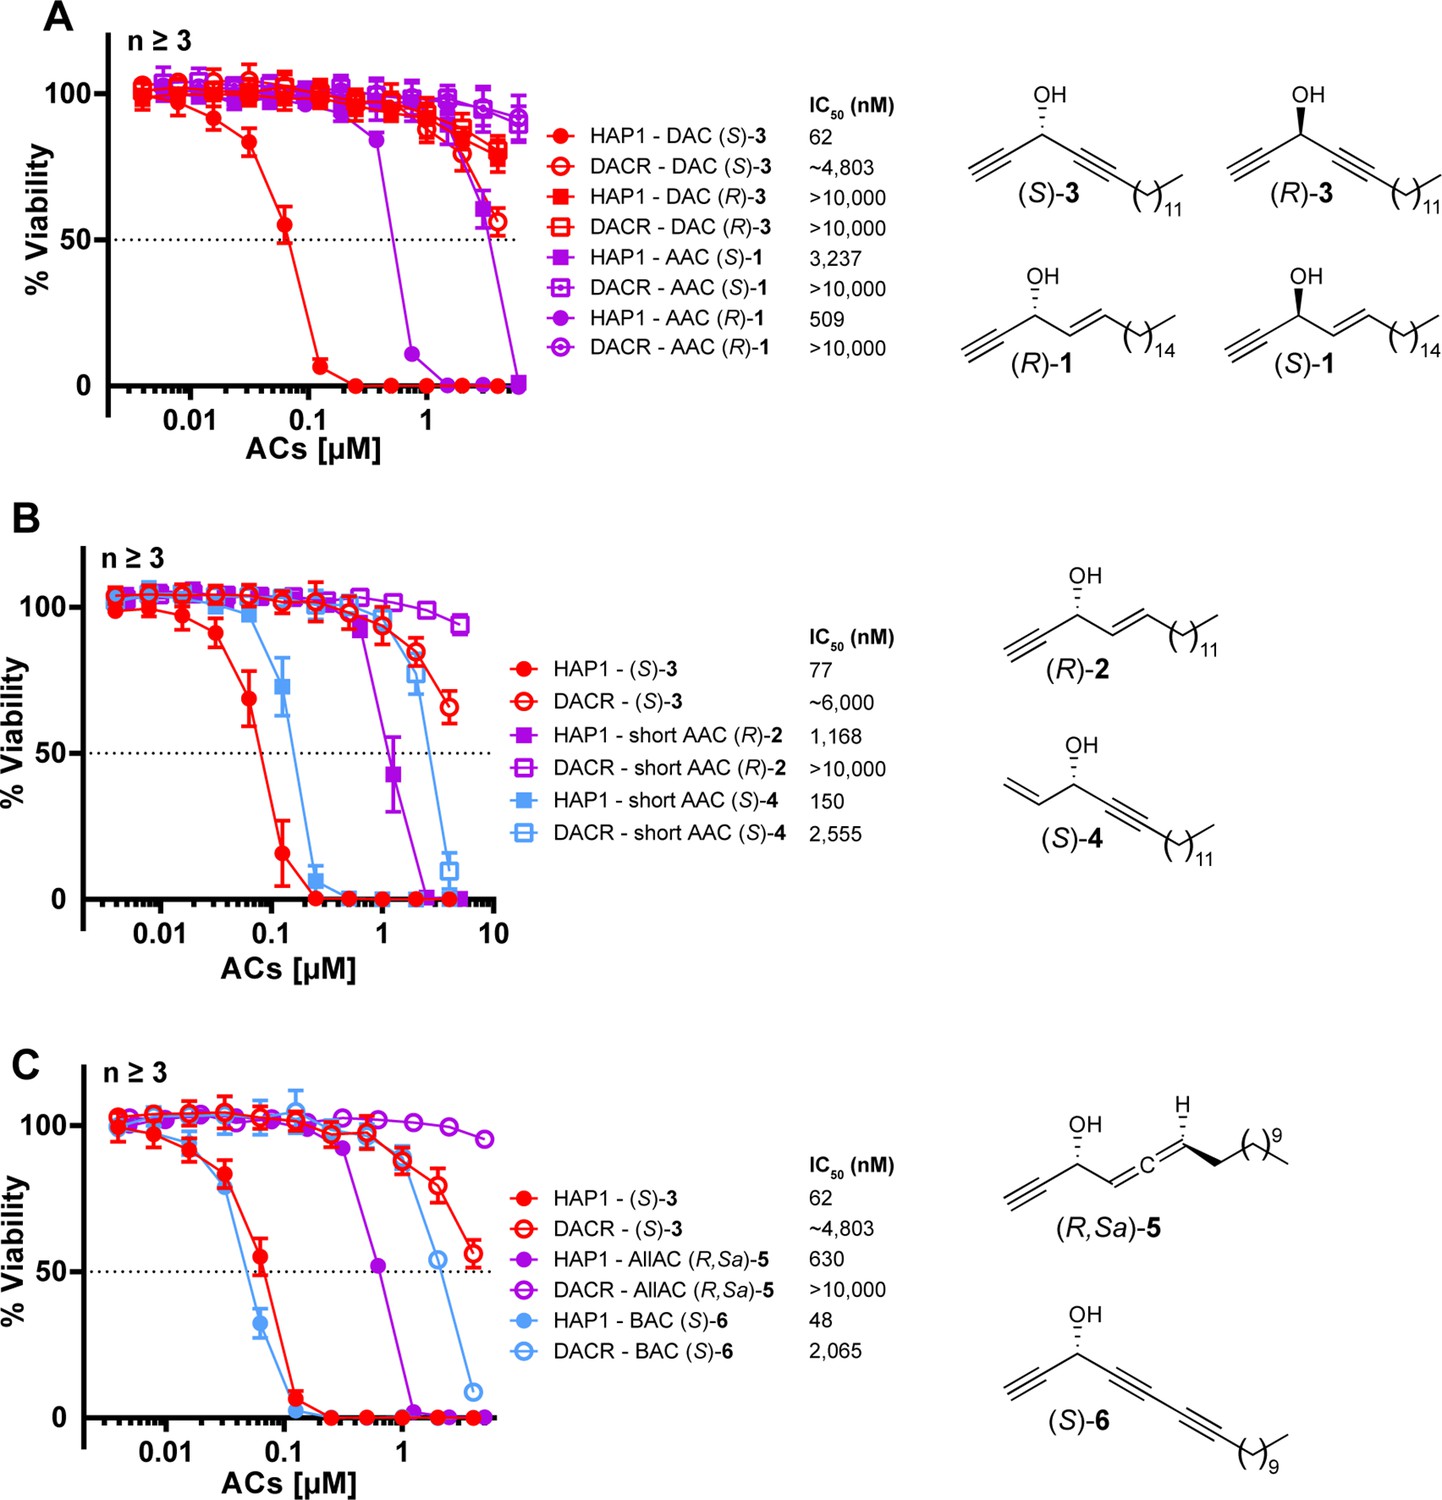
HSD17B11 inactivation confers resistance to multiple alkynylcarbinol-containing molecules (ACs) of similar configuration.
(A) Cell viability analysis of DAC-resistant HAP-1 clone #A4 (DACR) treated for 72 h with the indicated concentrations of each of the molecules represented on the right of the panel. (B) Cell viability analysis of DAC-resistant HAP-1 clone #A4 (DACR) treated for 72 h with the indicated concentrations of each of the molecules represented on the right of the panel. (C) Cell viability analysis of DAC-resistant HAP-1 clone #A4 (DACR) treated for 72 h with the indicated concentrations of each of the molecules represented on the right of the panel.
Figure 1—figure supplement 4
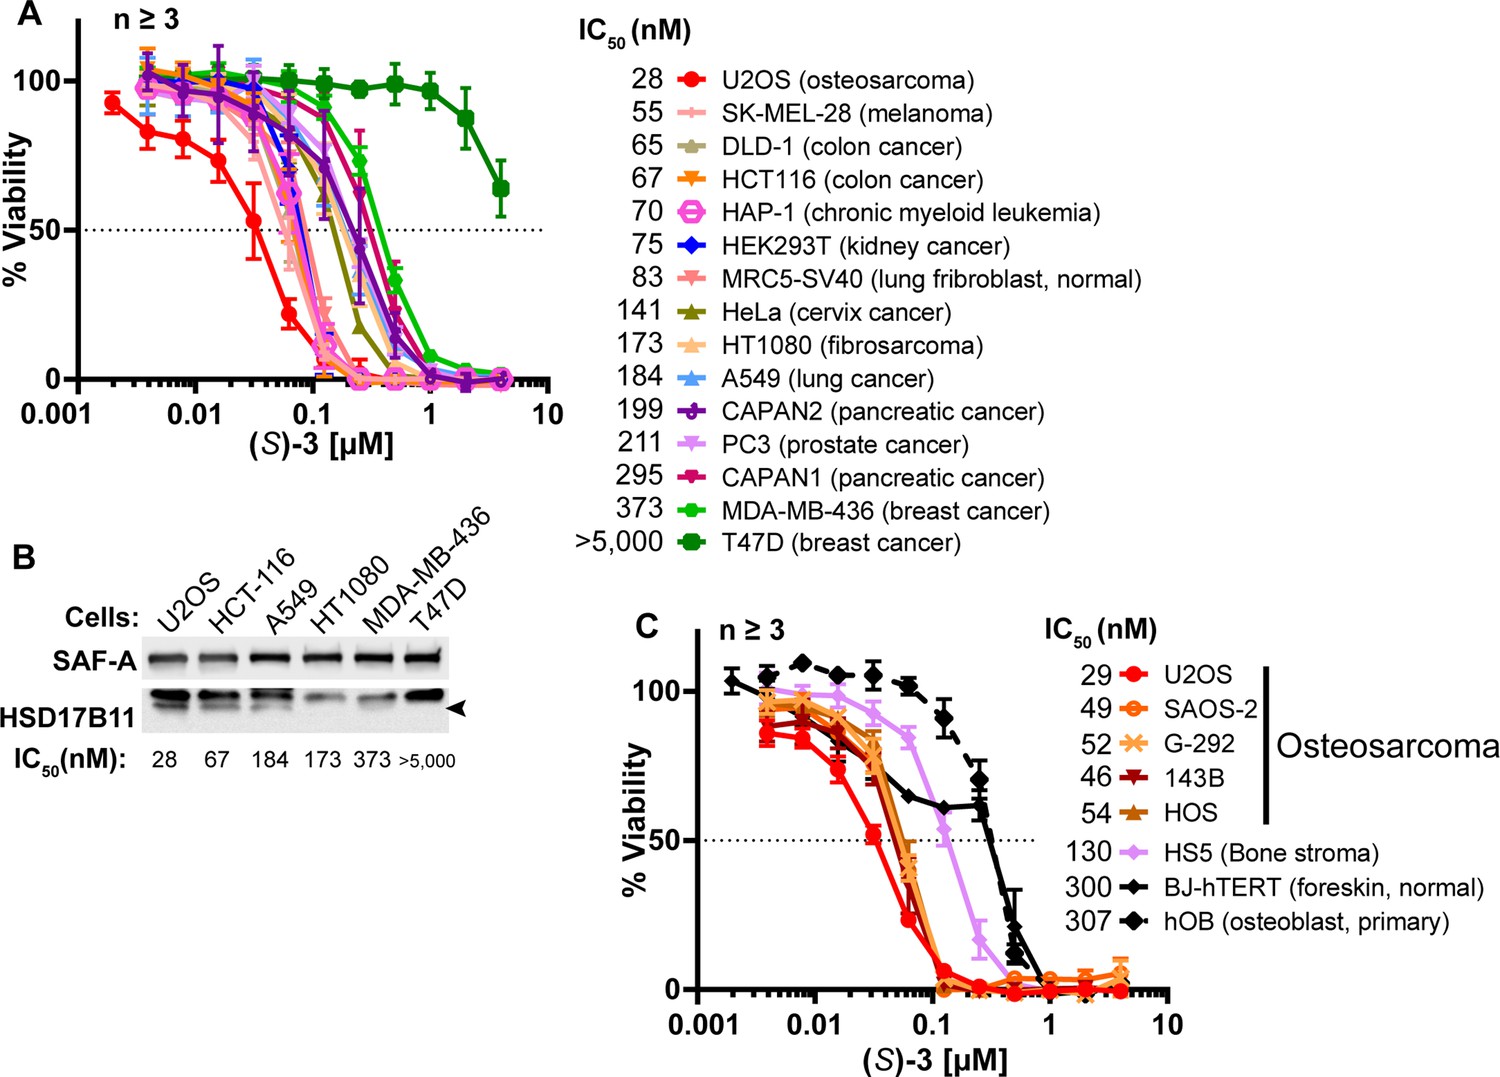
DAC (S)–3 cytotoxic activity is HSD17B11-dependent in multiple cell lines.
(A) Cell viability analysis of a panel of 15 cell lines treated for 72 h with DAC (S)–3. (B) Analysis of HSD17B11 levels by immunoblotting in six selected cell lines from the panel. SAF-A was used as a loading control. (C) Cell viability analysis of a panel of osteosarcoma cell lines and related control cells treated for 72 h with DAC (S)–3.
-
Figure 1—figure supplement 4—source data 1
Source data related to Figure 1—figure supplement 4B.
The tiff files correspond to uncropped pictures of the chemiluminescent signal acquired on a BioRad Chemidoc. The regions used to generate the figure are highlighted by back squares in the jpg file, which also contains at the bottom an overlay with a picture of the membrane to locate the protein ladder positions.
- https://cdn.elifesciences.org/articles/73913/elife-73913-fig1-figsupp4-data1-v1.zip
Figure 1—figure supplement 5
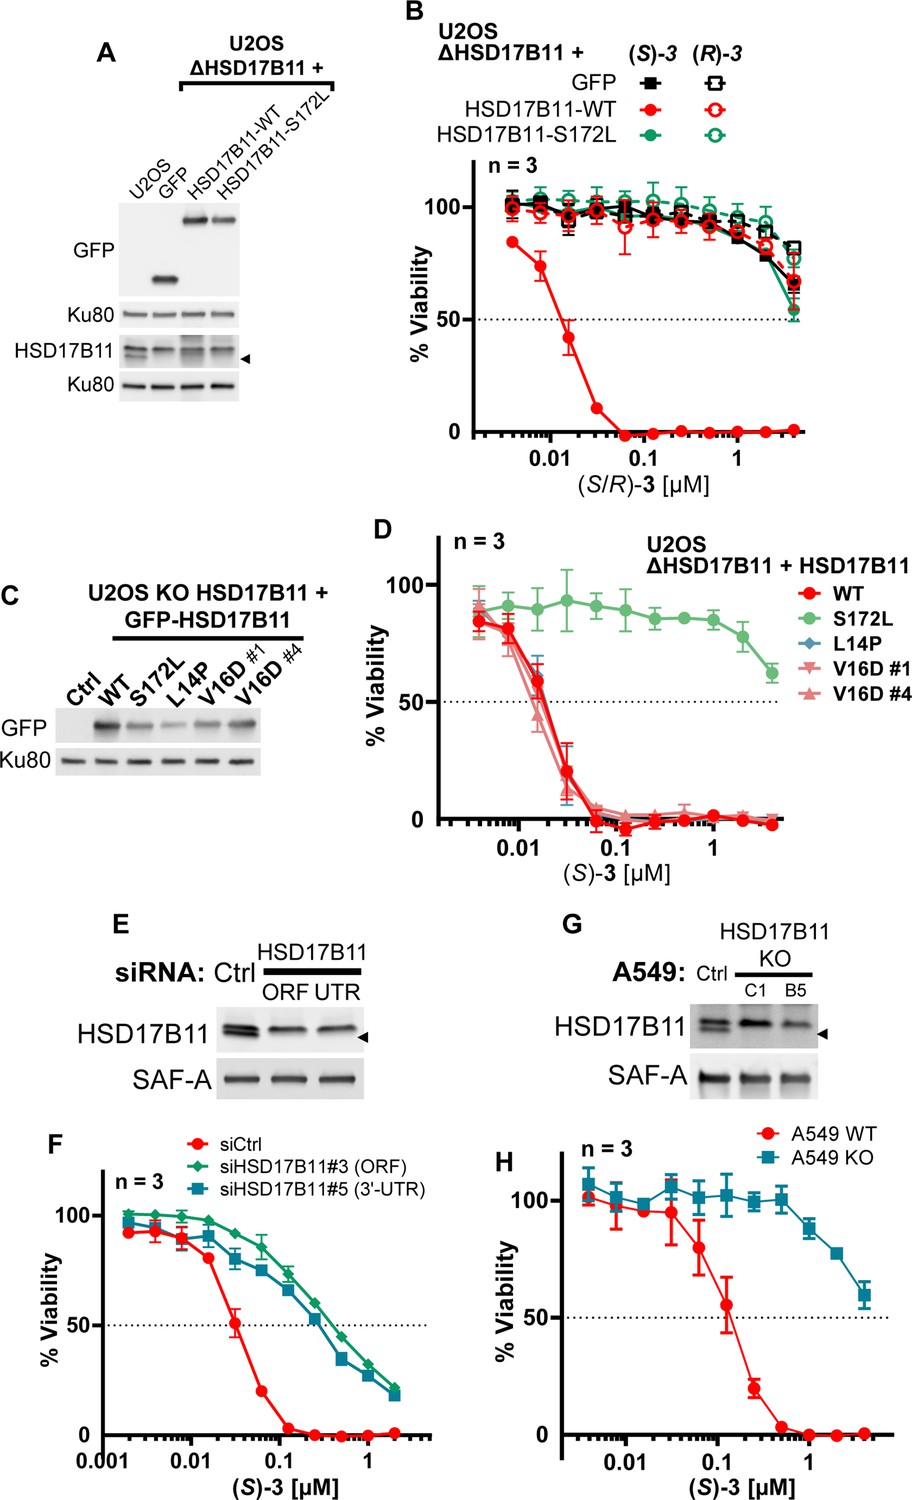
DAC (S)–3 cytotoxic activity is HSD17B11-dependent in multiple cell lines.
(A) Analysis of HSD17B11 and HSD17B11-GFP levels in wild-type U2OS or U2OS inactivated for HSD17B11 using CRISPR/Cas9 and stably complemented with GFP or GFP-tagged wild-type or S172L HSD17B11. The black arrow indicates the position of endogenous HSD17B11. Ku80 was used as a loading control. (B) Cell viability analysis of U2OS inactivated for HSD17B11, complemented as shown in (A) and treated for 72 h with DAC (S)- or (R)–3. (C) Analysis by immunoblotting of HSD17B11-GFP levels in wild-type U2OS (ctrl) or U2OS inactivated for HSD17B11 using CRISPR/Cas9 and stably complemented with wild-type or the indicated HSD17B11-GFP mutants. (D) Cell viability analysis of U2OS inactivated for HSD17B11, complemented as shown in (C) and treated for 72 h with DAC (S)–3. (E) Analysis by immunoblotting of HSD17B11 levels in U2OS cells 72 hr after transfection by control or HSD17B11 siRNAs. SAF-A was used as a loading control. (F) Cell viability analysis of U2OS cells transfected by siRNA as shown in (E) and treated for 72 h with DAC (S)–3. (G) Analysis by immunoblotting of HSD17B11 levels in wild-type A549 cells or in individual clones inactivated for HSD17B11 using CRISPR/Cas9. SAF-A was used as a loading control. (H) Cell viability analysis of wild-type or HSD17B11-deficient (clone #C1) A549 cells treated for 72 h with DAC (S)–3.
-
Figure 1—figure supplement 5—source data 1
Source data related to Figure 1—figure supplement 5A.
The tiff files correspond to uncropped pictures of the chemiluminescent signal acquired on a BioRad Chemidoc. Two different immunoblotting of the same extracts were used for this figure (respectively labeled upper and lower). The regions used to generate the figure are highlighted for each immunoblot by back squares in the jpg files, which also contain at the bottom an overlay with a picture of the membrane to locate the protein ladder positions.
- https://cdn.elifesciences.org/articles/73913/elife-73913-fig1-figsupp5-data1-v1.zip
-
Figure 1—figure supplement 5—source data 2
Source data related to Figure 1—figure supplement 5C.
The tiff files correspond to uncropped pictures of the chemiluminescent signal acquired using autoradiographic films. The regions used to generate the figure are highlighted for each immunoblot by back squares in the jpg files.
- https://cdn.elifesciences.org/articles/73913/elife-73913-fig1-figsupp5-data2-v1.zip
-
Figure 1—figure supplement 5—source data 3
Source data related to Figure 1—figure supplement 5E.
The tiff files correspond to uncropped pictures of the chemiluminescent signal acquired on a BioRad Chemidoc. The regions used to generate the figure are highlighted by back squares in the jpg file, which also contains at the bottom an overlay with a picture of the membrane to locate the protein ladder positions.
- https://cdn.elifesciences.org/articles/73913/elife-73913-fig1-figsupp5-data3-v1.zip
-
Figure 1—figure supplement 5—source data 4
Source data related to Figure 1—figure supplement 5G.
The tiff files correspond to uncropped pictures of the chemiluminescent signal acquired on a BioRad Chemidoc. The regions used to generate the figure are highlighted by back squares in the jpg file, which also contains at the bottom an overlay with a picture of the membrane to locate the protein ladder positions.
- https://cdn.elifesciences.org/articles/73913/elife-73913-fig1-figsupp5-data4-v1.zip
Figure 2 with 4 supplements

DACones are protein reactive species.
(A) Reaction catalyzed by HSD17B11. (B) Clickable DACs and DACones used in the study. (C) Viability analysis of U2OS cells treated in PBS for 1 h with (S)–3 or DACones and incubated for an additional 72 h after drug washout. (D) FBS or purified BSA were incubated 40 min at 30 °C with clickable DAC (S)–9 or clickable DACone 10. After reaction, CuAAC was used to ligate an azido-AlexaFluor647 to clickable molecules. Modified proteins were detected by scanning membrane fluorescence after SDS-PAGE and transfer. Ponceau S stains total proteins. (E) BSA or BLG were incubated with the indicated DACs or DACones, as in (D). After reaction, modified proteins were detected as in (D). Coomassie stains total proteins. (F) WT or S172L HSD17B11-GFP were immunoprecipitated from complemented U2OS KO HSD17B11 cells and incubated with clickable DAC 9 and BLG. After reaction, modified proteins were detected in the supernatant (BLG) or on the beads (HSD17B11-GFP) as in (D). GFP immunoblotting confirmed that equal amounts of WT and S172L proteins were used. (G) Analysis by direct-infusion mass spectrometry of purified BLG (mixture of isoform A and B) modified or not by DACone 10. Cyan and green arrows indicate the formation of a first and second adduct, respectively. (H) % of each amino acid detected as modified by DACones 10 or 11 in U2OS extracts as determined using an isoDTB-ABPP-based framework. (I) Proposed reactions of DACones with cysteine and lysine side chains in proteins.
-
Figure 2—source data 1
Source data related to Figure 2D.
The tiff files correspond to an uncropped picture of the AlexaFluor647 fluorescence signal, acquired on an Odyssey LI-COR, and of a scan of the membrane stained with Ponceau S. The jpg file combines both pictures and can be used to locate the protein ladders.
- https://cdn.elifesciences.org/articles/73913/elife-73913-fig2-data1-v1.zip
-
Figure 2—source data 2
Source data related to Figure 2E.
The tiff files correspond to uncropped pictures of the AlexaFluor647 fluorescence, acquired in gel on an Odyssey LI-COR, and of the gels after staining with Coomassie blue scanned with the BioRad Chemidoc. Two different gels were used (respectively labeled upper and lower). Each jpg file combines the two pictures used to generate upper and lower parts of the figure.
- https://cdn.elifesciences.org/articles/73913/elife-73913-fig2-data2-v1.zip
-
Figure 2—source data 3
Source data related to Figure 2F.
The tiff files correspond to uncropped pictures of the AlexaFluor647 fluorescence signal, acquired on an Odyssey LI-COR, of a scan of the membrane stained with Ponceau S, for the upper part (supernatant), and of the chemiluminescent signal acquired using autoradiographic films for the lower part (beads). The jpg file combines the pictures used to generate the figure and can be used to locate the protein ladders.
- https://cdn.elifesciences.org/articles/73913/elife-73913-fig2-data3-v1.zip
Figure 2—figure supplement 1
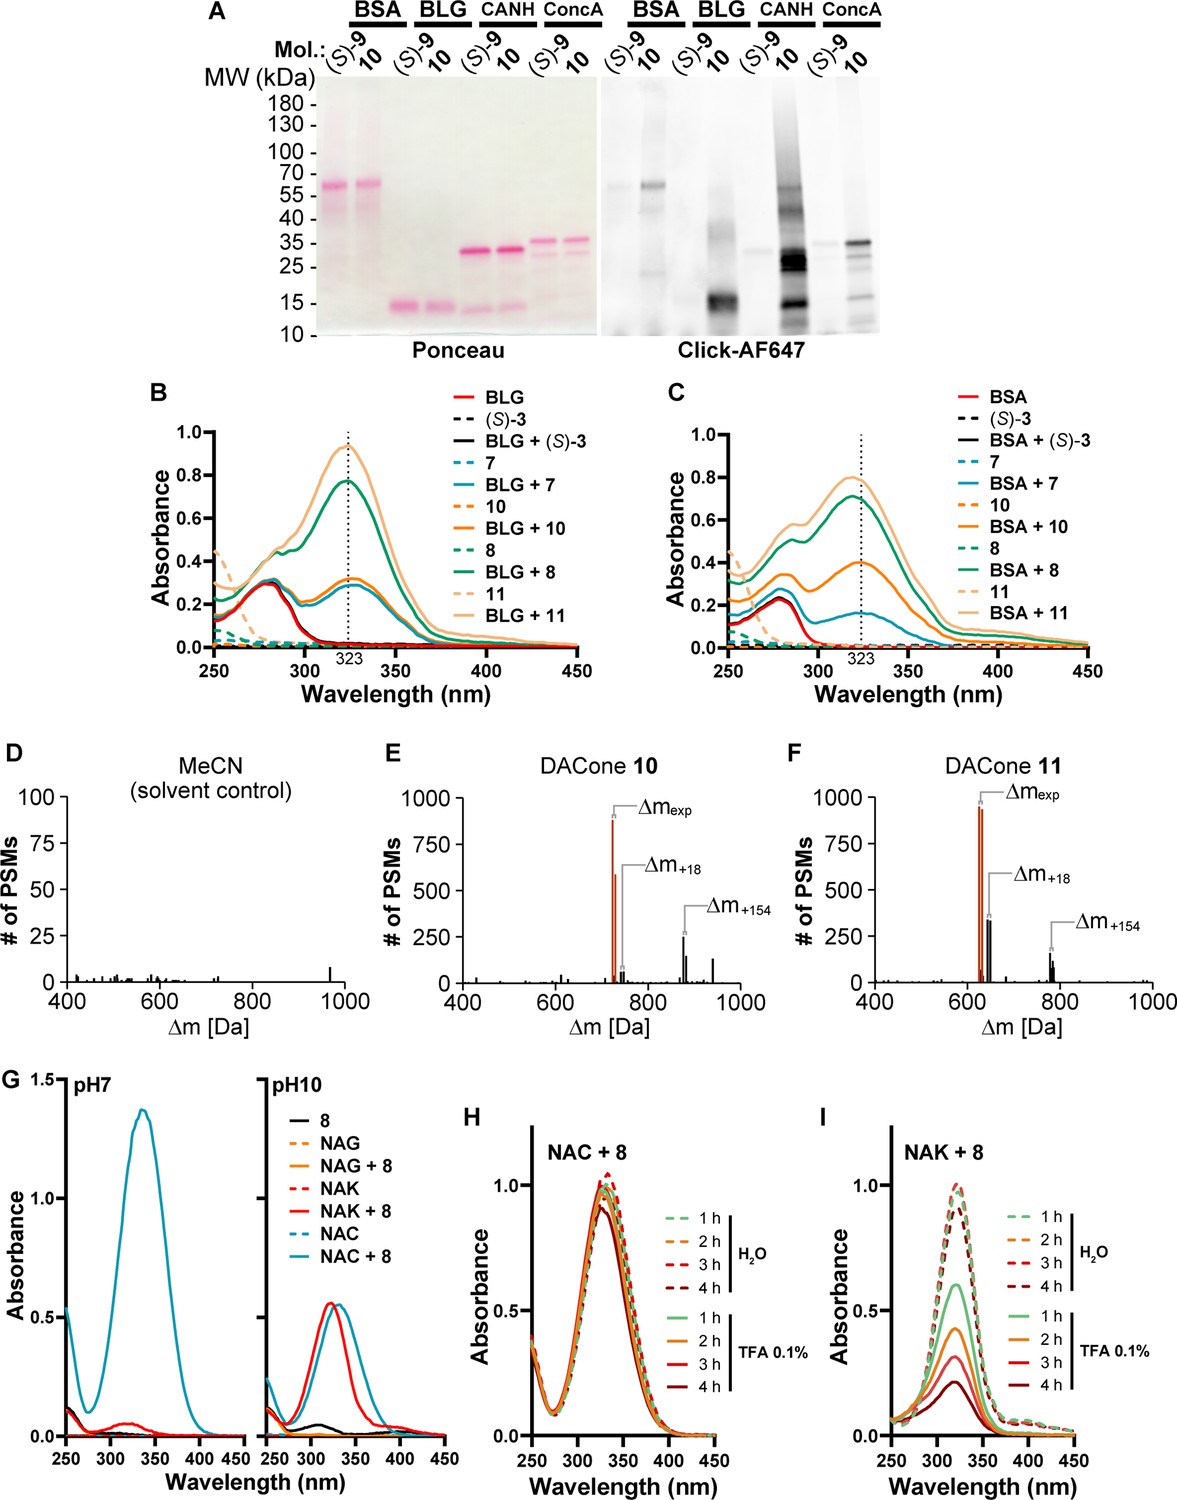
DACones are protein-reactive species.
(A) Purified BSA, BLG, carbonic anhydrase (CANH) and concanavalin A (ConcA) were incubated with clickable DAC (S)–9 or DACone 10. Adducts on proteins were detected by scanning membrane fluorescence after CuAAC-mediated ligation of a AlexaFluor647 fluorophore, SDS-PAGE and transfer on a nitrocellulose membrane. Total proteins were visualized by Ponceau S staining. (B) Absorption spectra of BLG, DAC (S)–3 or DACones incubated alone or together at pH 7.4. (C) Absorbance spectra of purified BSA, DAC (S)–3 or DACones incubated alone or together as indicated. (D,E,F) Number of peptide spectrum matches (PSMs) in the analysis of the U2OS extracts treated with MeCN (solvent control, D), 100 µM of the DACone 10 (E) or 11 (F). An Open Search in MSFragger was used to identify the masses of modification. The peaks highlighted in red are the expected modifications (Δmexp) resulting from lipoxidation and modification with the light and heavy isoDTB tags, respectively. Further modification of the lipoxidated peptides by reaction with water ( + 18) or DTT ( + 154) are also indicated. (G) Absorption spectra of Nα-acetyl-lysine (NAK), N-acetyl-cysteine (NAC), N-acetyl-glycine (NAG), or DACone 8 incubated alone or together at pH 7 or at pH 10. (H,I) NAC (H) or NAK (I) were incubated at pH10 (KOH) with the DACone 8 to allow the formation of the covalent linkage between the DACone and the thiol/amine group of NAC/NAK, as monitored by formation of the ~323 nm absorbance band. The pH was neutralized with diluted HCl and the reaction products were incubated at 30 °C at neutral pH (H2O) or with TFA at 0.1% (pH~2) for the indicated time. Acquisitions of UV-visible spectra were performed to monitor the presence of NAC-DACone (H) or NAK-DACone (I) covalent linkages.
-
Figure 2—figure supplement 1—source data 1
Source data related to Figure 2—figure supplement 1A.
The tiff files correspond to an uncropped picture of the AlexaFluor647 fluorescence signal, acquired on an Odyssey LI-COR, and of a scan of the membrane stained with Ponceau S. The jpg file combines the pictures used to generate and can be used to locate the protein ladders.
- https://cdn.elifesciences.org/articles/73913/elife-73913-fig2-figsupp1-data1-v1.zip
Figure 2—figure supplement 2
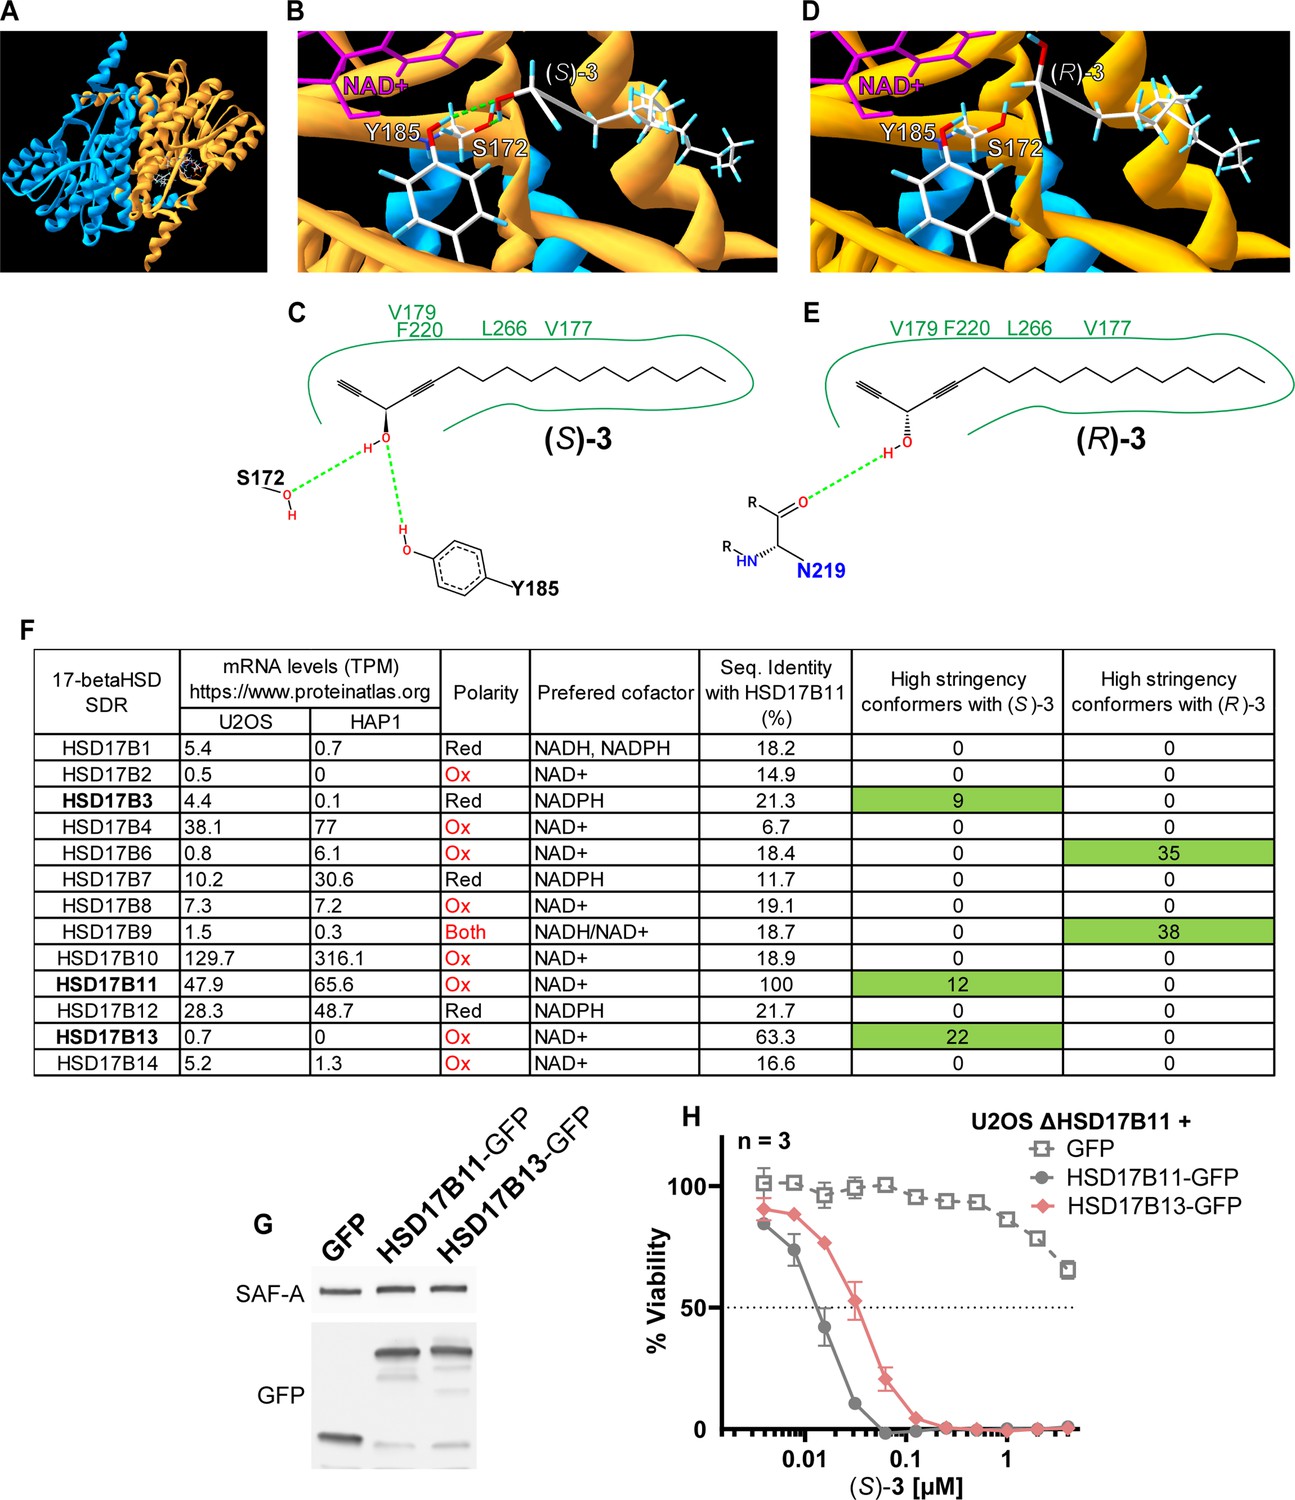
Molecular docking of (S)- and (R)–3 on 17-βHSD.
(A) AlphaFold2-multimer model of the HSD17B11 homodimer. NAD+ was added to one HSD17B11 subunit only. (B) Close-up on (S)–3 docked into HSD17B11-NAD+ model. The hydrogen bonds are shown in green and the NAD+ in pink. (C) Representation of the contacts between (S)–3 and HSD17B11. (D) Close up on (R)–3 docked into the HSD17B11 model. (E) Representation of the contacts between (R)–3 and HSD17B11. (F) Table summarizing for each of the 17β-HSD17 SDRs its expression in U2OS and HAP1, its reactional polarity, its preferred cofactor(s), its percentage of sequence identity with HSD17B11 and the number of high stringency conformers identified by molecular docking between them and (S)- and (R)–3. (G) Analysis by immunoblotting of the expression levels of GFP tagged proteins in U2OS KO for HSD17B11 stably complemented by GFP, HSD17B11-GFP or HSD17B13-GFP. (H) Cell viability analysis of U2OS inactivated for HSD17B11, complemented as shown in (G) and treated for 72 h with DAC (S)–3.
-
Figure 2—figure supplement 2—source data 1
Source data related to Figure 1—figure supplement 2G.
The tiff files correspond to uncropped pictures the chemiluminescent signal acquired on a BioRad Chemidoc. The regions used to generate the figure are highlighted for each immunoblot by back squares in the jpg file, which also contains at the bottom an overlay with a picture of the membrane to locate the protein ladder positions.
- https://cdn.elifesciences.org/articles/73913/elife-73913-fig2-figsupp2-data1-v1.zip
Figure 2—figure supplement 3
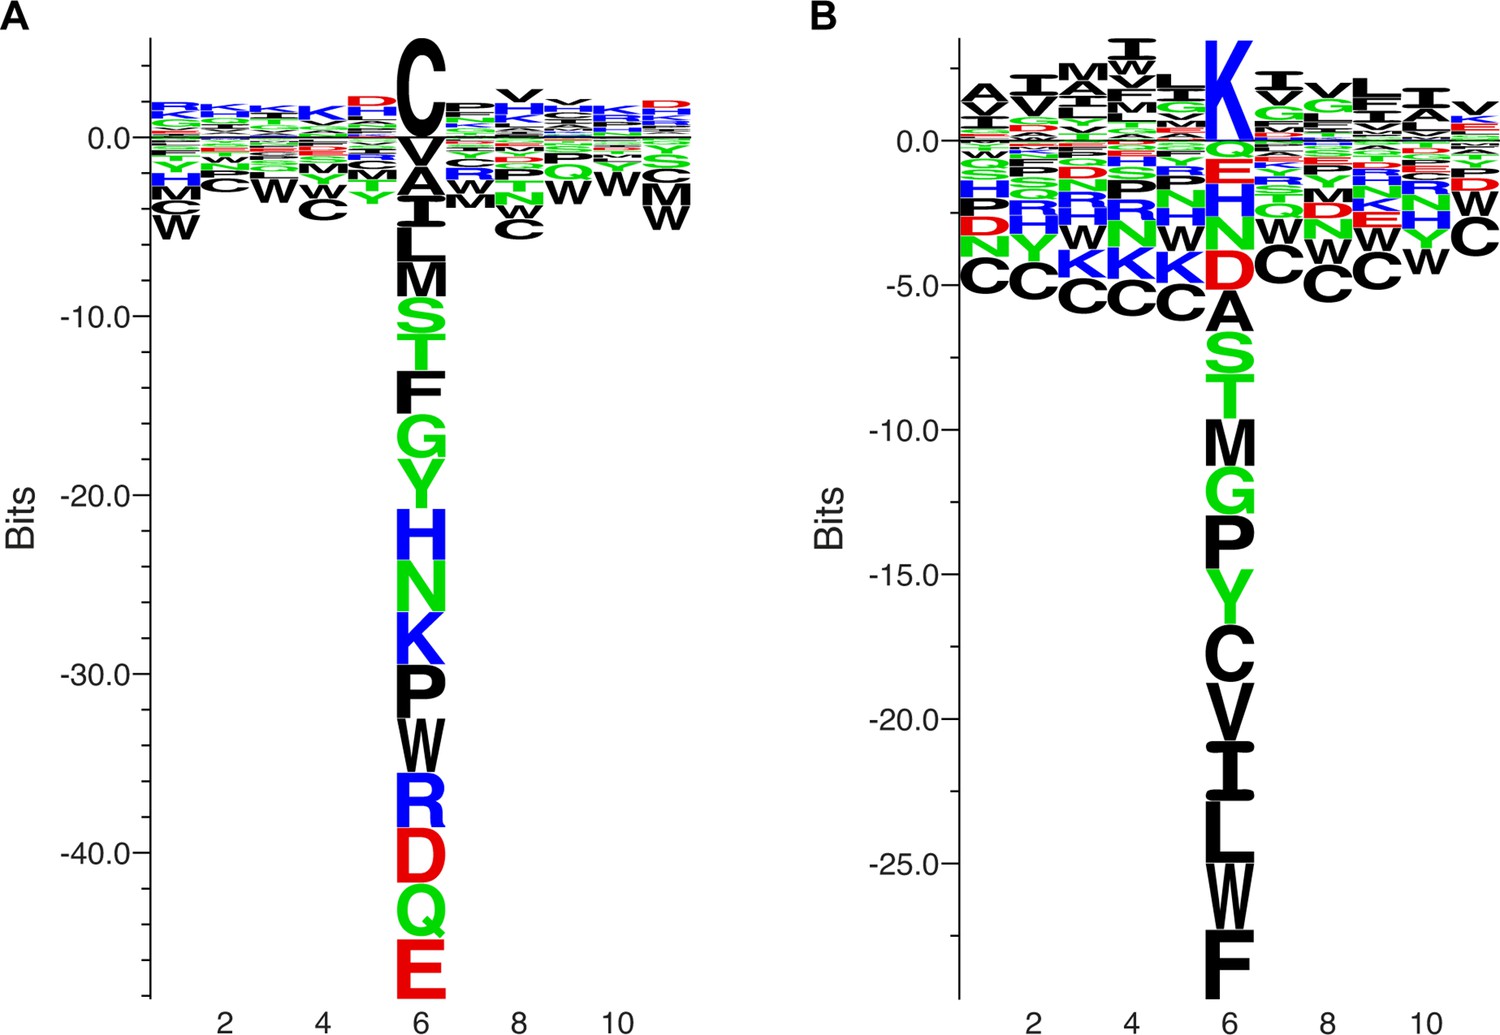
Sequence context of modified cysteines and lysines.
(A,B) A 11 amino acids window centered on the cysteines (A) or lysines (B) modified by the DACone 10 was used to generate a sequence logo. This highlighted that the DACone-modified lysines are preferentially surrounded by hydrophobic amino acids, while no clear enrichment could be identified for the modified cysteines.
Figure 2—figure supplement 4
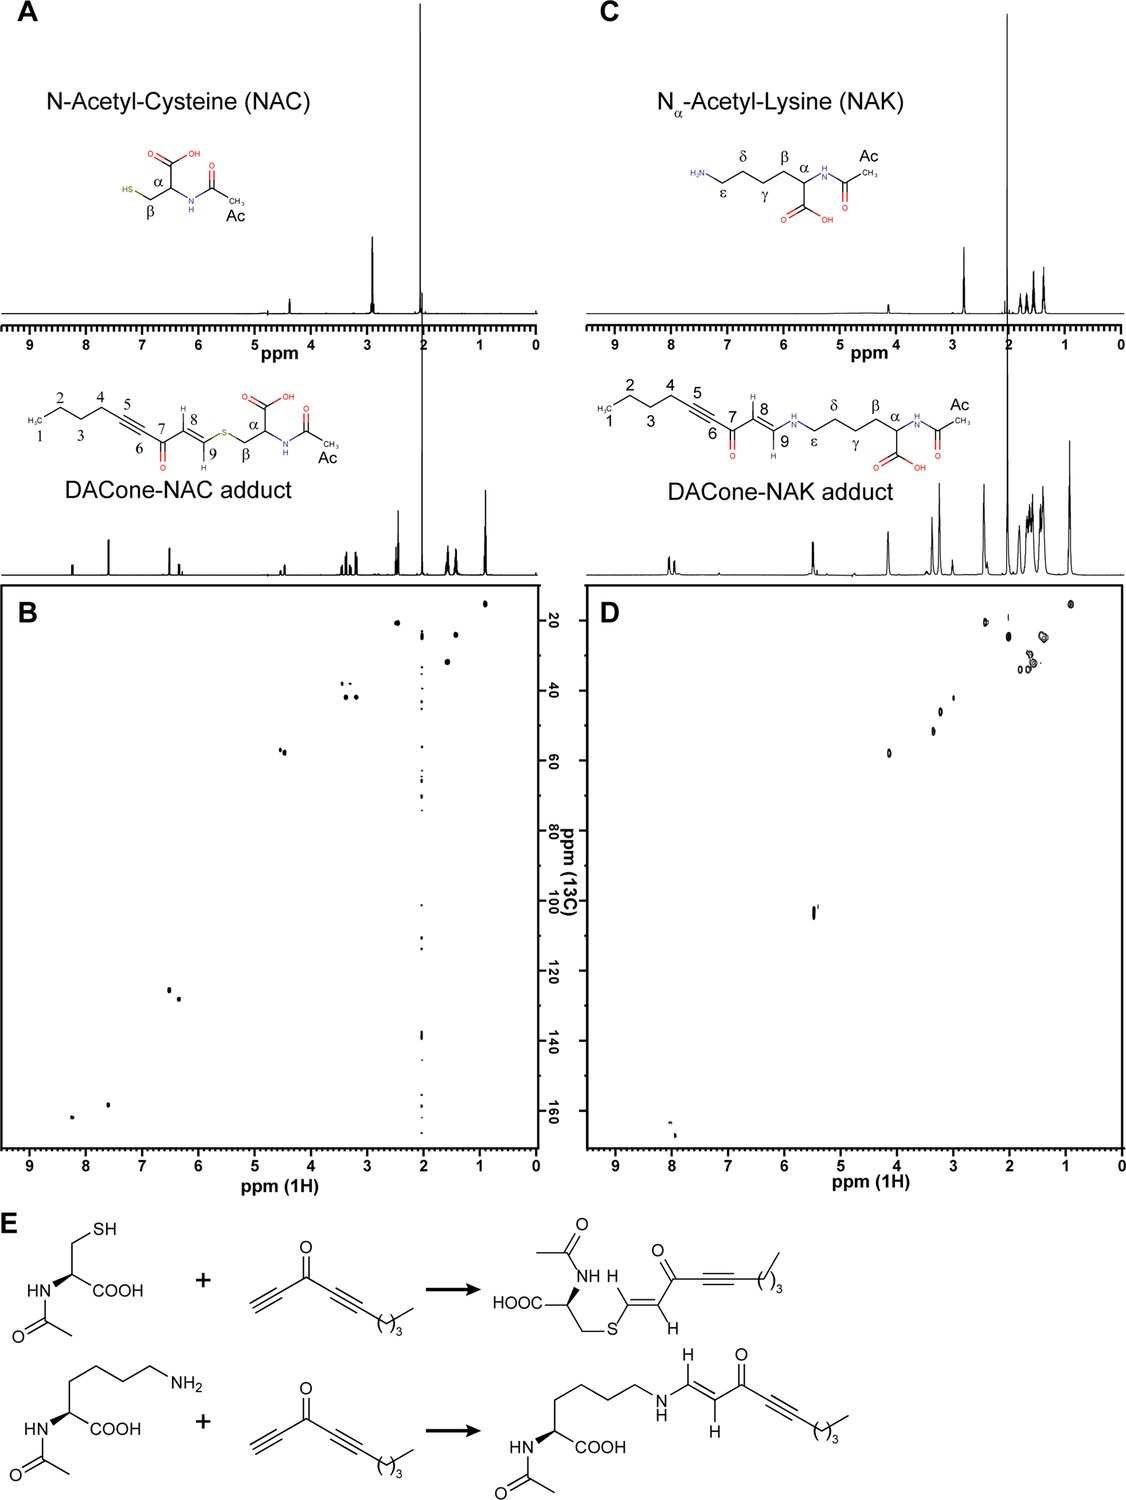
Characterization of DACone reaction products with NAC and NAK.
(A) 1H NMR spectra of DACone 8-NAC adduct (lower spectrum) or NAC alone (upper spectrum). (B)1H-13C HSQC spectrum of DACone 8-NAC adduct. (C)1H NMR spectra of DACone 8-NAK adduct (lower spectrum) or NAK alone (upper spectrum). (D)1H-13C HSQC spectrum of DACone 8-NAK adduct. (E) Proposed Michael addition reaction of NAC or NAK with the short DACone 8.
Figure 3 with 5 supplements
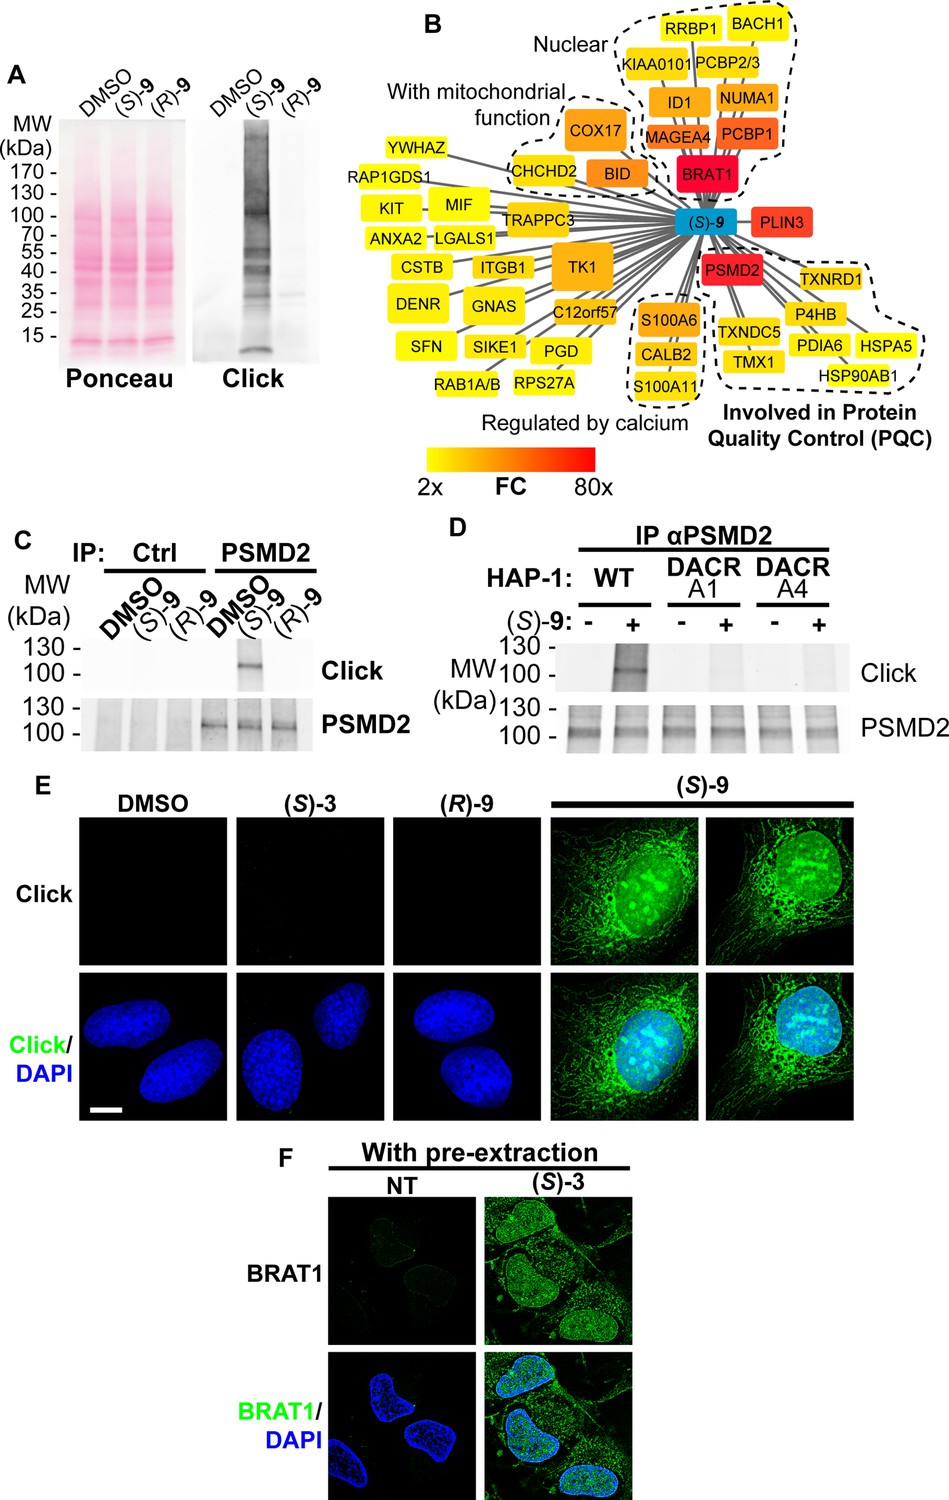
(S)-DACs lipoxidize multiple cellular proteins, triggering their association with cellular membranes.
(A) U2OS cells were incubated for 2 h with 2 µM (S)- or (R)–9, proteins were extracted and DAC-modified proteins were detected by CuAAC-mediated ligation of azido-AlexaFluor-647 to clickable molecules, separation by SDS-PAGE, transfer to a membrane which was scanned for fluorescence. (B) Landscape of proteins modified in U2OS cells by clickable DAC (S)–9 computed from three independent experiments. Fold enrichment (FC) as compared to the clickable (R)–9 is computed and color-coded as depicted. Box size corresponds to -log(p) computed as described in the materials and methods section. (C) PSMD2 or control immunoprecipitations (Ctrl) were performed from extracts of U2OS cells treated 2 h with 2 µM clickable DAC (S)- or (R)–9. DAC-modified proteins were detected by CuAAC-mediated ligation of azido-AlexaFluor-647 to clickable molecules, separation by SDS-PAGE, transfer to a membrane, which was scanned for fluorescence. PSMD2 was subsequently visualized by immunoblotting. (D) PSMD2 immunoprecipitations were performed from extracts of wild-type or DAC-resistant HAP-1 cells treated or not for 2 h with 2 µM clickable DAC (S)–9. DAC-modified proteins were detected by CuAAC-mediated ligation as in (C). PSMD2 was subsequently visualized by immunoblotting. (E) U2OS cells were treated 2 h with 0.5 µM DAC, fixed, permeabilized, and clickable molecules were detected by click with AlexaFluor488 azide. (F) U2OS expressing GFP-BRAT1 were treated 2 h with 1 µM (S)–3, pre-extracted, fixed and processed for analysis by fluorescence microscopy.
-
Figure 3—source data 1
Source data related to Figure 3A.
The tiff files correspond to an uncropped picture of the AlexaFluor647 fluorescence signal, acquired on an Odyssey LI-COR, and of a scan of the membrane stained with Ponceau S. The regions used to generate the figure are highlighted by back squares in the jpg file.
- https://cdn.elifesciences.org/articles/73913/elife-73913-fig3-data1-v1.zip
-
Figure 3—source data 2
Source data related to Figure 3C.
The tiff files correspond to uncropped pictures of the AlexaFluor647 and PSMD2 fluorescence signal, both detected on a LI-COR Odyssey. The jpg file combines both pictures and can be used to locate the protein ladders.
- https://cdn.elifesciences.org/articles/73913/elife-73913-fig3-data2-v1.zip
-
Figure 3—source data 3
Source data related to Figure 3D.
The tiff files correspond to uncropped pictures of the AlexaFluor647 and PSMD2 fluorescence signal, both detected on a LI-COR Odyssey. The jpg file combines both pictures and can be used to locate the protein ladders.
- https://cdn.elifesciences.org/articles/73913/elife-73913-fig3-data3-v1.zip
Figure 3—figure supplement 1
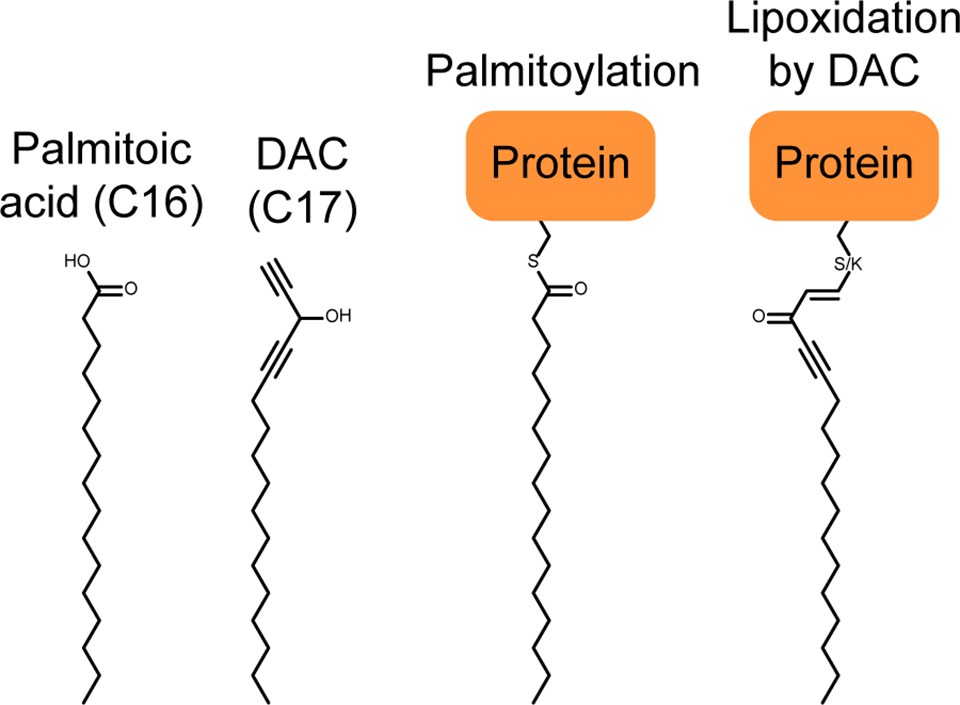
Parallel between protein palmitoylation and protein lipoxidation by the DAC 3.
The addition of a C16 lipidic anchor resulting from protein palmitoylation is sufficient to promote the association of some intracellular proteins to membranes. Lipoxidation by a C17 DAC is likely to have the same effect.
Figure 3—figure supplement 2
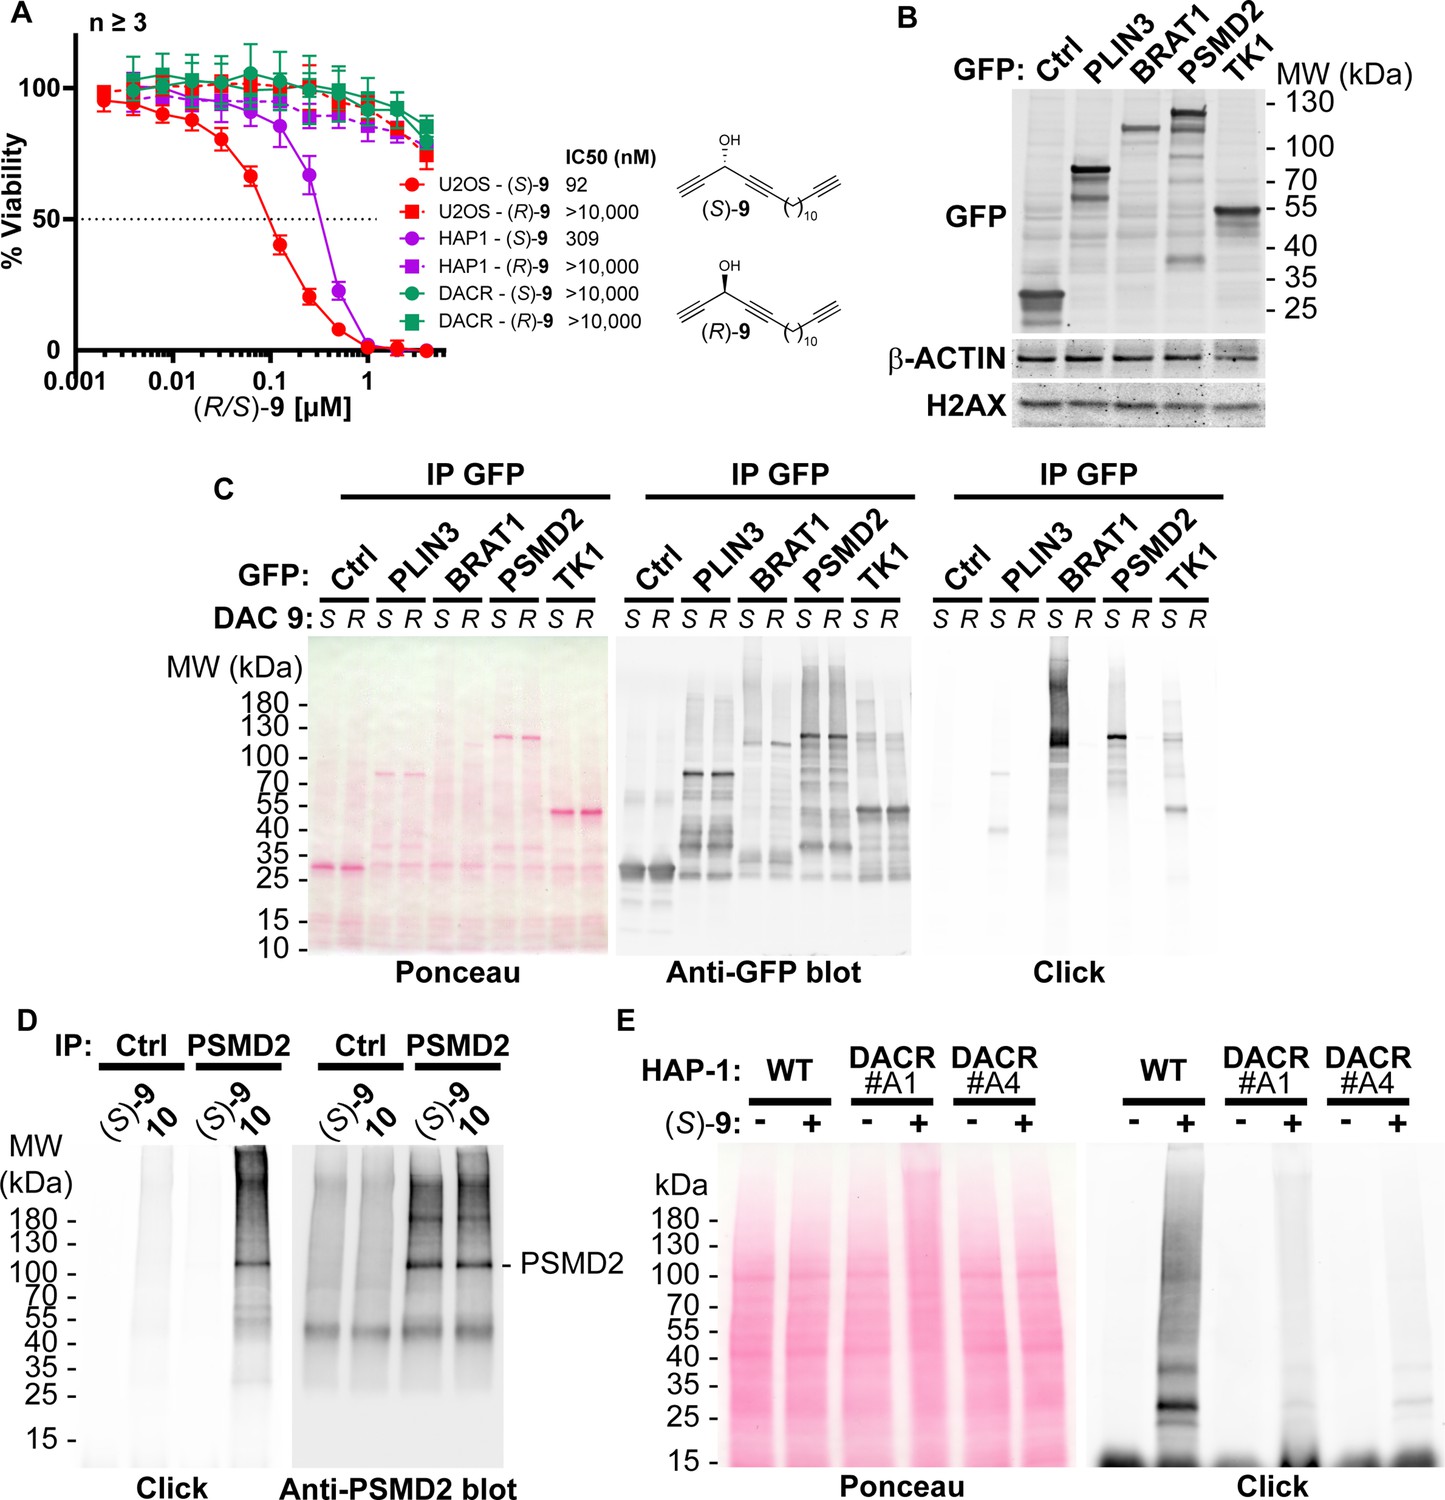
DAC (S)–9 is bioactivated into protein-reactive species.
(A) Cell viability analysis of U2OS, wild-type HAP-1 or DAC resistant HAP-1 clone A4 treated for 72 h with clickable DAC (S)–9 or (R)–9. (B) Analysis by immunoblotting of GFP levels in U2OS stably expressing GFP (Ctrl), and GFP-tagged PLIN3, BRAT1, PSMD2 and TK1. (C) U2OS depicted in B were incubated for 2 h with 2 µM (S)–9 or (R)–9, proteins were extracted and DAC-modified proteins were detected by CuAAC-mediated ligation of azido-AlexaFluor-647 to clickable molecules, separation by SDS-PAGE, transfer to a membrane which was scanned for fluorescence. (D) PSMD2 or control immunoprecipitations were performed from extracts of U2OS cells and beads were treated with (S)–9 or DACone 10. After washes, DAC/DACone-modified proteins were detected by CuAAC-mediated ligation of azido-AlexaFluor-647 to clickable molecules, separation by SDS-PAGE, transfer and scanning membrane fluorescence. PSMD2 was subsequently visualized by immunoblotting. (E) Wild-type or (S)-DAC-resistant HAP-1, clone A1 or A4, cells were untreated or treated 2 h with 2 µM clickable DAC (S)–9. DAC-modified proteins were detected by CuAAC-mediated ligation of azido-AlexaFluor-647 to clickable molecules, separation by SDS-PAGE, transfer to a membrane which was scanned for fluorescence. PSMD2 was subsequently visualized by immunoblotting.
-
Figure 3—figure supplement 2—source data 1
Source data related to Figure 3—figure supplement 1B.
The tiff files correspond to uncropped pictures of the IRDye800CW fluorescence signal acquired on a LI-COR Odyssey. The regions used to generate the figure are highlighted by back squares in the jpg file.
- https://cdn.elifesciences.org/articles/73913/elife-73913-fig3-figsupp2-data1-v1.zip
-
Figure 3—figure supplement 2—source data 2
Source data related to Figure 3—figure supplement 2C.
The tiff files correspond to uncropped pictures of the AlexaFluor647 fluorescence signal and of the IRDye800CW signal (GFP), both acquired on an Odyssey LI-COR, and a scan of the membrane stained with Ponceau S. The jpg file combines all pictures and can be used to locate the protein ladders.
- https://cdn.elifesciences.org/articles/73913/elife-73913-fig3-figsupp2-data2-v1.zip
-
Figure 3—figure supplement 2—source data 3
Source data related to Figure 3—figure supplement 2D.
The tiff files correspond to uncropped pictures of the AlexaFluor647 and PSMD2 fluorescence signal, both detected on a LI-COR Odyssey. The jpg file combines both pictures and can be used to locate the protein ladders.
- https://cdn.elifesciences.org/articles/73913/elife-73913-fig3-figsupp2-data3-v1.zip
-
Figure 3—figure supplement 2—source data 4
Source data related to Figure 3—figure supplement 2E.
The tiff files correspond to an uncropped picture of the AlexaFluor647 fluorescence signal, acquired on an Odyssey LI-COR, and of a scan of the membrane stained with Ponceau S. The jpg file combines both pictures and can be used to locate the protein ladders.
- https://cdn.elifesciences.org/articles/73913/elife-73913-fig3-figsupp2-data4-v1.zip
Figure 3—figure supplement 3
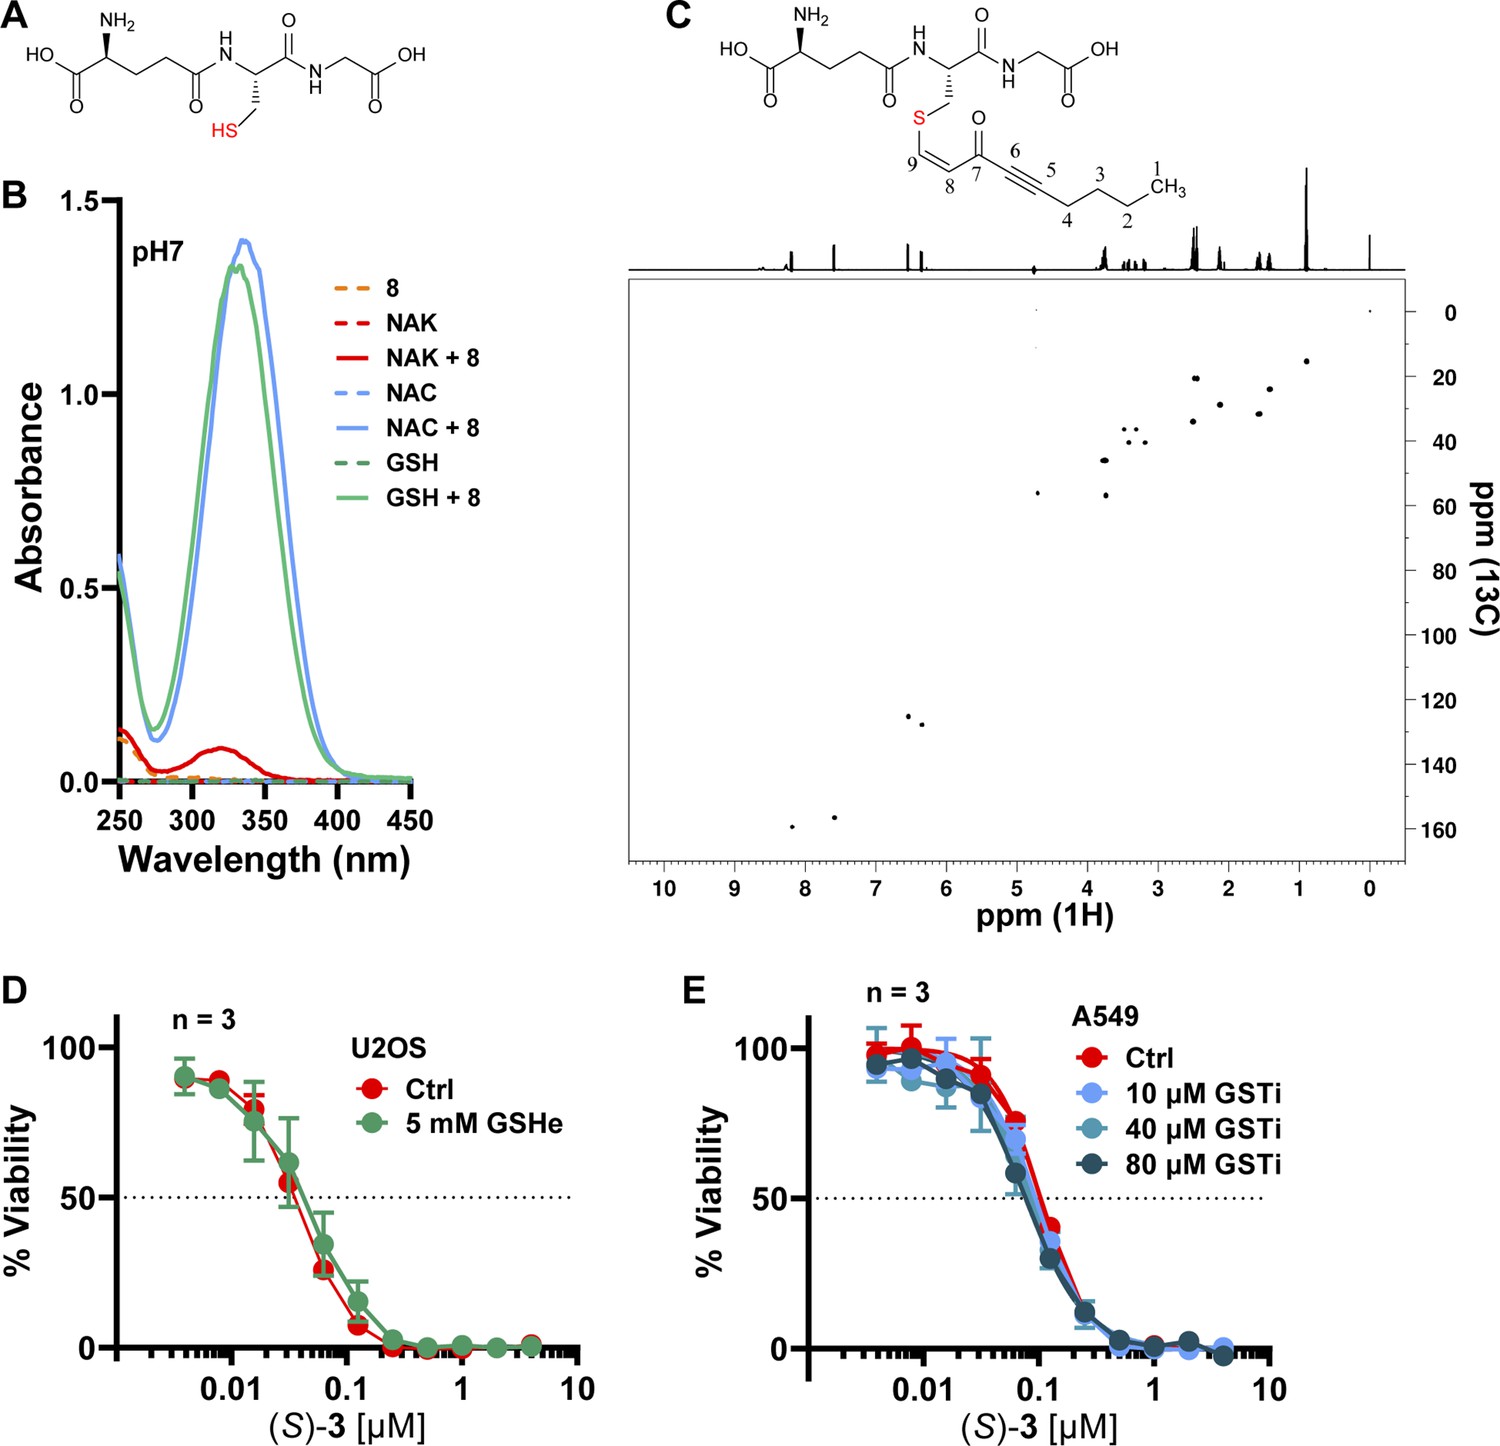
Glutathione can be modified by DACones in vitro but does not impact on (S)-DAC 3 cytotoxic activity. (A).
(A) Structure of reduced glutathione. (B) Absorption spectra of Nα-acetyl-lysine (NAK), N-acetyl-cysteine (NAC), reduced glutathione (GSH) or DACone 8 incubated alone or together at pH 7. (C) Structure of the 8-GSH adduct (top) with the related 1H-13C HSQC spectra (bottom). (D) Cell viability analysis of U2OS cells incubated for 24 h with 5 mM cell permeable glutathione (reduced glutathione monoethyl ester, GSHe) and subsequently co-treated with (S)–3 for 72 h. (E) Cell viability analysis of A549 cells pre-treated for 24 h with the indicated concentration of glutathione S-transferase inhibitor ethacrynic acid (GSTi) and subsequently co-treated with (S)–3 for 72 h.
Figure 3—figure supplement 4
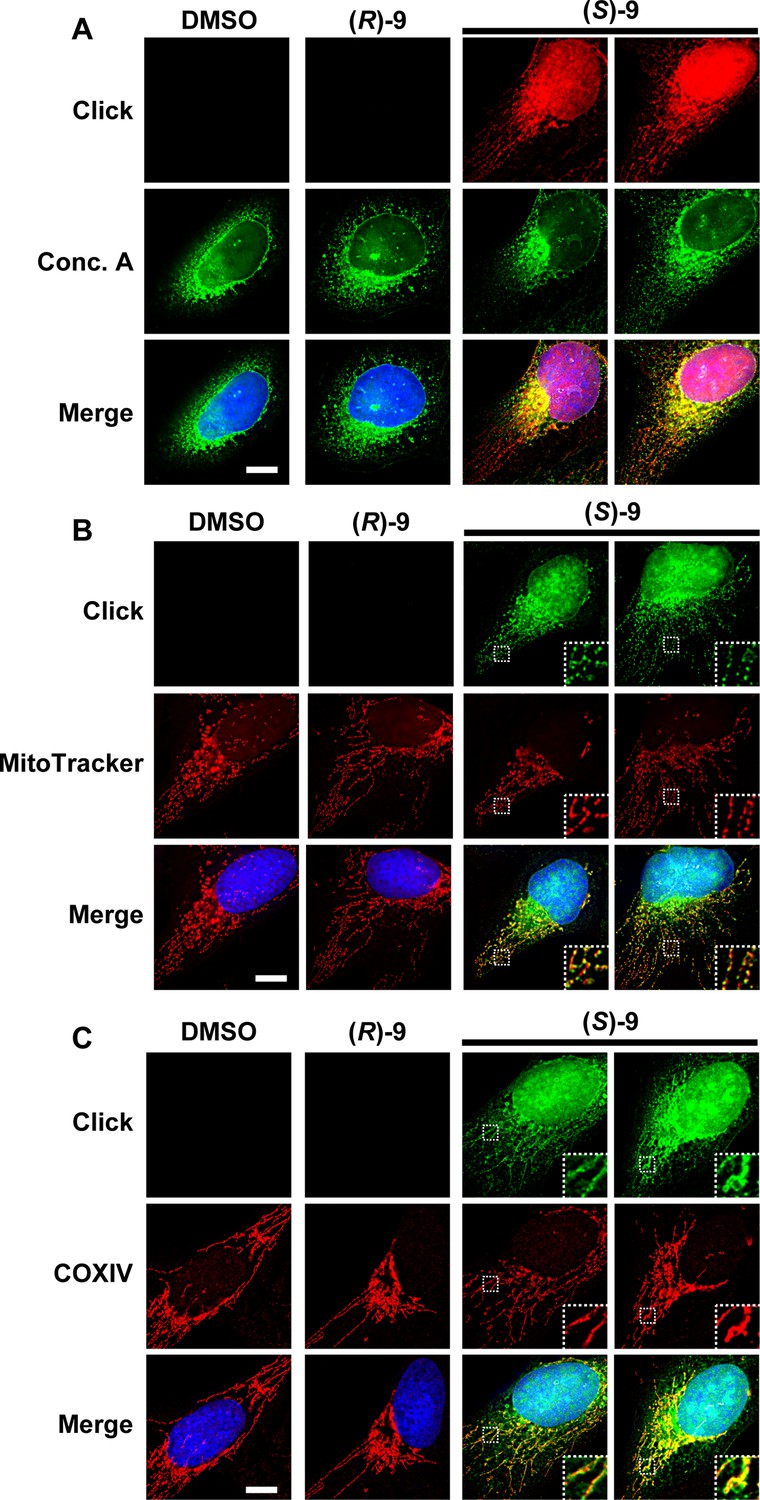
The clickable DAC (S)–9 staining colocalizes with the nucleus, ER and mitochondria.
(A-C) U2OS cells were treated 2 h with 0.5 µM of DAC (S/R)–9. (A) After fixation, CuAAC was used to label the DACs with AlexaFluor594-azido, while the ER membranes were labelled using Concanavalin A-AlexaFluor488 (Conc. A). (B) 30 min before the end of DAC treatment, the cells were incubated with MitoTracker Red CMXRos to label mitochondria. After fixation, click chemistry was used to label clickable DACs with AlexaFluor488-azido. (C) After fixation, CuAAC was used to label clickable DACs with AlexaFluor488-azido while immunofluorescence with an anti-COXIV antibody coupled with AlexaFluor594 was used to label mitochondria. On all pictures, DAPI was used to stain DNA. White scale bar = 10 µm.
Figure 3—figure supplement 5
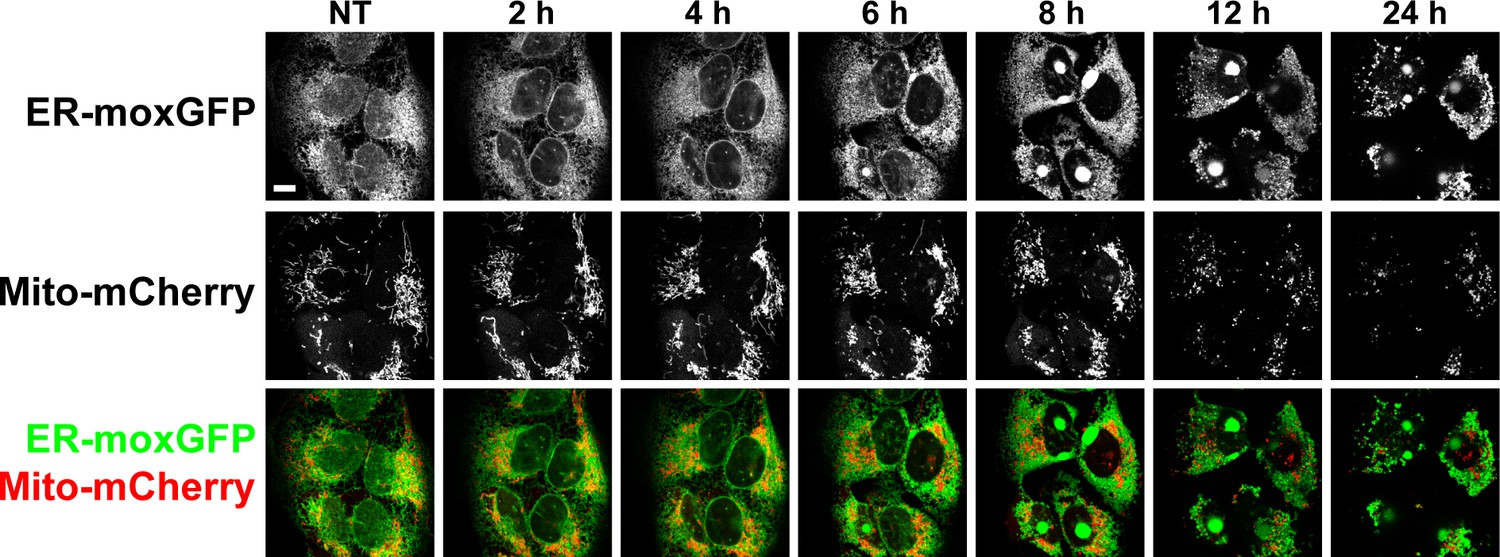
The DAC (S)–3 triggers ER-swelling and mitochondrial fission.
U2OS stably co-expressing a GFP variant addressed and retained in the endoplasmic reticulum and mCherry addressed to mitochondria were treated with 1 µM (S)–3 and monitored by live imaging.
Figure 4 with 1 supplement
DAC (S)–3 triggers ER-stress, ubiquitin-proteasome system inhibition and apoptosis.
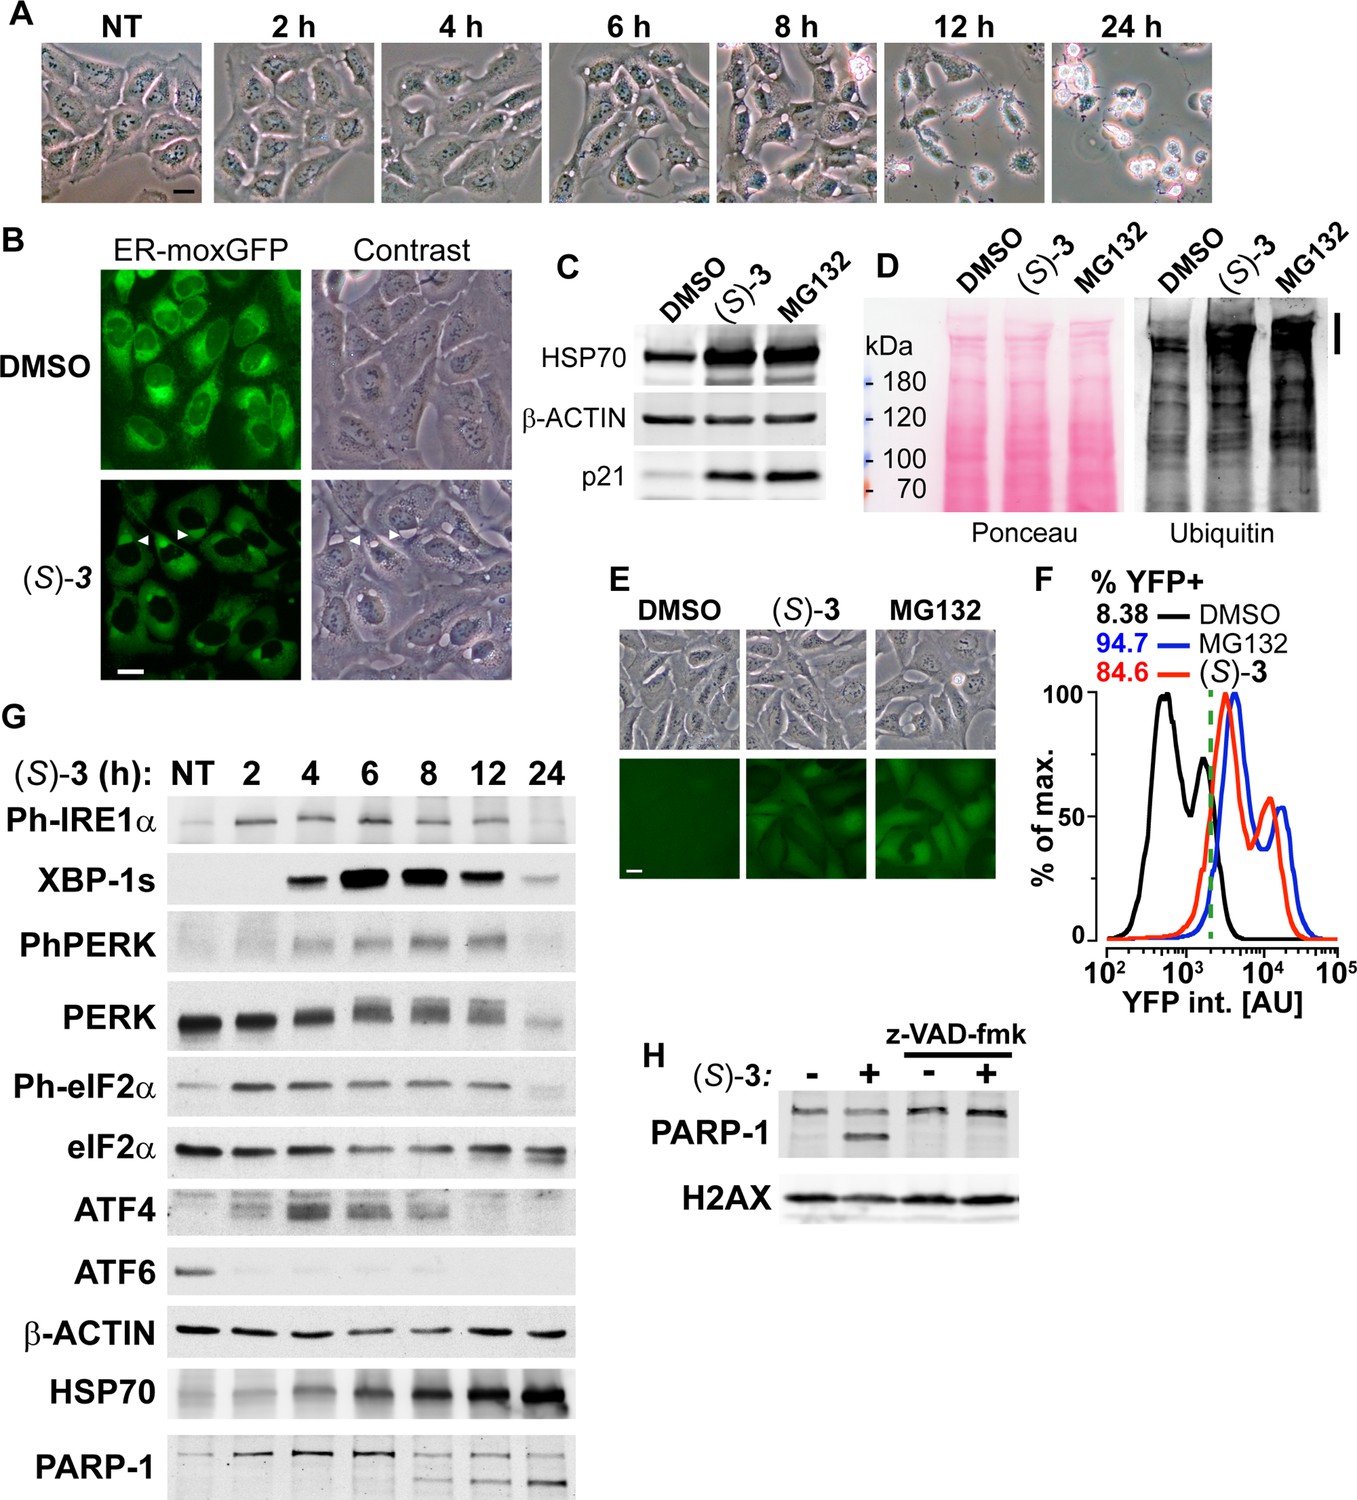
(A) U2OS stably co-expressing a GFP variant addressed and retained in the endoplasmic reticulum were treated with 1 µM (S)–3 and monitored by live imaging. Representative pictures of U2OS cells, either untreated (NT) or treated with 1 µM (S)–3 for the indicated time. (B) Representative pictures of U2OS with stably GFP-labeled endoplasmic reticulum and either untreated or treated for 8 h with 1 µM (S)–3. (C) Immunoblotting of extracts from U2OS untreated or treated with 1 µM (S)–3 or 20 µM MG132 for 8 h. (D) Immunoblotting of ubiquitin in extracts from U2OS untreated or treated with 1 µM (S)–3 or 20 µM MG132 for 2 h. High-molecular-weight ubiquitin conjugates are indicated by a vertical bar on the right. (E) Representative pictures of U2OS stably expressing Ub-G76V-YFP and either untreated or treated for 4 h with 1 µM (S)–3 or 20 µM MG132. (F) Analysis of YFP fluorescence by flow cytometry of U2OS Ub-G76V-YFP treated as described in (E) ,% of cells scored as positives using the vertical green bar as a threshold are indicated. (G) Immunoblotting using extracts from U2OS cells treated with 1 µM (S)–3 for increasing times, indicated in hours. To probe for all the UPR markers, the same extracts were analyzed on different immunoblots, each one with its loading control (see the source data), which were grouped in logical order on the figure to facilitate the interpretation. (H) Immunoblotting using extracts from U2OS cells treated with 1 µM (S)–3 for 12 h with or without 50 µM z-VAD-fmk.
-
Figure 4—source data 1
Source data related to Figure 4C.
The tiff files correspond to uncropped pictures of the IRDye800CW fluorescence signal acquired on a LI-COR Odyssey. The regions used to generate the figure are highlighted by back squares in the jpg file.
- https://cdn.elifesciences.org/articles/73913/elife-73913-fig4-data1-v1.zip
-
Figure 4—source data 2
Source data related to Figure 4D.
The tiff files correspond to an uncropped picture of the IRDye800CW fluorescence signal, acquired on an Odyssey LI-COR, and of a scan of the membrane stained with Ponceau S. The regions used to generate the figure are highlighted by back squares in the jpg file.
- https://cdn.elifesciences.org/articles/73913/elife-73913-fig4-data2-v1.zip
-
Figure 4—source data 3
Source data related to Figure 4G.
The tiff files correspond to uncropped pictures of the chemiluminescent signal acquired on a BioRad Chemidoc, of the IRDye800CW fluorescence signal acquired on a LI-COR Odyssey or of the chemiluminescent signal acquired using autoradiographic films. Several immunoblotting, labeled from a to f, of the same extracts were used to generate this figure, all with a loading control. The regions used to generate the figure are highlighted for each immunoblot by back squares in the jpg files.
- https://cdn.elifesciences.org/articles/73913/elife-73913-fig4-data3-v1.zip
-
Figure 4—source data 4
Source data related to Figure 4H.
The tiff files correspond to uncropped pictures of the IRDye800CW fluorescence signal acquired on a LI-COR Odyssey. The regions used to generate the figure are highlighted by back squares in the jpg file.
- https://cdn.elifesciences.org/articles/73913/elife-73913-fig4-data4-v1.zip
Figure 4—figure supplement 1
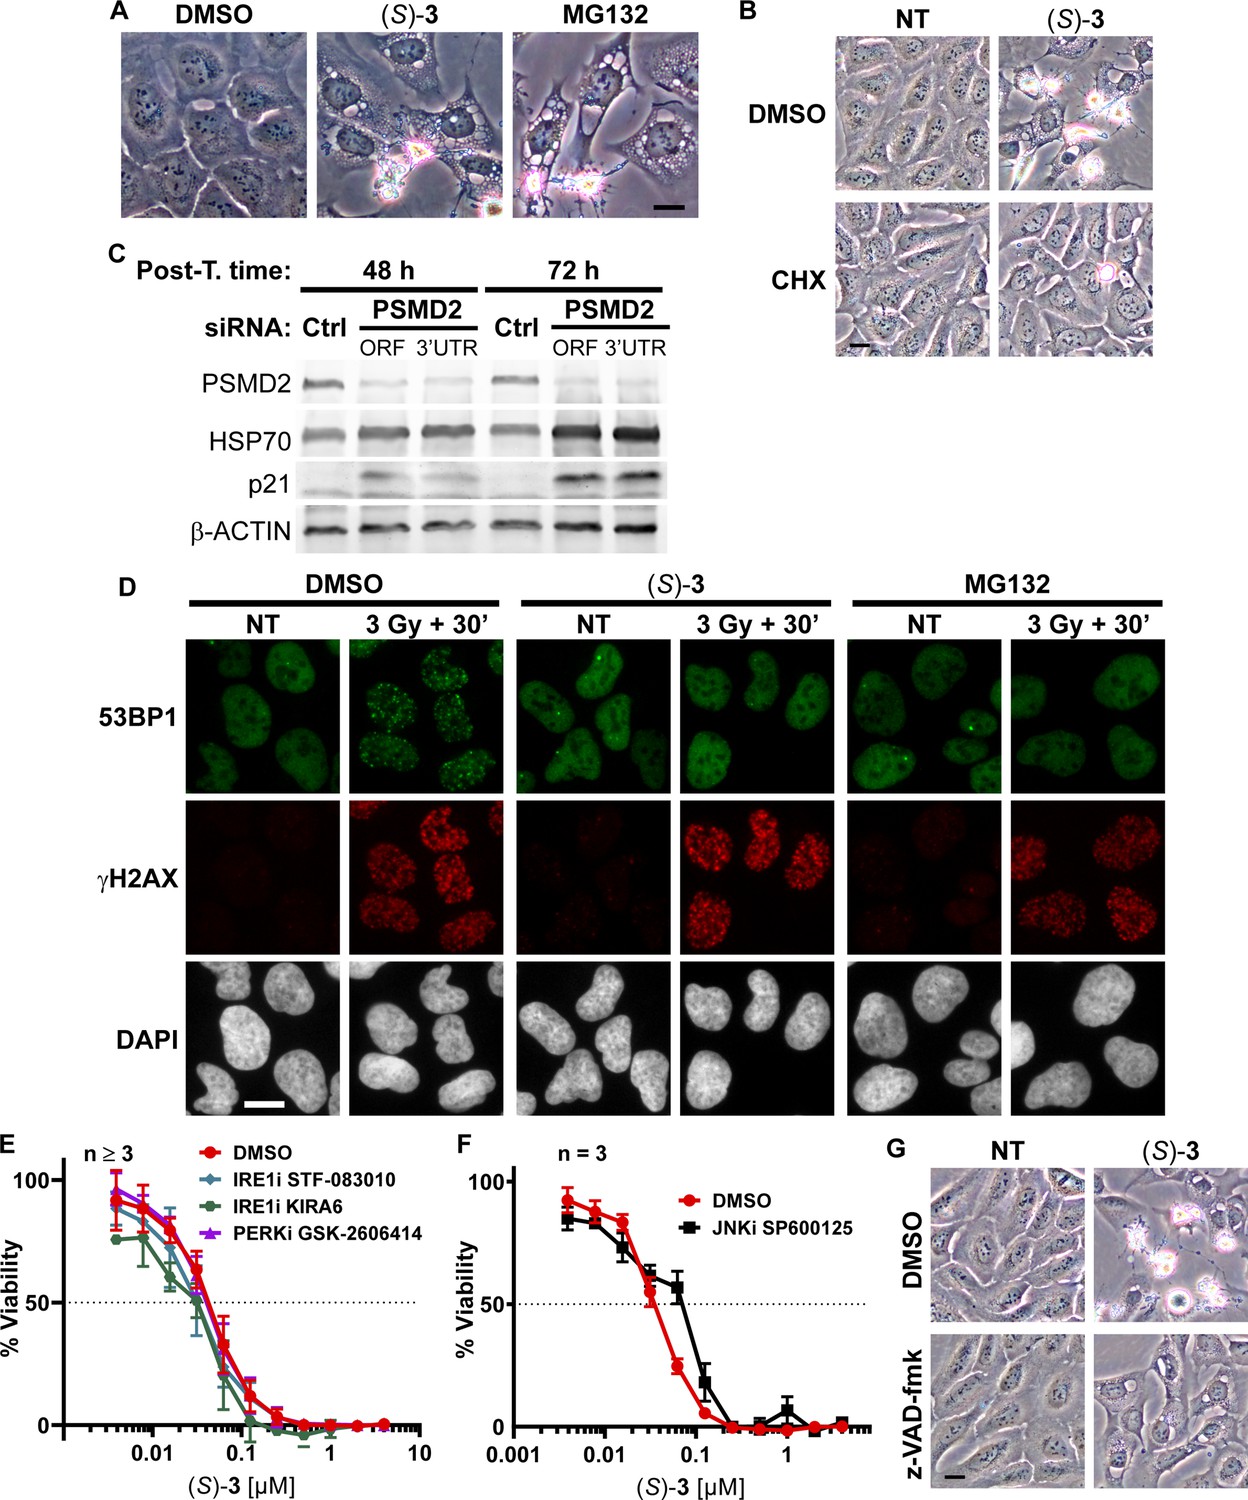
DAC (S)–3 triggers ER-stress, inhibition of the Ub-proteasome system and apoptosis.
(A) Representative micrographs of U2OS cells treated with 1 µM (S)–3 or 20 µM proteasome inhibitor MG-132 for 12 h. The black scale bar represents 10 µm. (B) Representative micrographs of U2OS cells treated for 12 h with 1 µM (S)–3 without or with 20 µg/ml translation inhibitor cycloheximide (CHX) which was pre-incubated 1 h with the cells before addition of (S)–3. The black scale bar represents 10 µm. (C) Analysis by immunoblotting of extracts from U2OS cells 48 or 72 h after transfection by control siRNA (Ctrl) or siRNA targeting PSMD2. (D) Representative micrographs of U2OS cells treated or not for 2 h with 1 µM (S)–3 or 20 µM MG132 and irradiated or not with 3 Gy of X-rays, post-incubated for 30 min, fixed and stained for the DNA damage markers gammaH2AX and the 53BP1 protein. Assembly of 53BP1 into foci relies on active ubiquitination at sites of DNA damage. The white scale bar represents 10 µm. (E) Cell viability analysis of U2OS cells pre-treated for 1 hr with 50 µM STF-083010 (IRE1α endonuclease inhibitor), 1 µM KIRA6 (IRE1α kinase inhibitor) or 0.5 µM GSK-2606414 (PERK inhibitor) before being co-treated with (S)–3 for 72 h. (F) Cell viability analysis of U2OS cells pre-treated for 1 h with 10 µM SP600125 (JNK inhibitor) before being co-treated with (S)–3. (G) Representative micrographs of U2OS cells treated or not with 1 µM (S)–3 with or without 50 µM z-VAD-fmk for 12 h. The black scale bar represents 10 µm.
-
Figure 4—figure supplement 1—source data 1
Source data related to Figure 4—figure supplement 1C.
The tiff files correspond to uncropped pictures of the IRDye800CW fluorescence signal acquired on a LI-COR Odyssey. The regions used to generate the figure are highlighted by back squares in the jpg file.
- https://cdn.elifesciences.org/articles/73913/elife-73913-fig4-figsupp1-data1-v1.zip
Figure 5 with 2 supplements
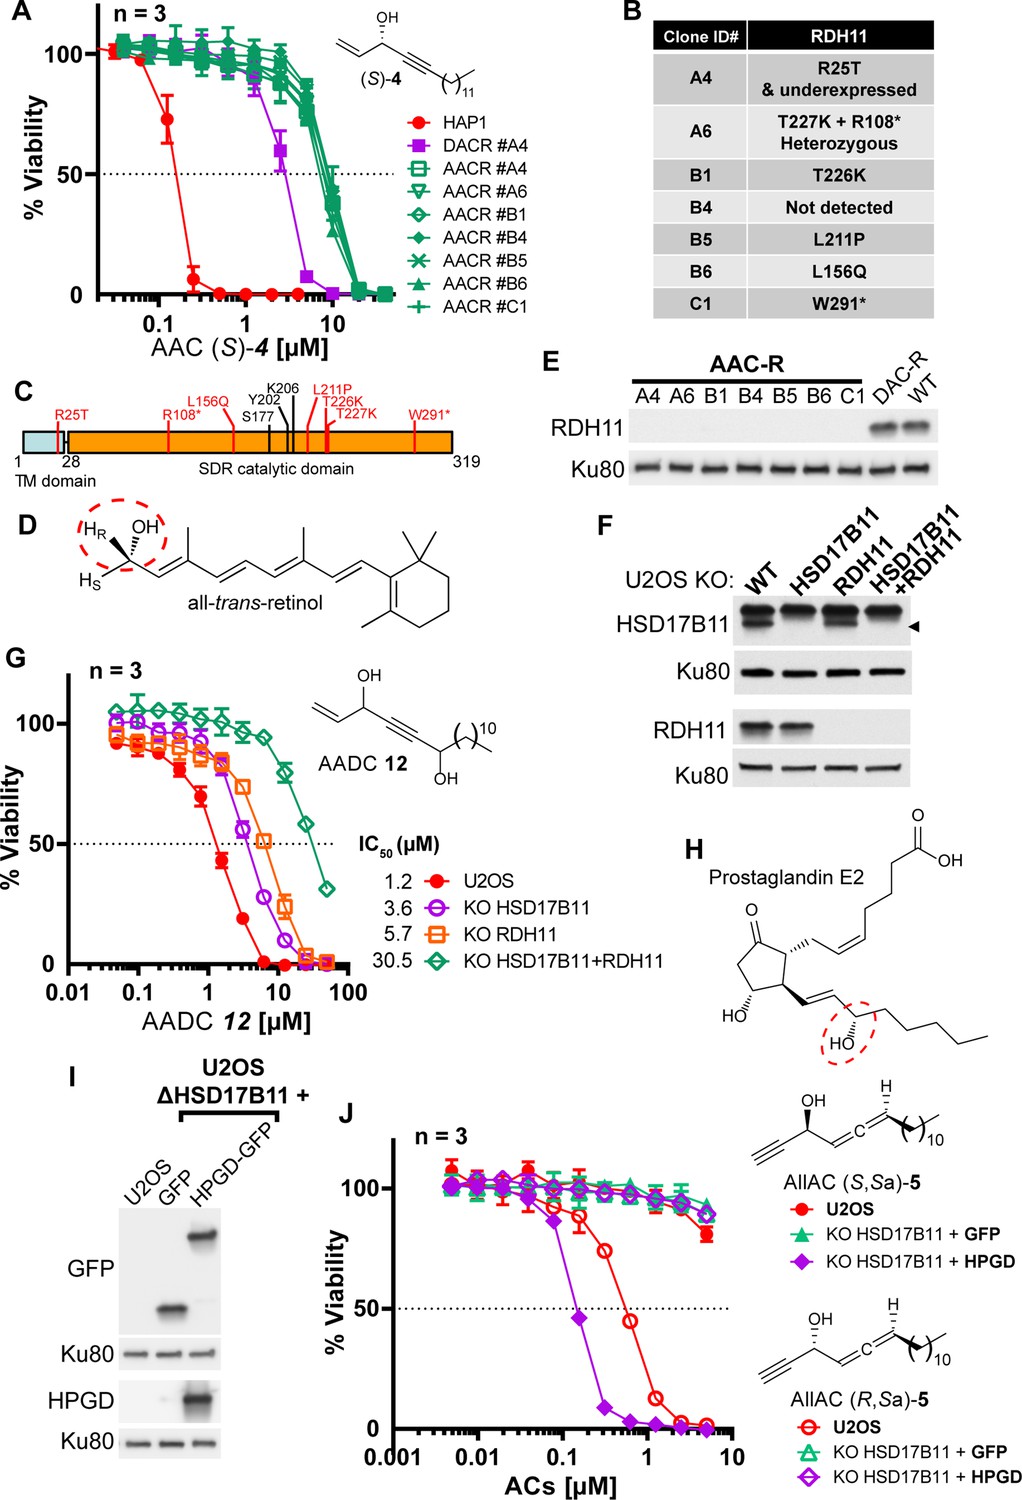
Bioactivation of other lipidic alkynylcarbinols by specific SDRs.
(A) Cell viability analysis of wild-type HAP-1, DACR clone A4 and AACR clones treated with AAC (S)–4. (B) List of mutations identified on RDH11 by RNA-seq of individual AACR clones. (C) Schematic representation of RDH11 with, in red, the positions of the mutations identified and, in black, the three amino acids critical for catalysis. TM = single-pass transmembrane domain. (D) Structure of all-trans-retinol, a substrate for RDH11. (E) Analysis by immunoblotting of RDH11 levels in wild-type HAP-1, in DACR clone A4 and in the different AACR clones. (F) Analysis by immunoblotting of RDH11 and HSD17B11 levels in wild-type U2OS or clones inactivated for either HSD17B11, RDH11 or both. (G) Cell viability analysis of wild-type U2OS or U2OS clones inactivated for HSD17B11, RDH11, or both and treated with AADC 12. (H) Structure of prostaglandin E2, a substrate of HPGD. (I) Analysis by immunoblotting of GFP and HPGD levels in WT U2OS or U2OS KO HSD17B11 stably complemented with GFP or HPGD-GFP. (J) Cell viability analysis of U2OS or U2OS inactivated for HSD17B11, stably complemented with either HSD17B11-GFP or HPGD-GFP and treated for 72 h with AllAC (S,Sa)- or (R,Sa)–5.
-
Figure 5—source data 1
Source data related to Figure 5E.
The tiff files correspond to uncropped pictures of the chemiluminescent signal acquired on a BioRad Chemidoc. The regions used to generate the figure are highlighted by back squares in the jpg file, which also contains at the bottom an overlay with a picture of the membrane to locate the protein ladder positions.
- https://cdn.elifesciences.org/articles/73913/elife-73913-fig5-data1-v1.zip
-
Figure 5—source data 2
Source data related to Figure 5F.
The tiff files correspond to uncropped pictures of the chemiluminescent signal acquired using autoradiographic films. Two different immunoblotting of the same extracts were used for this figure (respectively labeled upper and lower). The regions used to generate the figure are highlighted for each immunoblot by back squares in the jpg files.
- https://cdn.elifesciences.org/articles/73913/elife-73913-fig5-data2-v1.zip
-
Figure 5—source data 3
Source data related to Figure 5I.
The tiff files correspond to uncropped pictures of the chemiluminescent signal acquired on a BioRad Chemidoc. The same extracts were loaded twice (left and right part of the membrane) and the membrane sliced to simultaneously probe GFP and HPGD. The regions used to generate the figure are highlighted by back squares in the jpg file, which also contains overlays of the chemiluminescent signal with a picture of the membrane to locate the protein ladder positions.
- https://cdn.elifesciences.org/articles/73913/elife-73913-fig5-data3-v1.zip
Figure 5—figure supplement 1
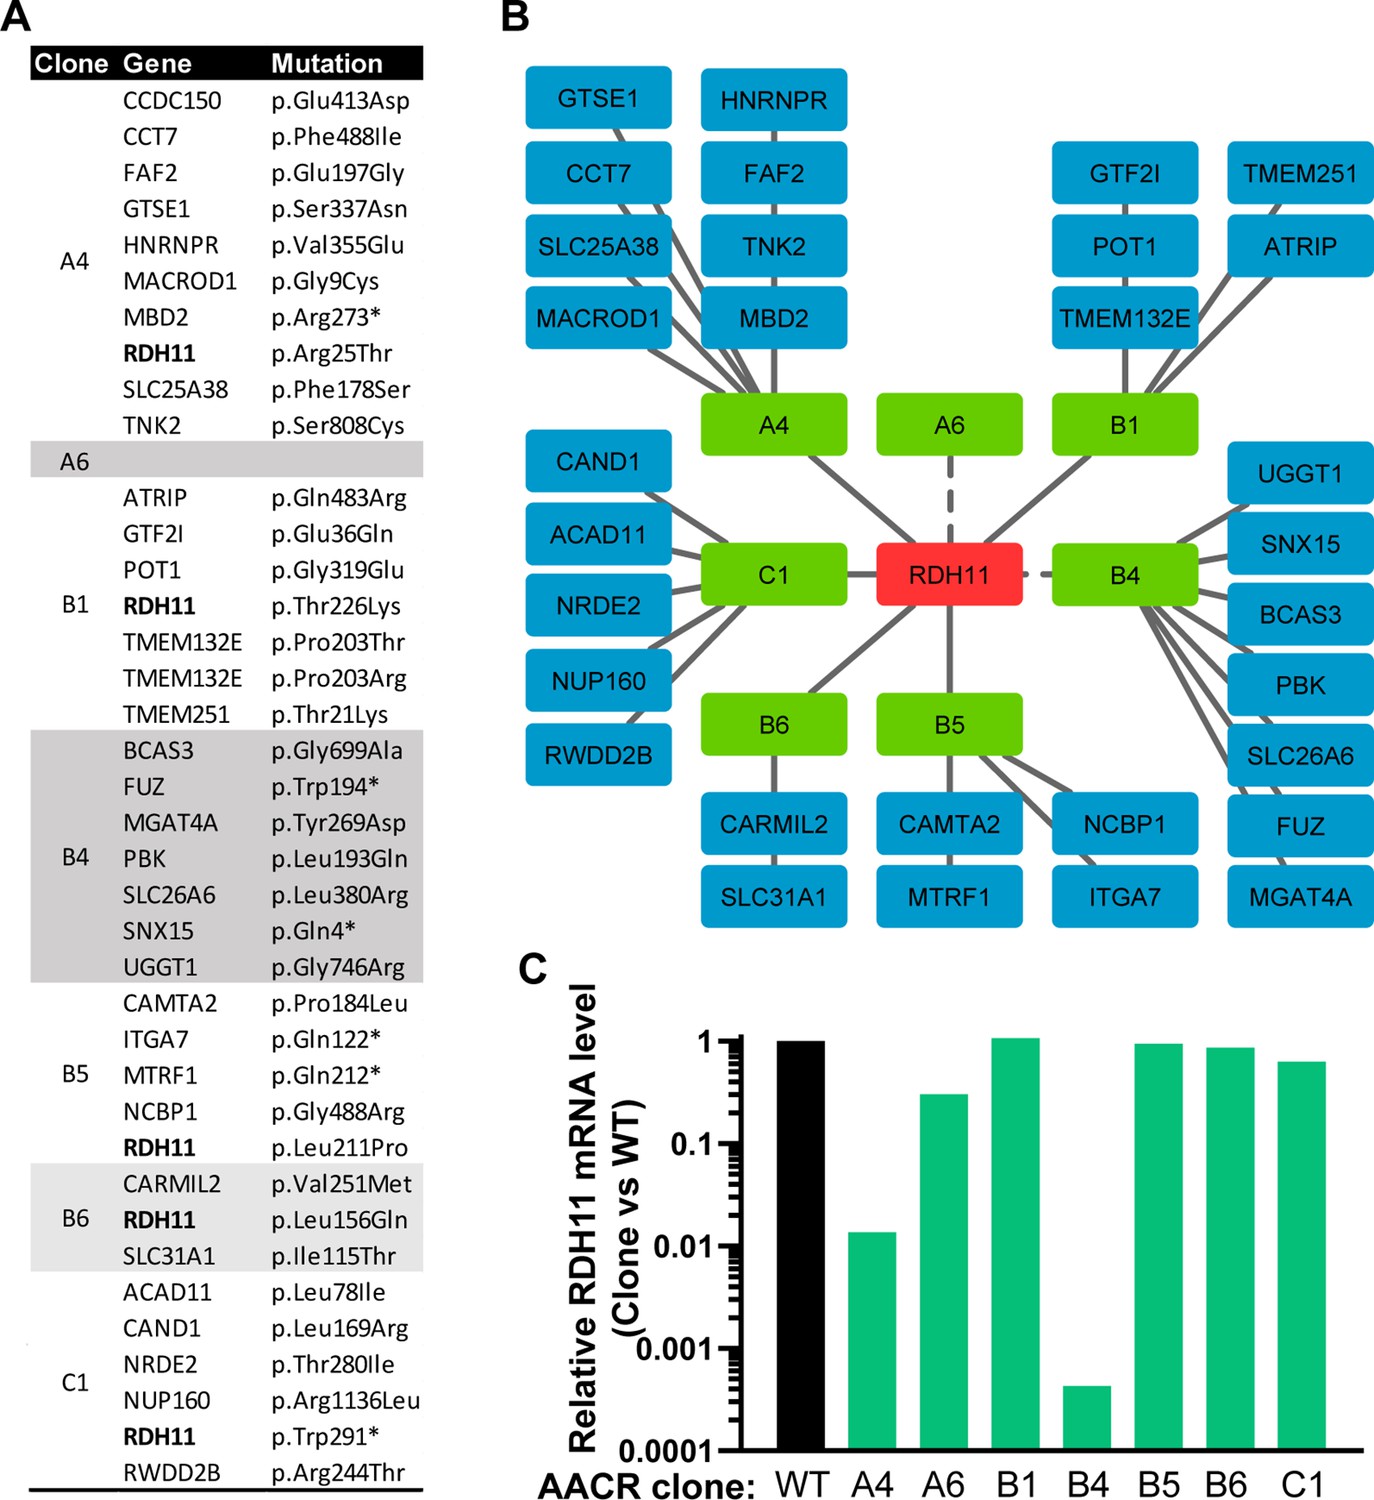
RDH11 is mutated or underexpressed in all AACR clones.
(A) List of genes carrying near homozygous non- or mis-sense mutations in each of the seven AACR clones analyzed by RNA-seq. For each gene, the impact on the protein sequence is specified. (B) Graphical representation of the genes identified as mutated in each clone. The only gene mutated in more than four clones is highlighted in red. The dashed lines indicate that RDH11 is not expressed in the AACR#B4 clone and carries two heterozygous mutations, T227K and R108* in clone AACR#A6. (C) Histogram representing the ratio between the normalized levels (RPKM) of RDH11 mRNA in each mutant clone as compared to the wild-type HAP-1.
Figure 5—figure supplement 2
RDH11 bioactivates preferentially (S)-AAC over (S)-DAC.
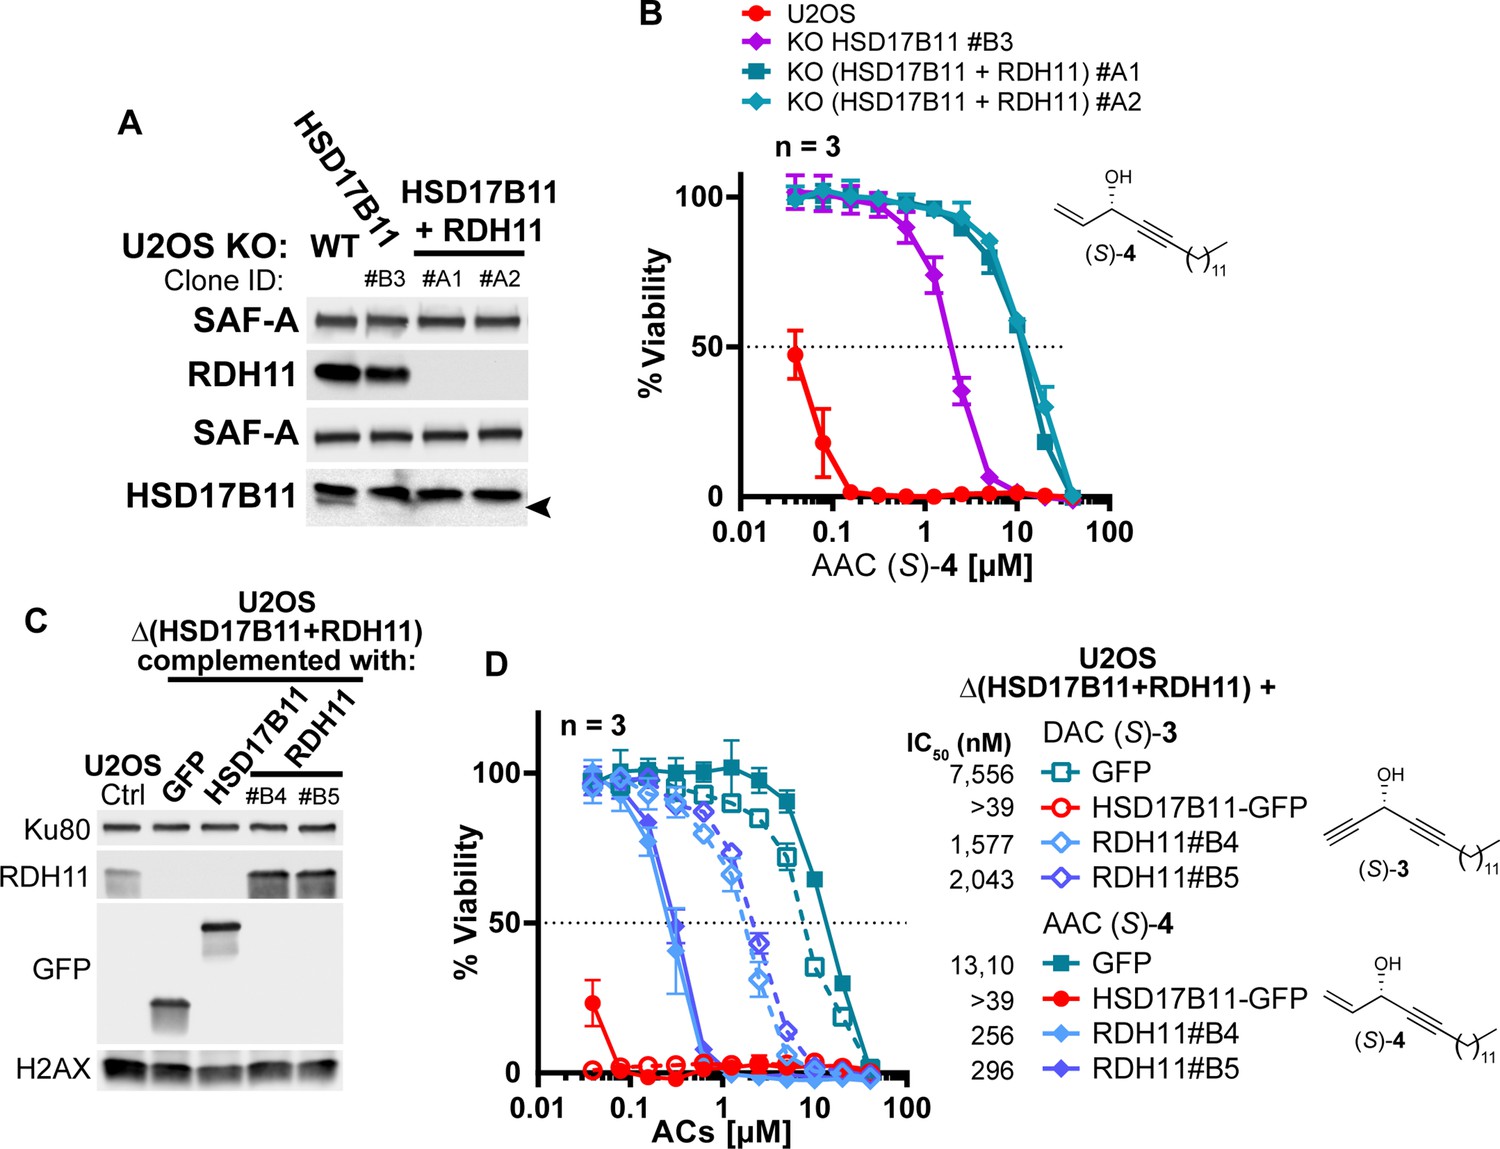
(A) Analysis by immunoblotting of RDH11 and HSD17B11 levels in wild-type U2OS or U2OS inactivated for HSD17B11 (clone B3) or inactivated for both HSD17B11 and RDH11. SAF-A was used as a loading control. (B) Cell viability analysis of U2OS either wild-type, inactivated for HSD17B11 or for both HSD17B11 and RDH11, as described in (A), treated with AAC (S)–4 for 72 h. (C) Analysis by immunoblotting of RDH11 levels in U2OS either wild-type or inactivated for both HSD17B11 and RDH11 using CRISPR/Cas9 and stably complemented with GFP, HSD17B11-GFP or untagged RDH11 (two different clones). Ku80 and total H2AX were used as loading control. (D) Cell viability analysis of U2OS inactivated for HSD17B11 and RDH11, stably complemented as described in (C) and treated with DAC (S)–3 or AAC (S)–4.
-
Figure 5—figure supplement 2—source data 1
Source data related to Figure 5—figure supplement 2A.
The tiff files correspond to uncropped pictures of the chemiluminescent signal acquired on a BioRad Chemidoc. Two different immunoblotting of the same extracts were used for this figure (respectively labeled upper and lower). The regions used to generate are highlighted for each immunoblot by back squares in the jpg files, which also contain at the bottom an overlay with a picture of the membrane to locate the protein ladder positions.
- https://cdn.elifesciences.org/articles/73913/elife-73913-fig5-figsupp2-data1-v1.zip
-
Figure 5—figure supplement 2—source data 2
Source data related to Figure 5—figure supplement 2C.
The tiff files correspond to uncropped pictures of the chemiluminescent signal acquired on a BioRad Chemidoc. Two different immunoblotting of the same extracts were used for this figure (respectively labeled upper and lower). The regions used to generate the figure are highlighted for each immunoblot by back squares in the jpg files, which also contain at the bottom an overlay with a picture of the membrane to locate the protein ladder positions.
- https://cdn.elifesciences.org/articles/73913/elife-73913-fig5-figsupp2-data2-v1.zip
Figure 6 with 1 supplement
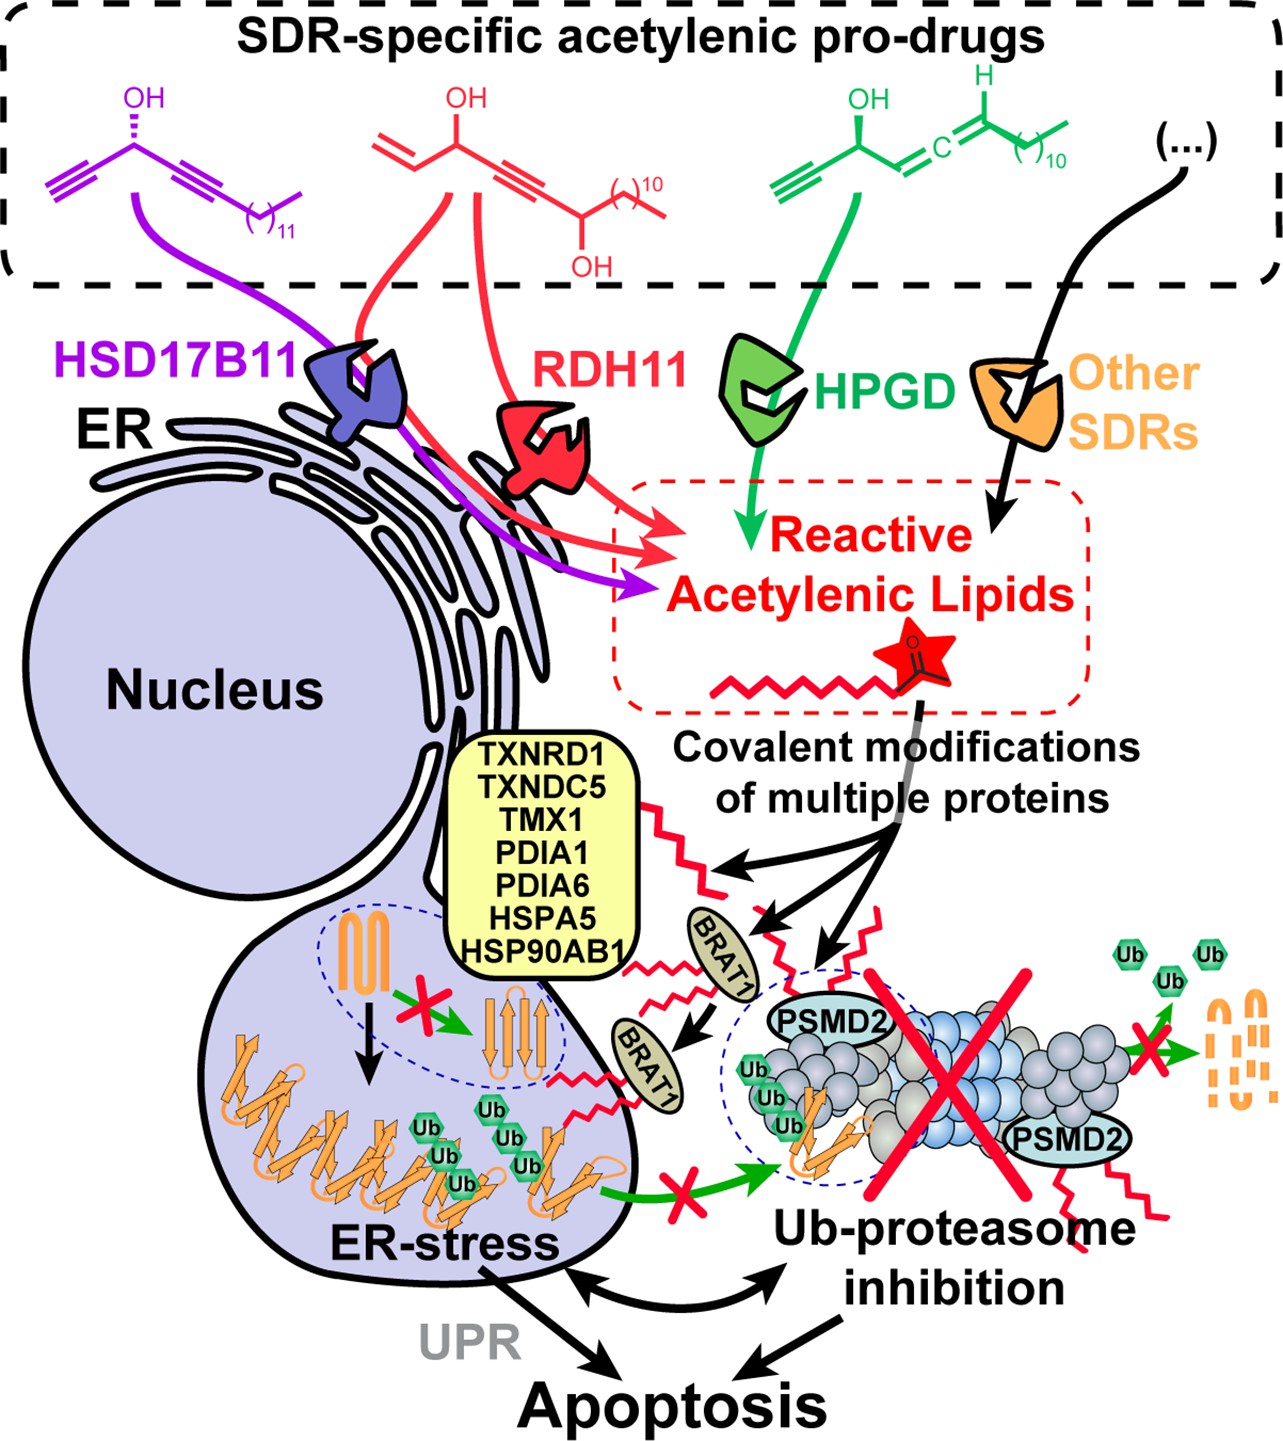
Model depicting the stereospecific bioactivation of alkynylcarbinol-containing compounds by specific SDRs into cytotoxic protein-reactive species.
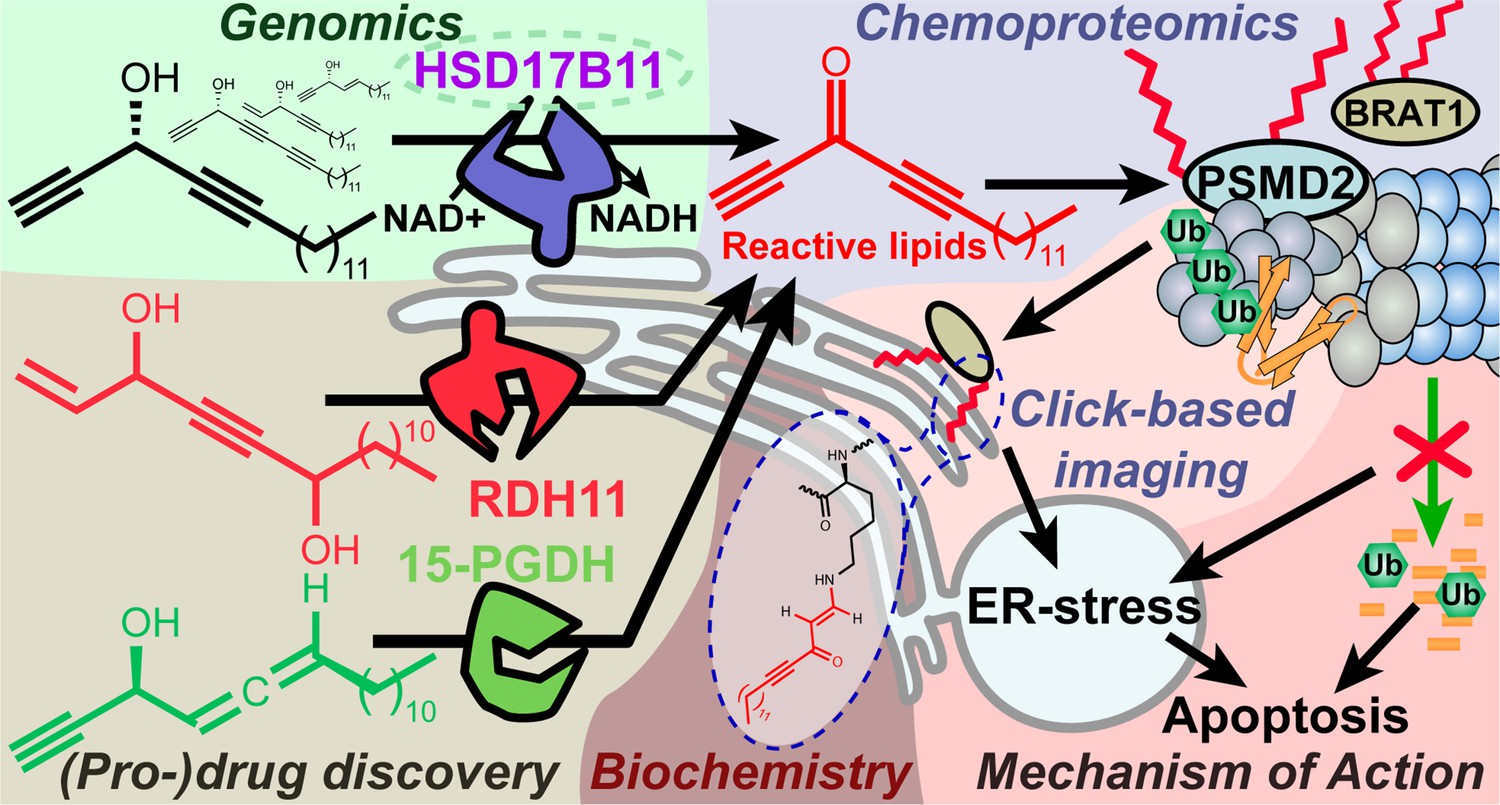
The protein reactive species generated upon bioactivation modify several proteins including the essential 26 S proteasome subunit PSMD2, thereby triggering Ub-proteasome system (UPS) inhibition, ER-stress, activation of the Unfolded Protein Response (UPR) and cell death mediated by apoptosis. See Figure 6—figure supplement 1 for a graphical abstract depicting the main findings and techniques used.
Figure 6—figure supplement 1
Graphical abstract.
Videos
Video 1
This video corresponds to a time lapse of pictures of U2OS cells stably expressing ER-moxGFP and Mito-mCherry and treated with 1 µM (S)-.
Pictures were acquired every 40 min for 1040 min.
Additional files
-
Transparent reporting form
- https://cdn.elifesciences.org/articles/73913/elife-73913-transrepform1-v1.pdf
-
Supplementary file 1
Amino acid selectivity of the reaction between DACones and proteins in U2OS extracts.
- https://cdn.elifesciences.org/articles/73913/elife-73913-supp1-v1.xlsx
-
Supplementary file 2
Positions on proteins of the lysines and cysteines modified by DACones in U2OS extracts.
- https://cdn.elifesciences.org/articles/73913/elife-73913-supp2-v1.xlsx
-
Supplementary file 3
List of proteins identified as modified by the (S)-DAC 9 in U2OS cells.
- https://cdn.elifesciences.org/articles/73913/elife-73913-supp3-v1.xlsx
-
Supplementary file 4
Characterization and positions of DAC adducts on proteins in (S)-DAC 9-treated U2OS cells.
- https://cdn.elifesciences.org/articles/73913/elife-73913-supp4-v1.xlsx
-
Supplementary file 5
Information regarding the plasmids generated and the oligonucleotides and antibodies used in this study.
- https://cdn.elifesciences.org/articles/73913/elife-73913-supp5-v1.xlsx
-
Supplementary file 6
NMR spectra of the novel compounds generated in this study.
- https://cdn.elifesciences.org/articles/73913/elife-73913-supp6-v1.xlsx
Download links
A two-part list of links to download the article, or parts of the article, in various formats.
Downloads (link to download the article as PDF)
Open citations (links to open the citations from this article in various online reference manager services)
Cite this article (links to download the citations from this article in formats compatible with various reference manager tools)
SDR enzymes oxidize specific lipidic alkynylcarbinols into cytotoxic protein-reactive species
eLife 11:e73913.
https://doi.org/10.7554/eLife.73913


