Reversing chemorefraction in colorectal cancer cells by controlling mucin secretion
- Renal Physiopathology Group, Vall d’Hebron Research Institute (VHIR), Spain
- Cancer Research Program, Institut Mar d'Investigacions Mèdiques, CIBERONC Hospital del Mar, Spain
- Department of Pathology, Institut Mar d'Investigacions Mèdiques, Universitat Autònoma de Barcelona, CIBERONC, Spain
- Centre for Genomic Regulation (CRG), The Barcelona Institute for Science and Technology, Spain
- Institució Catalana de Recerca i Estudis Avançats (ICREA), Spain
Figures
Figure 1 with 1 supplement
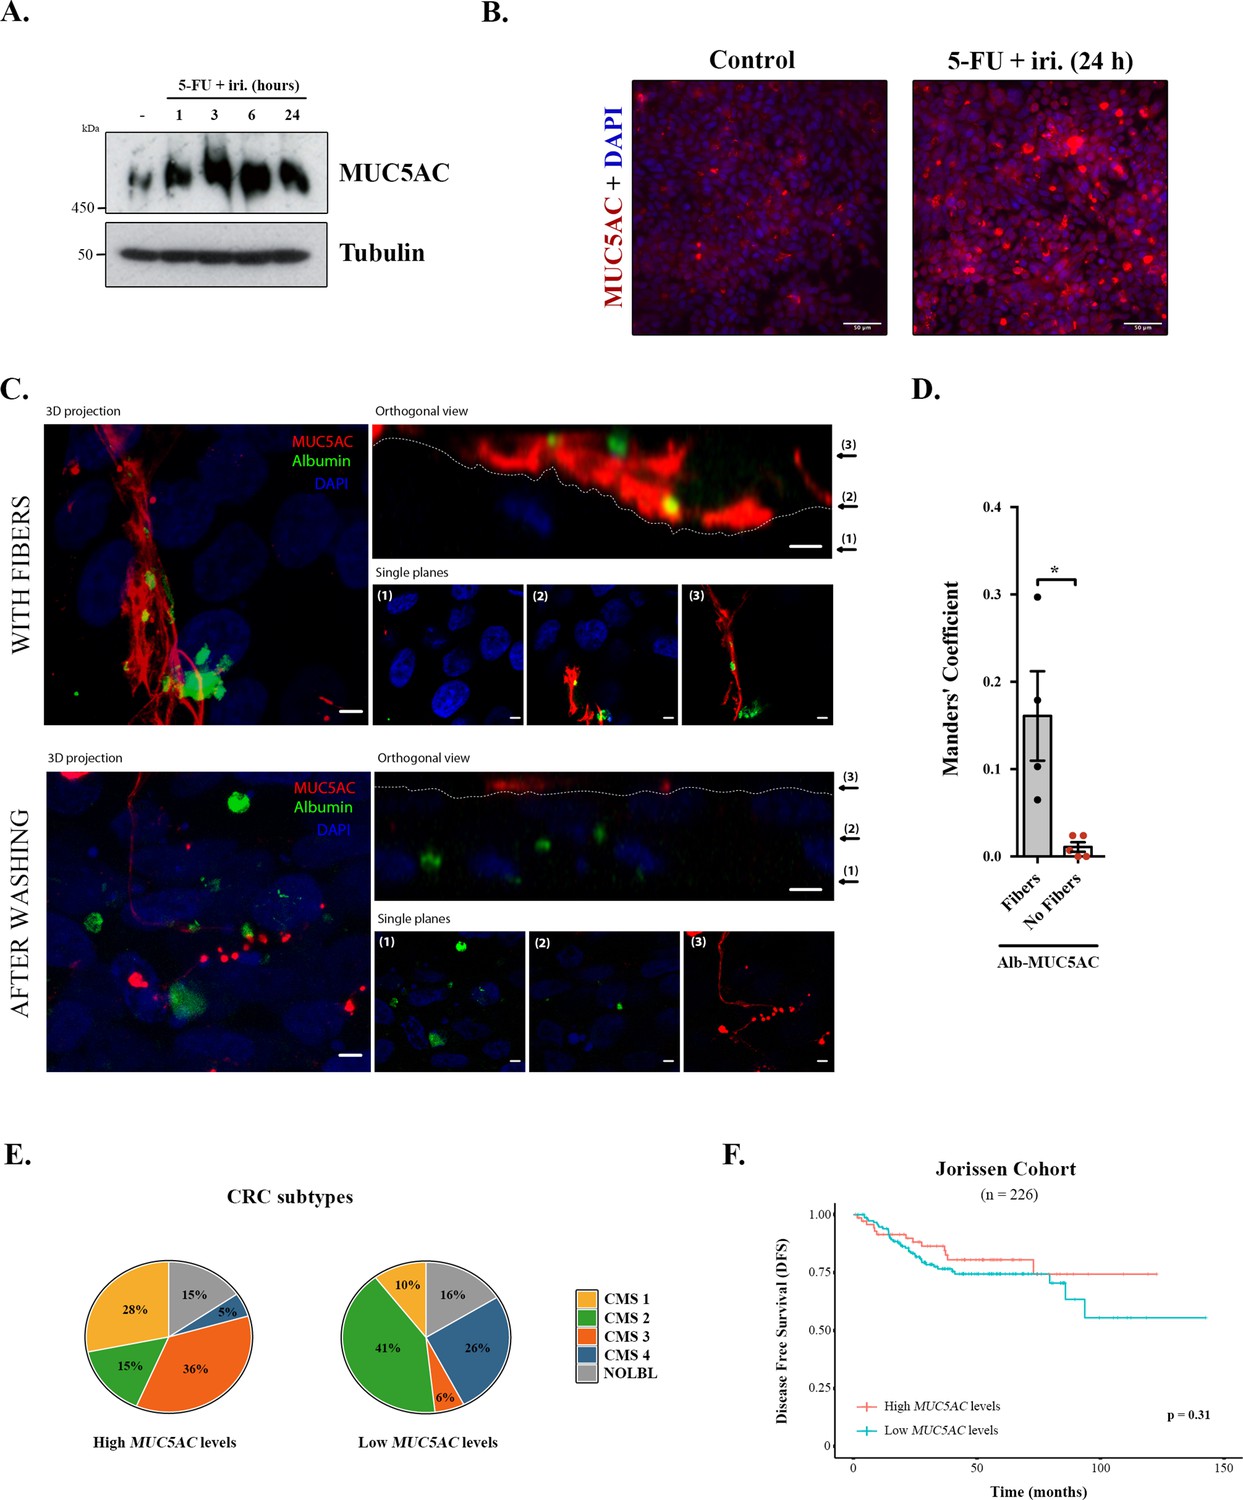
Mucins in colorectal cancer.
(A) Cell lysates from differentiated HT29-M6 cells treated with 5-fluorouracil + irinotecan (5-FU + iri.) (50 µg/mL 5-FU + 20 µg/mL iri.) for 24 hr were analysed by Western blot with an anti-MUC5AC to test expression levels. Tubulin was used as a loading control. (B) Immunofluorescence Z-stack projections of differentiated HT29-M6 cells treated with vehicle (control) or 5-FU + iri. (50 µg/mL 5-FU + 20 µg/mL irinotecan) for 24 hr. Cells were stained with anti-MUC5AC (red) and DAPI (blue). Scale bar = 50 µm. (C) Differentiated HT29 cells were treated with 100 µM ATP for 30 min, washed extensively (upper panel) or smoothly (lower panel), and incubated with Alexa Fluor 488-labelled albumin for 1 hr. Cells were stained with anti-MUC5AC antibody (red) and DAPI (blue). In the orthogonal view, dotted lines across the images demarcate the top surface of the cell. Scale bars correspond to 5 µm. (D) Colocalization between MUC5AC and albumin was calculated from immunofluorescence images by Manders’ coefficient using Fiji. Average values ± SEM are plotted as scatter plot with bar graph. The y-axis represents Manders’ coefficient of the fraction of albumin overlapping with MUC5AC (N ≥ 3). (E) Consensus molecular subtype (CMS) distribution of high and low MUC5AC-expressing colorectal tumours (Jorissen cohort). (F) Disease-free survival (DFS) of colorectal cancer patients with high (n = 73) or low (n = 153) MUC5AC levels (Jorissen cohort). NOLBL: samples without a defined CMS subtype (tumours with no label). *p<0.05, **p<0.01.
-
Figure 1—source data 1
Uncropped gels for Figure 1.
- https://cdn.elifesciences.org/articles/73926/elife-73926-fig1-data1-v2.zip
Figure 1—figure supplement 1

Experimental design for measuring mucin production after treatment.
(A) Schematic diagram of the experimental set-up to measure mucin production after 5-fluorouracil + irinotecan (5-FU + iri.) treatment.
Figure 2 with 1 supplement
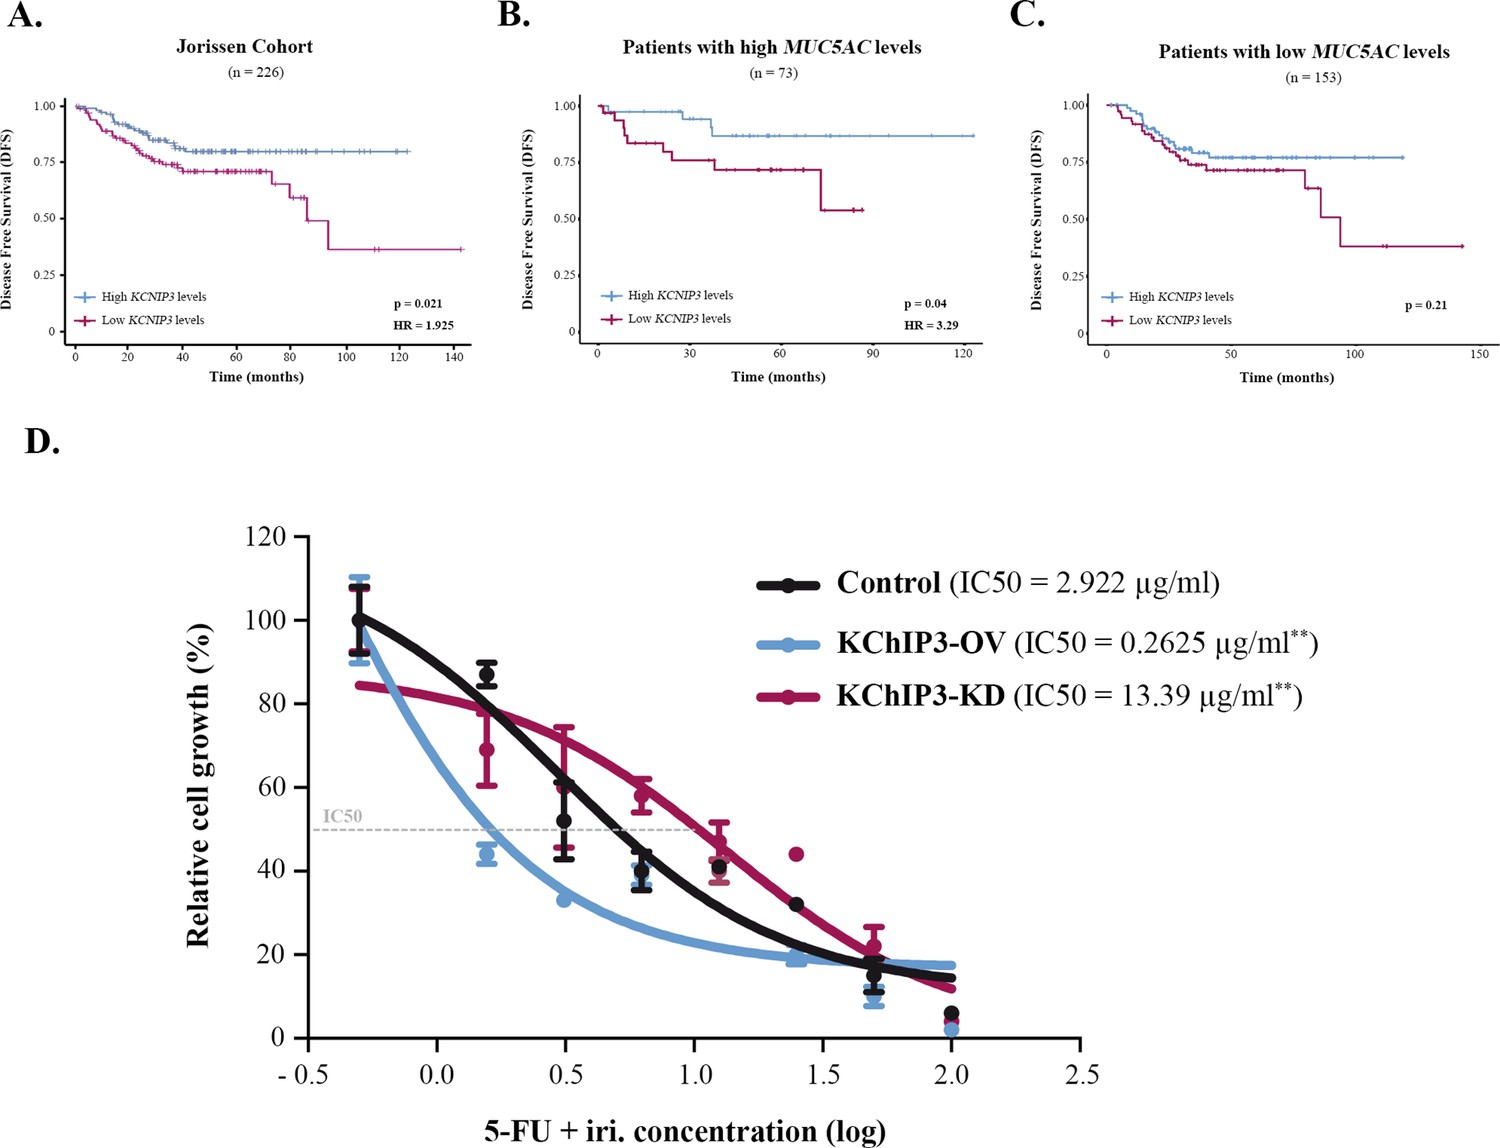
KChIP3 is a prognostic marker of colorectal cancer (CRC).
(A–C) Disease-free survival (DFS) according to KChIP3 levels of CRC patients (low KChIP3 levels, n = 120; high KChIP3 levels, n = 106) (A), CRC patients with high MUC5AC levels (low KChIP3 levels, n = 39; high KChIP3 levels, n = 34) (B), or CRC with low MUC5AC levels (low KChIP3 levels, n = 81; high KChIP3 levels, n = 72) (C). (D) Differentiated control (black), KChIP3-overexpressing cells (KCNIP3-OV, blue) and KChIP3-depleted cells (KCNIP3-KD, red) were treated for 72 hr with increasing concentrations of 5-fluorouracil + irinotecan (5-FU + iri.). Average values ± SEM are plotted as scatter plot (N > 3). The y-axis represents the percentage of cell growth relative to the lowest concentration of 5-FU + iri. The IC50 was calculated from the interpolated curve. HR, hazard ratio. *p<0.05, **p<0.01.
Figure 2—figure supplement 1

Expression of mucins in patients.
(A) Expression levels of secreted mucins MUC2, MUC5AC, MUC5B, MUC6, MUC7, and MUC19. Each dot represents a different patient. Patients GSM358532, GSM358535, and GSM358538 are highlighted in green, blue, and red, respectively. (B) Disease-free survival (DFS) of colorectal cancer patients with high (n = 73) or low (n = 153) MUC2 levels (Jorissen cohort). (C) DFS according to KChIP3 levels of colorectal cancer patients with high MUC2 expression (low KChIP3 levels, n = 27; high KChIP3 levels, n = 30).
Figure 3
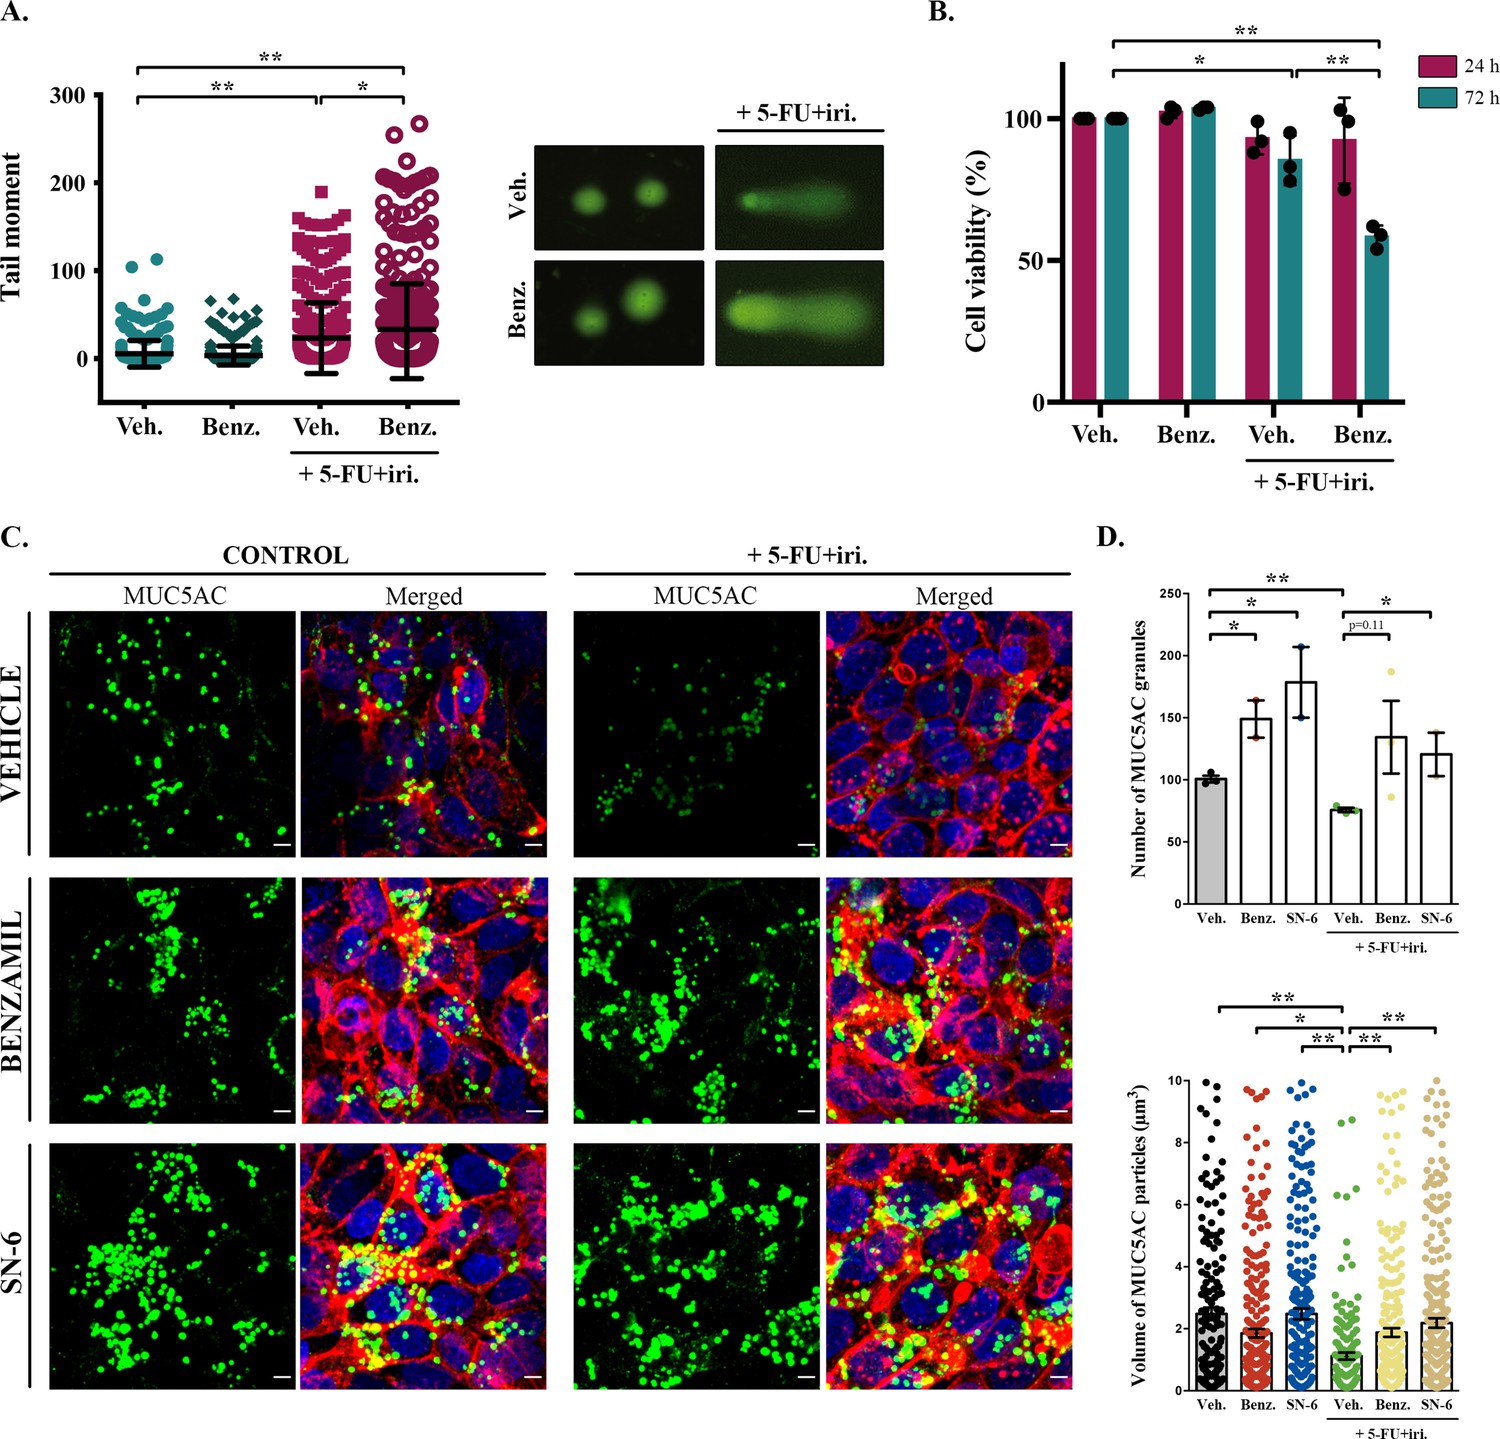
Inhibition of sodium/calcium exchangers (NCXs) enhances cell death by 5-fluorouracil + irinotecan (5-FU+ iri.).
(A) Comet assay of HT29-M6 cell line treated with 5-FU + iri. (25 µg/mL 5-FU + 10 µg/mL irinotecan) and 20 µM benzamil, alone or in combination. The tail moment was measured after 72 hr of treatment (N > 3). (B) Quantification of cell viability in HT29-M6 cell line after treatment (24 or 72 hr) with 5-FU + iri. (10 µg/mL 5-FU + 4 µg/mL Irinotecan) and 20 µM benzamil, alone or in combination (N ≥ 3). (C) Immunofluorescence Z-stack projections of differentiated HT29-M6 cells treated with vehicle, 20 µM benzamil, or 10 µM SN-6 in the presence or absence of 5-FU + iri. Cells were stained with anti-MUC5AC (green), phalloidin (red), and DAPI (blue). Scale bar = 5 µm. (D) Quantification of the number (upper graph) and volume (lower graph) of MUC5AC granules from immunofluorescence images by confocal microscope. Average values ± SEM are plotted as scatter plot with bar graph (N ≥ 3). Veh., vehicle; Benz., benzamil. *p<0.05, **p<0.01.
Figure 4 with 1 supplement

SN-6 treatment increases sensitivity of colorectal cancer (CRC)-derived cells and organoids to 5-fluorouracil + irinotecan (5-FU + iri.).
(A) Cell lysates and secreted medium of differentiated HT29-M6 cells pre-treated with a vehicle or 10 µM SN-6 inhibitor for 24 hr and then exposed to 5-FU + iri. (50 µg/mL 5-FU + 20 µg/mL iri.) for 0, 1, 3, 6, and 24 hr were analysed by Western blot with an anti-MUC5AC, anti-γH2A.X, and H3 to test their levels. Tubulin was used as a loading control. Quantification of MUC5AC and γH2A.X is included (N ≥ 3). (B) Immunofluorescence images of differentiated HT29-M6 cells treated with vehicle (control) or 10 µM SN-6 in the presence or absence of 5-FU + iri. (50 µg/mL 5-FU + 20 µg/mL irinotecan) for 24 hr. Cells were stained with anti-MUC5AC (red), anti-γH2A.X (green), and DAPI (blue). Scale bar = 50 µm. (C) Quantification of the number of γH2A.X-positive cells in the different conditions relative to the total number of cells from the immunofluorescence images (N ≥ 3). (D) CRC patient-derived organoids (PDOs) were treated for 72 hr with increasing concentrations of 5-FU + iri. with vehicle or 10 µM SN-6. Average values ± SEM are plotted as scatter plot. The y-axis represents the percentage of cell growth relative to the lowest concentration of 5-FU + iri. The IC50 was calculated from the interpolated curve (N ≥ 3). *p<0.05, **p<0.01.
-
Figure 4—source data 1
Uncropped gels for Figure 4.
- https://cdn.elifesciences.org/articles/73926/elife-73926-fig4-data1-v2.zip
Figure 4—figure supplement 1
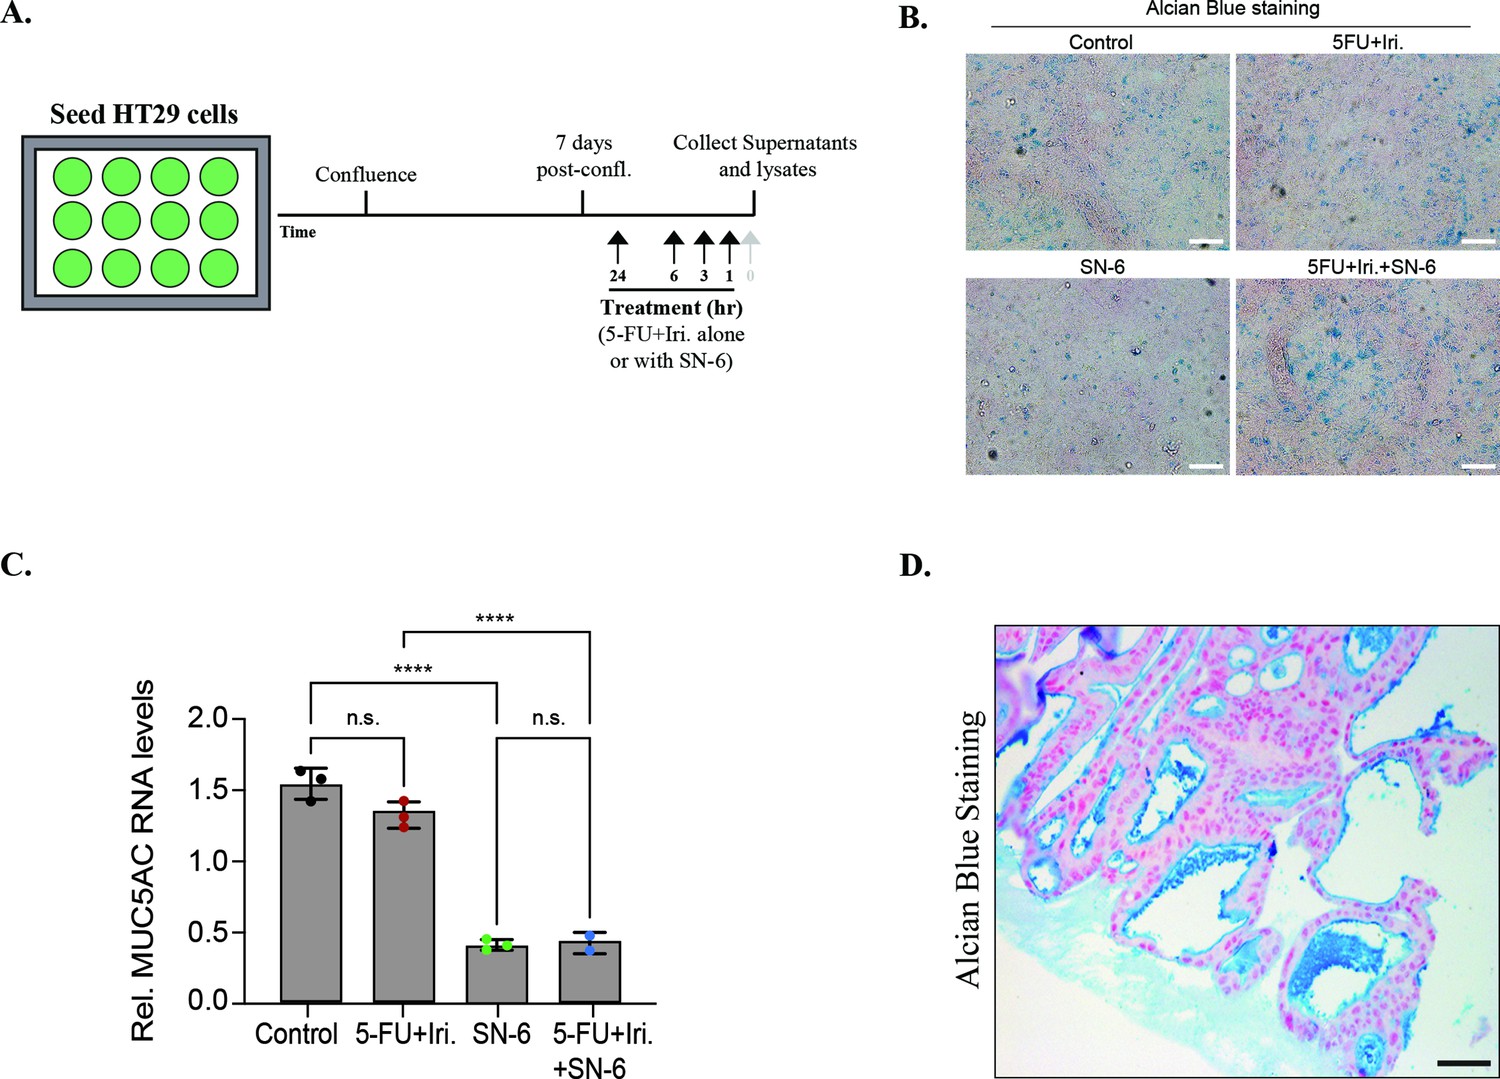
Mucins’ levels in HT29 cells and in a patient-derived organoid.
(A) Schematic diagram of the experimental set-up to measure mucin secretion and production. (B) Representative images of HT29-M6 differentiated cell (vehicle [control], 5-fluorouracil + irinotecan [5-FU+ iri.], SN-6, and 5-FU + iri. + SN-6) stained with Alcian blue. Scale bar = 50 µm. (C) Relative MUC5AC RNA levels in HT29-M6 treated with vehicle (control), 5-FU + iri., SN-6, and 5-FU + iri. + SN-6 (N = 3). (D) Alcian blue-stained patient-derived organoid to visualize external mucins (in blue). Scale bar = 50 µm.
Tables
Key resources table
| Reagent type (species) or resource | Designation | Source or reference | Identifiers | Additional information |
|---|---|---|---|---|
| Gene (Homo sapiens) | MUC5AC | Ensembl | ENSG00000215182 | |
| Gene (H. sapiens) | MUC2 | Ensembl | ENSG00000198788 | |
| Gene (H. sapiens) | MUC6 | Ensembl | ENSG00000184956 | |
| Gene (H. sapiens) | MUC5B | Ensembl | ENSG00000117983 | |
| Gene (H. sapiens) | MUC19 | Ensembl | ENSG00000205592 | |
| Gene (H. sapiens) | KCNIP3 | Ensembl | ENSG00000115041 | |
| Cell line (H. sapiens) | HT29-M6 | ATCC | CVCL_G077 | Mycoplasma free |
| Cell line (H. sapiens) | HT29-18N2 | ATCC | CVCL_5942 | Mycoplasma free |
| Antibody | Anti-MUC5AC (mouse monoclonal) | Neomarkers,Waltham, MA | Clone 45M1 | (1:1000) |
| Antibody | Anti-γH2A.X (mouse monoclonal) | Cell Signaling | #2577 | (1:1000) |
| Commercial assay or kit | CometAssay Trevigen Kit | Trevigen | 250-050K | |
| Chemical compound, drug | SN-6 | Sigma-Aldrich | SML1937-5MG | (5 µM) |
| Chemical compound, drug | Benzamil | Sigma-Aldrich | B2417-10MG | 5 µM |
Table 1
Primer sequences used for detecting mRNA for the respective genes.
| Gene | Forward primer (5′–3′) | Reverse primer (5′–3′) |
|---|---|---|
| MUC5AC | CTGGTGCTGAAGAGGGTCAT | CAACCCCTCCTACTGCTACG |
| TBP | TGCCCGAAACGCCGAATATAATC | GTCTGGACTGTTCTTCACTCTTGG |
| GAPDH | GTCATCCCTGAGCTGAACG | CTCCTTGGAGGCCATGTG |
Additional files
Download links
A two-part list of links to download the article, or parts of the article, in various formats.
Downloads (link to download the article as PDF)
Open citations (links to open the citations from this article in various online reference manager services)
Cite this article (links to download the citations from this article in formats compatible with various reference manager tools)
Reversing chemorefraction in colorectal cancer cells by controlling mucin secretion
eLife 11:e73926.
https://doi.org/10.7554/eLife.73926


