Perceptual coupling and decoupling of the default mode network during mind-wandering and reading
- Department of Psychology, University of York, United Kingdom
- McConnell Brain Imaging Centre, Montreal Neurological Institute and Hospital, McGill University, Canada
- Integrative Neuroscience and Cognition Centre (UMR 8002), Centre National de la Recherche Scientifique (CNRS) and Université de Paris, France
- Department of Psychology, Queen's University, Canada
Figures
Figure 1
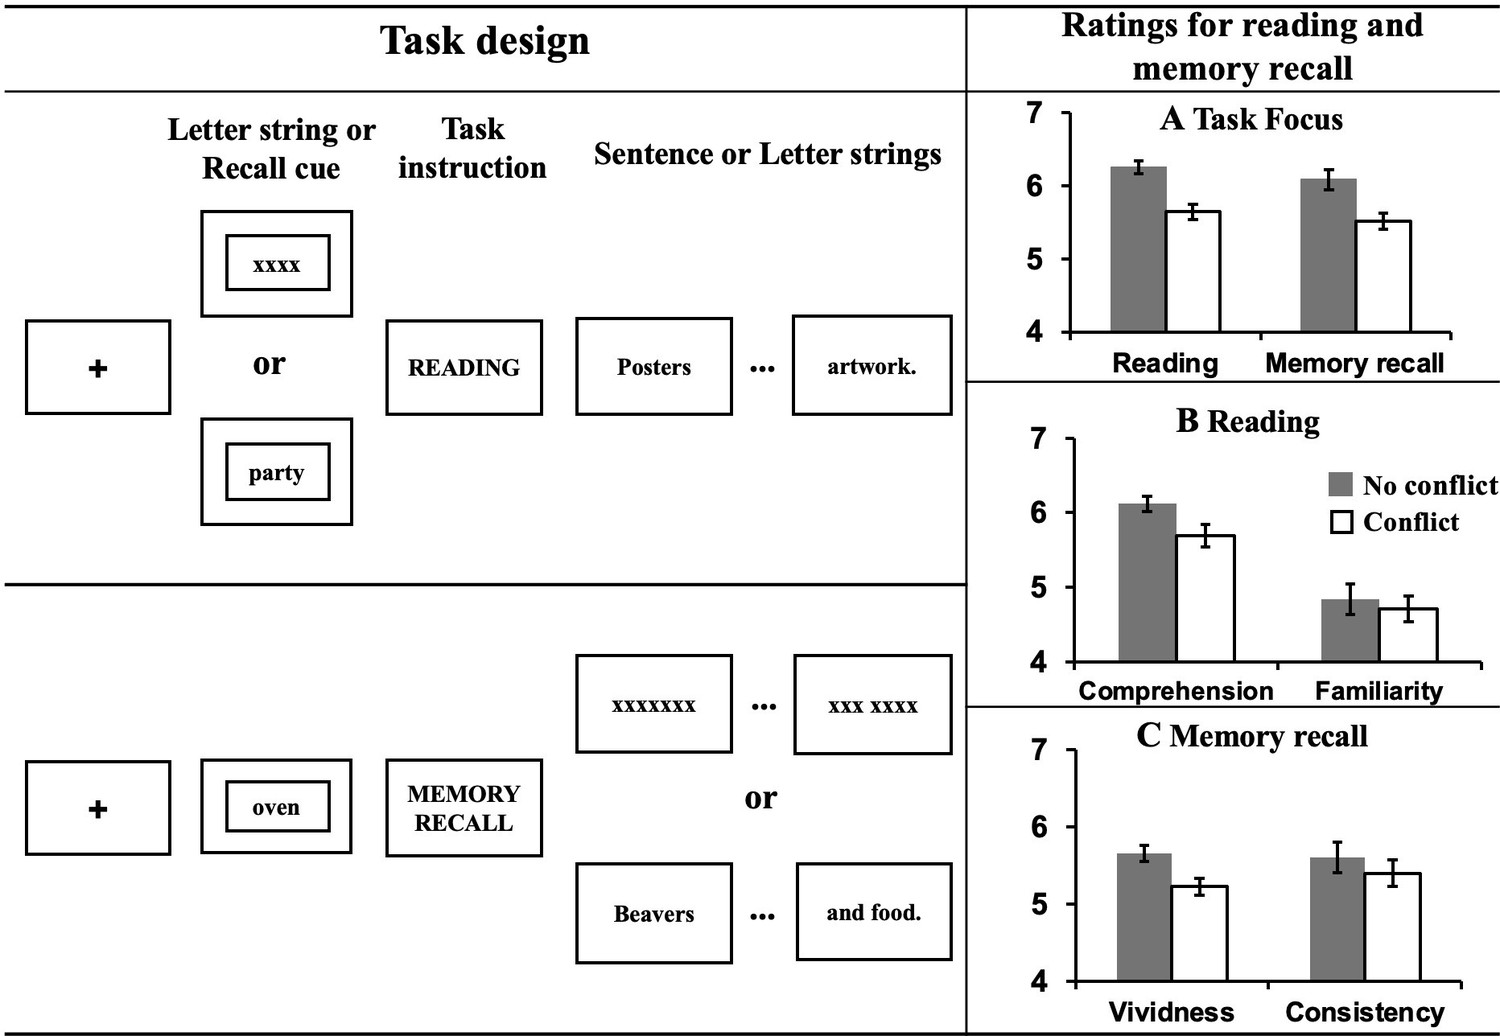
Task illustration and results of ratings.
Left hand panel: Task design of Experiment 1. Using a counterbalanced design, participants either engaged in normal reading, or instead were focused on retrieval of personally-relevant information from memory. To mimic the mind-wandering while reading state, task conflict was created by presenting sentences during memory recall, or memory cues before the presentation of sentences. To understand the effect of meaningful input on memory retrieval, on some occasions ‘X’s were presented instead of text. To understand the effect of memory retrieval on reading, sometimes no memory was cued at the start of the reading trial. Right hand panel: Evidence of mutual inhibition between reading and autobiographical memory retrieval. (A) Participants rated their task focus as lower when reading while retrieving autobiographical memories (as well as vice versa). (B) Participants rated their comprehension of written material as lower when also retrieving autobiographical information. There was no effect on participants’ ratings of their familiarity with the content of the sentences. (C) Participants rated their autobiographical memories as less vivid and less consistent with their previously generated memories when meaningful text was presented at the same time. Error bars show standard error of the mean (SEM).
Figure 2
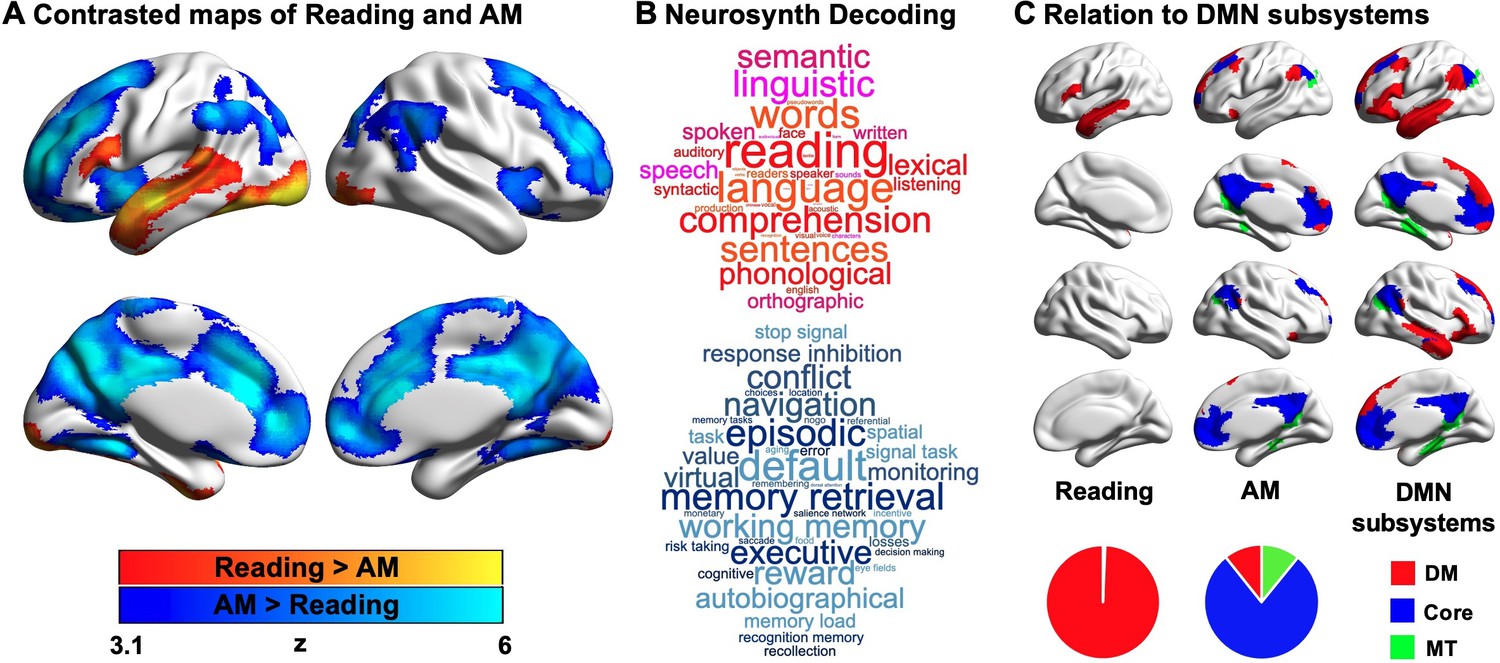
Neural activity associated with reading and autobiographical memory (AM) retrieval.
(A) A comparison of regions showing significantly greater activity during reading (red) or autobiographical memory retrieval (blue). (B) A meta-analysis of the regions showing activity during reading and autobiographical memory retrieval using Neurosynth. In these word clouds, the font size of the item illustrates its importance and the colour indicates its association (red = reading, blue = autobiographical memory retrieval). (C) Relationship between the patterns of observed activity during reading and autobiographical memory retrieval and their relationship to the subsystems of the DMN as described by Yeo et al., 2011. In this panel, regions in red fall within the dorsomedial (DM) subsystem, regions in blue fall within the core subsystem and regions in green fall within the medial temporal (MT) subsystem. The pie charts show the proportion of significant voxels associated with each condition that fall within each subsystem. (Source data of unthresholded task contrasted maps, which are also used for Neurosynth decoding analysis in (B), could be found in Neurovault at https://neurovault.org/collections/9432/; Figure 2—source data 1).
-
Figure 2—source data 1
Task-activated voxels within each DMN subsystem.
- https://cdn.elifesciences.org/articles/74011/elife-74011-fig2-data1-v1.xlsx
Figure 3
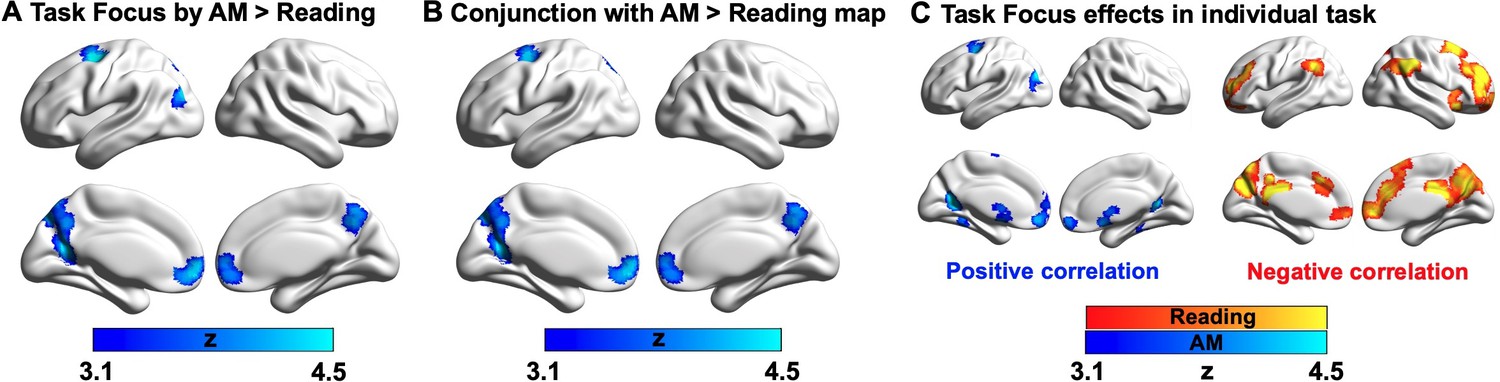
Parametric effects of task focus.
(A) Regions showing a differential relationship with task focus across the two states (autobiographical memory (AM) retrieval and reading). These regions show greater activity when participants reported better focus on the task during autobiographical memory retrieval and poorer task focus during reading. (B) A formal conjunction between these regions in (A) showing more activation with greater task focus on memory retrieval and those showing greater activity during memory retrieval than reading (i.e., blue regions in Figure 2A showing main effect of task contrast). (C) Task focus effects in reading (red; negative correlation with task focus) and autobiographical memory recall task (blue; positive correlation with task focus), relative to the implicit baseline (i.e., the first fixation interval). (Source data for the unthresholded maps of task focus in A-C are provided in Neurovault at https://neurovault.org/collections/9432/).
Figure 4

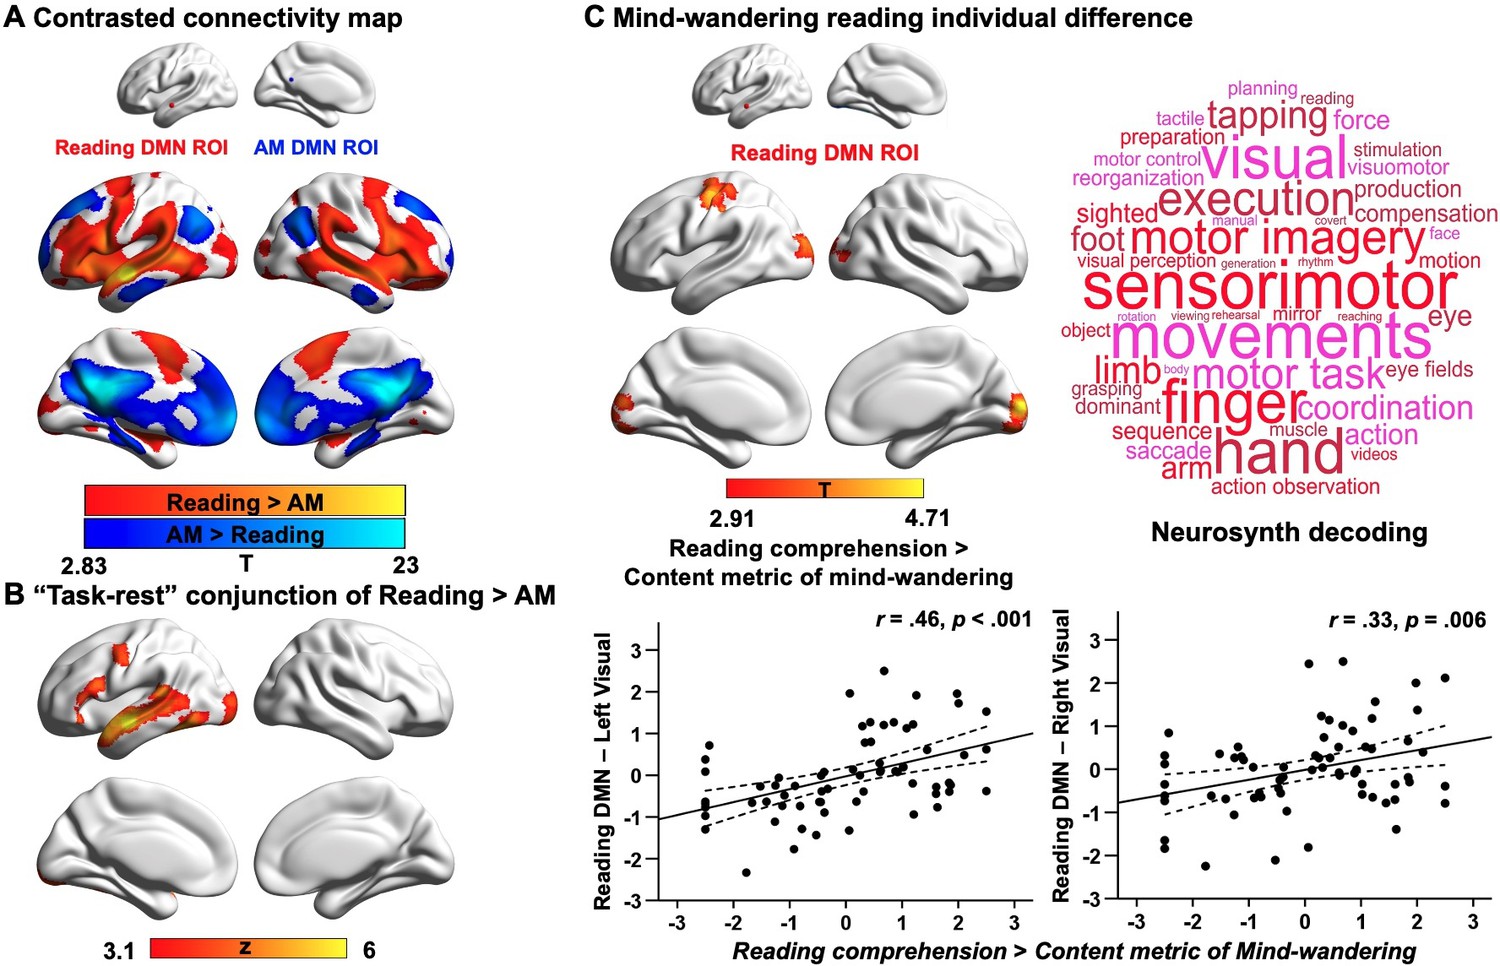
Results of resting-state intrinsic connectivity.
Analyses examining the functional architecture of DMN regions associated with reading and autobiographical memory (AM) retrieval and their relation to individual differences in naturally occurring mind-wandering during reading. Panel (A) shows the results of a functional connectivity analysis examining differences between the DMN seeds (reading DMN MNI coordinates: − 56,–10, –12; autobiographical memory DMN MNI coordinates: − 6,–50, 22). Regions showing stronger intrinsic connectivity to the reading DMN seed are shown in warmer colours, while regions showing stronger intrinsic connectivity to the autobiographical memory DMN seed are shown in cooler colours. The lower panel (B) shows results of a formal conjunction between regions associated with greater activity during reading versus autobiographical memory retrieval, and regions showing stronger correlation at rest with DMN seed activated by reading. Panel (C) shows the relationship of these seeds’ functional architecture and self-reports of mind-wandering during reading. Group-level regression, using the DMN site showing peak activation during reading as a seed, demonstrated stronger connectivity with regions in primary visual cortex and postcentral gyrus in individuals with good comprehension and less reported mind-wandering content. To visualise this effect, the scatterplots present the correlation between behaviour and the correlation between the reading-relevant DMN seed and the identified visual clusters (beta values). The error lines on the scatterplots indicate the 95% confidence estimates of the mean. Each point describes an individual participant. The word cloud shows the functional associations with this connectivity map identified using Neurosynth. (The unthresholded functional connectivity maps contrasting reading and autobiographical memory DMN seeds from (A), the conjunction map in (B), and the mind-wandering individual difference map in (C), used for Neurosynth decoding, are provided in Neurovault at https://neurovault.org/collections/9432/).
Figure 5
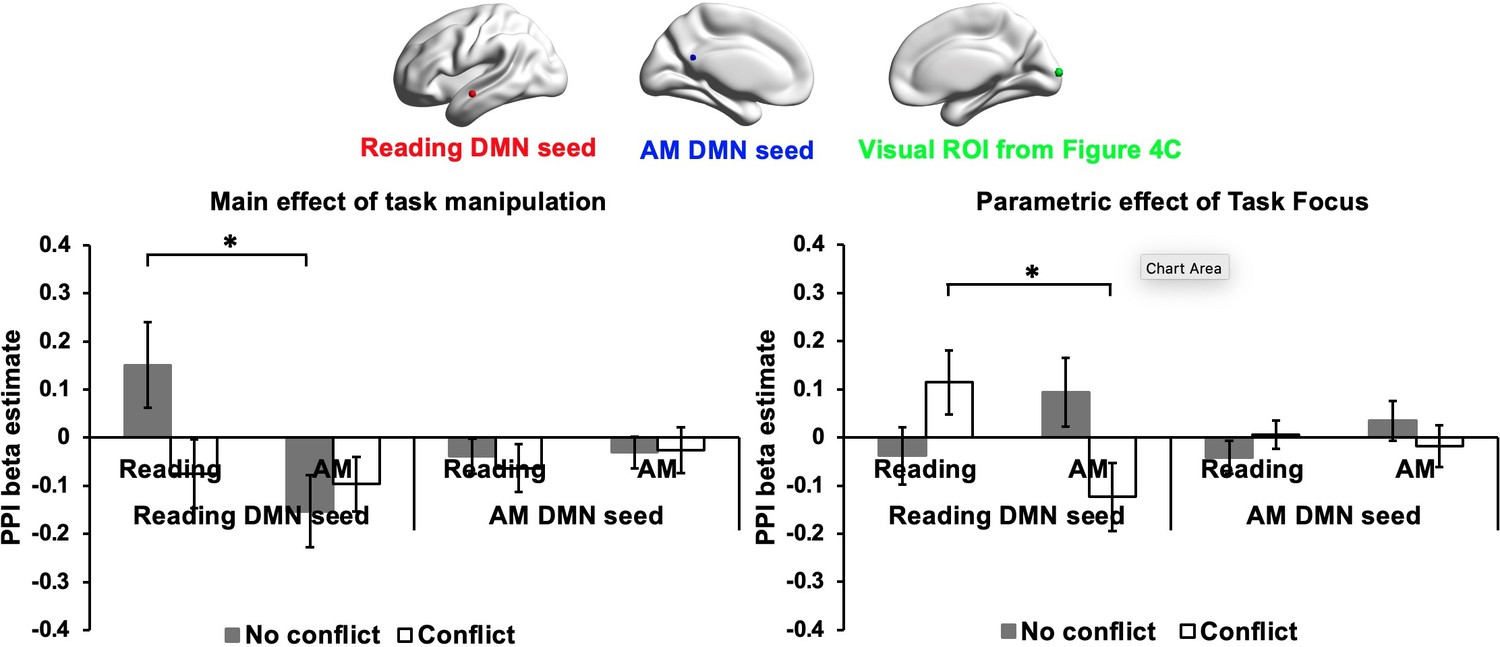
Results of task-based functional connectivity in visual ROI.
These plots present the functional connectivity in Experiment 1 of reading and autobiographical memory DMN seeds with a visual ROI that showed more decoupling for people with a propensity for mind-wandering while reading in Experiment 2 Dataset 2 (MNI coordinates: 8, -98, 8; identified in the contrast of Reading comprehension > Mind-wandering content in Figure 4C). The bar charts plot the mean PPI β values (i.e., representing the strength of functional connectivity between each DMN seed and the visual ROI). The left-hand graph shows the main effect of our task manipulation over the implicit baseline, while the right-hand graph shows the parametric effect of task focus for each experimental condition. Error bars depict the standard error of the mean. * indicates Bonferroni-corrected p value < 0.05.
Appendix 1—figure 1
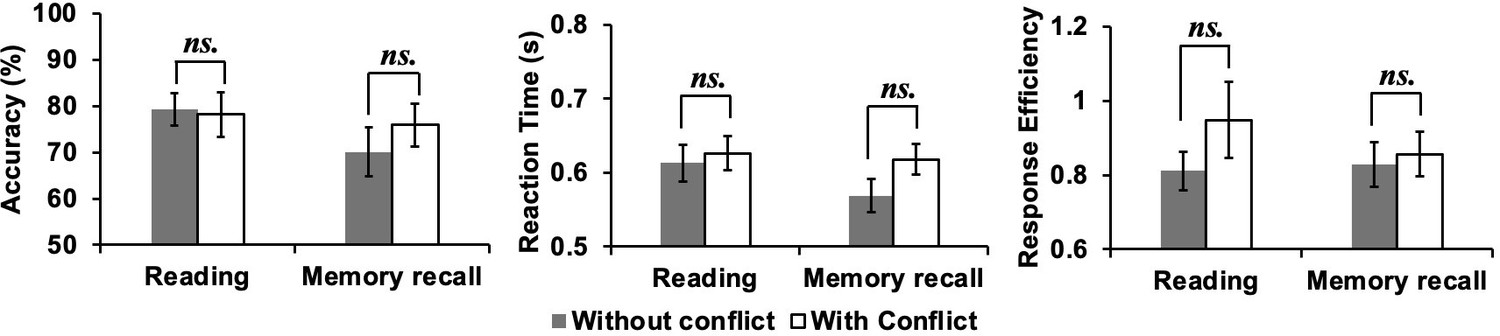
Behavioural results of catch trials.
Accuracy (percentage correct, left panel) and reaction time (in seconds, middle panel), as well as response efficiency (right panel) for the catch trials in each experimental condition (Pure Reading, Conflict Reading, Pure Recall, and Conflict Recall). Error bars represent the standard error. ns. indicates not significant.
Appendix 1—figure 2
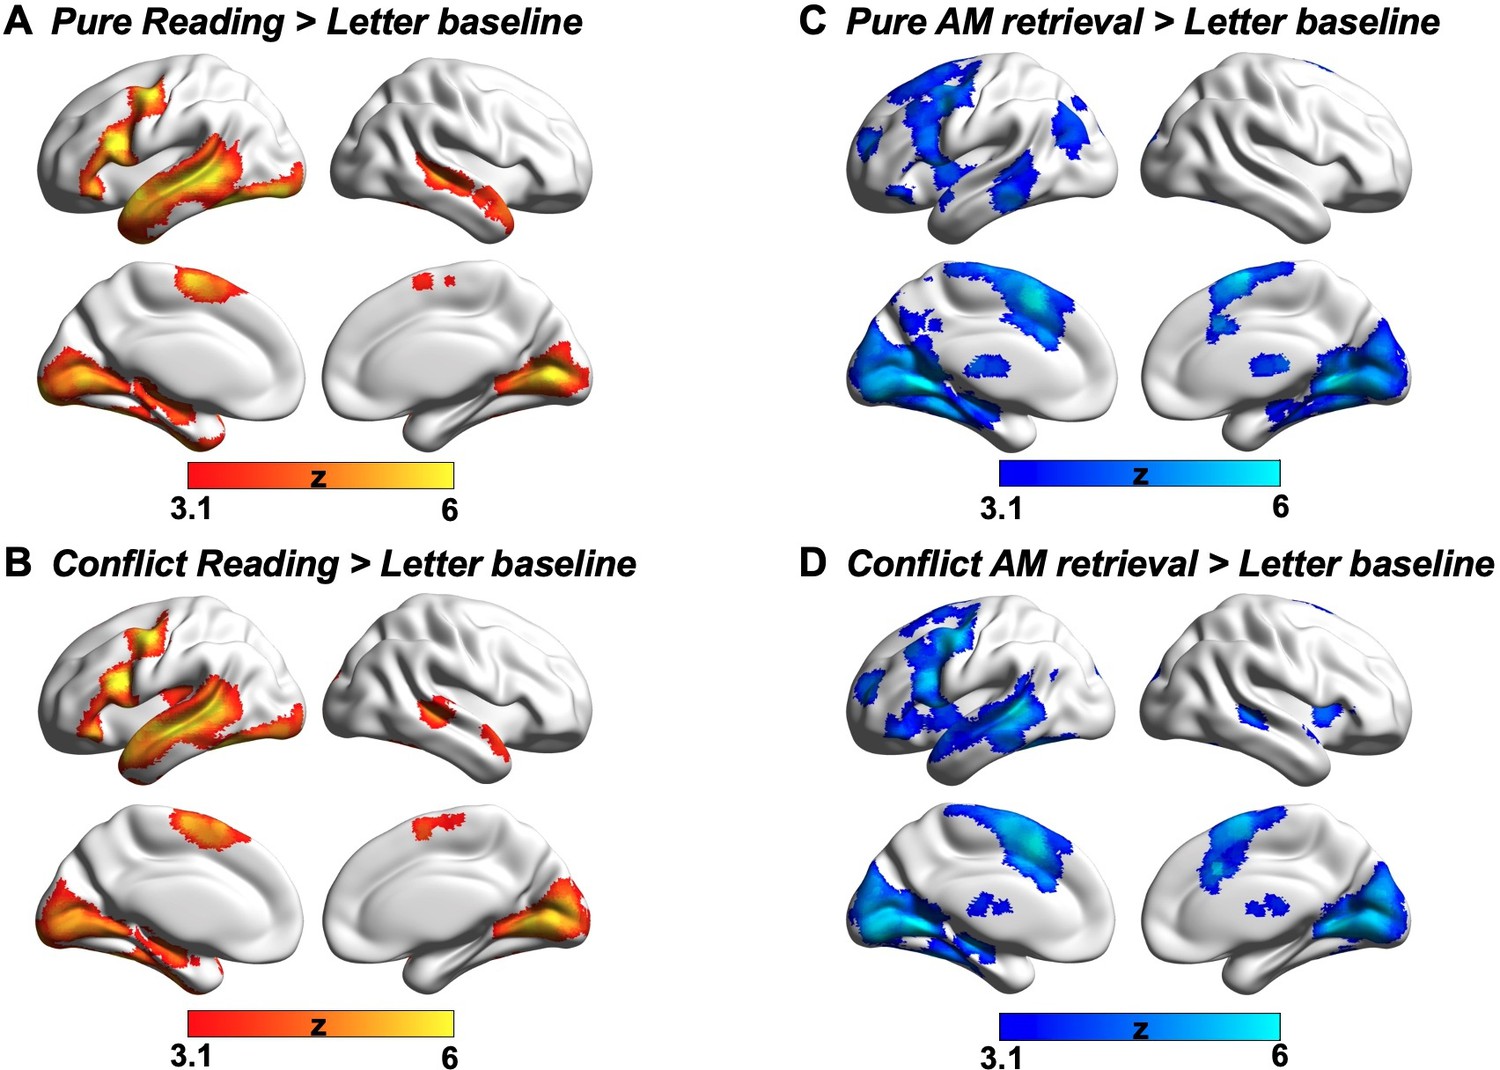
Comparisons between each experimental condition and meaningless letter string stimuli processing.
All maps were cluster-corrected with a voxel inclusion threshold of z > 3.1 and family-wise error rate using random field theory set at p < 0.05.
Appendix 1—figure 3
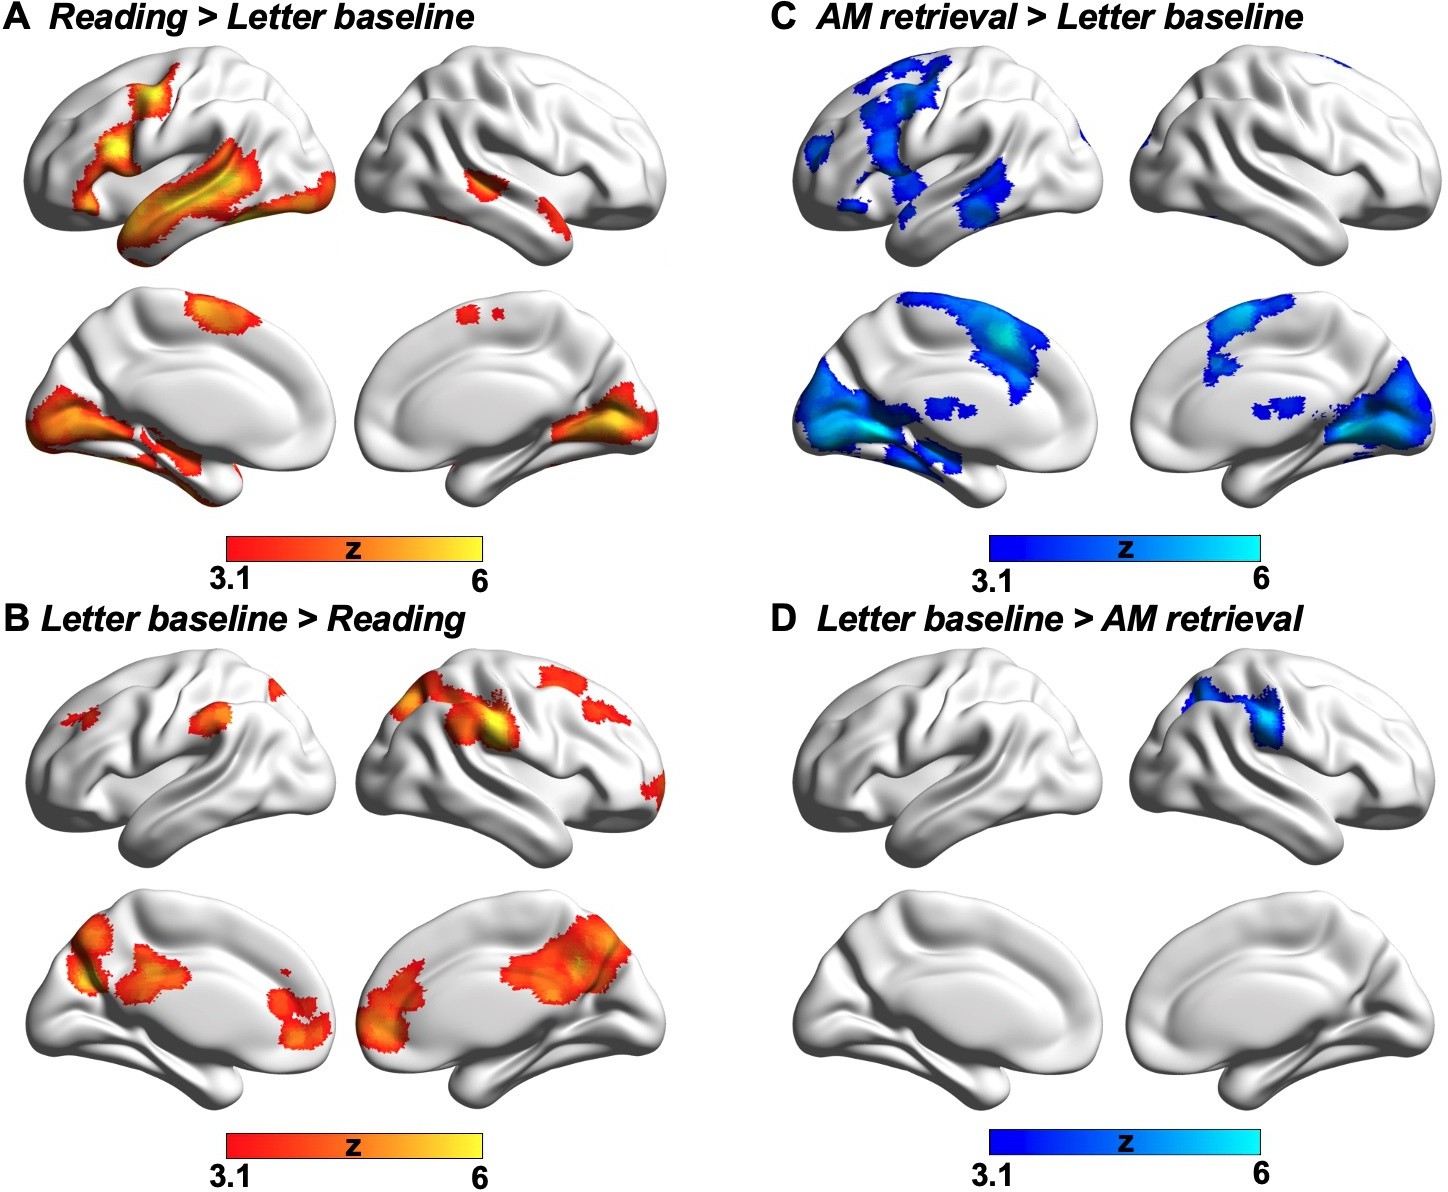
Task activation and deactivation.
(A) Reading > Letter baseline and (B) Letter baseline > Reading show the brain activation and deactivation during reading task relative to the letter string baseline. (C) AM retrieval > Letter baseline and (D) Letter baseline > AM retrieval show the brain activation and deactivation during autobiographical memory recall relative to the letter string baseline. These conjunctions were identified using FSL’s ‘easythresh_conj’ tool. All maps were thresholded at z > 3.1 (cluster-size p-FWE <0.05).
Appendix 1—figure 4
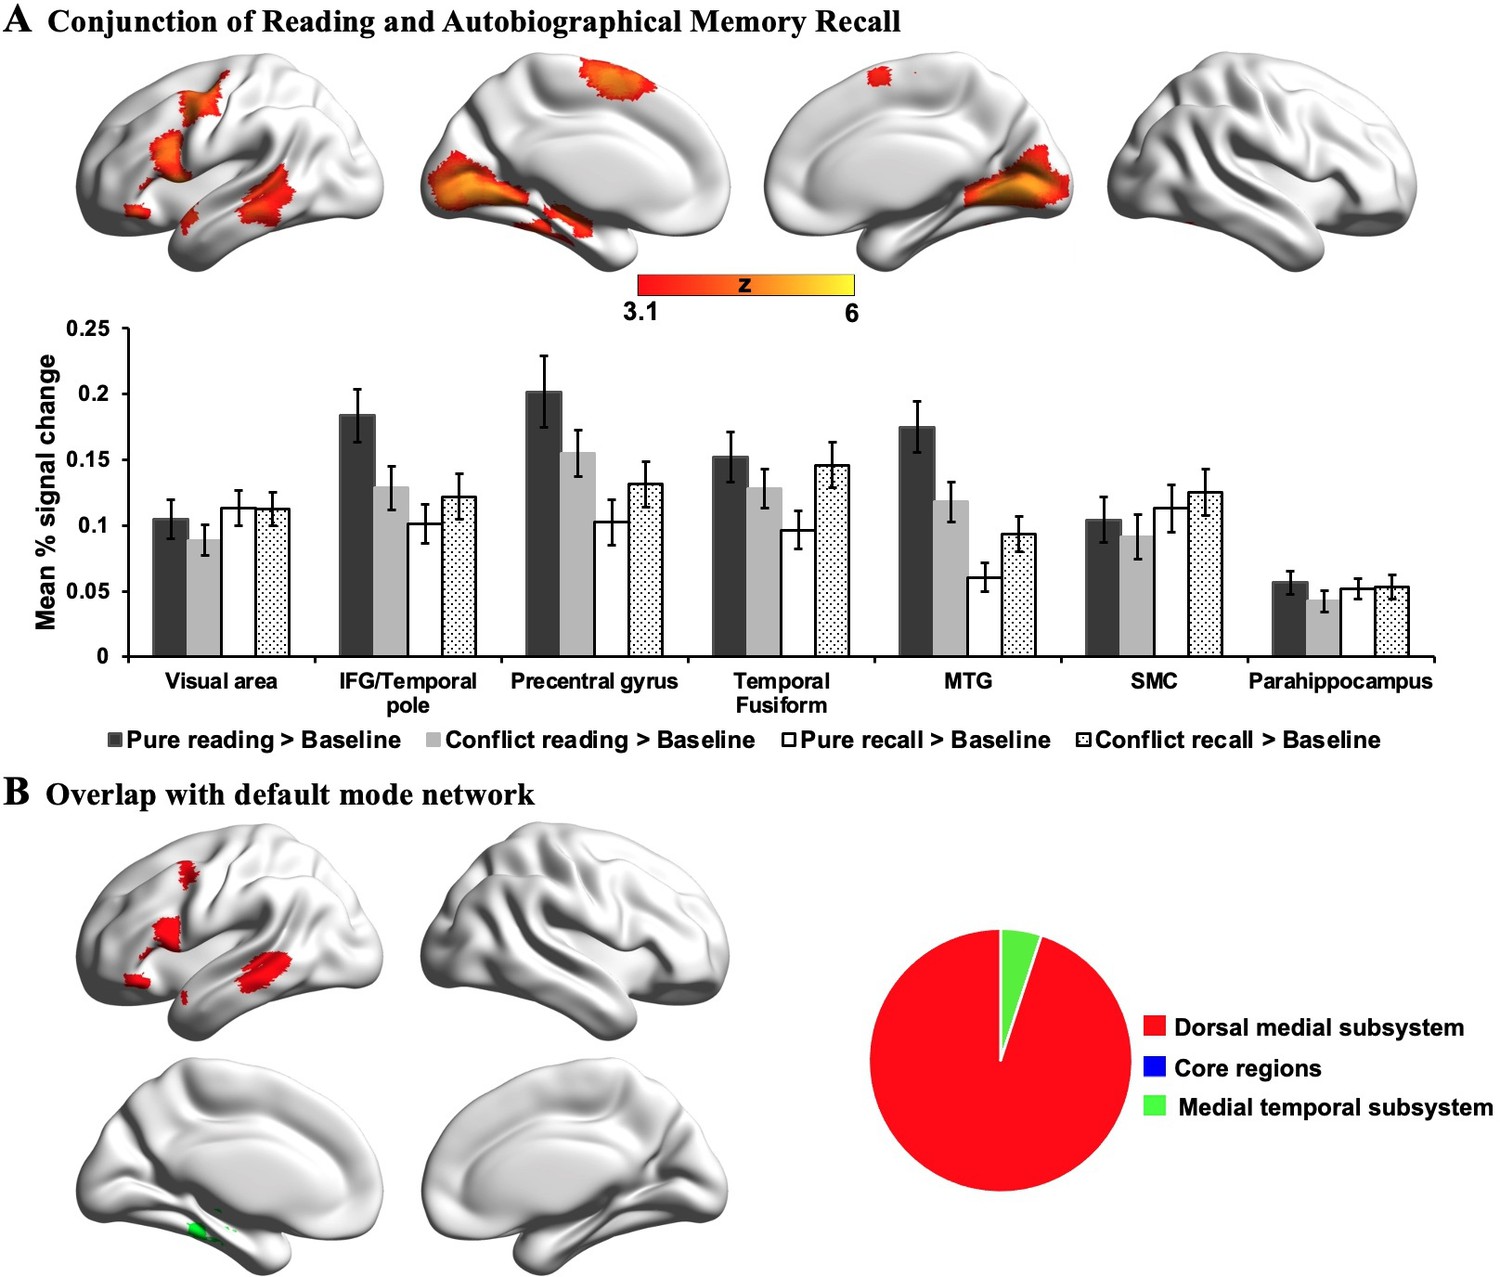
Conjunction analysis.
(A) Conjunction of brain activation during reading comprehension and autobiographical memory recall, with this conjunction identified using FSL’s ‘easythresh_conj’ tool. The bar chart shows the mean % signal change of each experimental condition over letter baseline in each identified cluster. Error bars represent the standard error. (B) The pie chart illustrates the percentages of voxels that were within the DMN in the task conjunction map that overlap with each DMN subsystem: the medial temporal subsystem is shown in green, and the dorsomedial subsystem is shown in red. The DMN conjunction largely fell within the dorsomedial subsystem of DMN. All maps were thresholded at z > 3.1 (cluster-size p-FWE <0.05). IFG = inferior frontal gyrus; MTG = middle temporal gyrus; SMC = supplementary motor cortex.
Appendix 1—figure 5
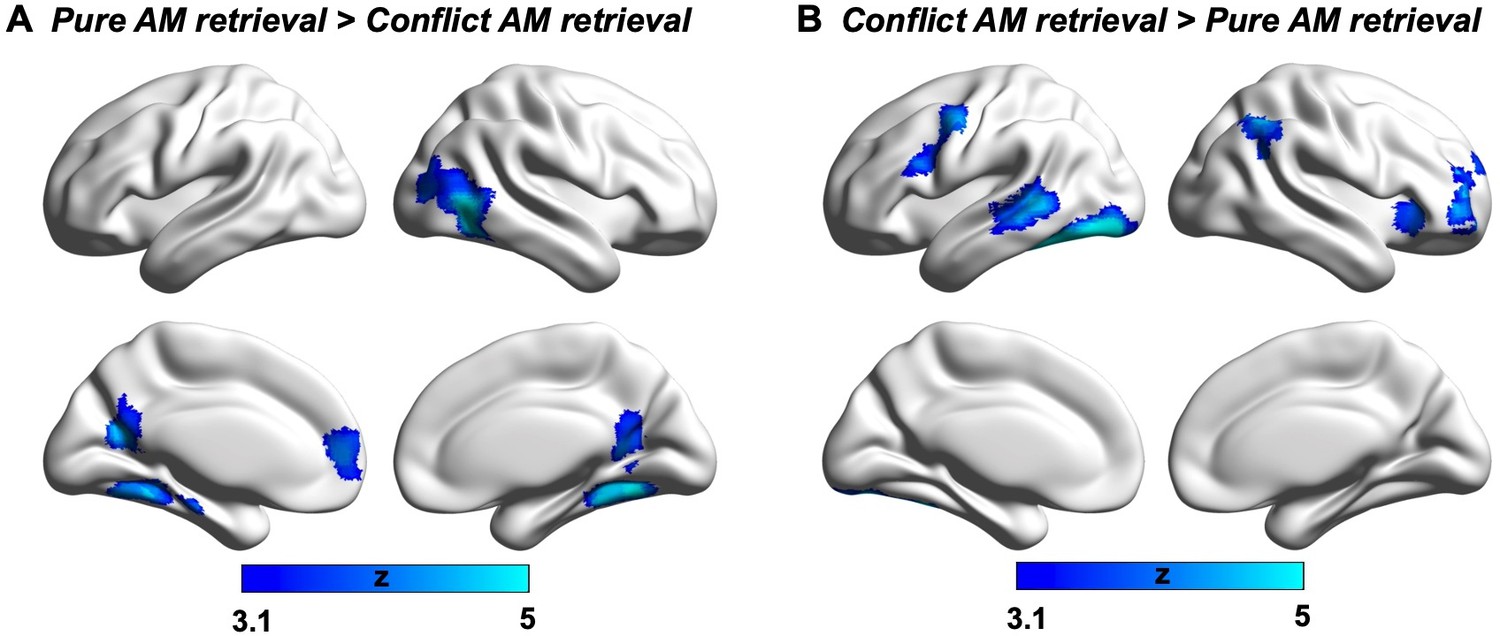
Effects of Task conflict.
(A) Significant activation when there was no conflict from semantic input defined using the contrast of Pure AM retrieval > Conflict AM retrieval. (B) Significant activation when there was conflict from semantic input defined using the contrast of Conflict AM retrieval > Pure AM retrieval. All maps were thresholded at z > 3.1 (cluster-size p-FWE <0.05).
Appendix 1—figure 6
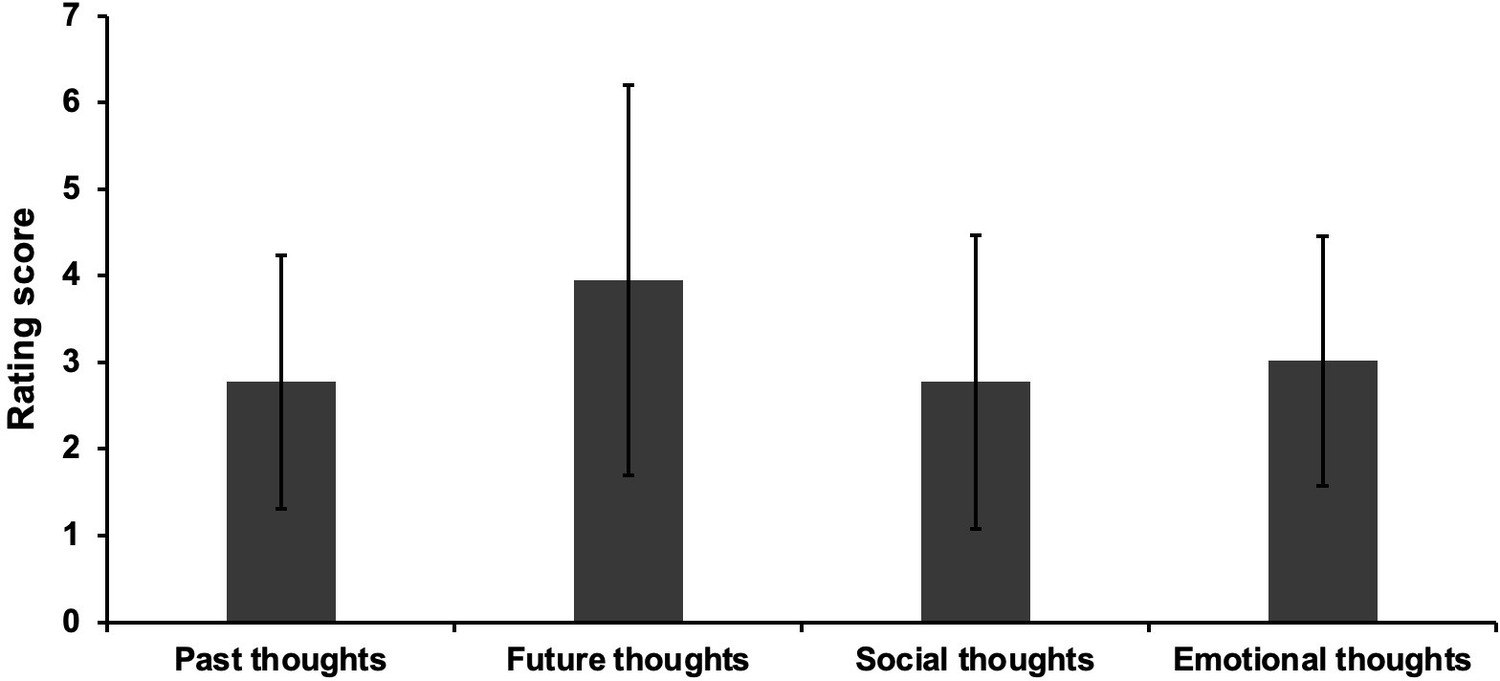
Contents of naturally-occurring mind-wandering during reading.
Different types of internal thoughts that people reported that they were thinking about, when they mind-wandered during reading in Experiment 2.
Appendix 1—figure 7
Results of resting-state intrinsic connectivity using a stringent motion criterion.
Panel (A) shows the results of a functional connectivity analysis examining differences between the DMN seeds (reading DMN MNI coordinates: − 56, -10, -12; autobiographical memory DMN MNI coordinates: − 6, -50, 22). Regions showing stronger intrinsic connectivity to the reading DMN seed are shown in warmer colours, while regions showing stronger intrinsic connectivity to the autobiographical memory DMN seed are shown in cooler colours. The lower panel (B) shows results of a formal conjunction between regions associated with greater activity during reading versus autobiographical memory retrieval, and regions showing stronger correlation at rest with the DMN seed most activated by reading. Panel (C) shows the relationship of these seeds’ functional architecture and self-reports of mind-wandering during reading. Group-level regression, using the DMN seed showing peak activation during reading, demonstrated stronger connectivity with the regions of primary visual areas and postcentral gyrus in individuals with good comprehension and less internally-generated mind-wandering content. The scatterplots present the correlation between behaviour and the average correlation with the reading-relevant DMN seed and the identified visual clusters (beta values). The error lines on the scatterplot indicate the 95% confidence estimates of the mean. Each point describes an individual participant. The word cloud shows the functional associations with this connectivity map using Neurosynth.
Appendix 1—figure 8
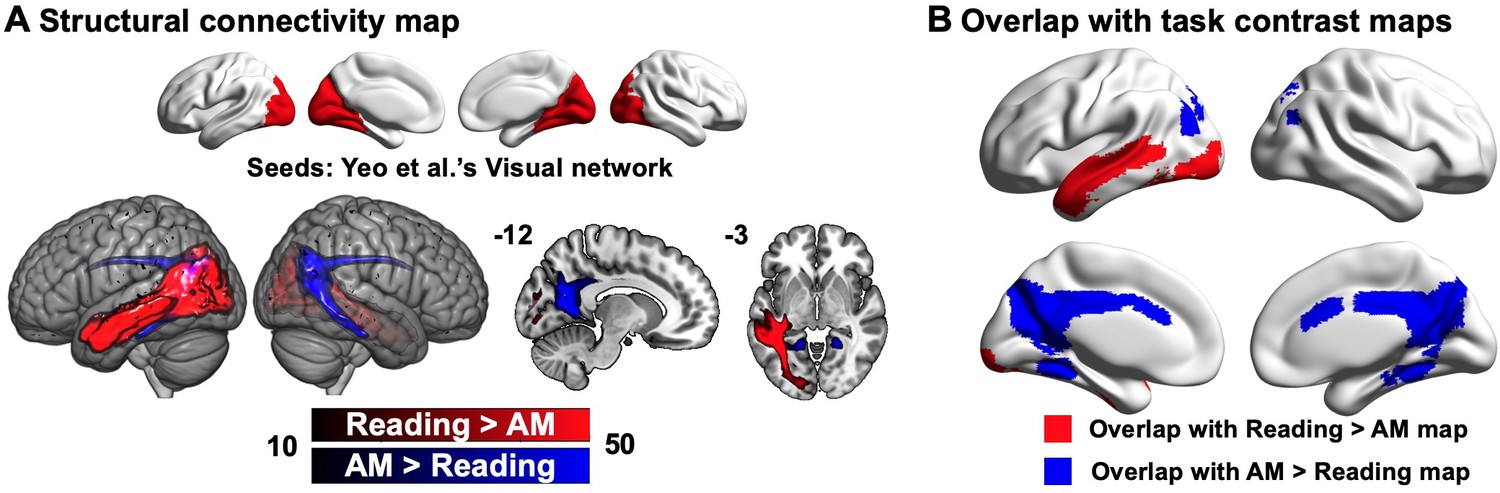
Structural connectivity.
(A) Structural connectivity seeding from visual network defined by Yeo et al., 2011 to DMN regions linked to reading comprehension (in red) and autobiographical memory retrieval (in blue). (B) Overlap of structural connectivity map with Reading > AM and AM > Reading task contrast maps.
Tables
Appendix 1—table 1
Linguistic properties of each set of key words within sentences and autobiographical memory cues, and the words within each set of sentences (Mean ± SD).
Sets (i), (ii), and (iii) were counterbalanced across participants (see Materials).
| Conditions | Frequency | Imageability | Concreteness |
|---|---|---|---|
| (i) sentence key words | 1.31 ± .56 | 591.67 ± 34.20 | 4.74 ± .52 |
| (ii) sentence key words | 1.47 ± .50 | 598.05 ± 27.49 | 4.72 ± .55 |
| (iii) sentence key words | 1.29 ± .52 | 592.61 ± 44.35 | 4.64 ± .58 |
| (i) autobiographical memory cues | 1.59 ± .76 | 588.48 ± 41.20 | 4.70 ± .47 |
| (ii) autobiographical memory cues | 1.48 ± .62 | 594.64 ± 24.46 | 4.75 ± .30 |
| (iii) autobiographical memory cues | 1.54 ± .56 | 601.53 ± 23.65 | 4.73 ± .41 |
| (i) sentence materials | 2.59 ± .24 | 354.34 ± 27.41 | 2.72 ± .26 |
| (ii) sentence materials | 2.52 ± .20 | 352.40 ± 23.39 | 2.72 ± .21 |
| (iii) sentence materials | 2.48 ± .27 | 347.64 ± 35.24 | 2.80 ± .24 |
Additional files
Download links
A two-part list of links to download the article, or parts of the article, in various formats.
Downloads (link to download the article as PDF)
Open citations (links to open the citations from this article in various online reference manager services)
Cite this article (links to download the citations from this article in formats compatible with various reference manager tools)
Perceptual coupling and decoupling of the default mode network during mind-wandering and reading
eLife 11:e74011.
https://doi.org/10.7554/eLife.74011


