Archerfish number discrimination
- Center for Mind/Brain Sciences, University of Trento, Italy
Figures
Figure 1
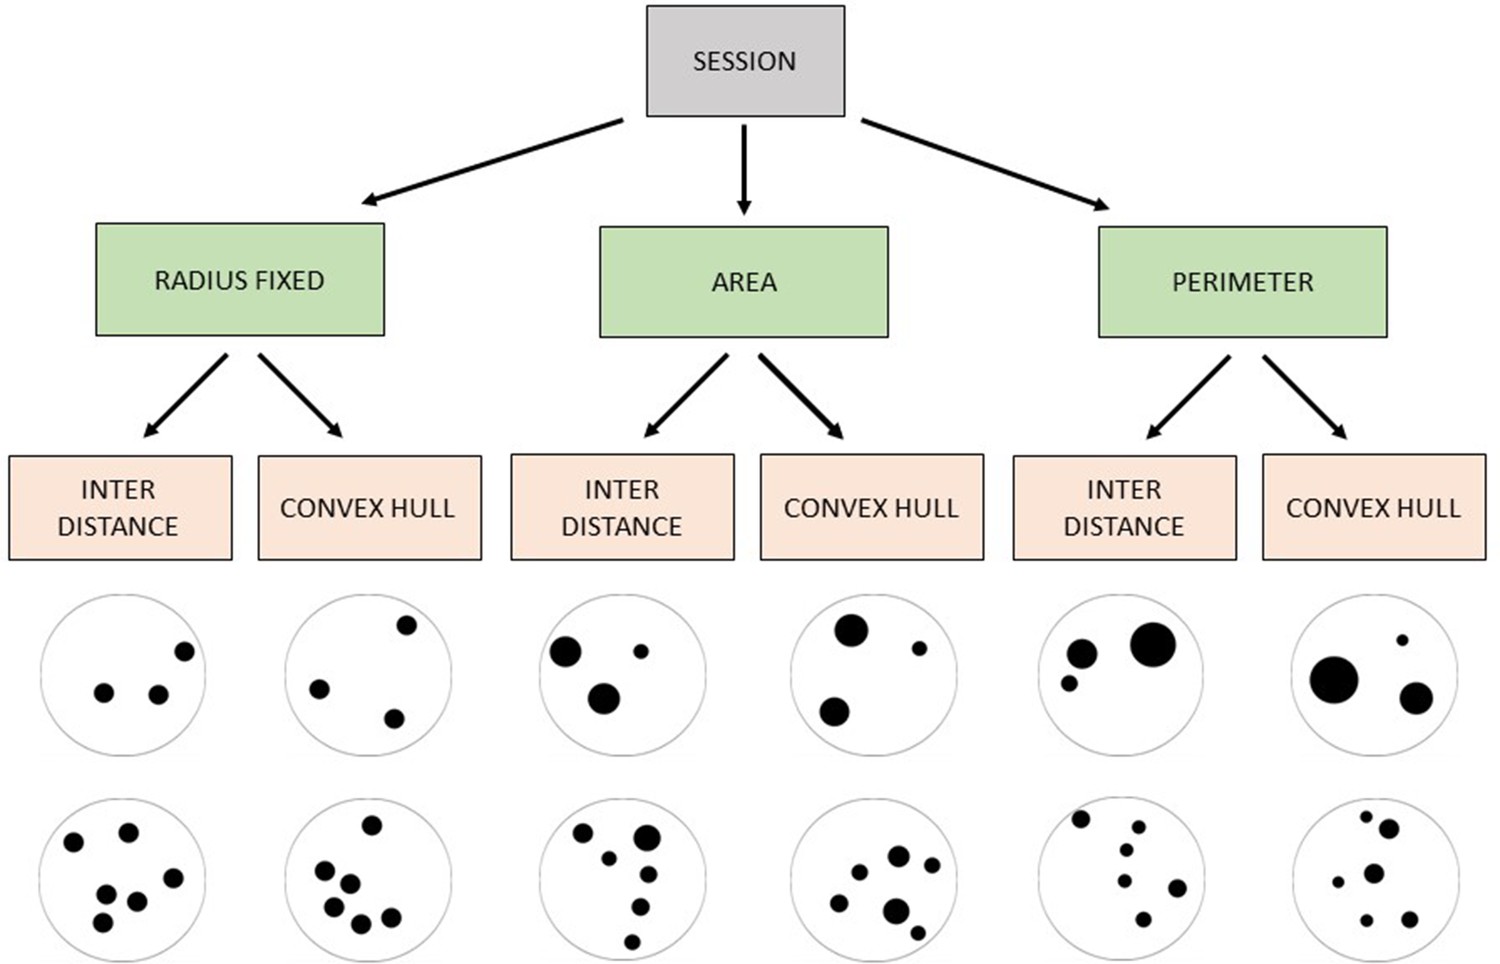
Schematic representation of the non-numerical physical controls applied to the stimuli in each session.
Figure 2 with 1 supplement
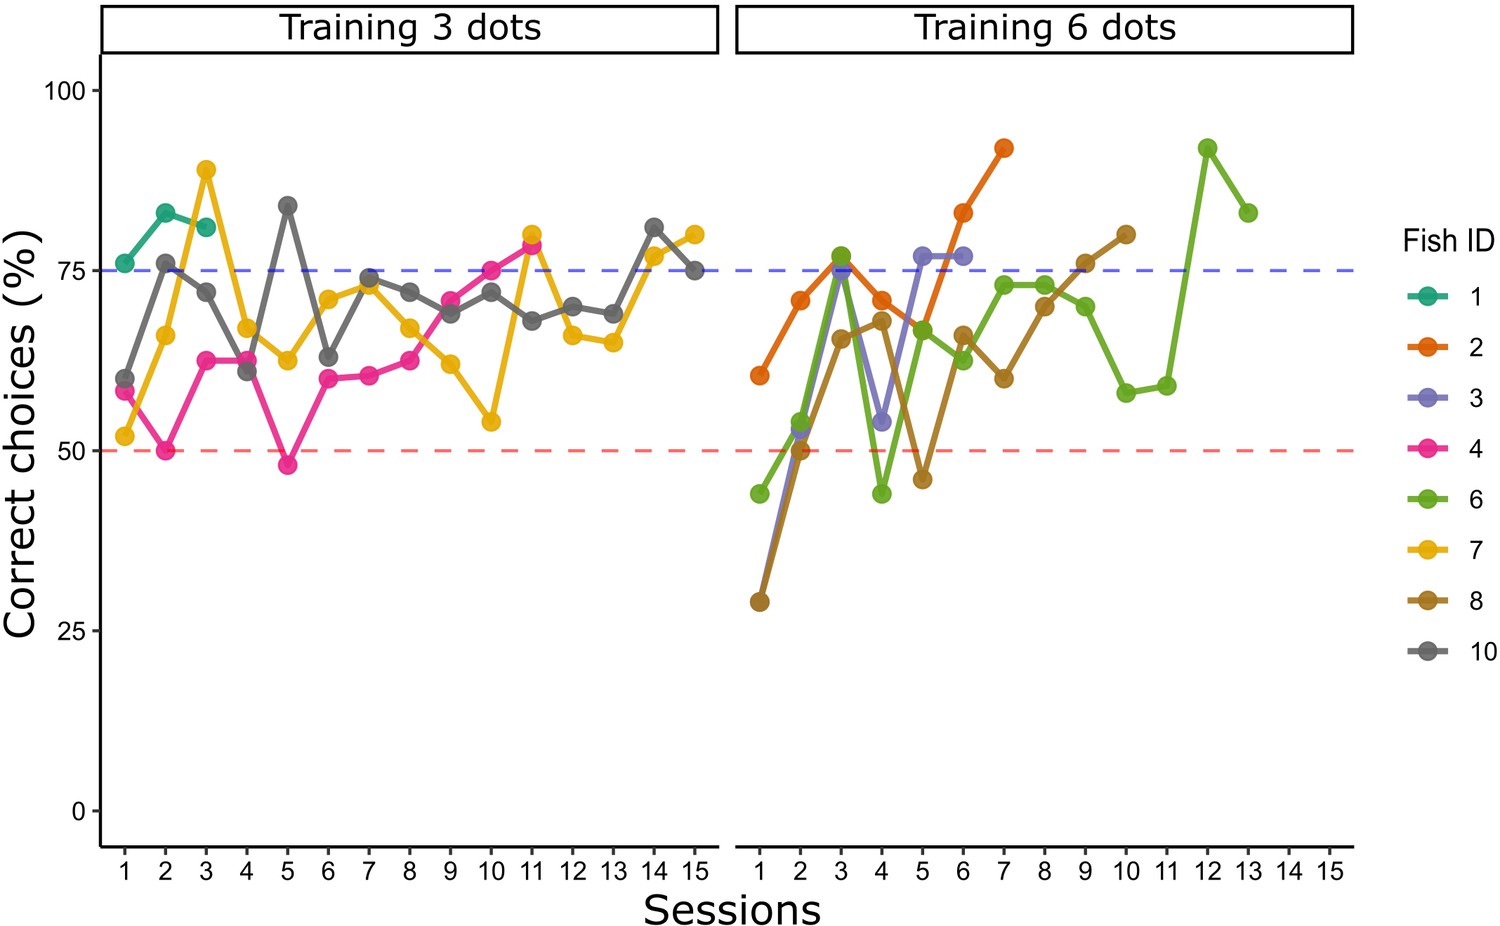
Learning curve of Experiment 1: lines graph show the percentage of correct choices for each archerfish in a 3 vs 6 training, grouped by numerosity rewarded (three or six dots).
Learning criterion (blue dotted line) was reached after two consecutive sessions ≥75%. The red dotted line refers to chance level.
Figure 2—figure supplement 1
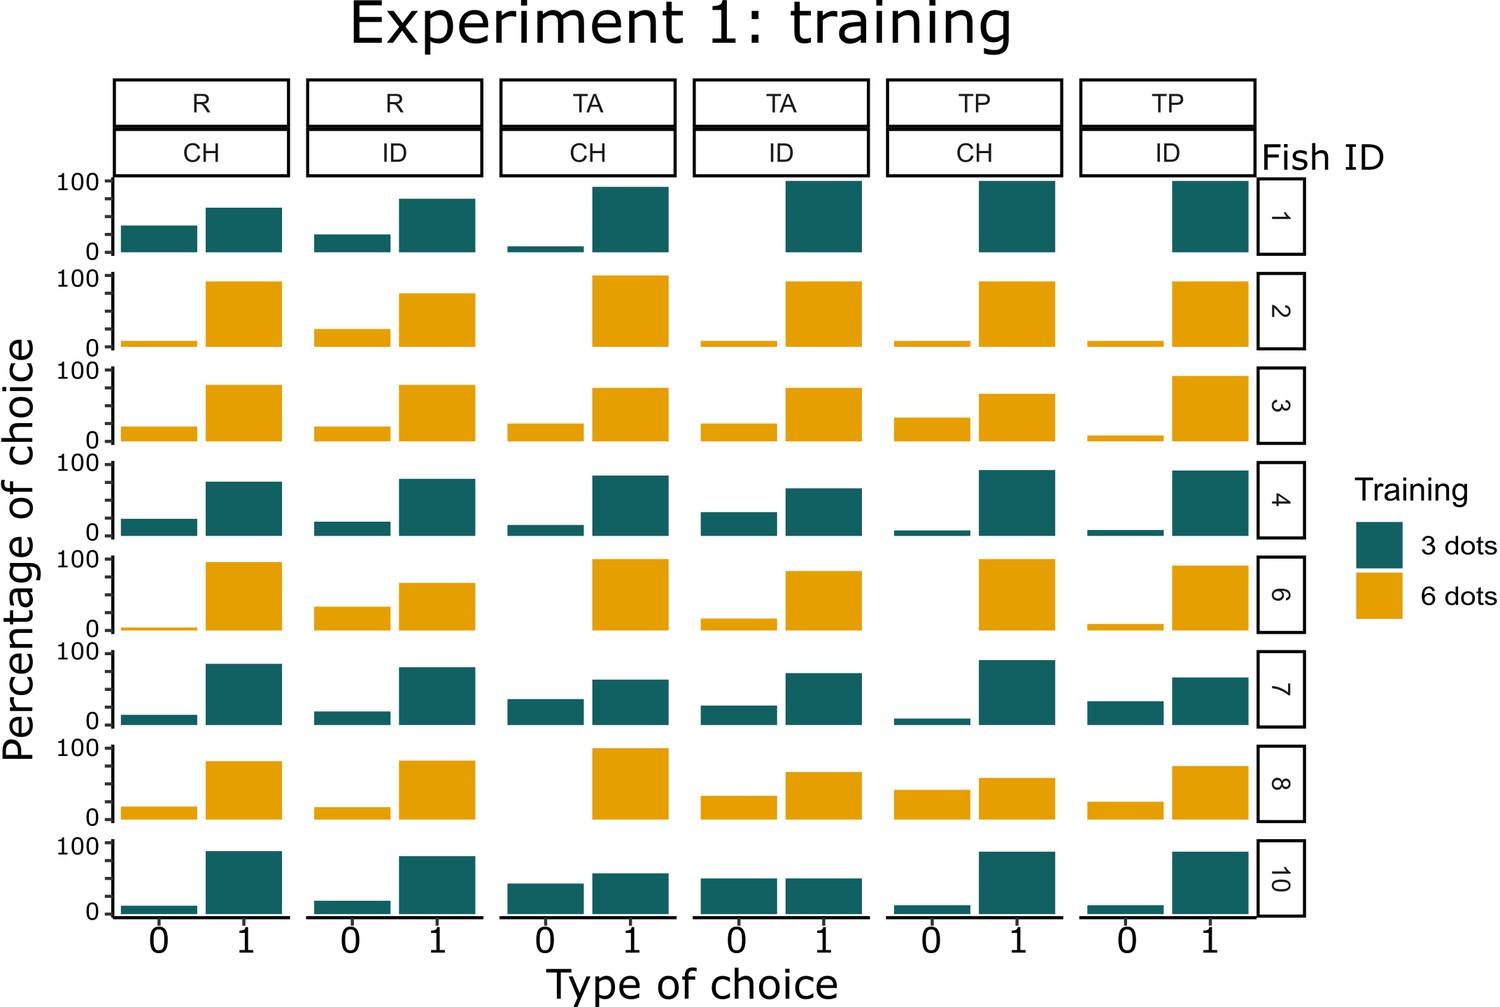
Performance data for each non-numerical control condition at training in Experiment 1.
Type of choices 0 and 1 corresponds to uncorrect and correct choices, respectively (training data refer to the last two training sessions, when learning criterion was reached).
Figure 3 with 1 supplement
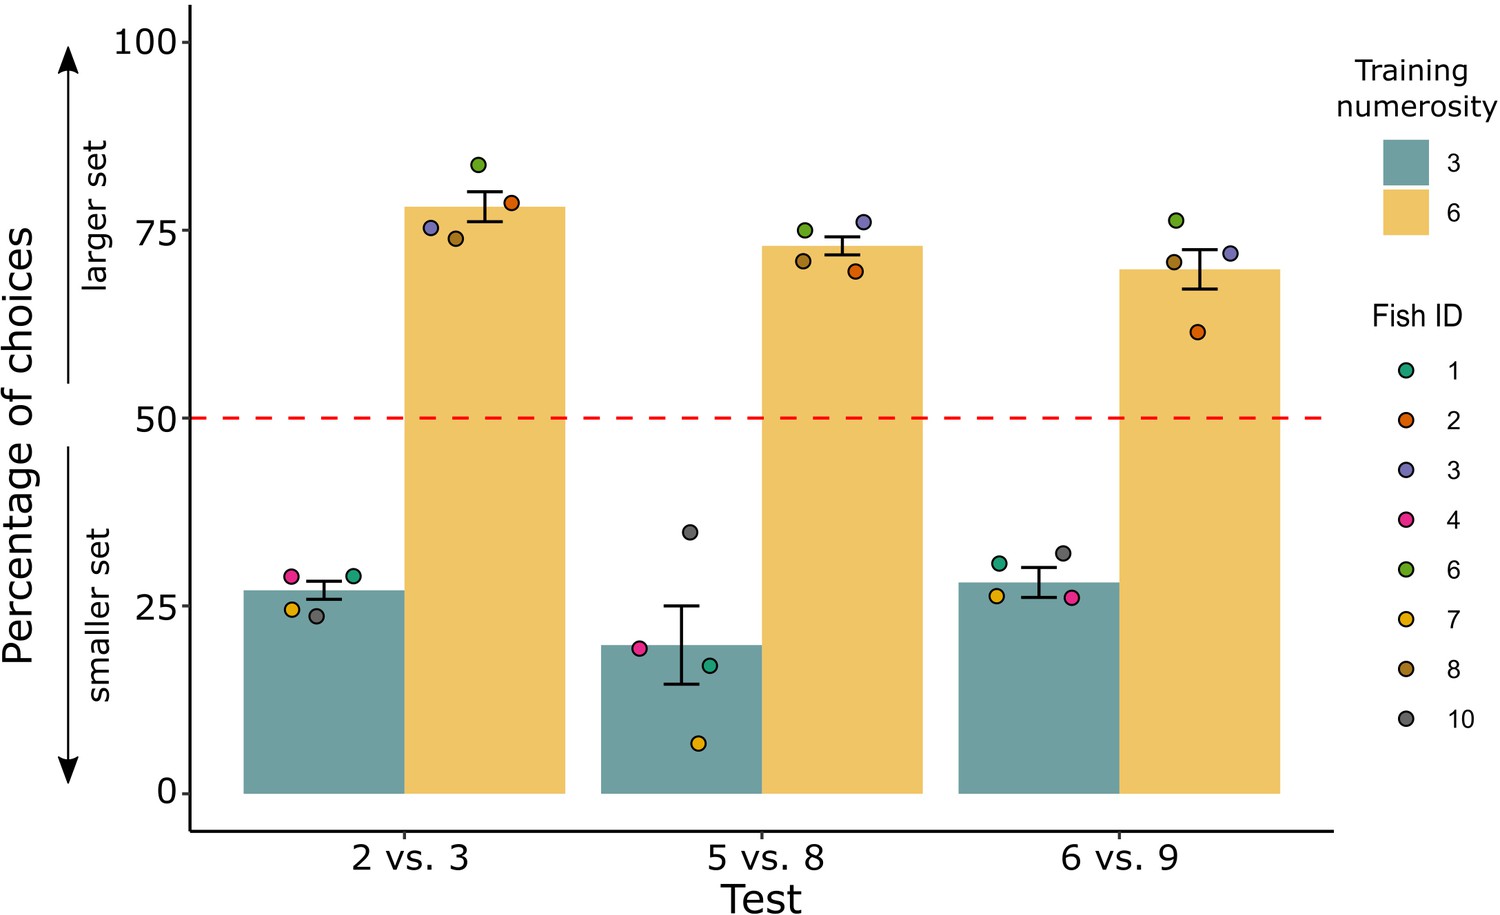
Percentage of choice for the larger/smaller set (mean ± standard error of the mean [SEM]) in the comparison tests for the two groups trained to select the smaller (3) or larger (6) set.
Coloured dots represent the individual performance for each fish.
Figure 3—figure supplement 1
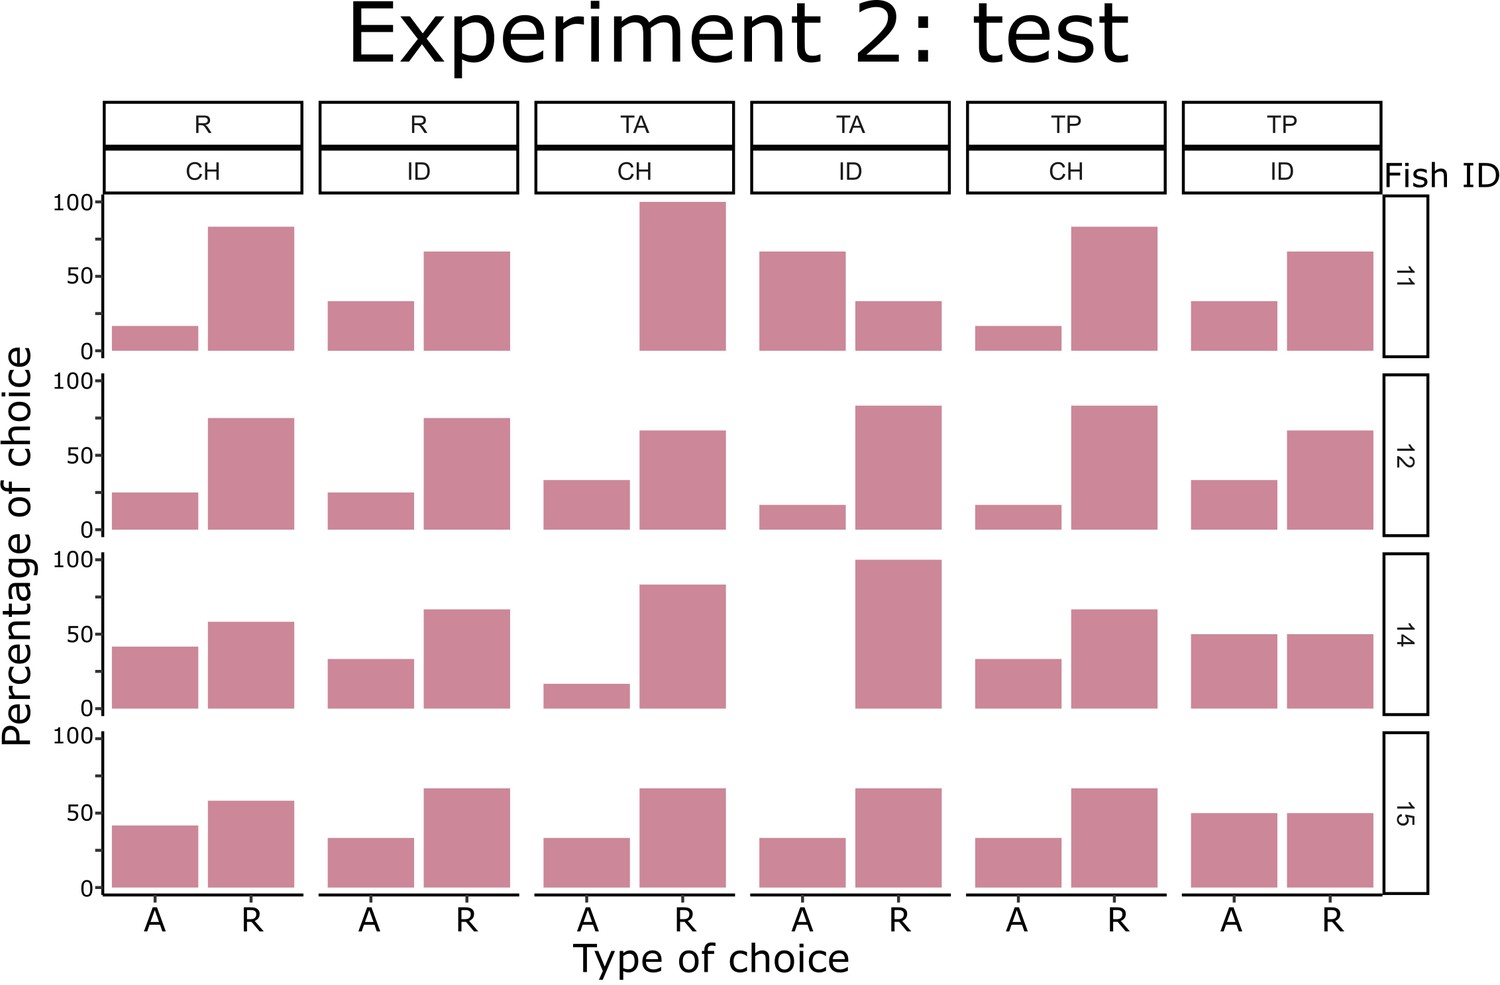
Individual performance data for each non-numerical control condition at test in Experiment 1.
Type of choices A and R corresponds to choices for absolute and relative numerosity.
Figure 4 with 1 supplement
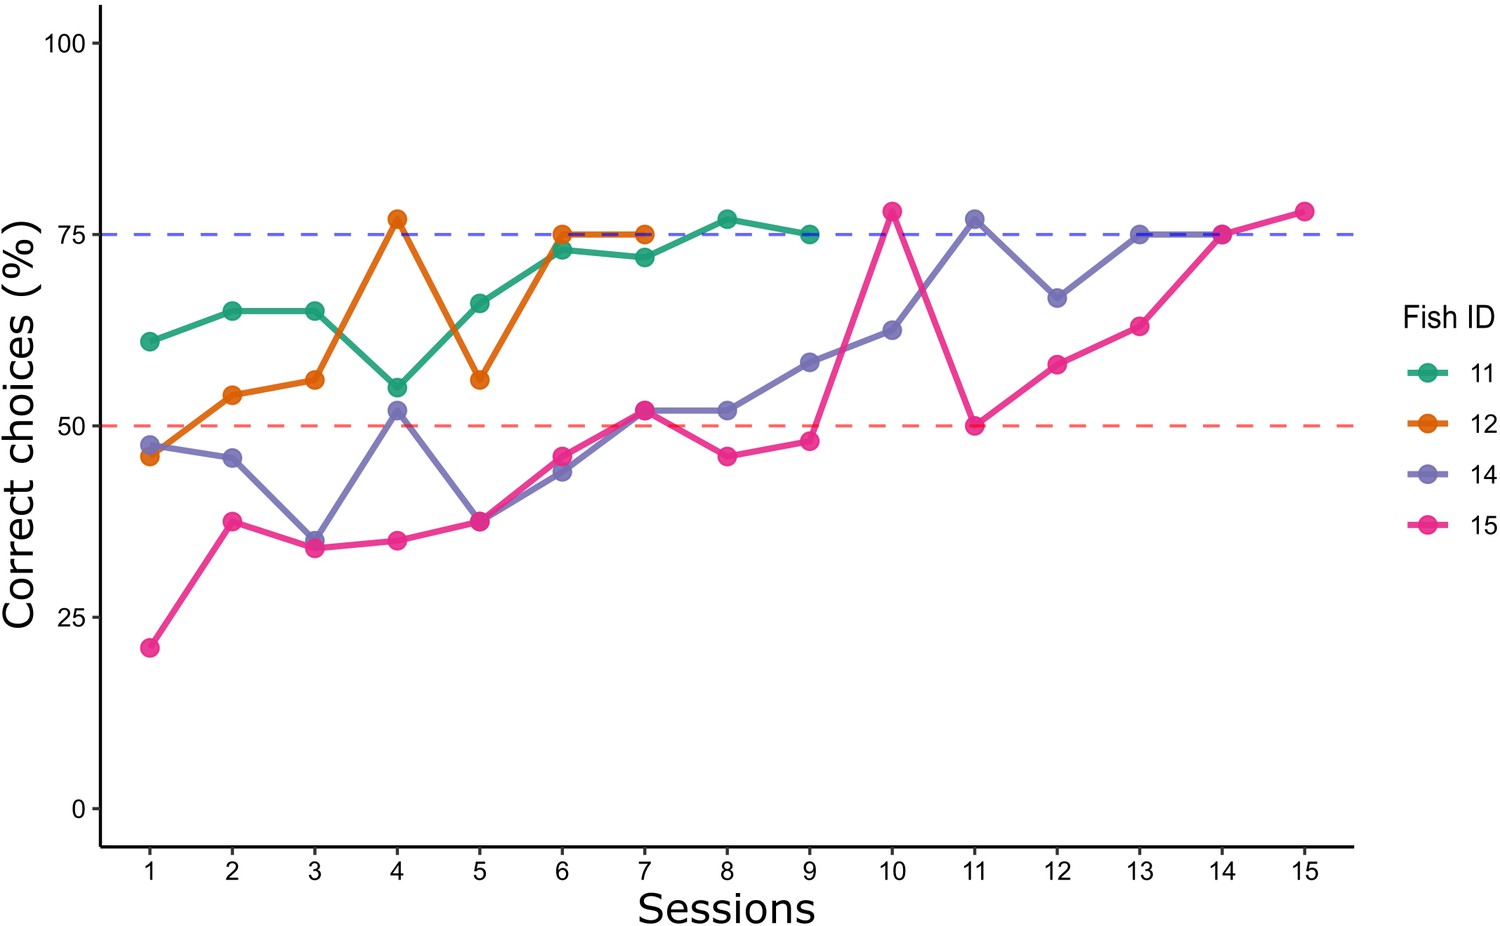
Learning curves of Experiment 2: the lines show the percentage of correct choices for each archerfish in a 2 vs 3 training.
Learning criterion (blue dotted line) was reached after two consecutive sessions ≥75%. The red dotted line refers to chance level.
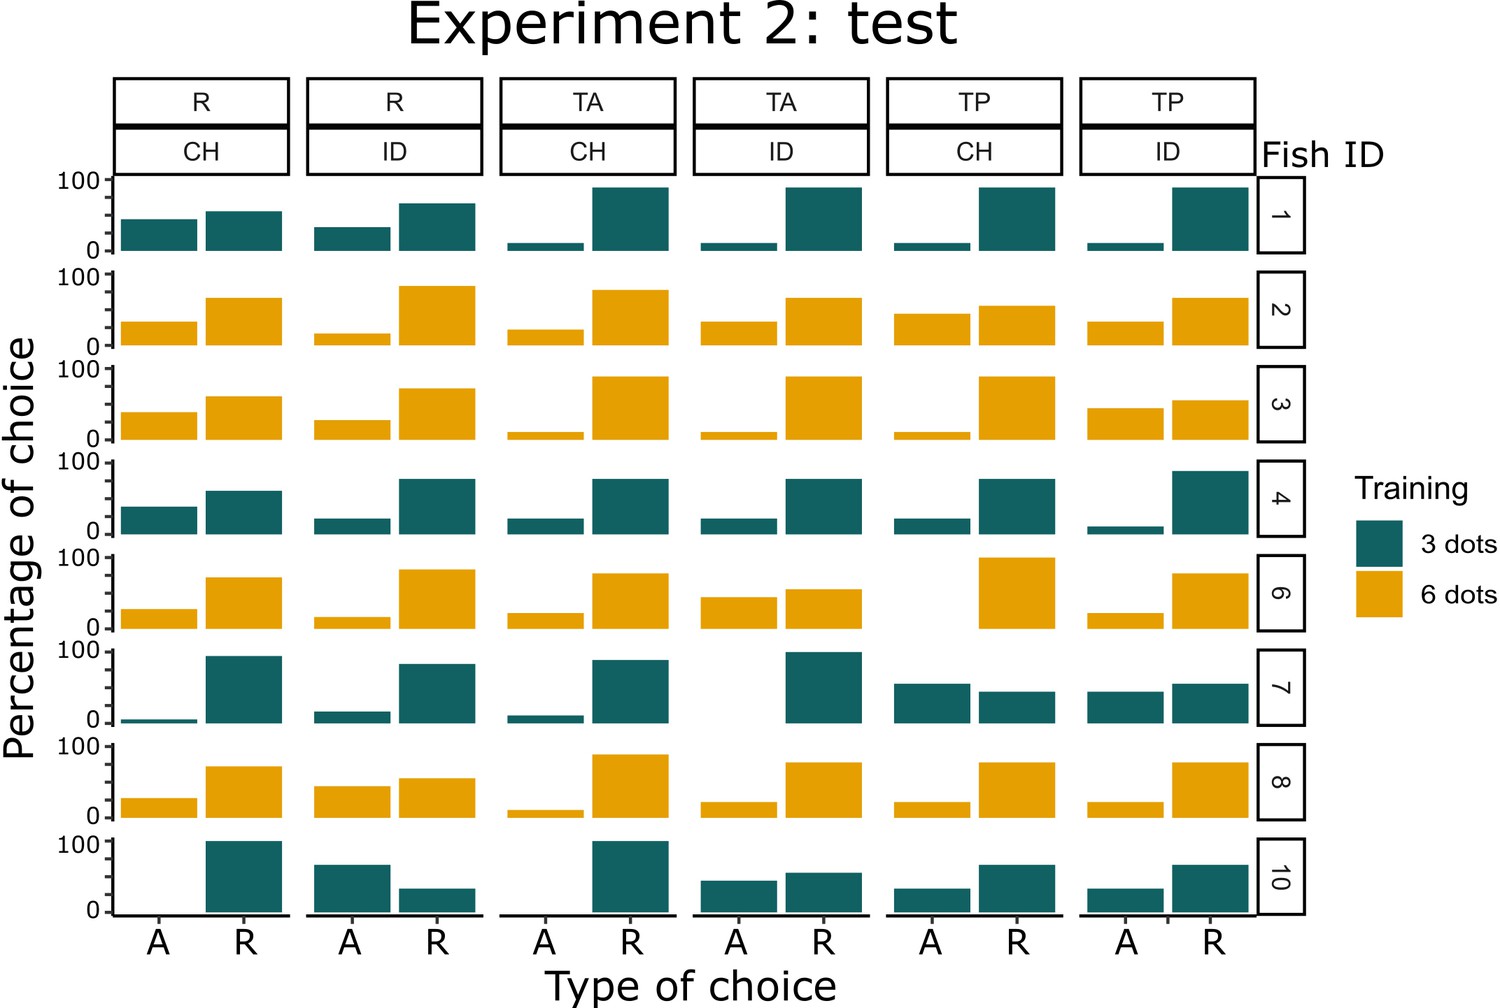
Figure 4—figure supplement 1
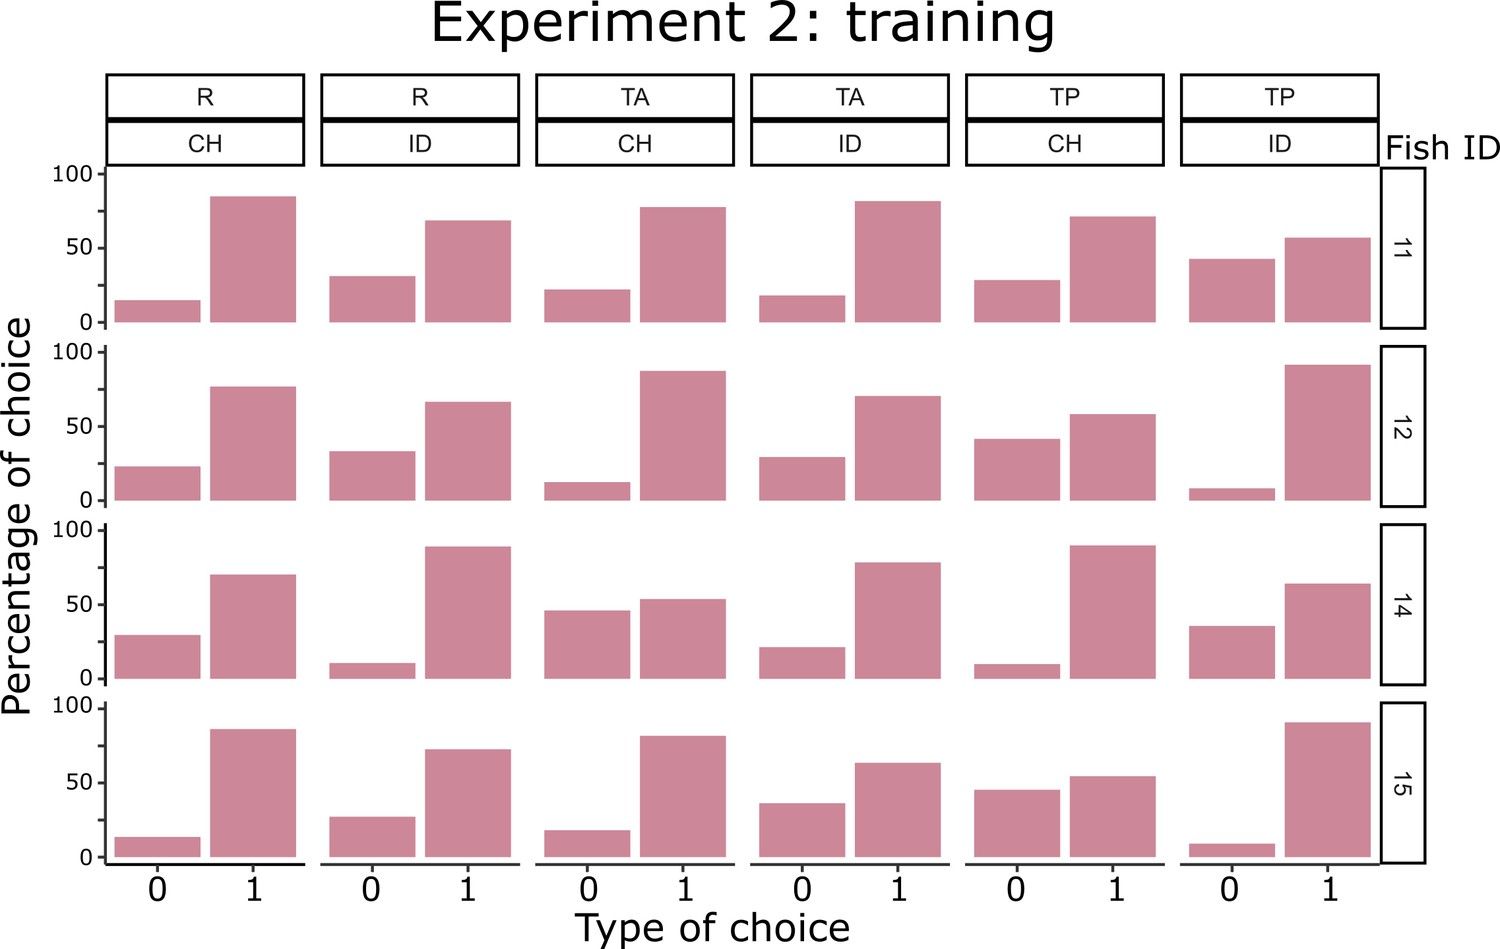
Performance data for each non-numerical control condition at training in Experiment 2.
Type of choices 0 and 1 corresponds to uncorrect and correct choices, respectively (training data refer to the last two training sessions, when learning criterion was reached).
Figure 5 with 1 supplement
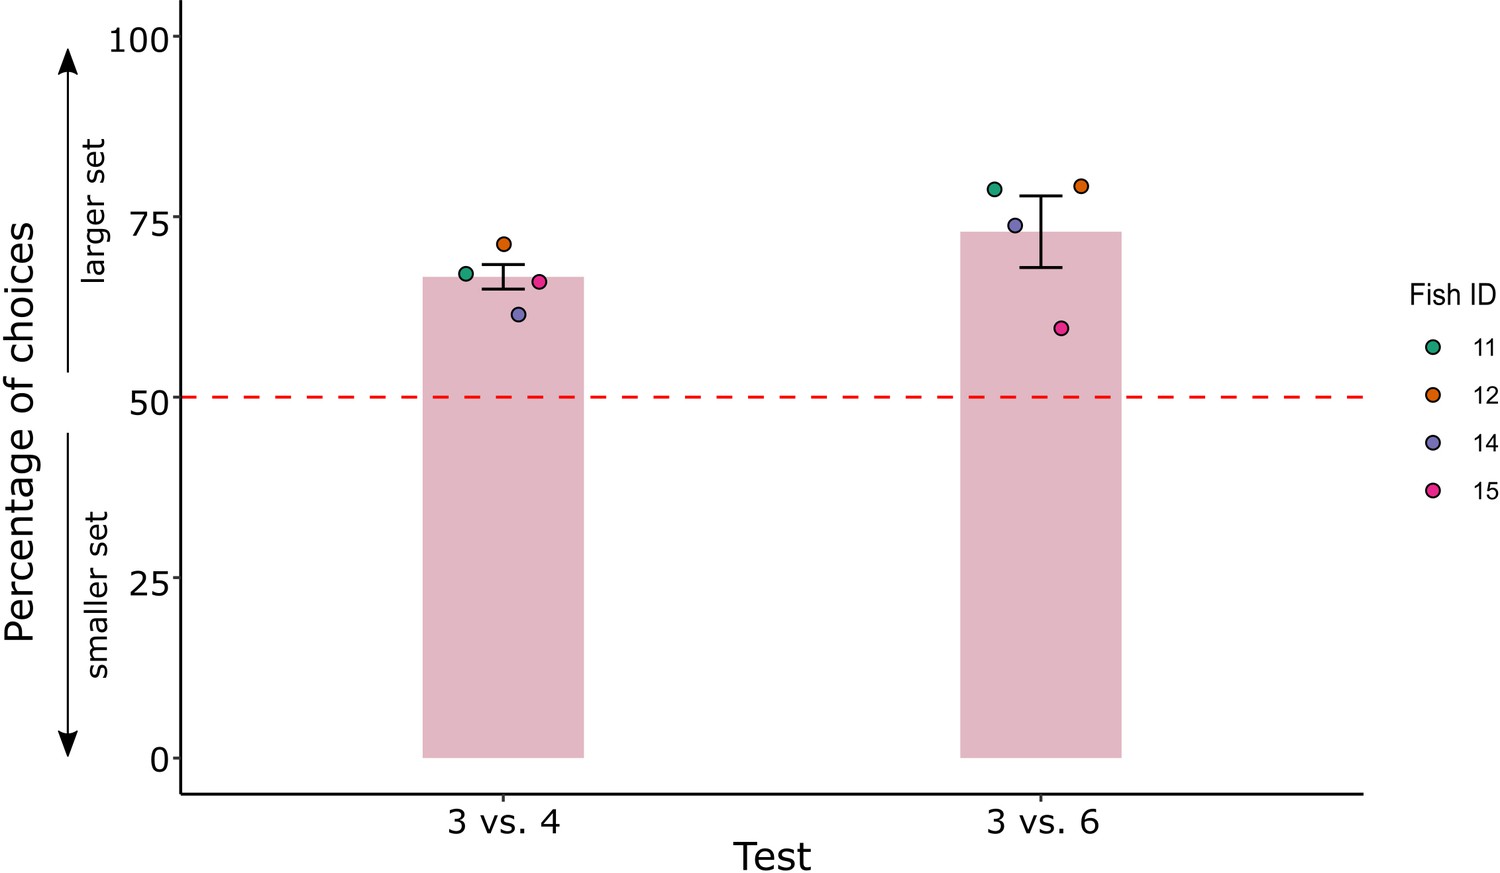
Percentage of choice for the larger set (mean ± standard error of the mean [SEM]) in the comparison test set of Experiment 2.
Coloured dots represent the individual performance for each fish.
Figure 5—figure supplement 1
Individual performance data for each non-numerical control condition at test in Experiment 1.
Type of choices A and R corresponds to choices for absolute and relative numerosity.
Figure 6
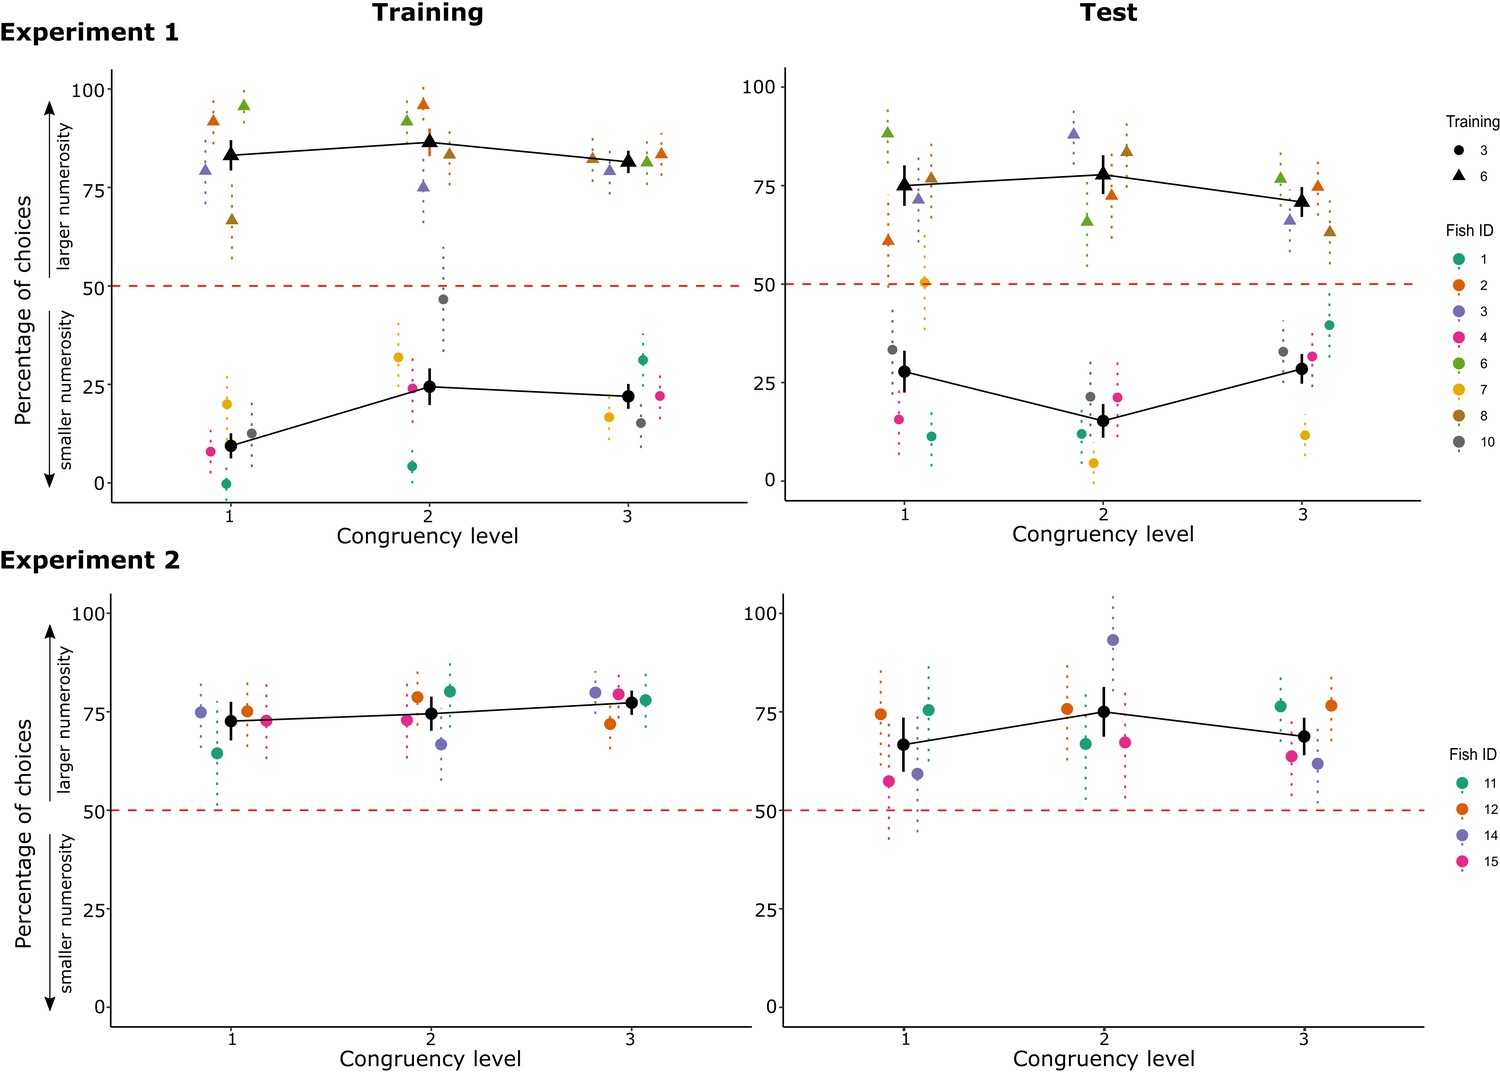
The graphs report the choices for the larger numerosity depending on the different levels of congruency: graphs are reported both for the training phase (mean data of the last two sessions when the criterion was reached) and the test phase, for both Experiments 1 and 2.
In Experiment 1, data are grouped by training condition (circles for fish trained with three dots, triangles for fish trained with six dots). Coloured points represent single fish performance with standard error bars (i.e. data are mediated over trials with the same congruency level, per each fish), while black points represent the overall mean (i.e. data are mediated over all the trials with the same congruency level). Red dotted lines represent chance levels.
-
Figure 6—source data 1
Comparisons between different levels of congruity (p values of post hoc analysis with Tukey correction) and 95% confidence intervals for each level.
- https://cdn.elifesciences.org/articles/74057/elife-74057-fig6-data1-v2.xlsx
Figure 7
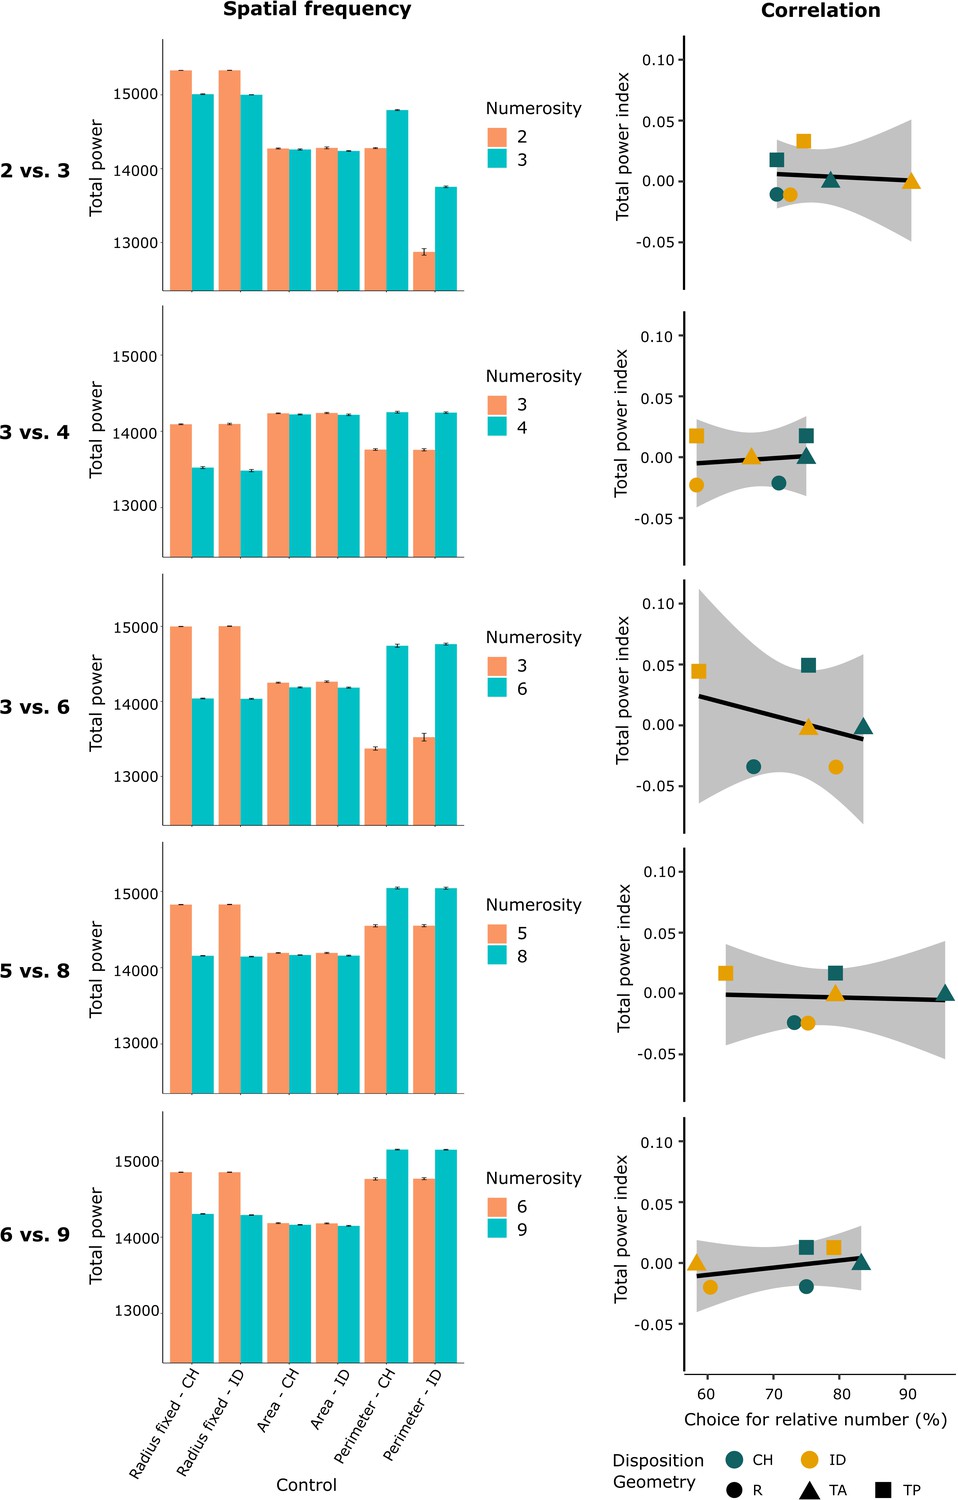
The histograms (on the left) show the spatial frequency (total power) for each numerical comparison among the different control groups (non-numerical variables control).
The different constraints applied to the stimuli (control of the area, perimeter, or elements radius) showed to influence the spatial frequency between the two compared numerosities. The regression lines (on the right) show the correlation between fish’ performance accuracy (choice for the relative numerosity) and the spatial frequency (total power index between the two total power values), for all numerical comparisons. The coloured shapes (dots, triangles and squares) correspond to each specific control condition.
Figure 8
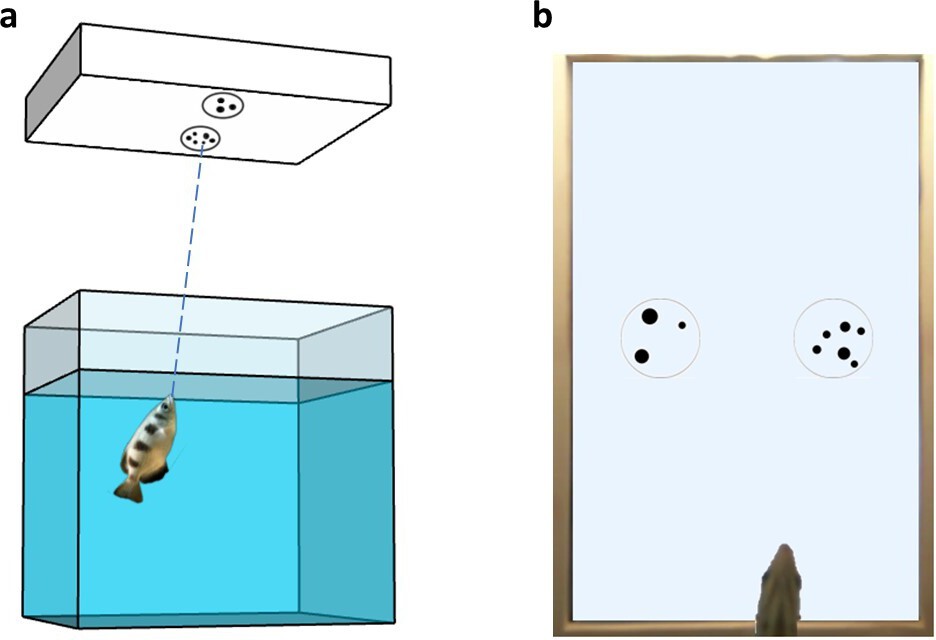
Experimental setup.
(a) Schematic representation of the experimental apparatus. (b) Bottom view of the tank from the camera placed below the tank’s pavement.
Videos
Video 1
Video example of a subject performing a 2 vs 3 discrimination during the training phase (Experiment 2; three dots stimulus is rewarded).
The video camera records a bottom view of the fish and the screen.
Video 2
Video example of a subject performing a 3 vs 6 discrimination during the training phase (Experiment 1; three dots stimulus is rewarded).
The video camera records a lateral view of the fish and the screen.
Tables
Table 1
Schematic representation of the levels of congruity for each control condition (reported in the table rows) applied in the study; the columns represent the different variables that could covary with numerosity (C: congruent with number, IC: incongruent with number).
| Control condition | Overall area | Overall perimeter | Convex-hull (CH) | Inter-distance (ID) | Congruency level |
|---|---|---|---|---|---|
| Perimeter – CH | IC | = | = | C | 1a |
| Perimeter – ID | IC | = | C | = | 1b |
| Area – CH | = | C | = | C | 2a |
| Area – ID | = | C | C | = | 2b |
| Radius fixed – CH | C | C | = | C | 3a |
| Radius fixed – ID | C | C | C | = | 3b |
Additional files
Download links
A two-part list of links to download the article, or parts of the article, in various formats.
Downloads (link to download the article as PDF)
Open citations (links to open the citations from this article in various online reference manager services)
Cite this article (links to download the citations from this article in formats compatible with various reference manager tools)
Archerfish number discrimination
eLife 11:e74057.
https://doi.org/10.7554/eLife.74057


