Different brain systems support learning from received and avoided pain during human pain-avoidance learning
- Department of Psychology, University of Amsterdam, Netherlands
- Department of Psychology, Leiden University, Netherlands
- Leiden Institute for Brain and Cognition, Netherlands
- Department of Psychology, McGill University, Canada
- Alan Edwards Centre for Research on Pain, McGill University, Canada
- Department of Research and Statistics, Municipality of Amsterdam, Netherlands
- Department of Anesthesiology, Leiden University Medical Center, Netherlands
Figures
Figure 1 with 2 supplements
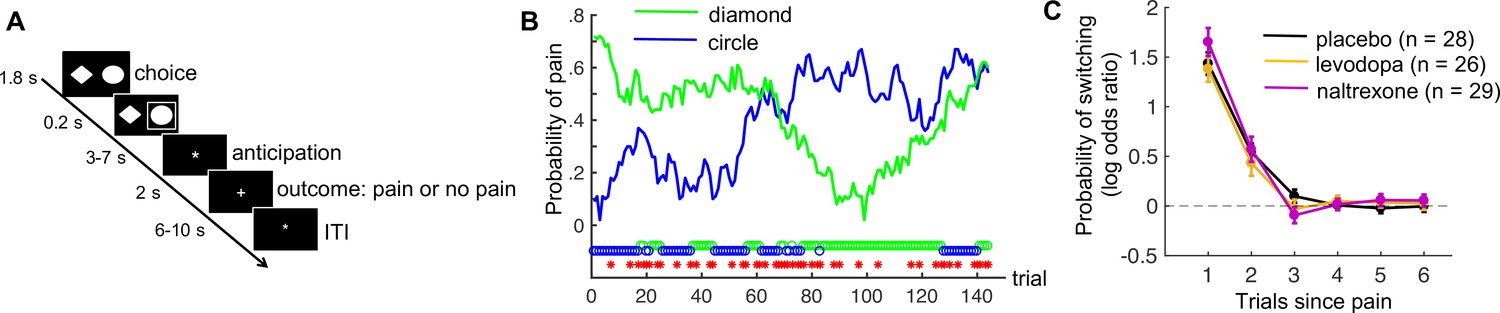
Pain-avoidance learning task.
(A) Outline of one trial. (B) Example of pain probabilities and choice data for one participant. The green and blue lines show the trial-specific probabilities of receiving a painful heat stimulus when choosing each option. The green and blue circles below the graph indicate the participant’s choices, and the red stars indicate trials on which pain was delivered. (C) Probability of switching per treatment group, as a function of pain 1–6 trials back. Error bars are standard errors.
Figure 1—figure supplement 1
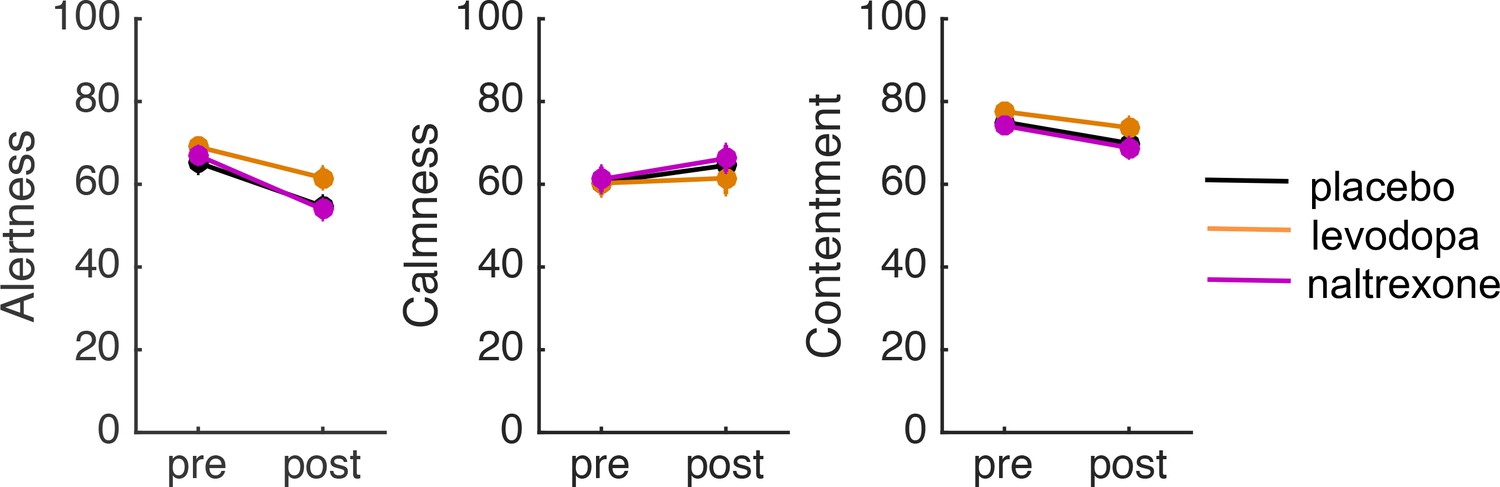
Pre- and post-treatment ratings of alertness, calmness, and contentment in each treatment group.
Error bars indicate standard errors. The participants assigned to the three treatment groups did not differ in their pretreatment ratings of alertness, calmness, or contentment (all p’s > 0.3). To assess potential treatment effects on subjective state we conducted analyses of covariance (ANCOVAs) on the post-treatment ratings of alertness, calmness, and contentment (made 2 hr after drug intake), with treatment as a between-subject factor and the pretreatment ratings as covariate. There was no effect of treatment on any of these ratings (all p’s > 0.08), suggesting that the drugs did not affect subjective state.
Figure 1—figure supplement 2
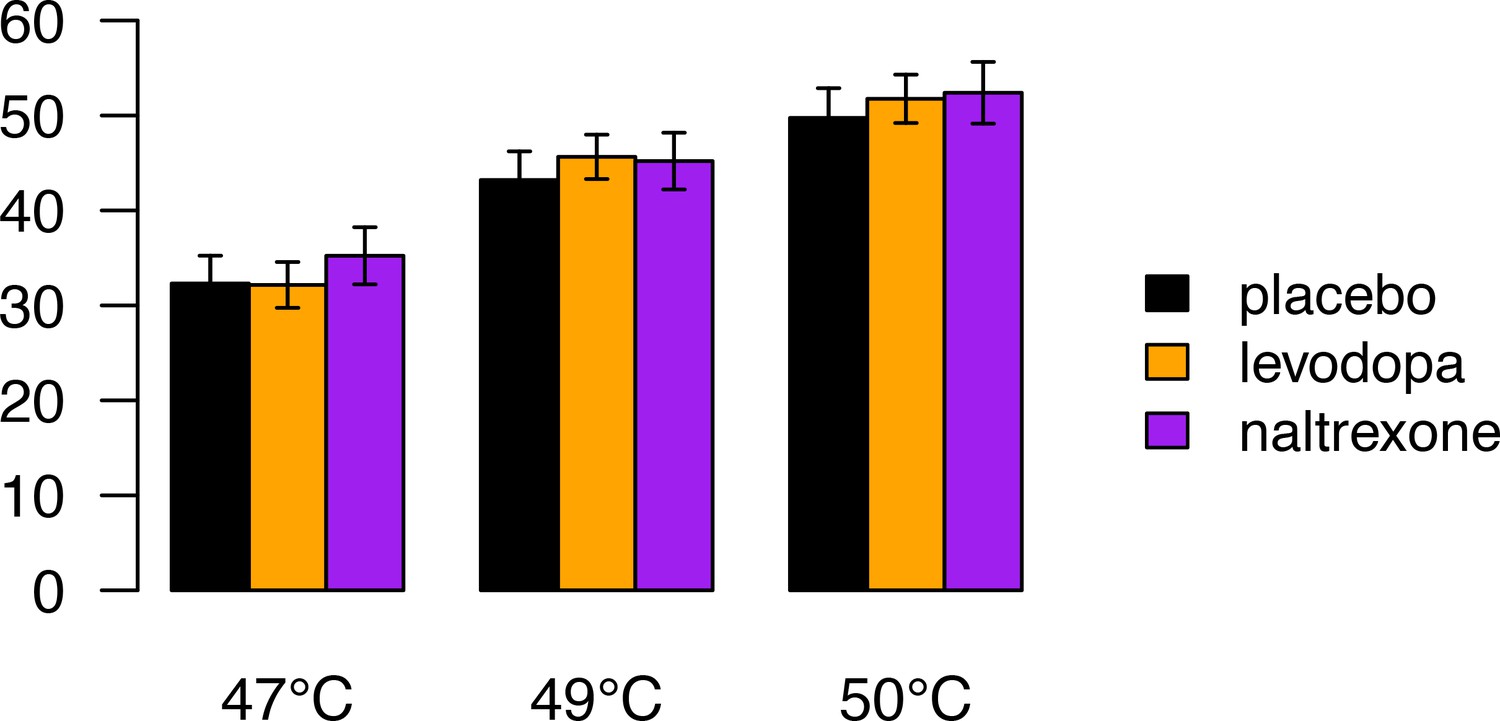
Pain ratings during a pain-rating task that preceded the pain-avoidance learning task, as a function of stimulus temperature and treatment group.
Error bars indicate standard errors. Participants received five 47°C, five 49°C, and five 50°C heat stimuli, in random order, to their left lower leg (ramp rate = 40°C/s; 1 s at peak temperature, stimulus onset asynchrony = 17–25 s). Following each heat stimulus participants rated their experienced pain on a 100-unit visual analog scale with anchors of ‘no pain’ and ‘worst-imaginable pain’, respectively. We conducted a mixed analysis of variance (ANOVA) on participants’ pain ratings with stimulus temperature (47, 49, and 50°C coded as −1, 0, and 1, respectively) as within-subject factor and treatment as between-subject factor. Pain ratings increased as a function of stimulus temperature (F(1,84) = 424, p < 0.001). However, there was no main effect of treatment (F(2,84) = 0.21, p = 0.81) and no temperature × treatment interaction (F(2,84) = 0.76, p = 0.47). Thus, the drugs did not affect the subjective pain experience evoked by heat-pain stimuli. Note that four participants who were included in this analysis were excluded from the functional magnetic resonance imaging (fMRI) analyses of the pain-avoidance learning task, because of excessive head movement.
Figure 2 with 2 supplements

Model parameters.
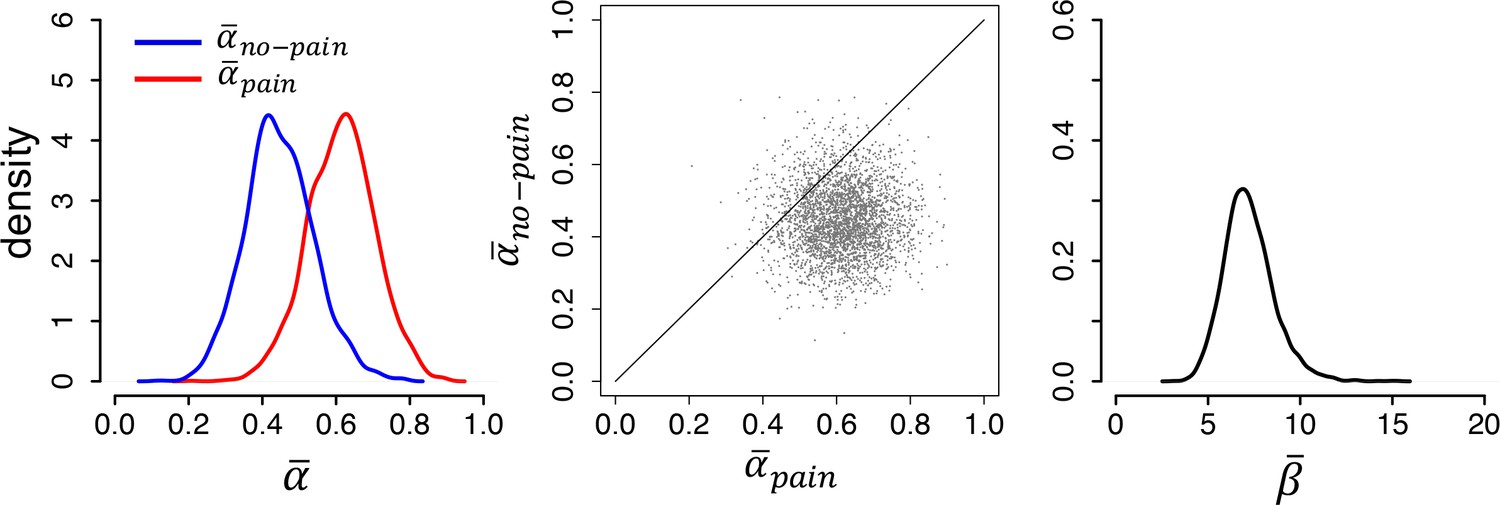
(A) Posterior distributions of the parameters’ group-level means for each group (left and right panels). Parameters and are learning rates for avoided and received pain outcomes, respectively; parameter is the inverse-temperature parameter. The middle panels are joint density plots of and (dots are samples from the Markov chain Monte Carlo [MCMC]), showing that is reliably greater than in the placebo group only. (B) The difference between the posterior distributions for each drug group vs. the placebo group, showing that is greater and is smaller in both drug groups compared to the placebo group. Red lines indicate 95% highest density intervals (HDIs).
-
Figure 2—source data 1
The 95% highest density intervals (HDIs) of the posterior distributions of each participant’s learning rate for pain () and no-pain () outcomes.
- https://cdn.elifesciences.org/articles/74149/elife-74149-fig2-data1-v1.docx
Figure 2—figure supplement 1
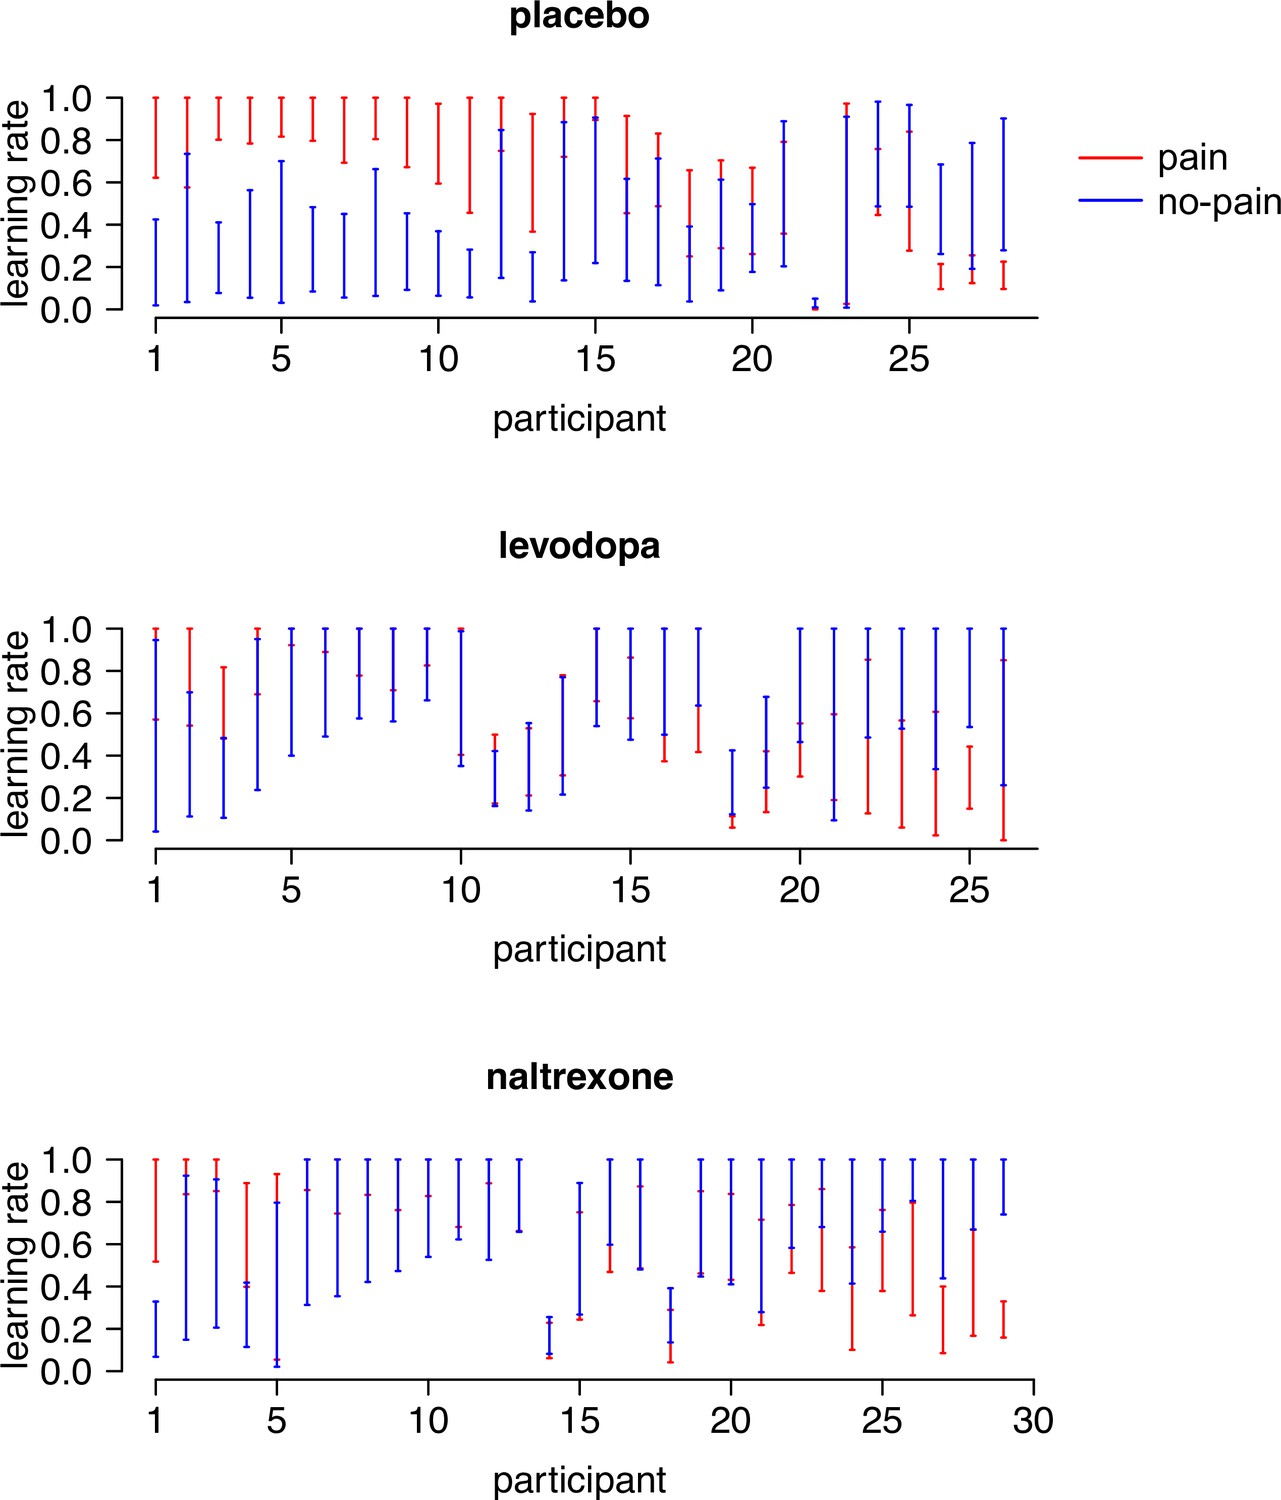
The 95% highest density intervals (HDIs) of the posterior distributions of each participant’s learning rate for pain ( ) and no-pain () outcomes.
Participants are sorted according to the difference between their two learning rates ( − ). Note that and were positively correlated in the levodopa group (r = 0.43, p = 0.03), but were not correlated in the placebo (r = −0.16, p = 0.4) and naltrexone (r = 0.31, p = 0.10) group.
Figure 2—figure supplement 2
Modeling results from an independent sample of untreated participants from a previous study (N = 23), replicating the asymmetric learning rates ( > ) found in our placebo group.
Figure 3
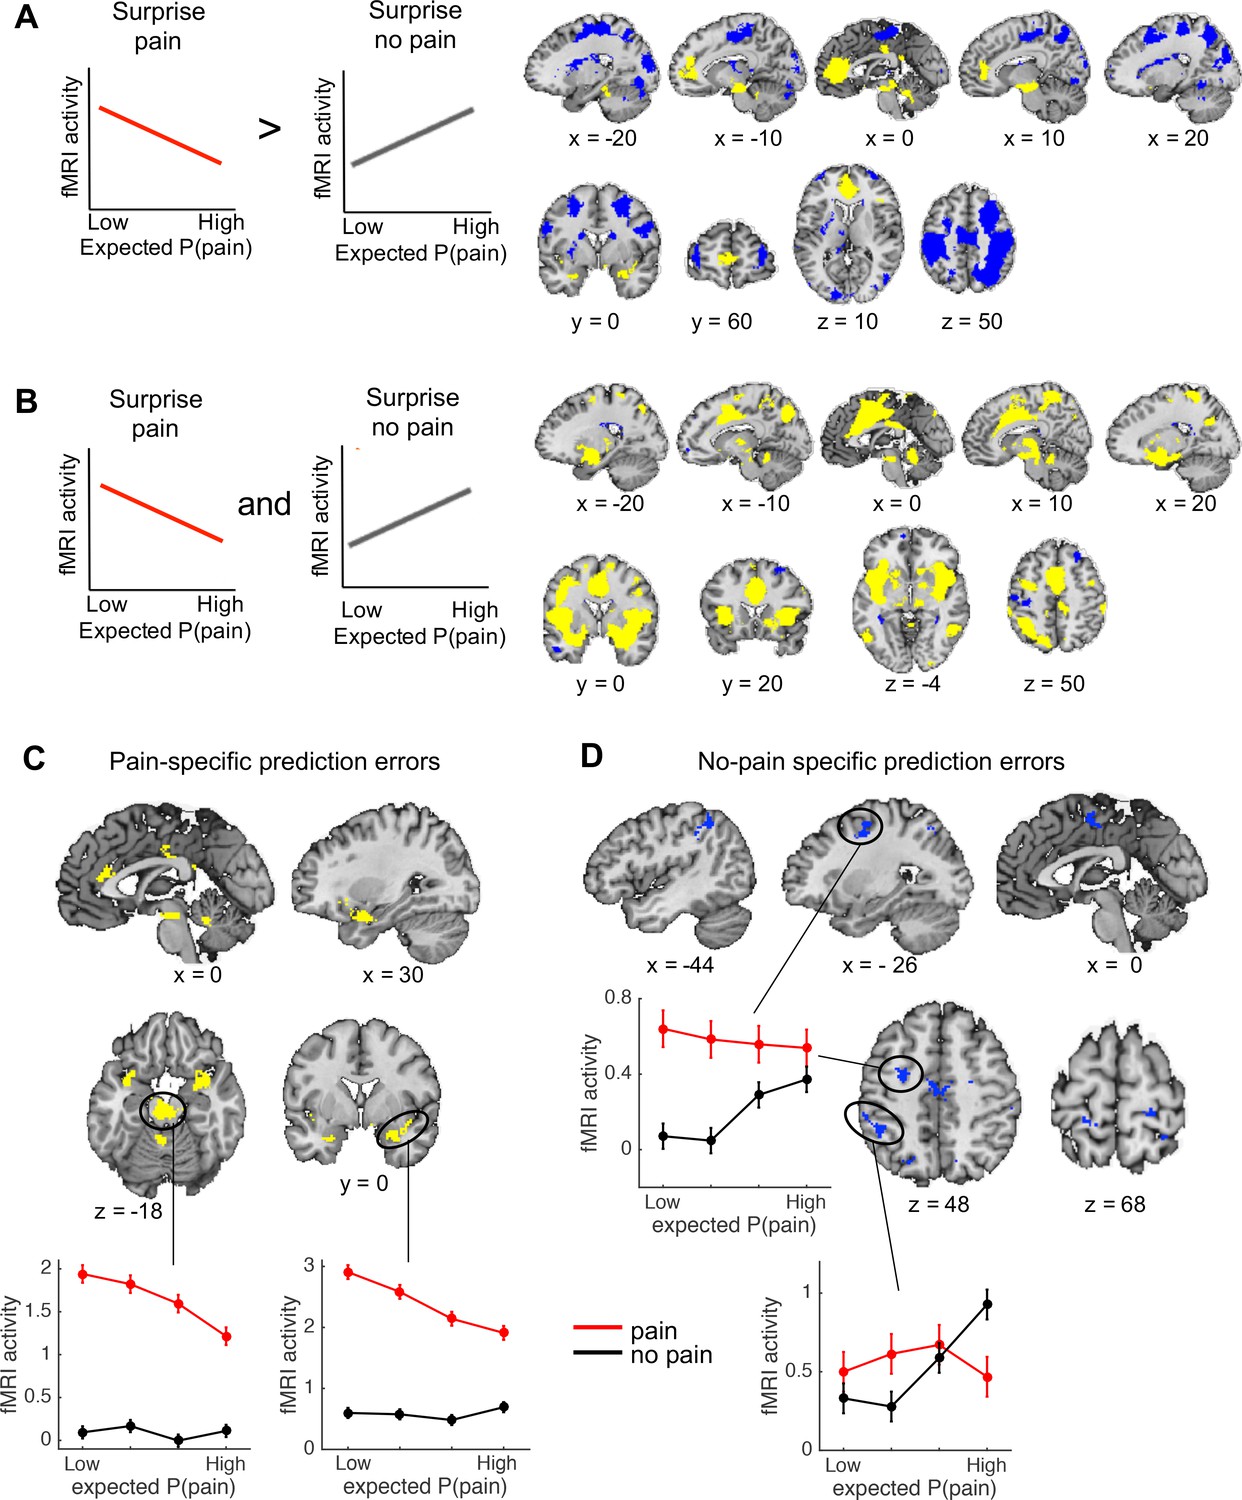
Outcome-specific prediction-error signals (N = 74).
(A) Activation tracking surprise more for received than avoided pain (yellow) and vice versa (blue). Note that this includes activation that tracks expected pain probability across both outcomes. Expected P(pain) = expected pain probability. (B) Activation tracking surprise for both received and avoided pain (i.e., absolute prediction error). Activation maps in A and B are thresholded at q < 0.05, false discovery rate (FDR) corrected for multiple comparisons across the whole brain. (C) Regions encoding surprise more for received than avoided pain, which cannot be explained by a general sensitivity to expected pain probability. These regions showed positive activation for both the first (A) and second (B) contrast, each thresholded at q < 0.05, FDR corrected. (D) Regions encoding surprise more for avoided than received pain, which cannot be explained by a general sensitivity to expected pain probability. These regions showed negative activation for the first, and positive activation for the second contrast, each thresholded at q < 0.05, FDR corrected. The line plots show the mean activity extracted from the brainstem and right amygdala (C) and left dlPFC and parietal (D) clusters per quartile of expected pain probability, illustrating the encoding of outcome-specific prediction errors in these regions. Error bars are standard errors.
Appendix 1—figure 1
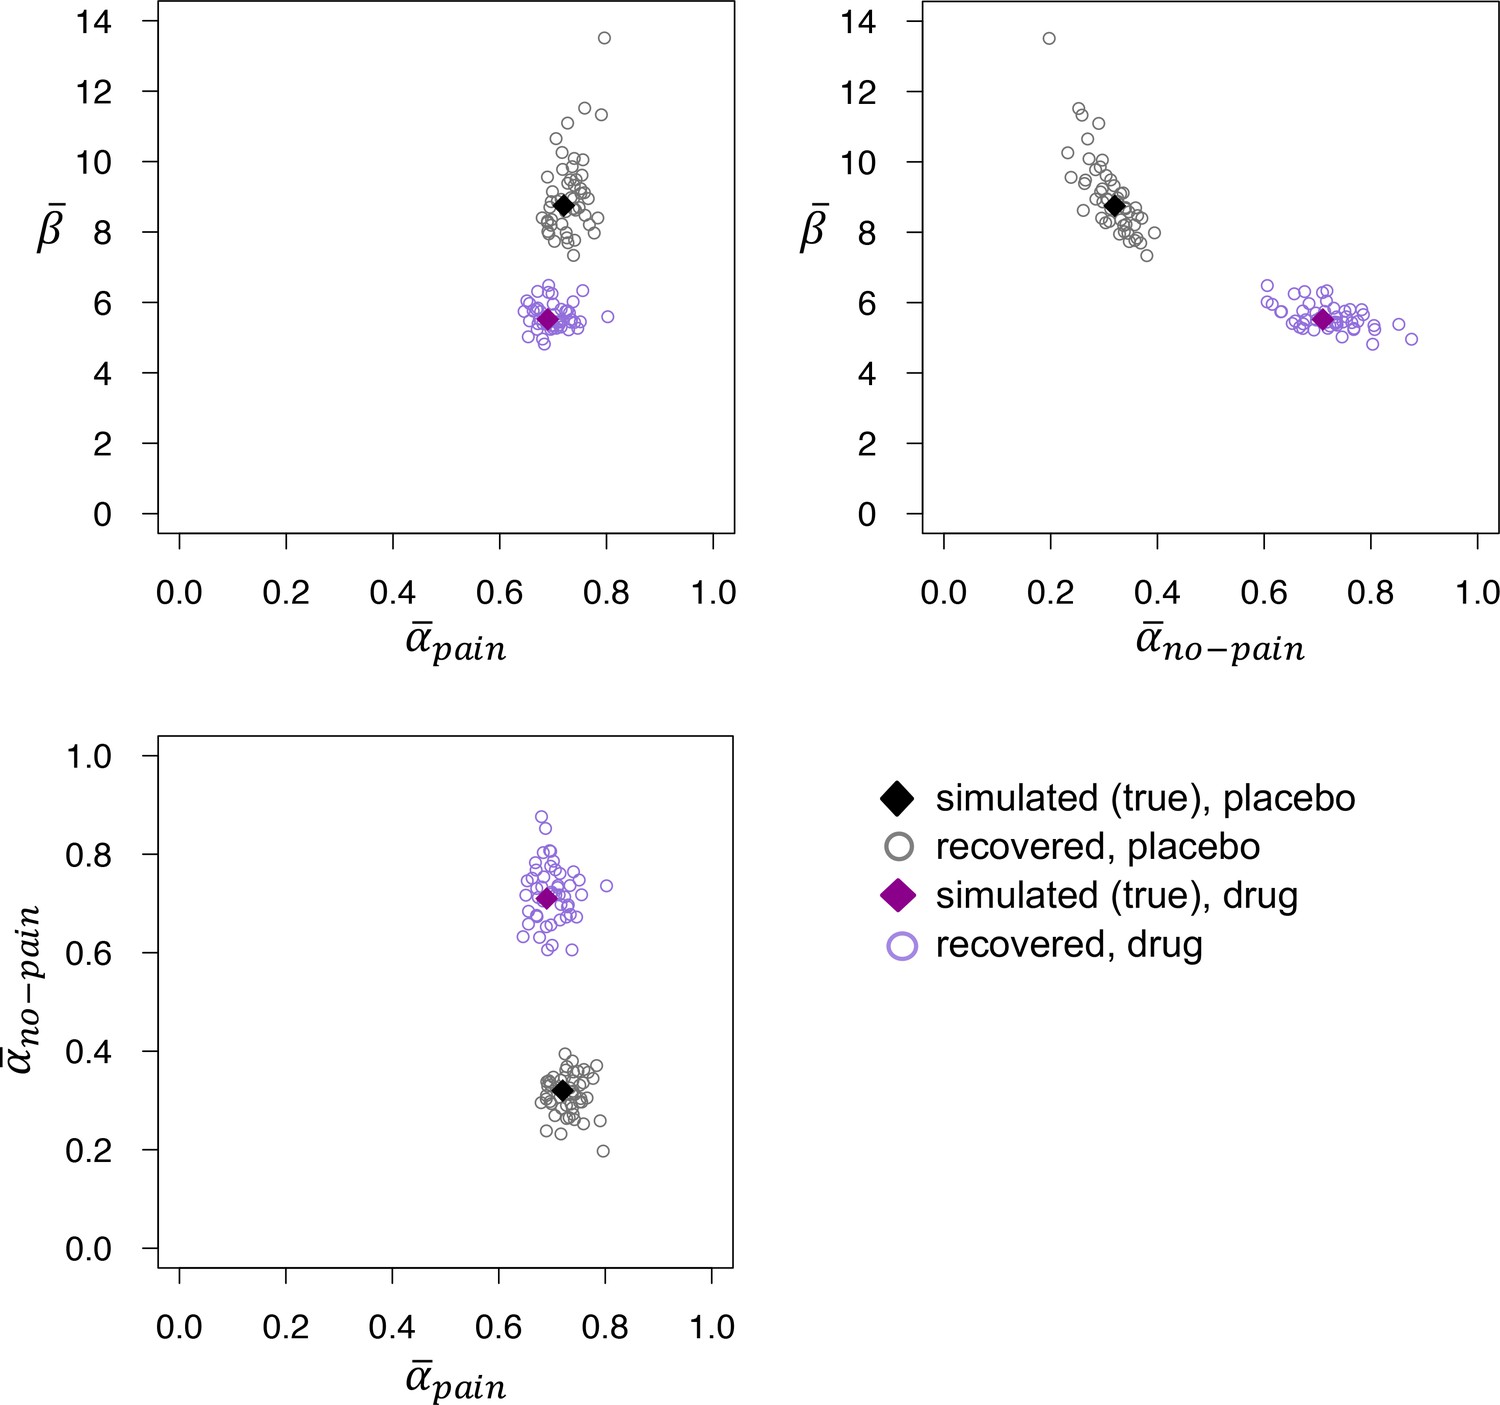
Recovered posterior medians of , , and for fits to datasets that were simulated using the posterior medians from the placebo (black) and drug (purple) groups.
The recovered values of do not differ between the two groups, but recovered is reliably higher and recovered reliably lower in the drug group, mirroring the parameter estimates obtained from fits to the empirical data.
Appendix 2—figure 1
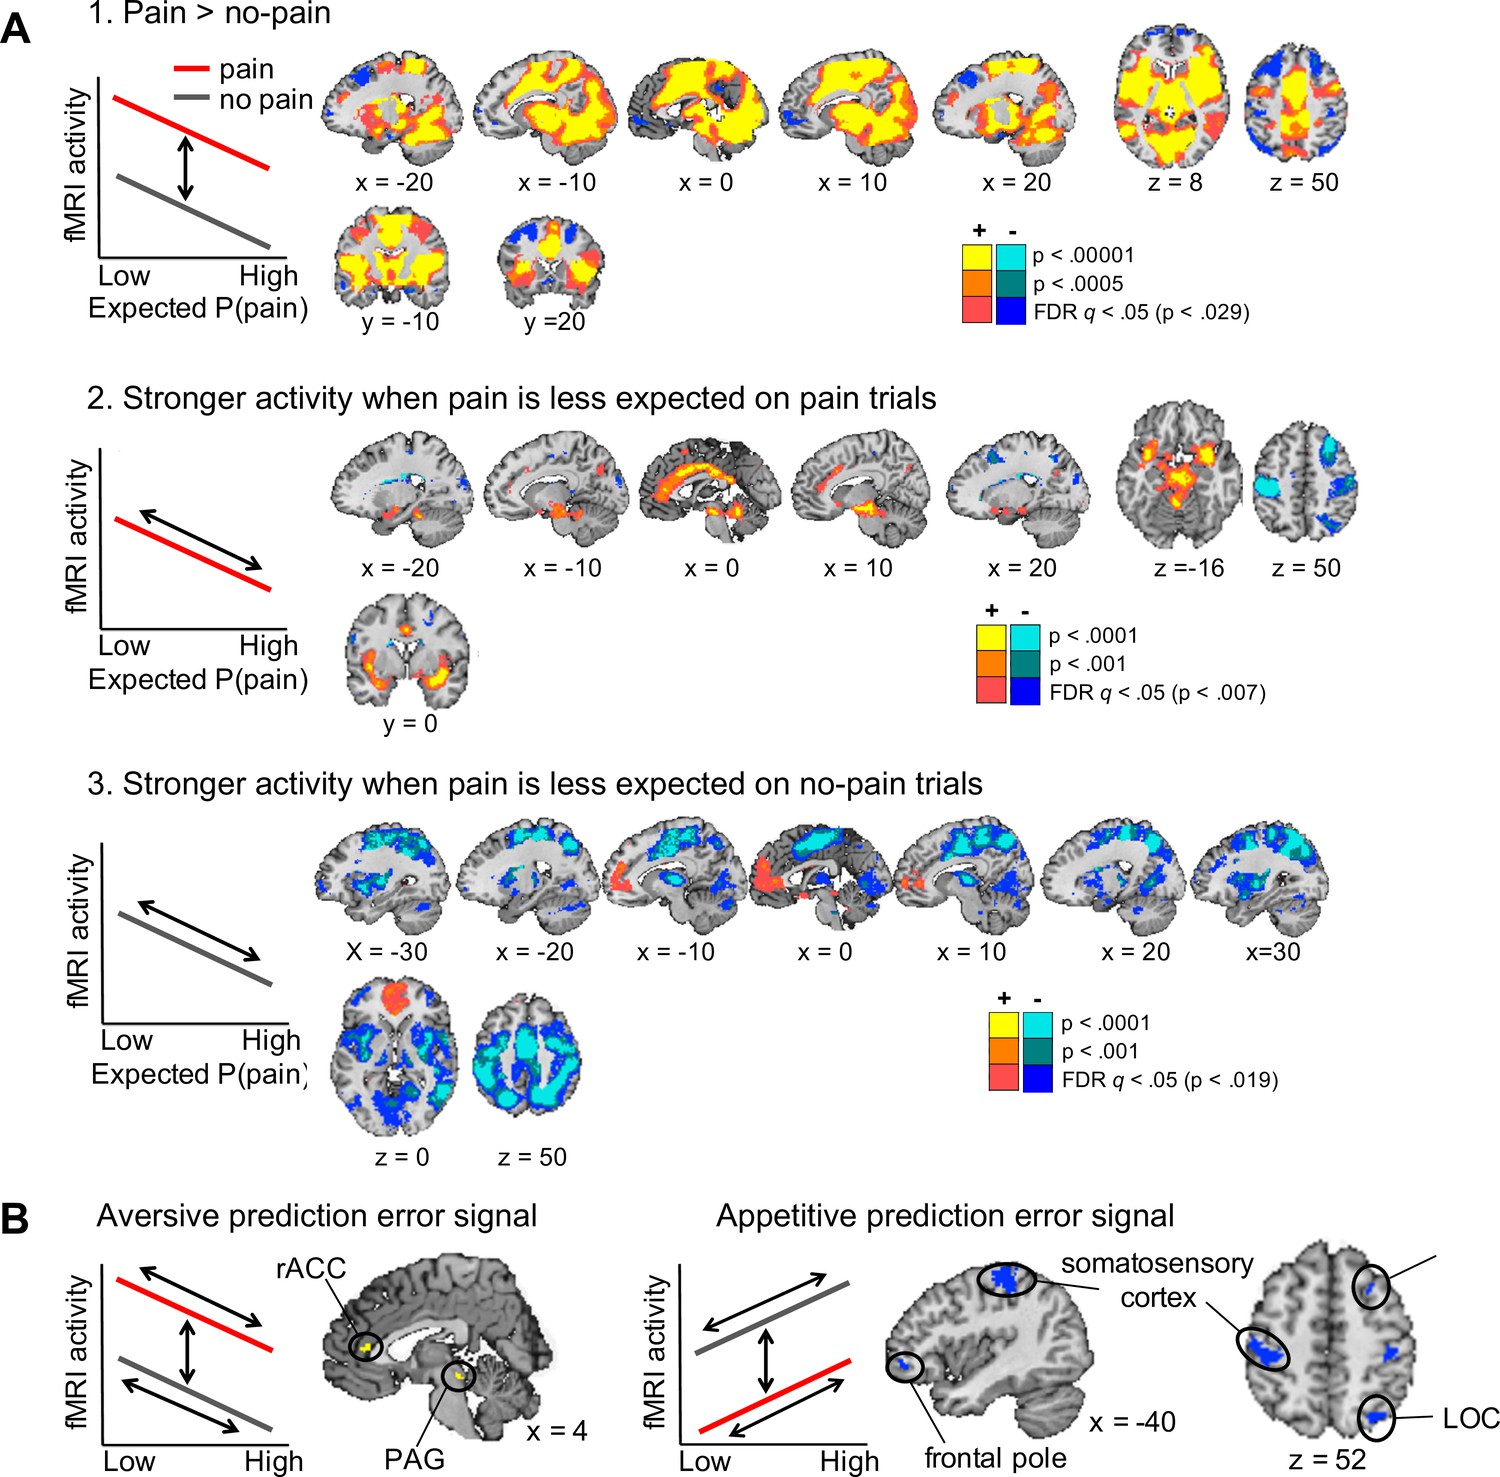
Axiomatic tests of brain activation encoding general aversive and appetitive prediction errors (N =74).
(A) Activation associated with the three axioms for aversive prediction errors in our task. Yellow regions showed the effects illustrated in the left panels, and blue regions showed the reverse effects (i.e., the axioms for appetitive prediction errors). All maps were thresholded at q < 0.05, false discovery rate (FDR) corrected for multiple comparisons across the whole brain, with higher voxel thresholds superimposed for display. (B) Conjunction results. Regions activated for each of the above three contrasts, all thresholded at q < 0.05 FDR corrected. Yellow and blue regions showed positive and negative responses for each contrast, respectively, thus encoded general aversive and appetitive prediction errors.
Tables
Appendix 1—table 1
Model-free performance measures in simulated datasets that were generated using the group-level mean parameters from our placebo and drug groups.
| Placebo simulations | Drug simulations | Averagep value | |
|---|---|---|---|
| Number of pain stimuli | 54.9 | 55.1 | 0.63 |
| Switching after pain | 45.0% | 44.1% | 0.44 |
| Switching after no pain | 4.8% | 3.7% | 0.41 |
-
Notes: Performance measures are averaged across all synthetic participants from each of 50 simulated datasets (27 synthetic participants per dataset). We performed 50 t-tests—each comparing the scores from the synthetic participants from one placebo vs. one drug simulation—and report their average p values.
Additional files
Download links
A two-part list of links to download the article, or parts of the article, in various formats.
Downloads (link to download the article as PDF)
Open citations (links to open the citations from this article in various online reference manager services)
Cite this article (links to download the citations from this article in formats compatible with various reference manager tools)
Different brain systems support learning from received and avoided pain during human pain-avoidance learning
eLife 11:e74149.
https://doi.org/10.7554/eLife.74149


