Life history predicts global population responses to the weather in terrestrial mammals
- Interdisciplinary centre for population dynamics (CPop), Department of Biology, University of Southern Denmark, Denmark
- Department of Zoology, University of Oxford, United Kingdom
- Centre for Ecological and Evolutionary Synthesis (CEES), Department of Biosciences, University of Oslo, Norway
Figures
Figure 1

486 long-term abundance records for the terrestrial mammals.
Map gives the locations for each record analysed in the current study. Points are transparent, such that colour intensity indicates the spatial density of records. The size of the point represents the record duration in years. The histogram in the bottom left gives the distribution of record lengths across the whole dataset. The bar graph in the bottom right is a frequency distribution of each of the mammal orders analysed in the current study.
Figure 2
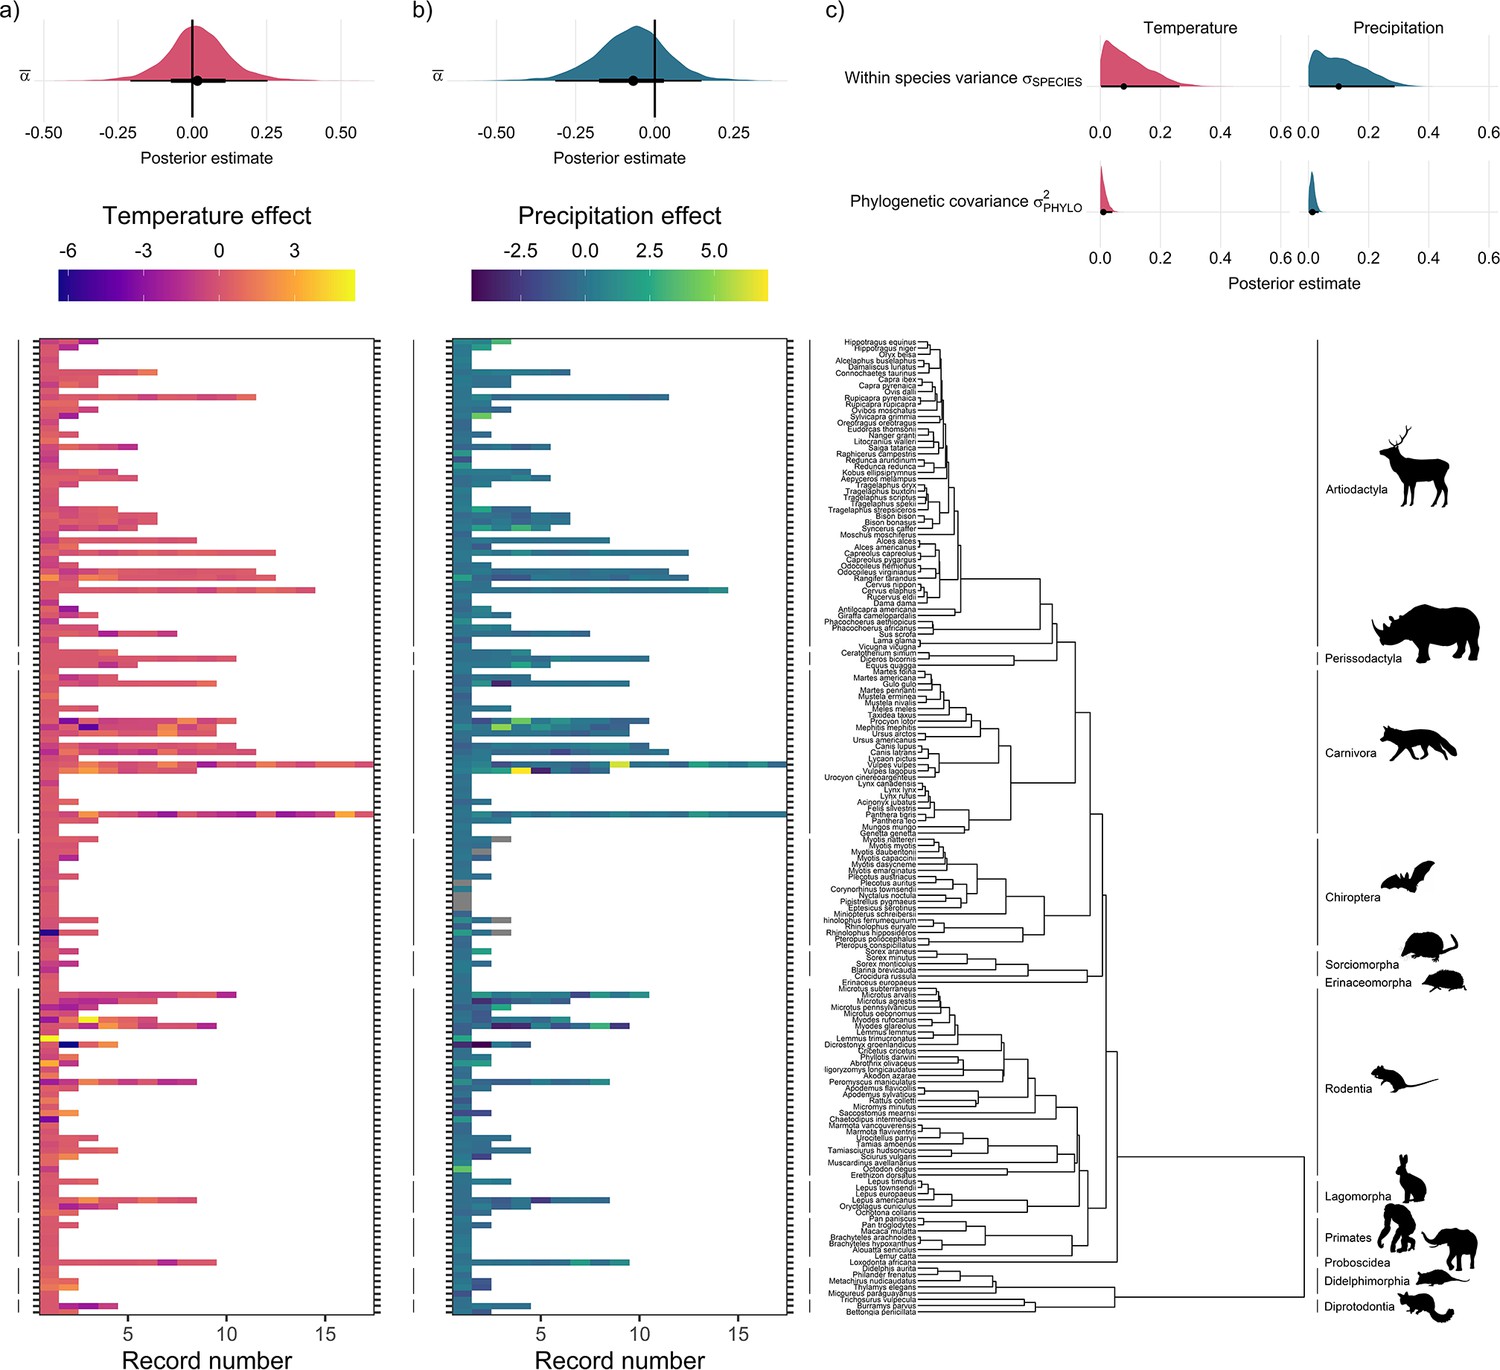
Global population responses to weather in the terrestrial mammals.
Heatmaps for population responses to temperature (a) and precipitation (b) for 157 species of terrestrial mammal. Each row of the heatmap is a species, and coloured rectangles are the population records. The colour denotes the coefficient of temperature/precipitation effects derived from autoregressive additive models. Here, positive numbers indicate that positive temperature/precipitation anomalies (hotter/wetter than average in a given year) were associated with increases in population size, and vice versa. The distribution half-eye plots in (a) and (b) (top) are summaries of the posterior distribution for the global intercept (α(0)) of temperature and precipitation responses across records, fit with a Gaussian Bayesian meta-regression. The points give the approximate posterior mean and the error bar is calculated using a cumulative distribution function. Bayesian models were fit incorporating phylogenetic covariance using the maximum clade credibility tree from Upham et al., 2019, which is plotted on the right with annotations indicating the mammal order. The distribution half-eye plots in (c) are the posterior distribution summaries for phylogenetic covariance and within-species variance from the Gaussian Bayesian meta-regression.
Figure 3
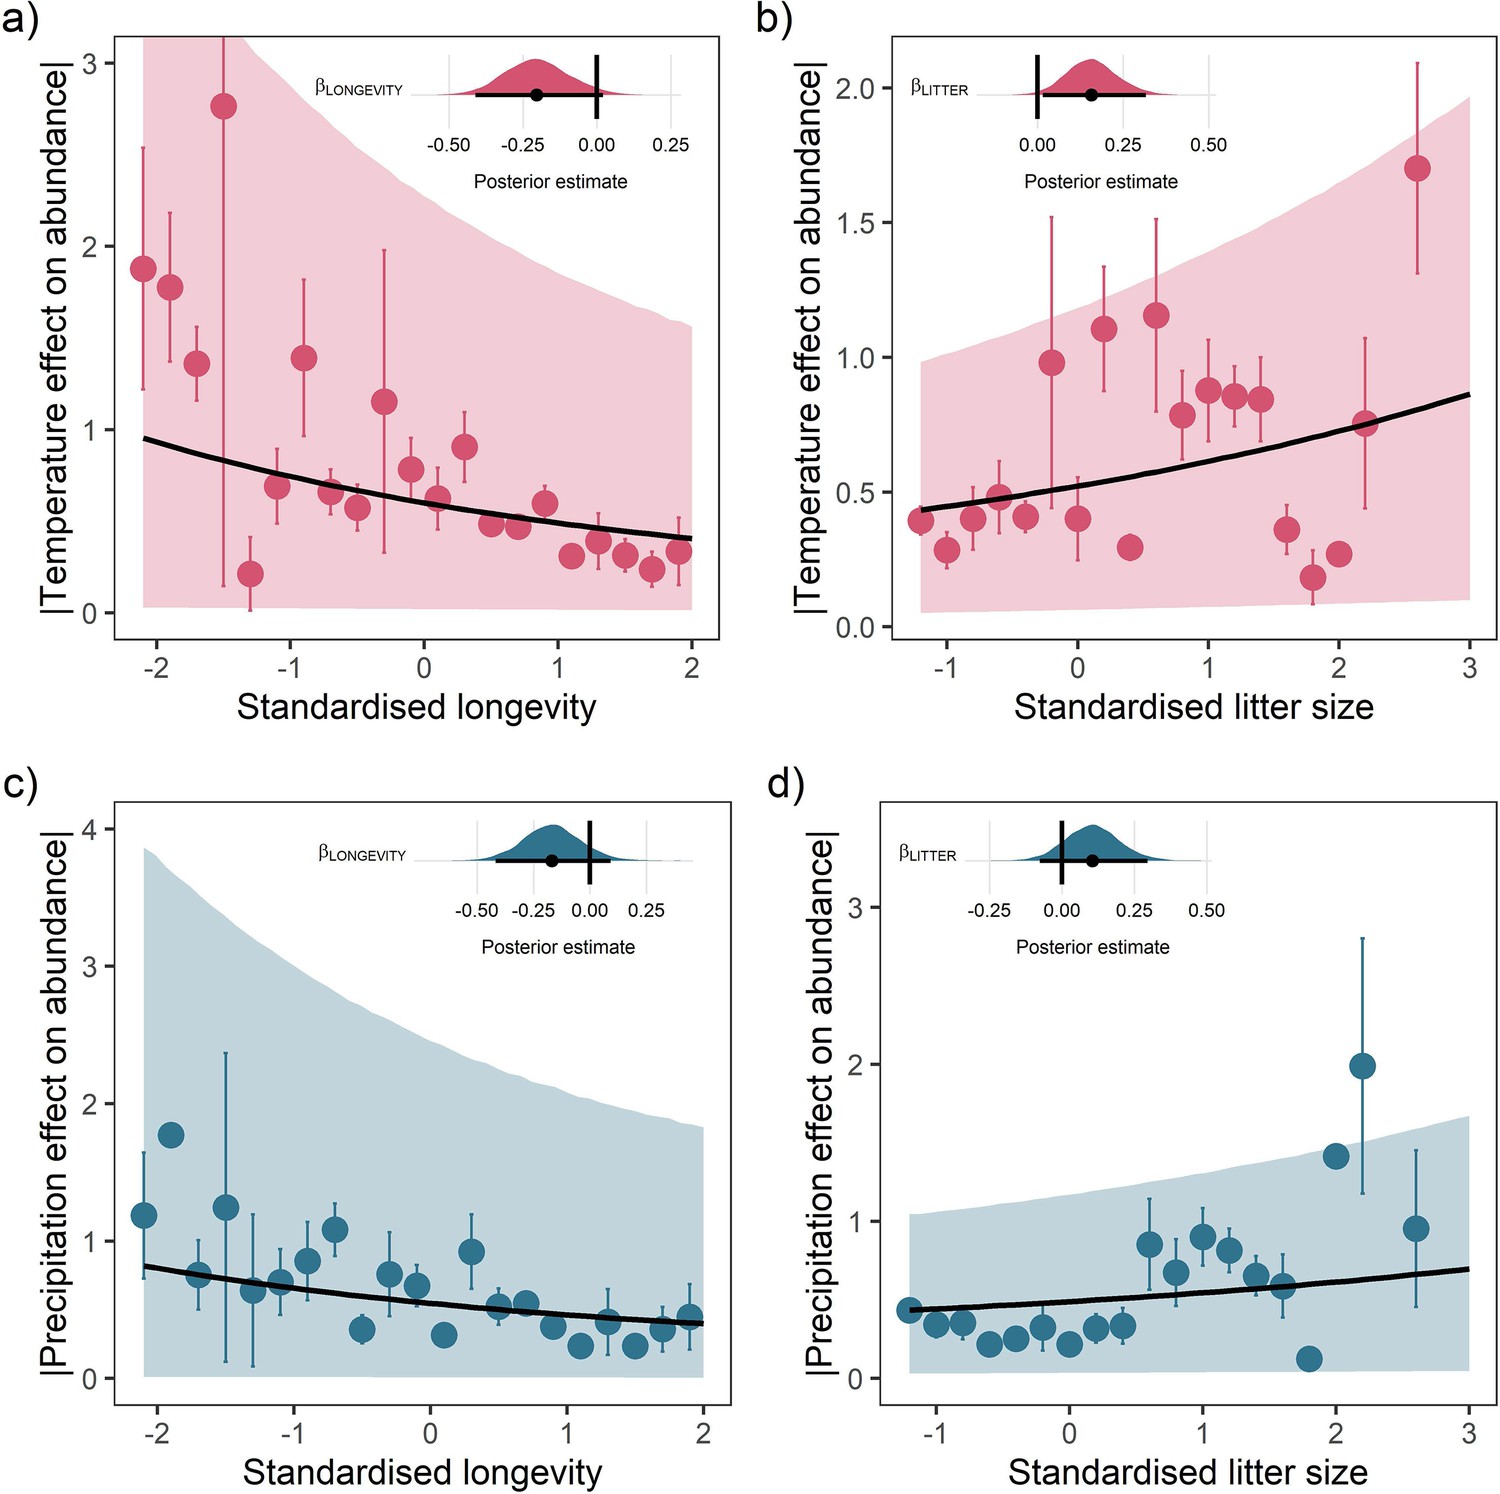
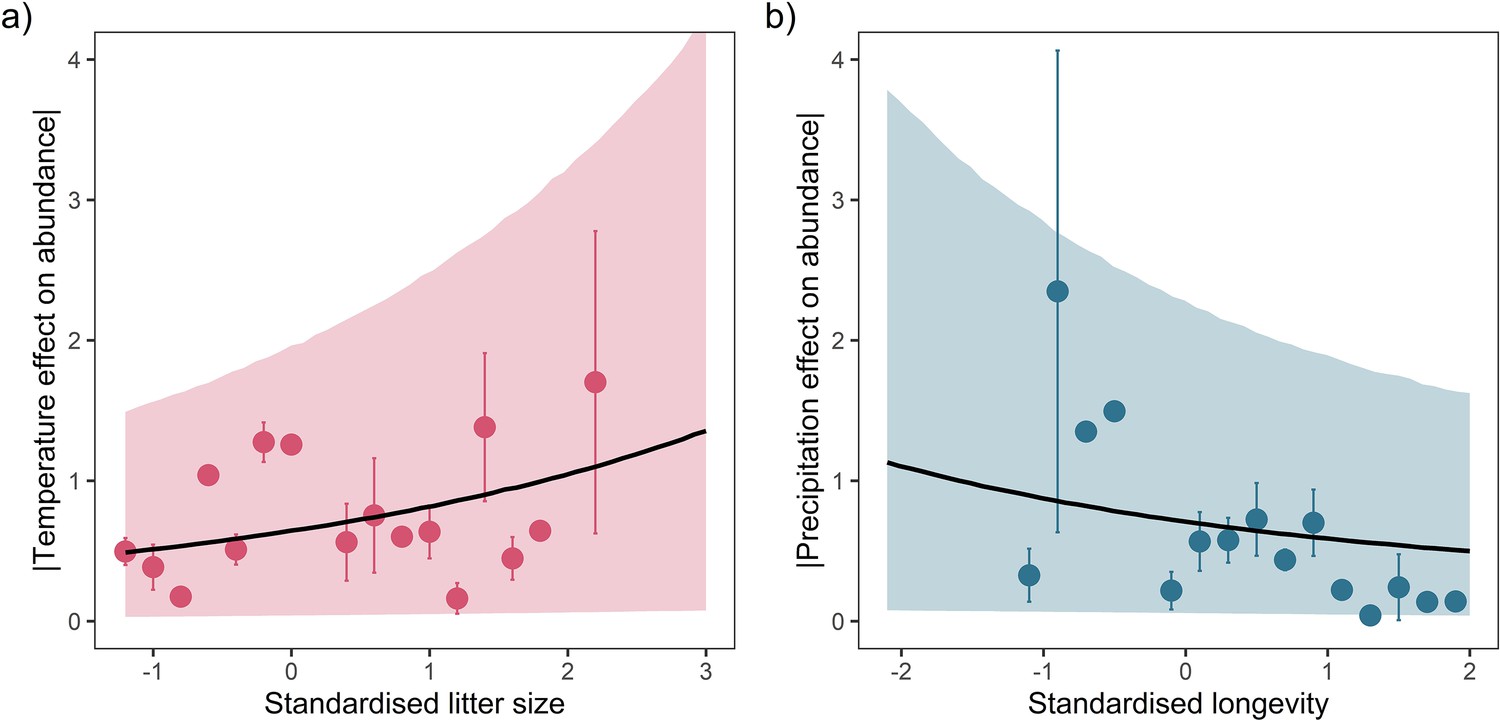
Life-history predicts population responses to weather in the terrestrial mammals.
Each panel presents the mean absolute effect of temperature (a and b) and precipitation (c and d) on population growth rates, |ω|, for standardised maximum longevity (a and c) and standardised mean litter size (b and d) (n = 486). Standardisation was performed using z-scores of the natural-log of raw life-history traits. The values on each x-axis are split into equal bins of 0.2 units from the minimum to the maximum life-history value. Points are coefficient means, with standard error bars. The black lines are the mean posterior predictions from the best predictive model, where predictions were calculated averaging over all other covariates and varying effects in the model. The shaded intervals are the 80% quantile prediction intervals. Panel insets give posterior distribution summaries for the slope terms presented in each panel. Two points are omitted from the plotting panel due to large mean coefficient values and high standard errors.
Appendix 1—figure 1
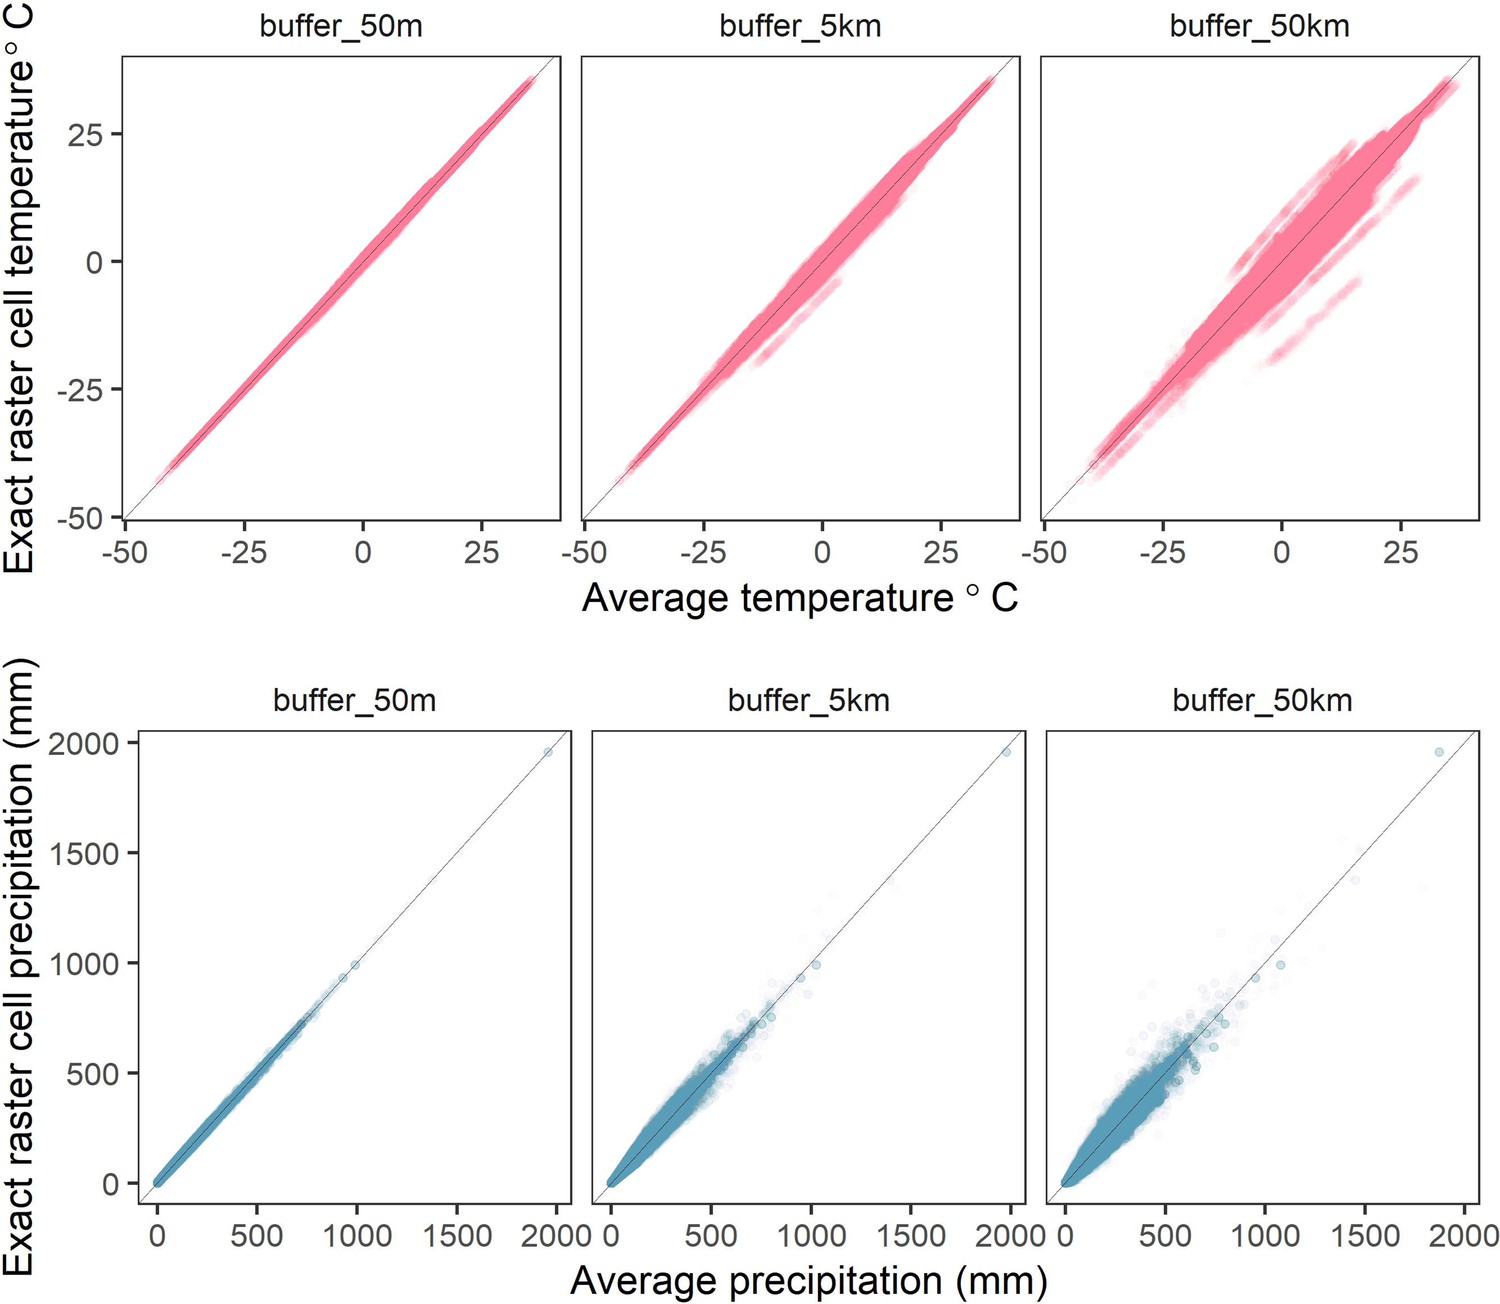
Correlations between raster cell weather values for different buffer radii.
The average values of mean monthly temperature (top) and total precipitation (bottom) compared to exact raster cell values for buffer radii of 50m-50km (left-right) calculated from the CHELSA global gridded raster dataset. Buffered radii calculated using the exactextractr R package.
Appendix 1—figure 2
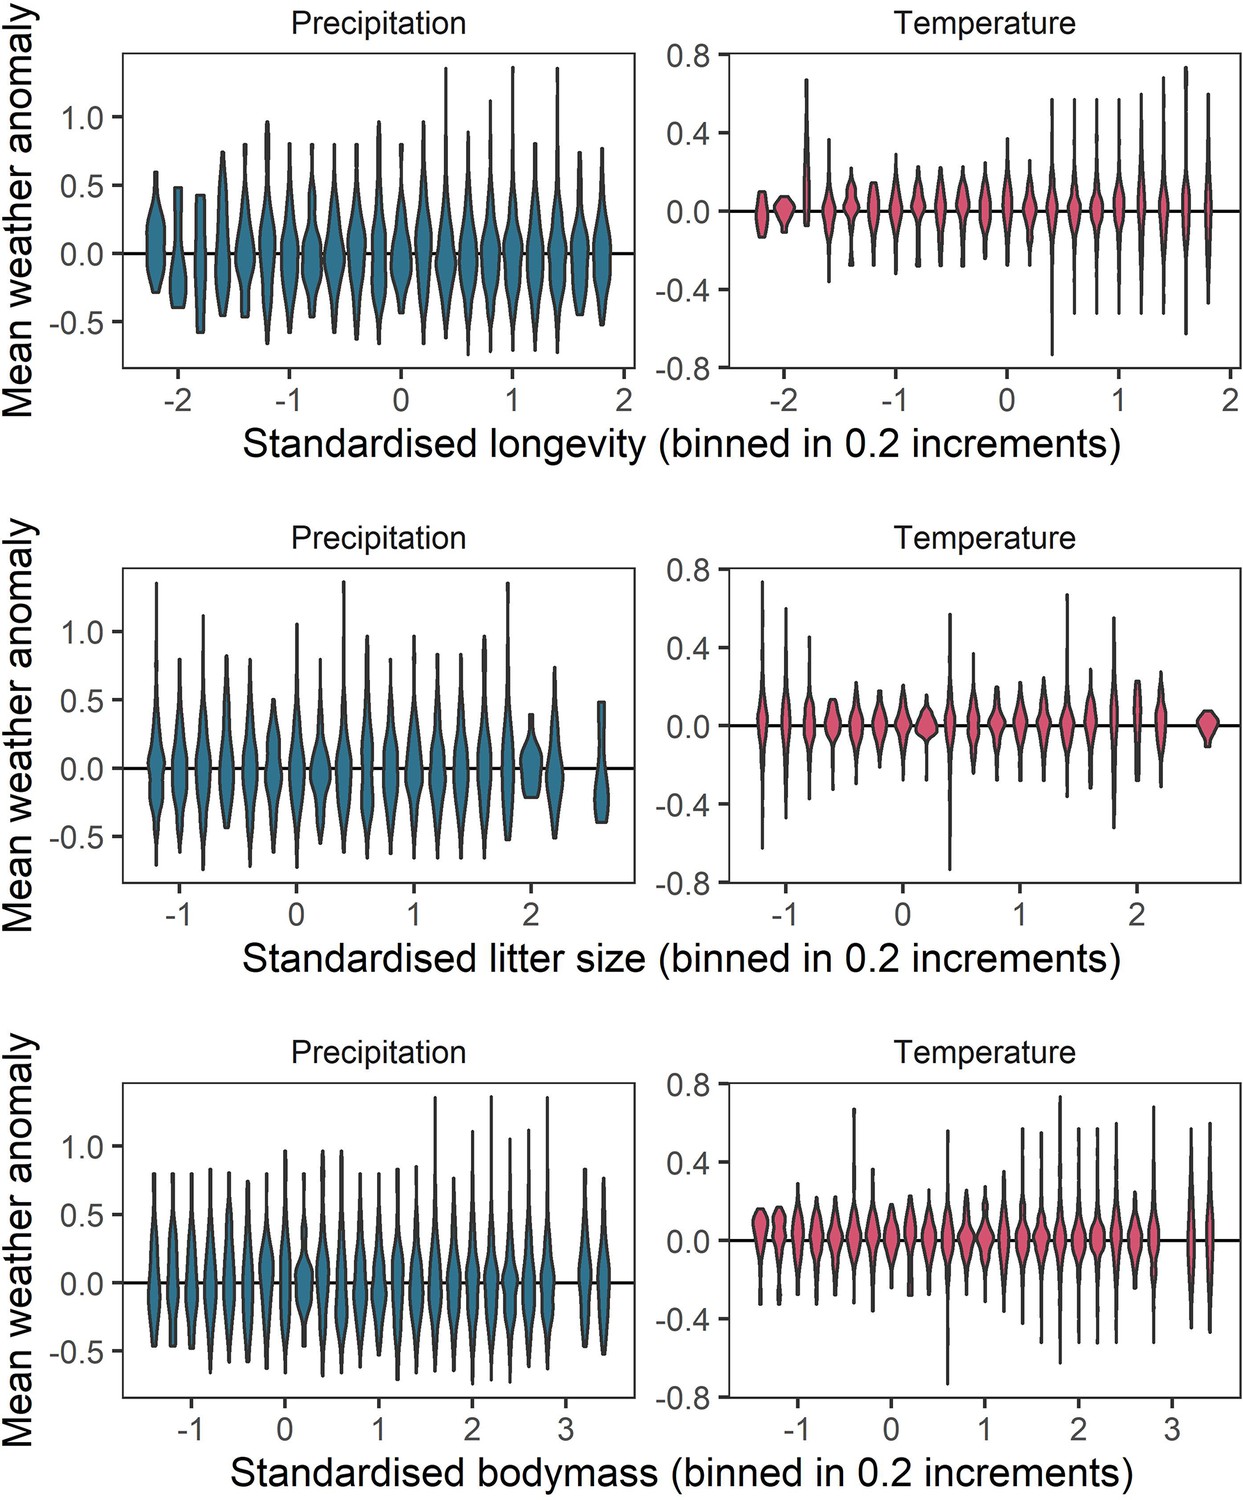
Representation of the raw weather anomaly data across the observed ranges of life-history variables.
To verify whether a full range of weather anomalies was represented across the range of life-history variables observed, we examined the distributions of weather anomaly values observed for life-history variable bins of 0.2. These panels give violin distributions of weather anomalies for 0.2 increments of each of the three life-history variables (top-bottom) for temperature (right) and precipitation (left). These panels indicate a good spread of weather anomaly values observed across the life-history trait space.
Appendix 1—figure 3
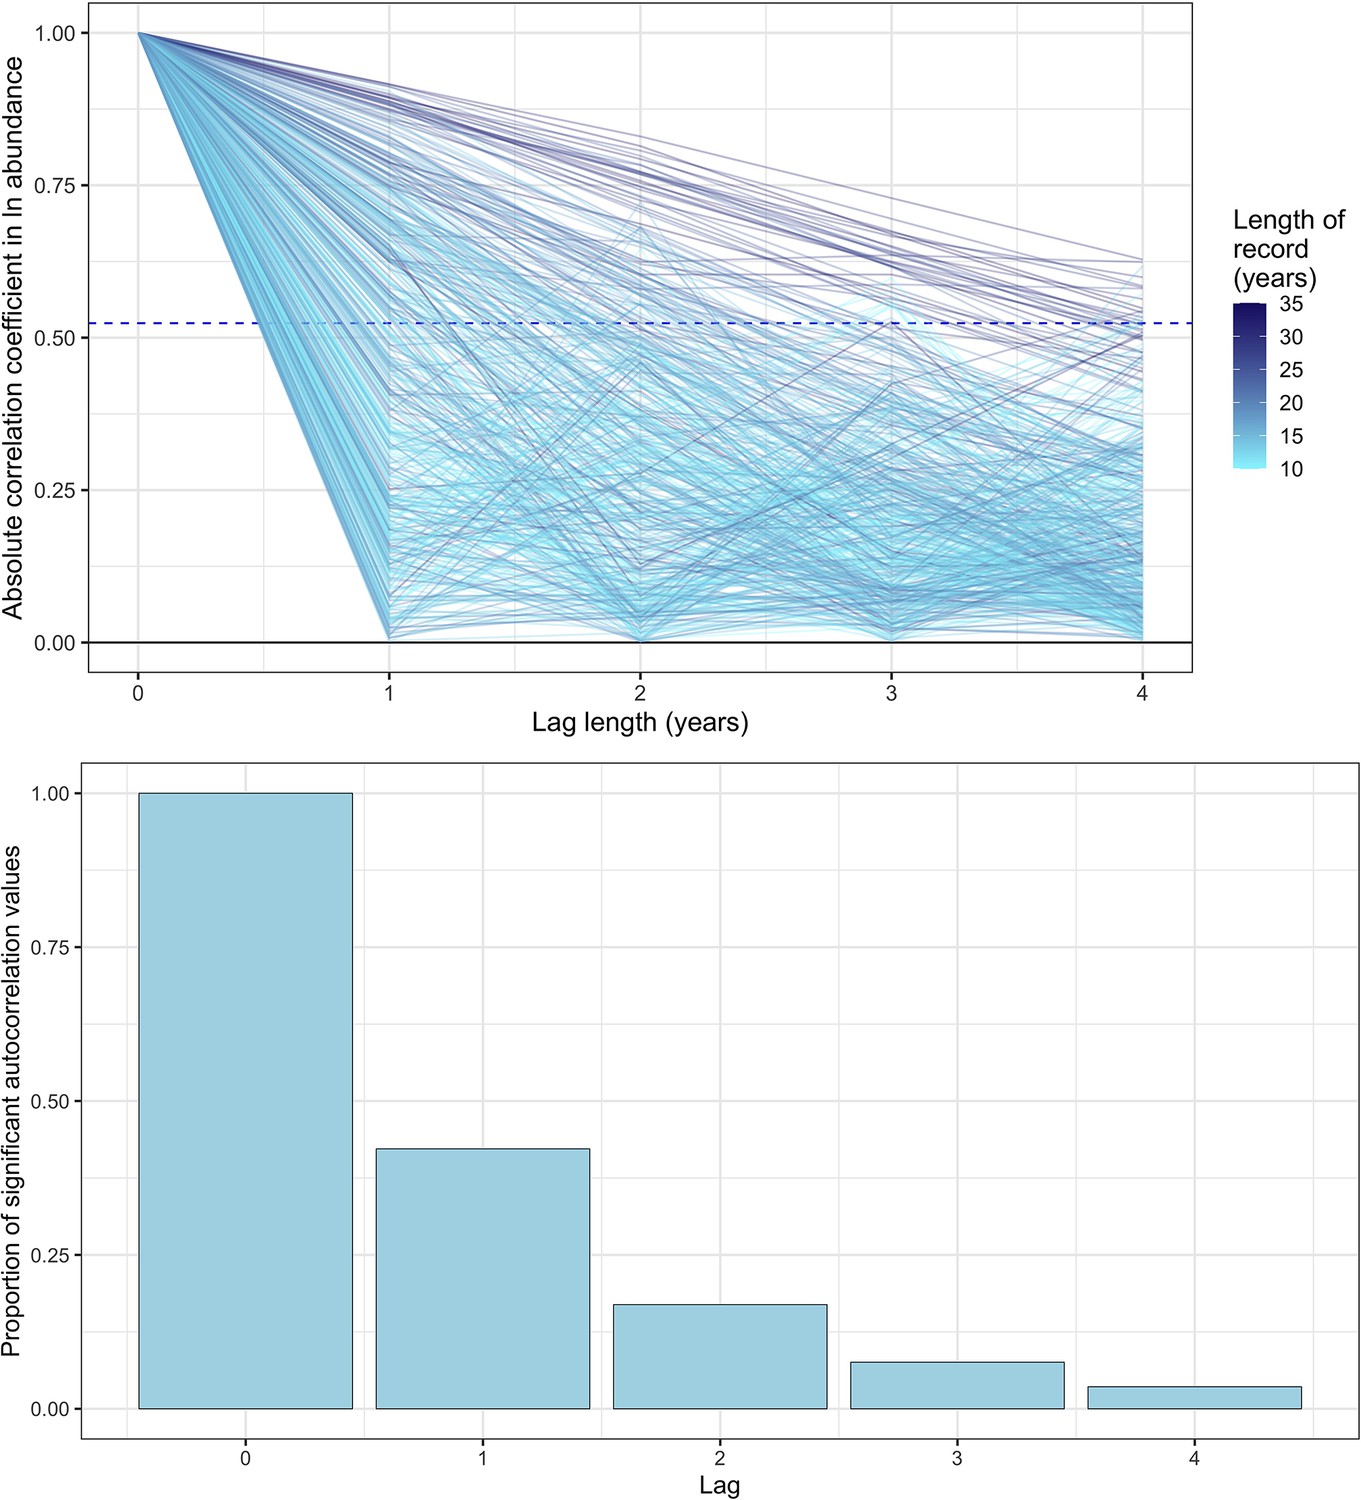
Exploring temporal autocorrelation using autoregressive timeseries models of abundance with varying lag.
Top- the absolute autocorrelation coefficient for each lag length (in years) for each timeseries abundance record. Each line is a record from the mammal dataset used in the study, with lagged autocorrelation values up to a maximum lag of four years. The colour of the line indicates the total length of the record in years. The dashed line is the significance confidence level for the median timeseries length in the dataset (14 years). Bottom- the proportion of significant autocorrelation values across all records for each lag length (in years). Together, these figures show that there is good evidence for lag 1 autocorrelation (AR(1)) across all records, with a substantial proportion (>30%) of records displaying significant autocorrelation for AR(1). However, with greater lags, the degree of temporal autocorrelation decreases substantially, most probably due to the lack of sufficient annual observations to resolve autocorrelation with a greater lag.
Appendix 1—figure 4
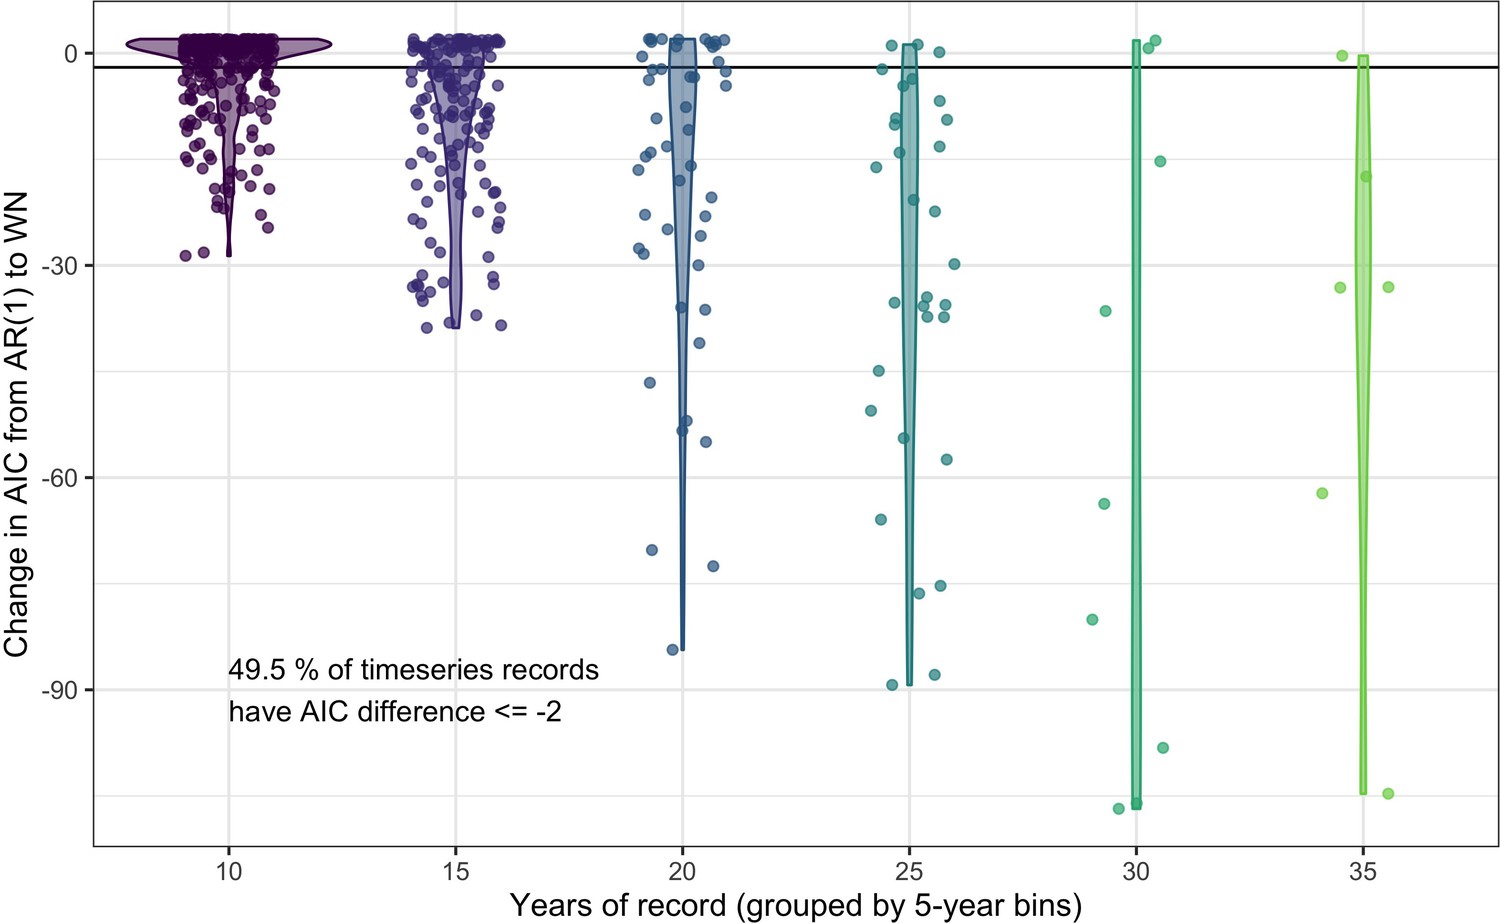
Comparing the predictive performance of AR(1) time series models to white noise models for abundance records.
The change in AIC for timeseries models including an AR(1) temporal autocorrelation structure relative to the base model of white noise (WN). Each point gives the AIC difference for a single record, with the data grouped by the number of years (bins of five years) in the abundance record. Violins give the distribution of AIC differences for each record length bin. 49.5% of studies have an AIC difference <= –2 when comparing an AR(1) model to a white noise model, indicating support for including lag-1 temporal autocorrelation in models of abundance.
Appendix 1—figure 5
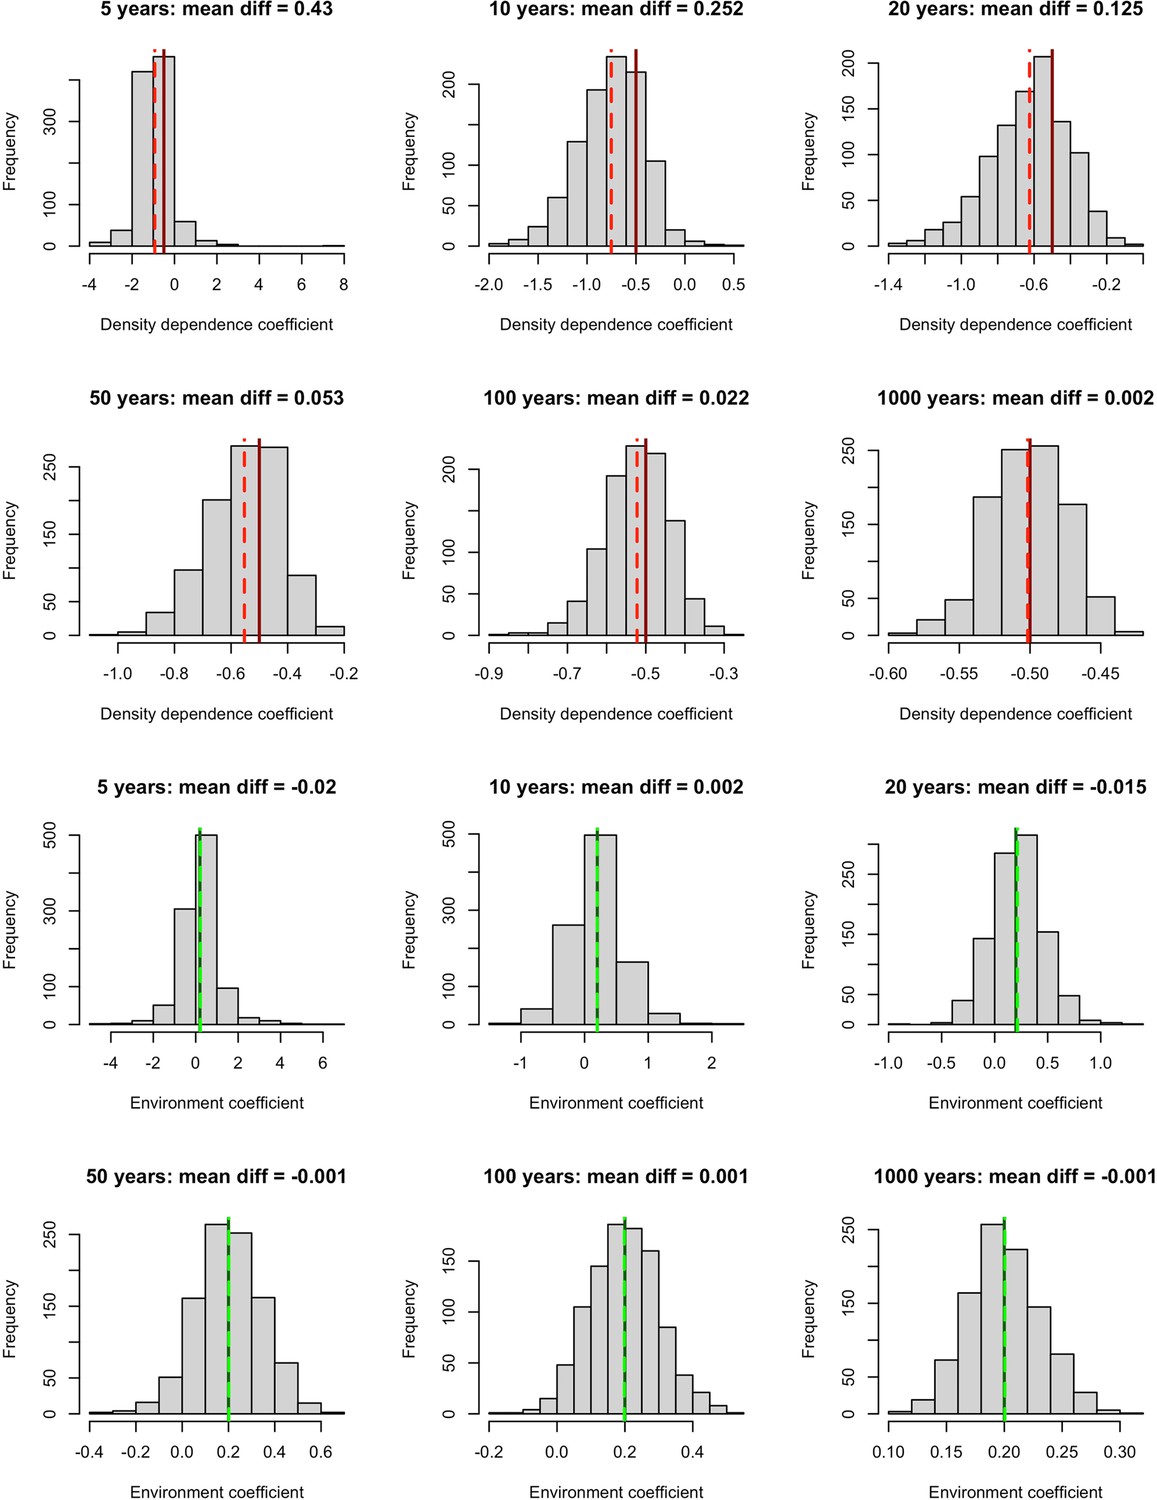
Simulation results exploring the impact of incorporating density dependence on the estimation of environmental effects using linear models.
We built a time-series model simulation in which there was both lag-1 density dependence (coefficient = –0.5, solid red lines) and an environmental effect (coefficient = 0.2, solid green lines) and then retrofit linear models over 1,000 simulations to explore whether we could estimate density dependence and environmental effects accurately for different time-series lengths. Top 6 panels (red lines) – the distribution of density dependence effects from retrofit linear models (mean = dashed red lines) over 1,000 simulations for increasing timeseries lengths. Here, we did not accurately estimate density dependence effects for short timeseries. Bottom 6 panels (green lines) – the distribution of environmental effects from retrofit linear models (mean = dashed green lines) over 1,000 simulations for increasing timeseries lengths. Here, we accurately estimated environmental effects even for short time series. This suggests that accounting for temporal autocorrelation in abundance, we are able to retrieve accurate environmental effects (here weather effects).
Appendix 1—figure 6
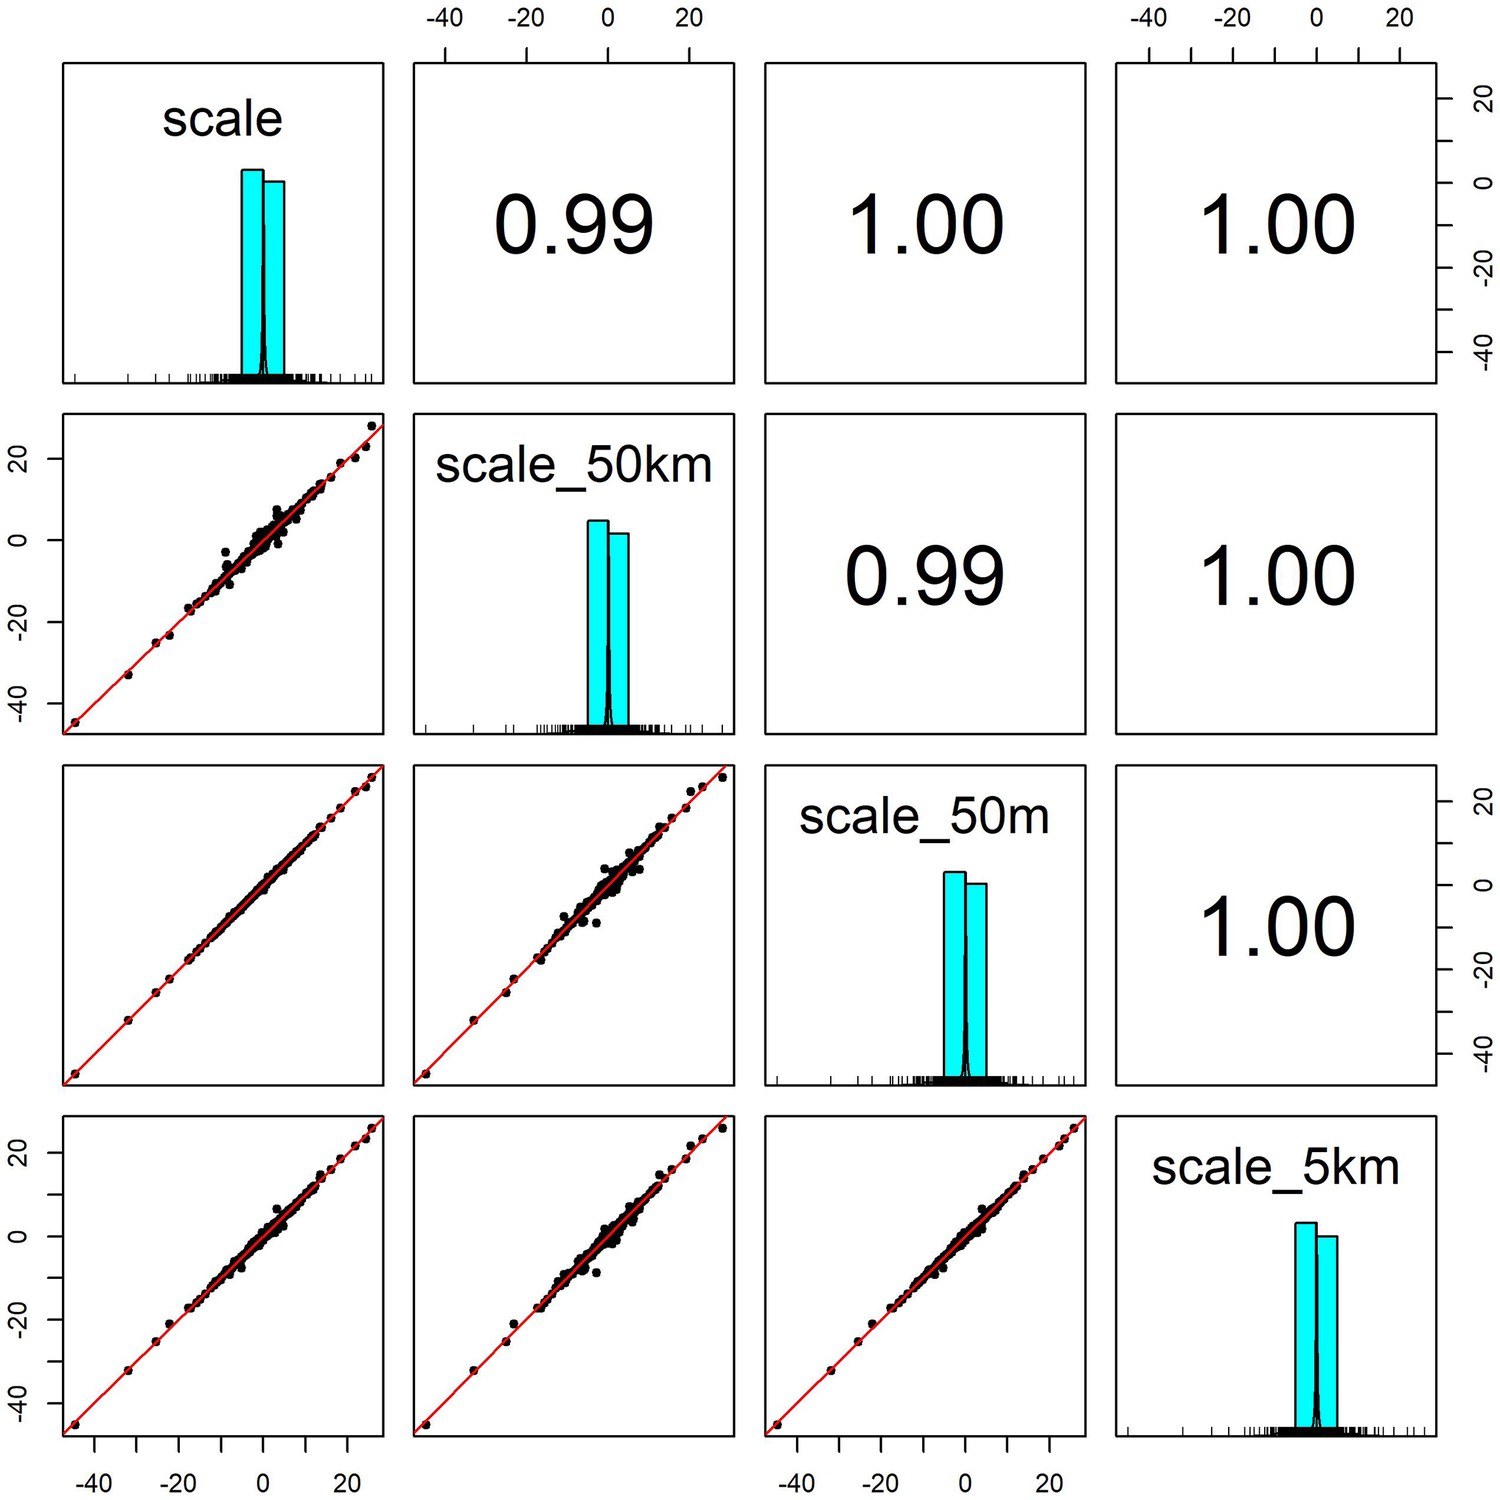
Pairwise correlation coefficients for weather coefficients (temperature and precipitation) estimated over four buffered radii scales.
We estimated the effect of weather anomalies on population growth rate using additive models (GAMs) over four spatial scales for a buffered radius around each record’s location- exact raster cell location (scale), 50m buffer (scale_50m), 5km buffer (scale_5km) and 50 km buffer (scale_40 km). Weather coefficients were near identical across spatial scales. The buffer radius of 5 km was used in subsequent analyses.
Appendix 1—figure 7
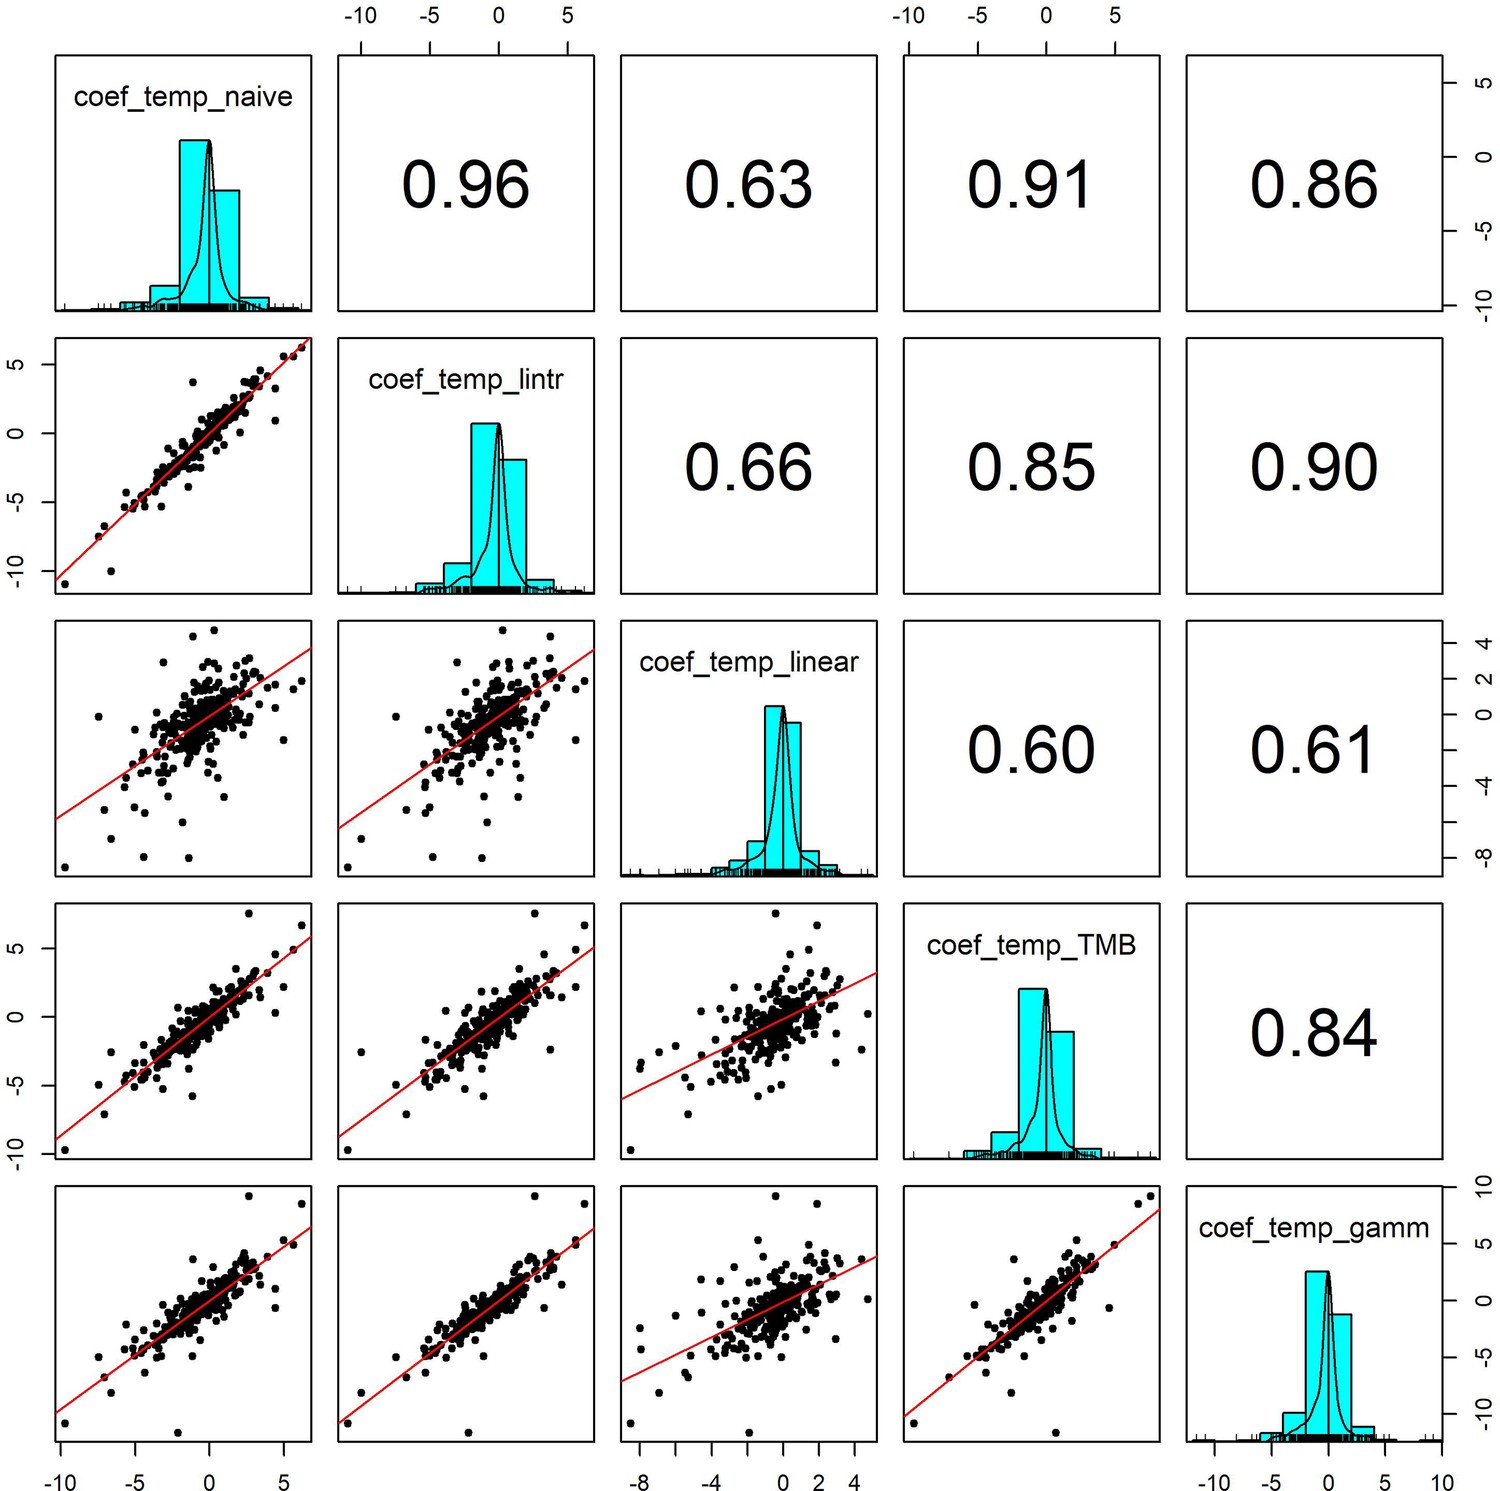
Pairwise correlation coefficients for temperature effects estimated using 5 competing generalised linear models.
To validate our approach of using additive models to estimate weather effects, we compared the weather coefficients obtained from 5 models of differing complexity that accounted for (or excluded) temporal autocorrelation and temporal trends in population growth rates: (1) coef_temp_naive - simple linear regression excluding temporal trends or autocorrelation (R syntax population_growth_rate ~weather_anomaly), (2) coef_temp_lintr – linear regression including a linear temporal trend in population growth rate but excluding autocorrelation (R syntax population_growth_rate ~weather_anomaly +year), (3) coef_temp_linear – Linear regression including linear trend and an autoregressive term (R syntax population_growth_rate ~weather_anomaly +year + abundance), (4) coef_temp_TMB - A glmmTMB model including an AR(1) autoregressive term for the observation year, (5) coef_temp_gamm – an additive model including a coarse smoothing spline for the temporal trend and an autoregressive term for year (see equation 2). Additive model coefficients were highly correlated with other estimates of weather effects (in support of Appendix 1—figure 5).
Appendix 1—figure 8
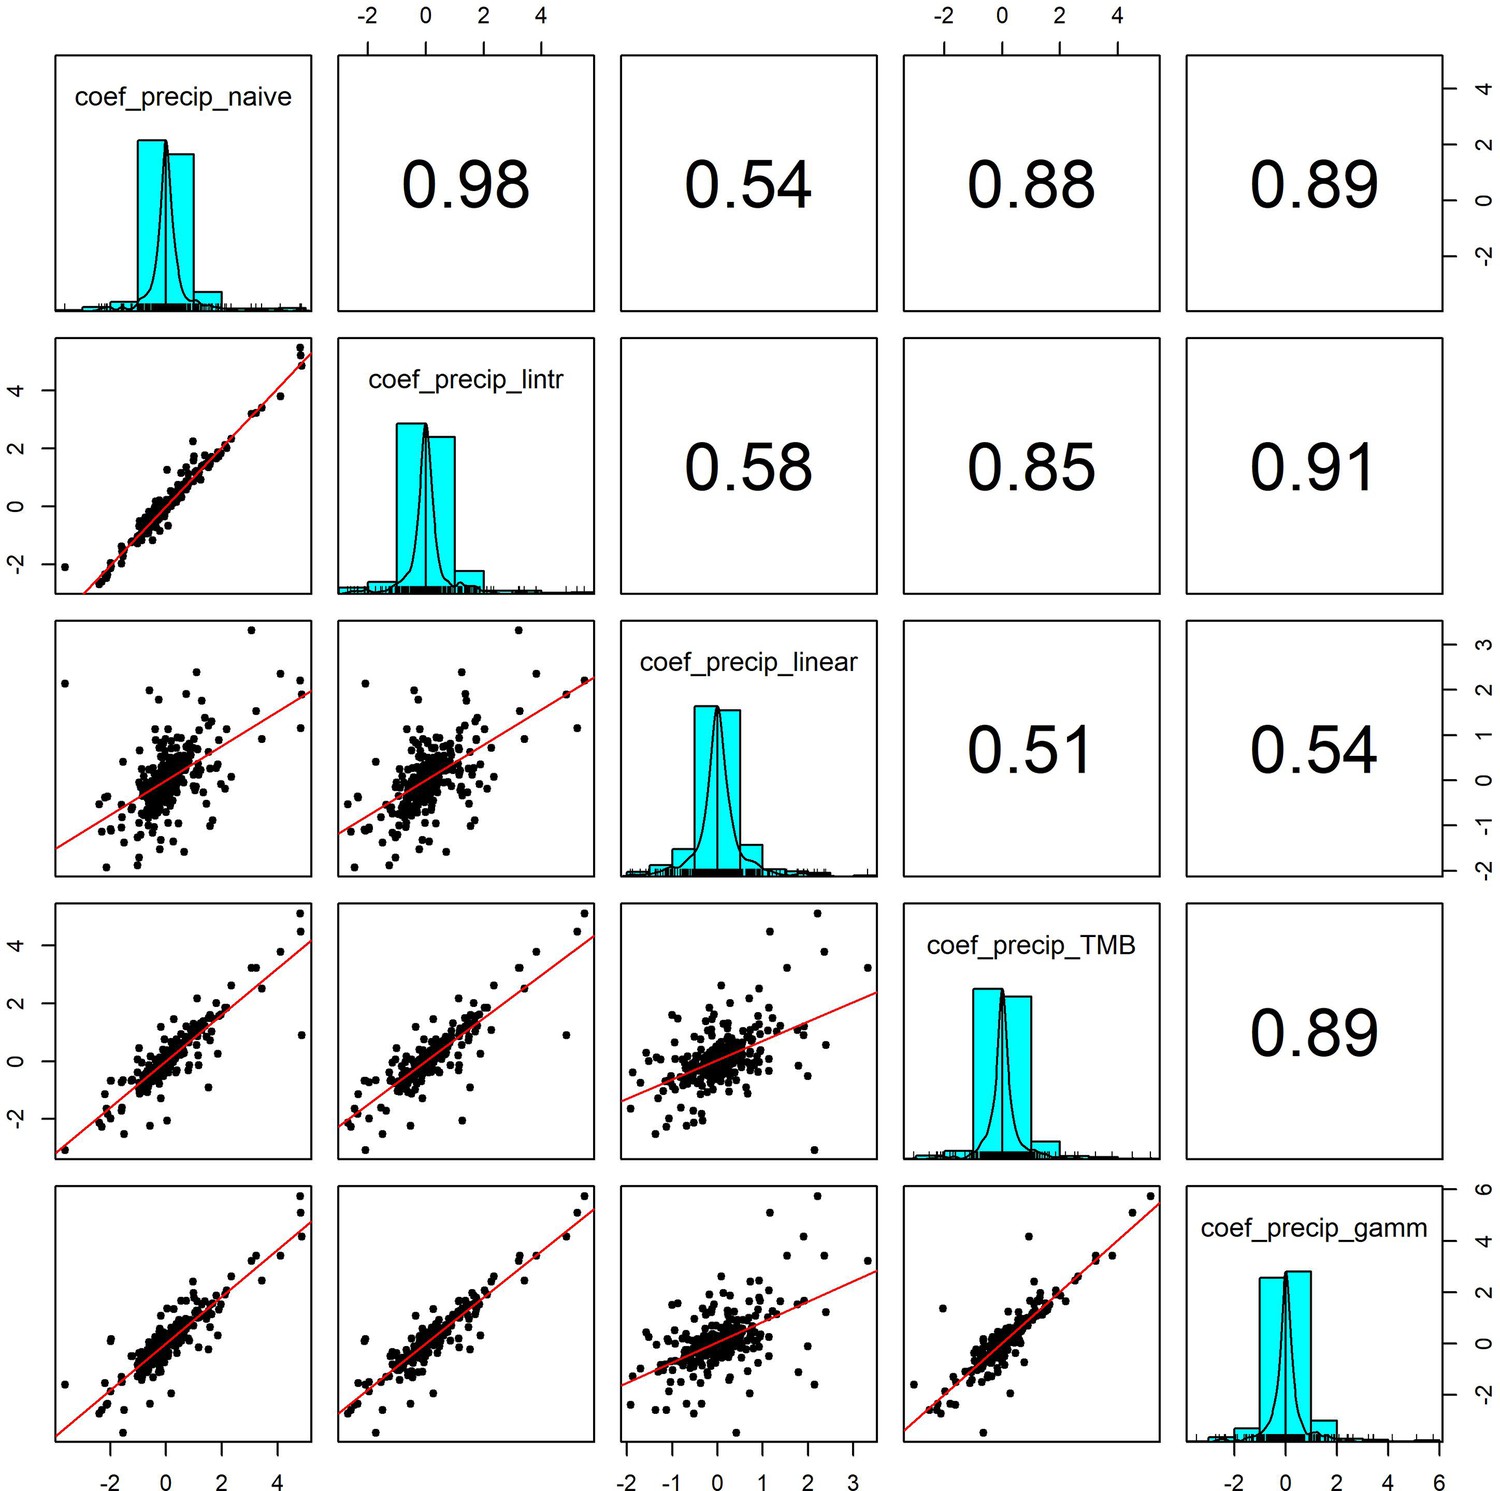
Pairwise correlation coefficients for precipitation effects estimated using 5 competing generalised linear models.
To validate our approach of using additive models to estimate weather effects, we compared the weather coefficients obtained from 5 models of differing complexity that accounted for (or excluded) temporal autocorrelation and temporal trends in population growth rates (identical to Appendix 1—figure 7 but using precipitation). Additive model coefficients for precipitation were highly correlated with other estimates of weather effects (in support of Appendix 1—figure 5).
Appendix 1—figure 9

Weather coefficients generated from linear regressions were positively correlated to those from additive models.
Comparison of weather coefficients generated from linear models including a linear trend term and an autoregressive term to additive models (equation 2). Highly significant positive correlation between linear and additive coefficients. This result is in support of the findings of the simulation presented in Appendix 1—figure 5, which suggests that despite the method of accounting for density dependence (temporal autocorrelation), estimating annual environmental effects remains robust.
Appendix 1—figure 10
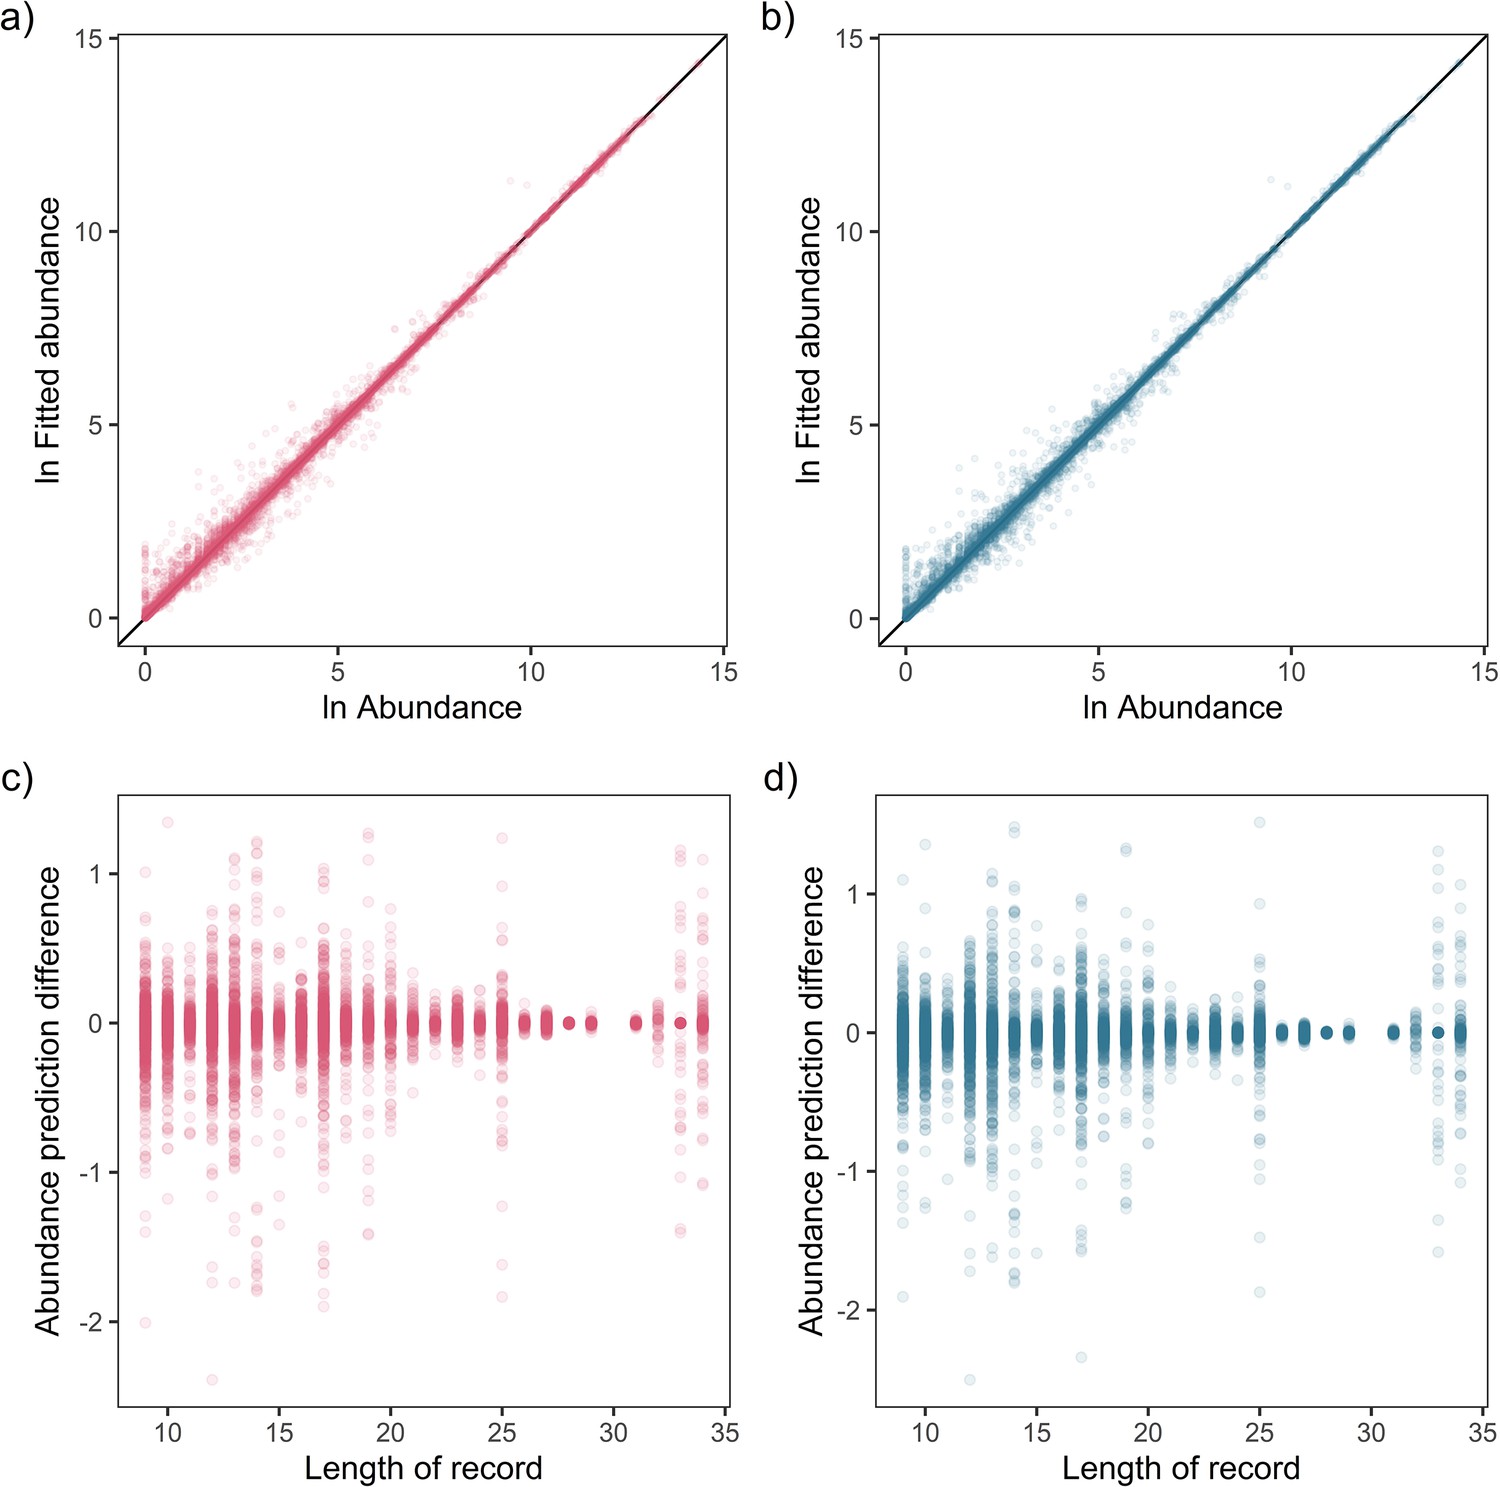
Fit-to-sample estimates for state-space models on mammal abundance time-series.
Top – Fitted vs. observed annual ln abundance values for temperature (a) and precipitation (b) effects across all observations of 474 (non-NA in precipitation anomaly) records, with solid black line giving the 1-to-1 line. Bottom – The relationship between the difference in observed and fitted ln abundance with respect to the length of the time-series record for temperature (c) and precipitation (d).
Appendix 1—figure 11
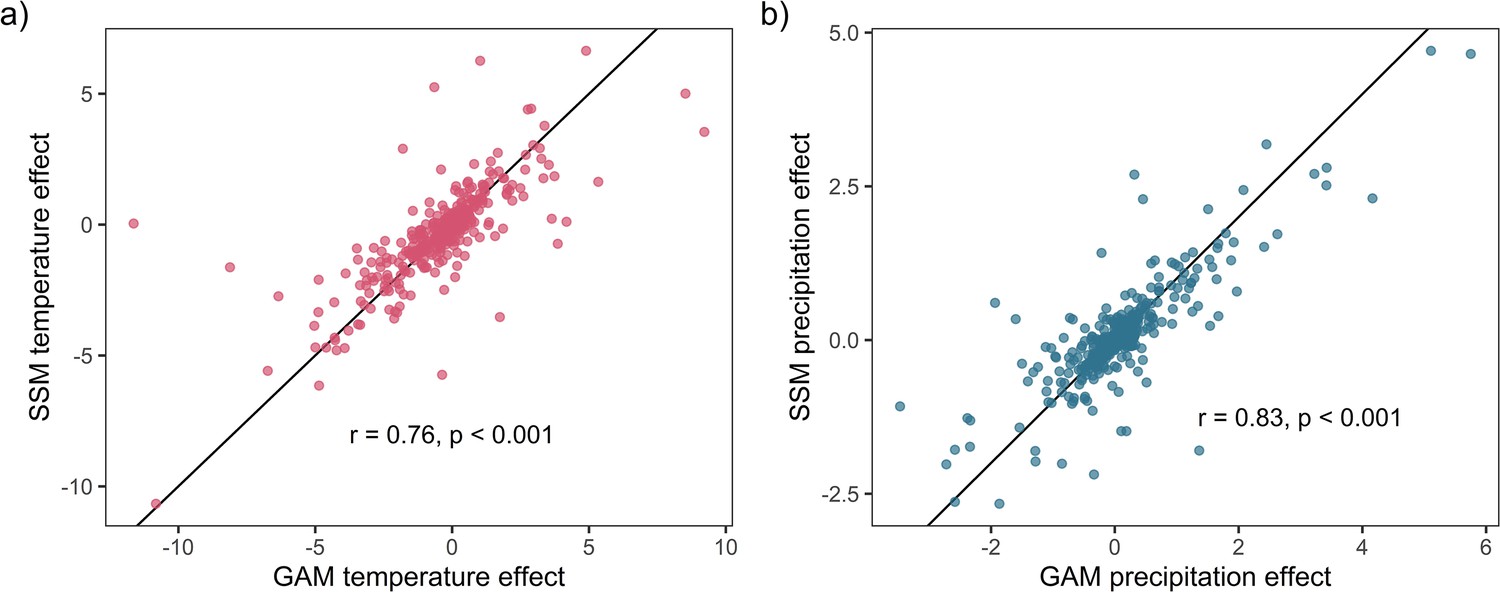
Weather coefficients generated from state-space models (SSMs) were highly correlated to those from GAM models.
Highly significant positive Pearson’s correlation between state-space and additive coefficients for both temperature (a) and precipitation (b). This result supports the validity of the use of GAM models to estimate weather effects in the current study.
Appendix 1—figure 12
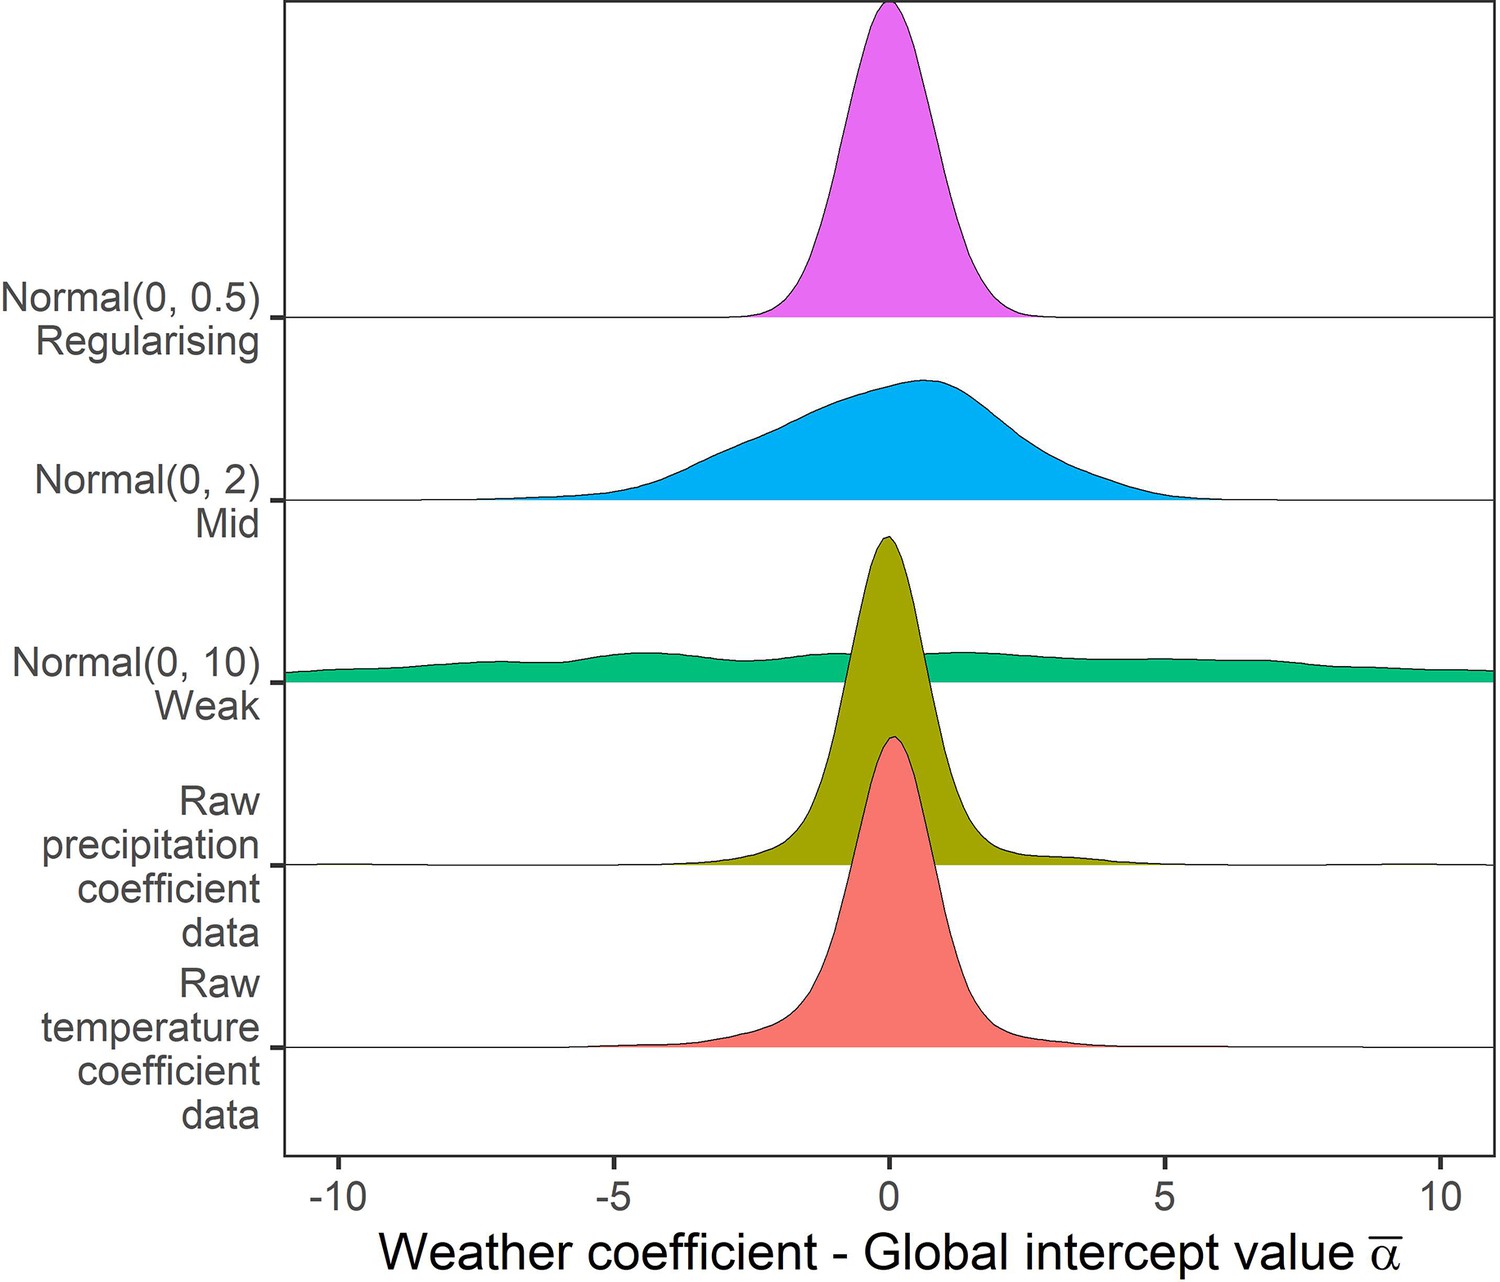
Prior predictive simulation for global intercept terms.
The global intercept i.e. consistent pattern of weather effects across records was modelled using a normal prior. Density distributions for the weather coefficients observed in the raw data, and weather coefficients under 3 normal priors, weak (mean = 0, sd = 10), medium (mean = 0, sd = 2), regularising (mean = 0, sd = 0.5). Here, the regularising prior gives likely global intercepts within the range of the observed coefficients.
Appendix 1—figure 13
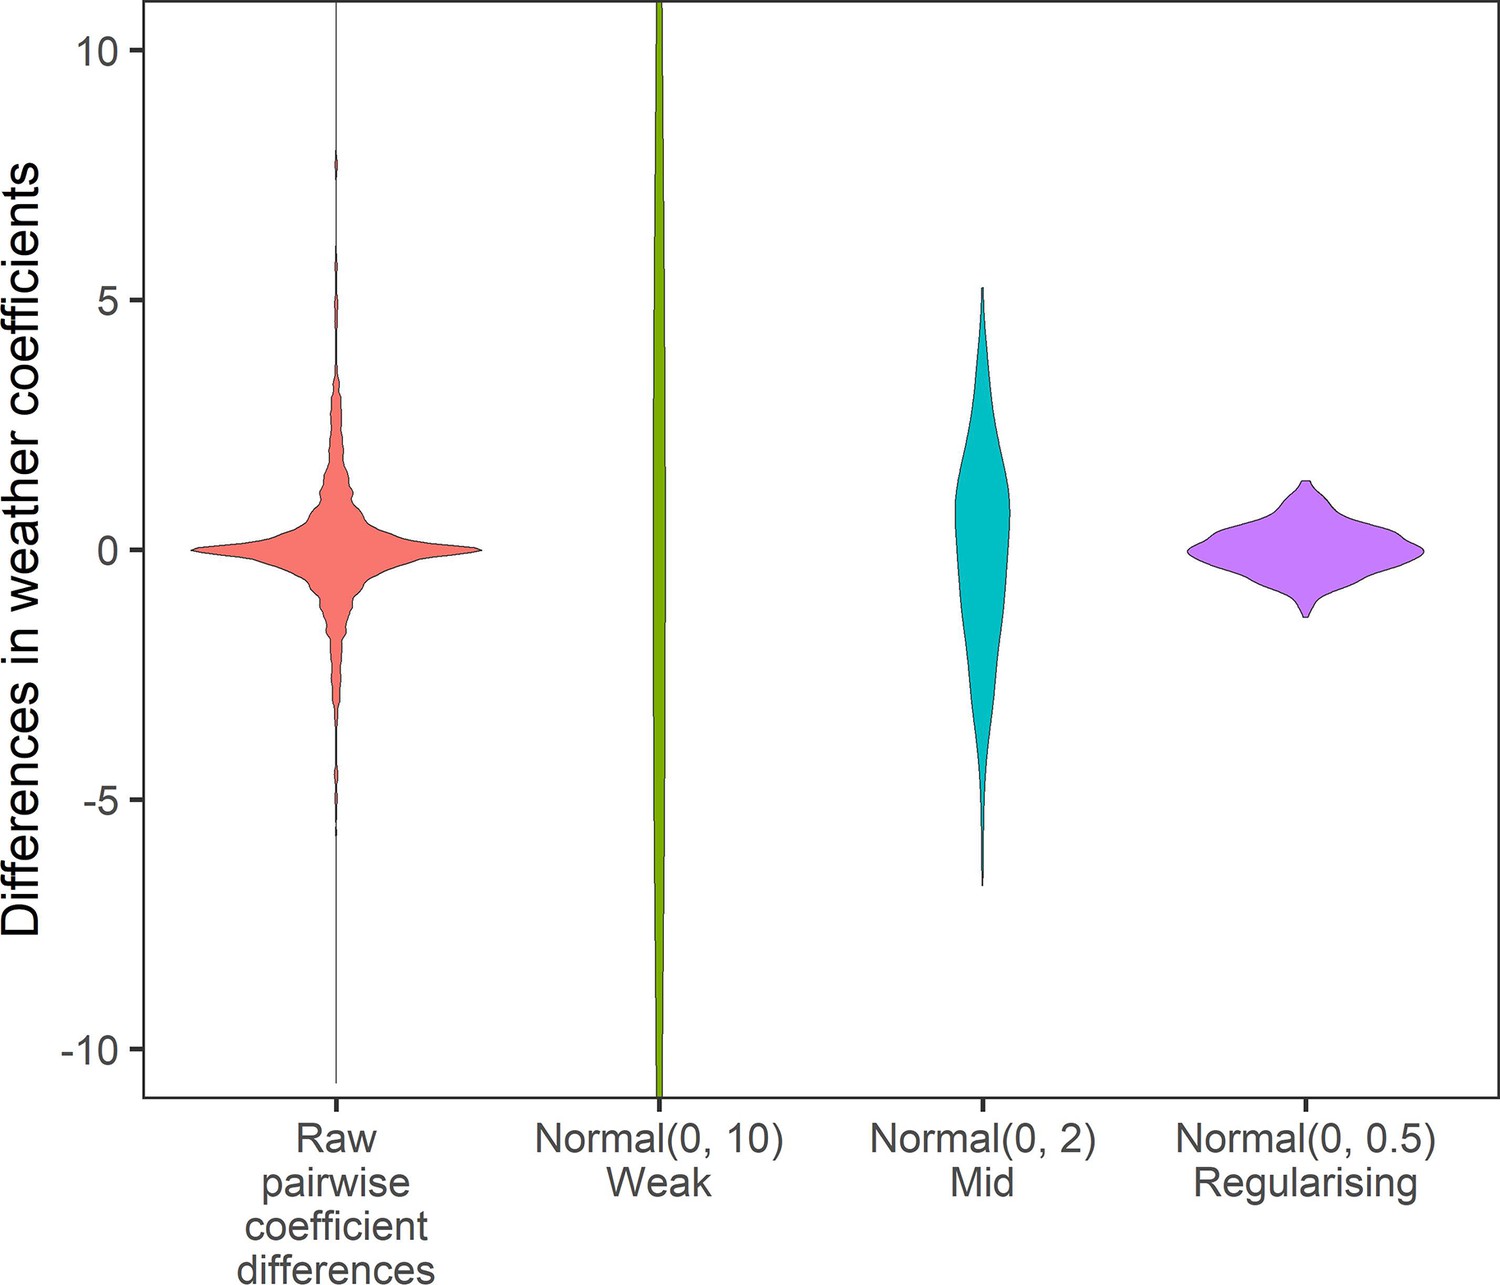
Prior predictive simulation for β terms giving differences in weather coefficients.
Density distributions for all pairwise differences in the weather coefficients observed in the raw data, and differences in weather coefficients under 3 normal priors, weak (mean = 0, sd = 10), medium (mean = 0, sd = 2), regularising (mean = 0, sd = 0.5). The regularising prior gives difference values within the range of the observed coefficient differences.
Appendix 1—figure 14
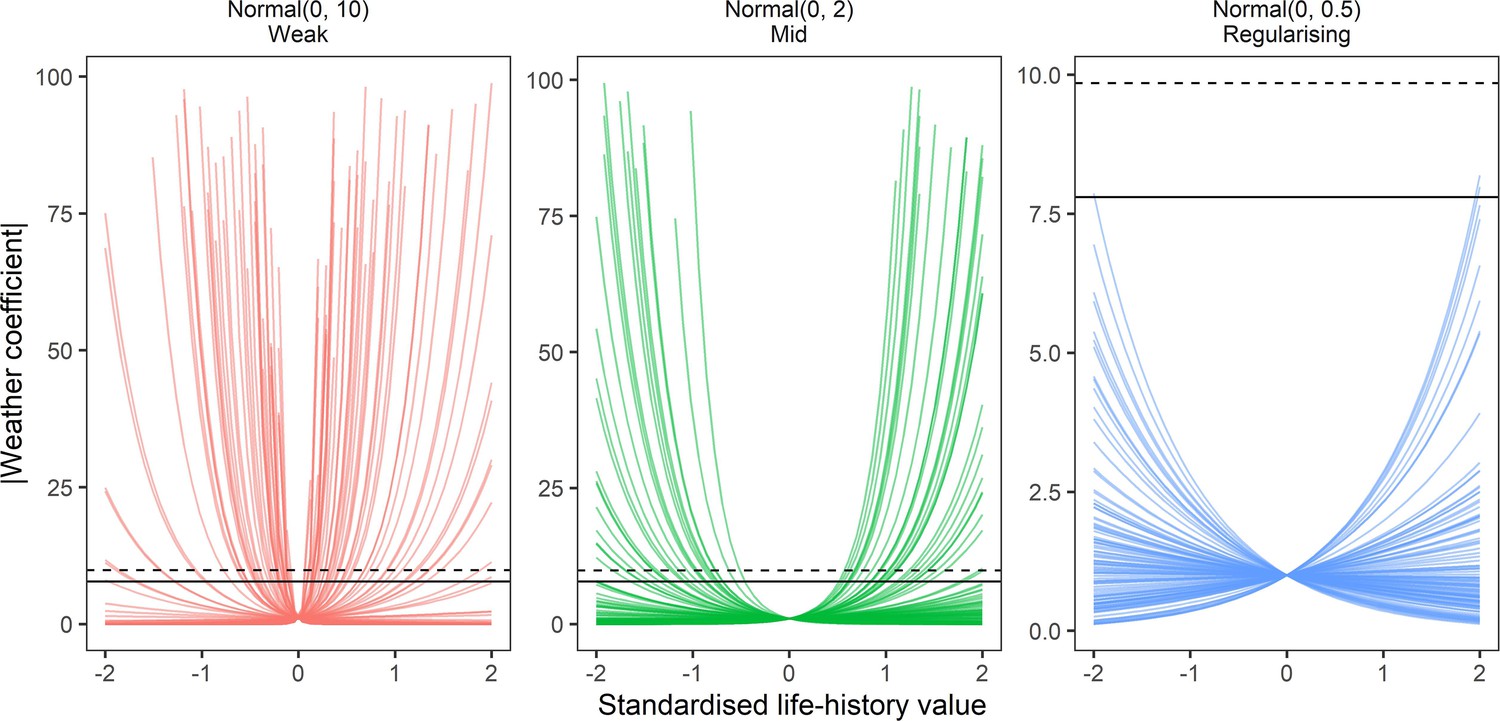
Prior predictive simulation for β terms giving life-history effects on weather coefficients.
Prior predictions of the effect of simulated scaled life-history values (−2–2) on absolute weather coefficients as using log-normal models. Lines are individual simulations under normal prior distributions for the linear life-history effect, which was back-transformed using the exponential to give absolute weather coefficients. Panels give the prior simulations of life-history on weather coefficients under 3 normal priors, weak (mean = 0, sd = 10), medium (mean = 0, sd = 2), regularising (mean = 0, sd = 0.5). solid and dashed horizontal lines give the maximum observed absolute coefficients for temperature and precipitation, respectively. The regularising prior gives plausible predictions that do not regularly exceed the maximum and minimum effects observed.
Appendix 1—figure 15
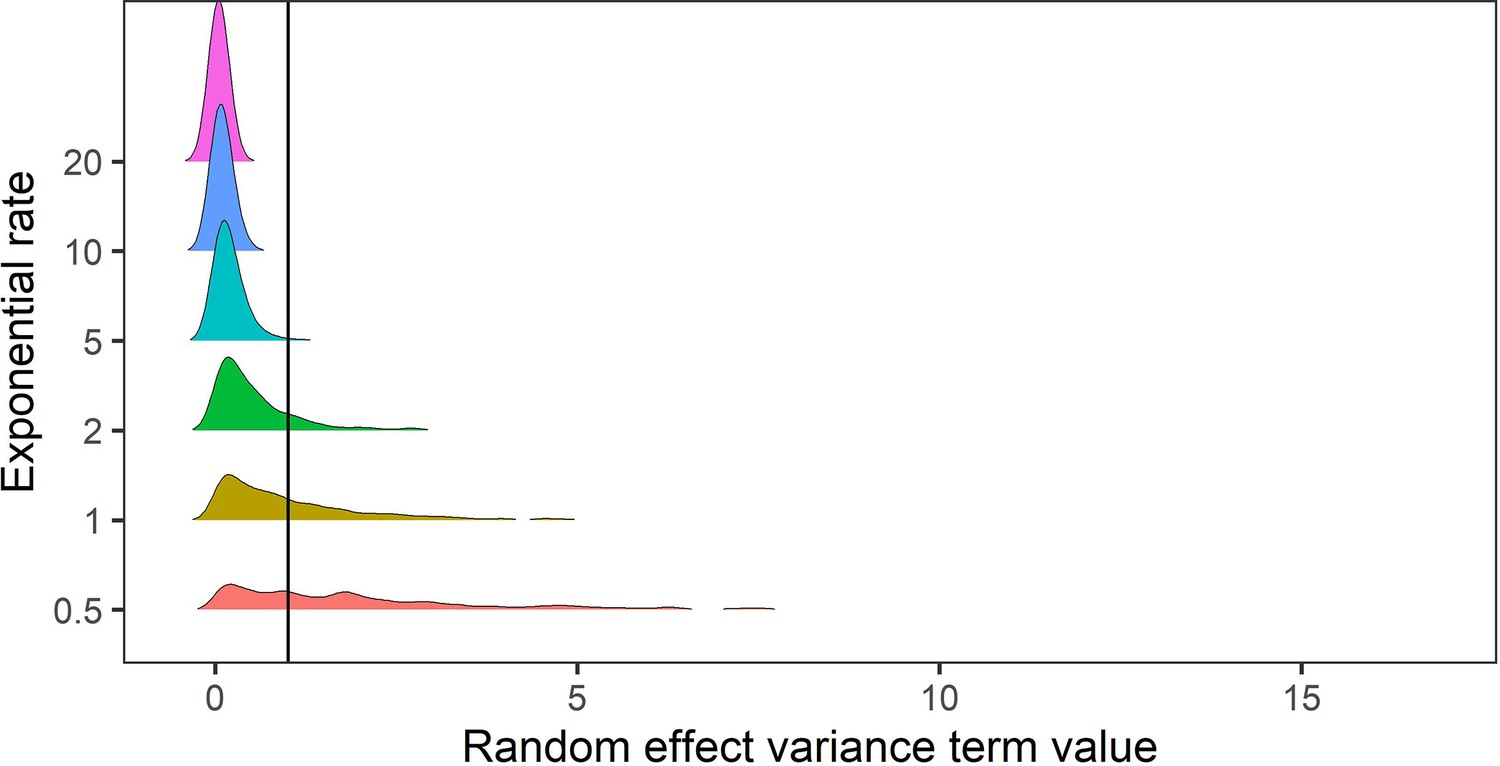
Prior predictive simulation for standard deviation terms relating to random effects of variance.
The random effects of species-level variance and phylogenetic covariance were modelled using exponential priors, which are suitable for variance terms because they are non-zero distributions that can flexibly capture higher variances. Here, we explored the density distributions of exponential priors with 6 exponential rate parameters (0.5–20). In this case, for phylogenetic and species level variance we do not expect values exceeding a variance term of 1 (solid black line). Regularising priors with rate parameters >= 5 gave conservative estimates of random effect variances within the constraints of the variance terms in the meta-regression models.
Appendix 1—figure 16
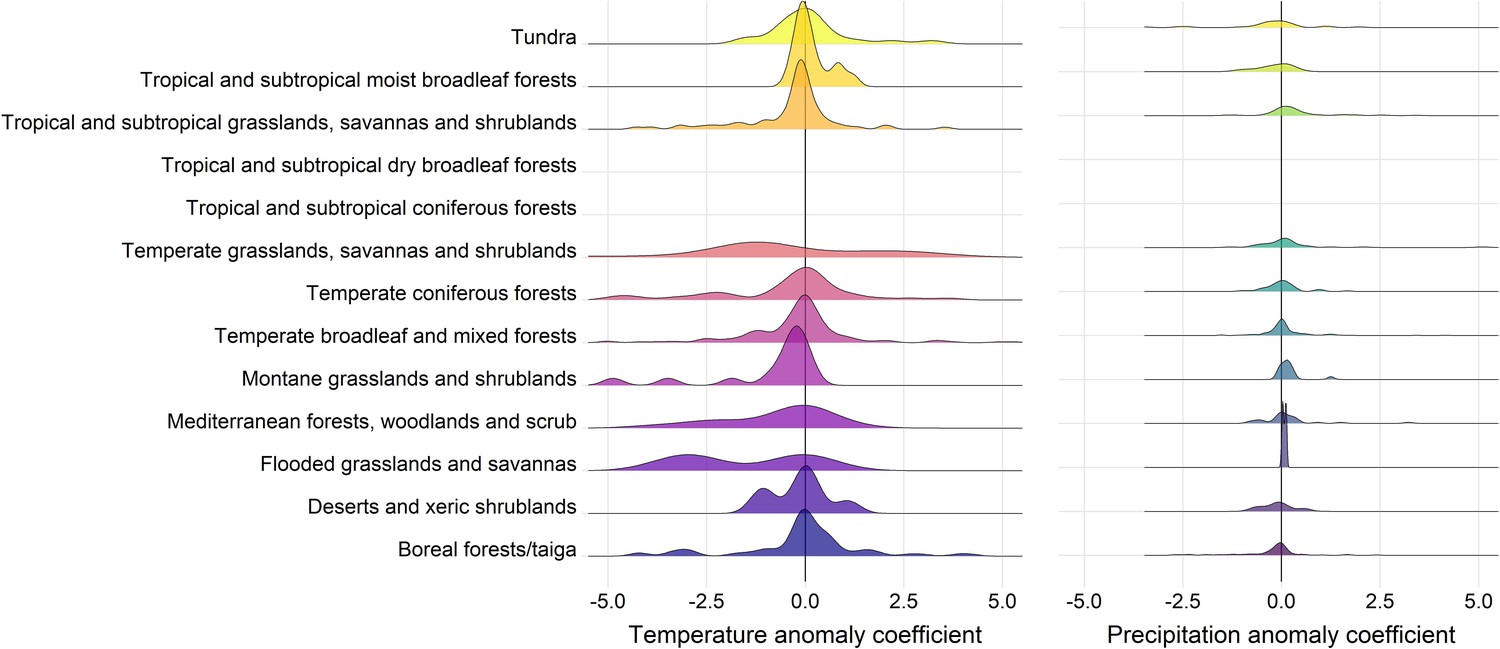
Density distributions of temperature (left) and precipitation (right) coefficients on abundance change with respect to biome of the record location in the terrestrial mammals.
Only coefficients between –0.5-0.5 are displayed for visual purposes.
Appendix 1—figure 17
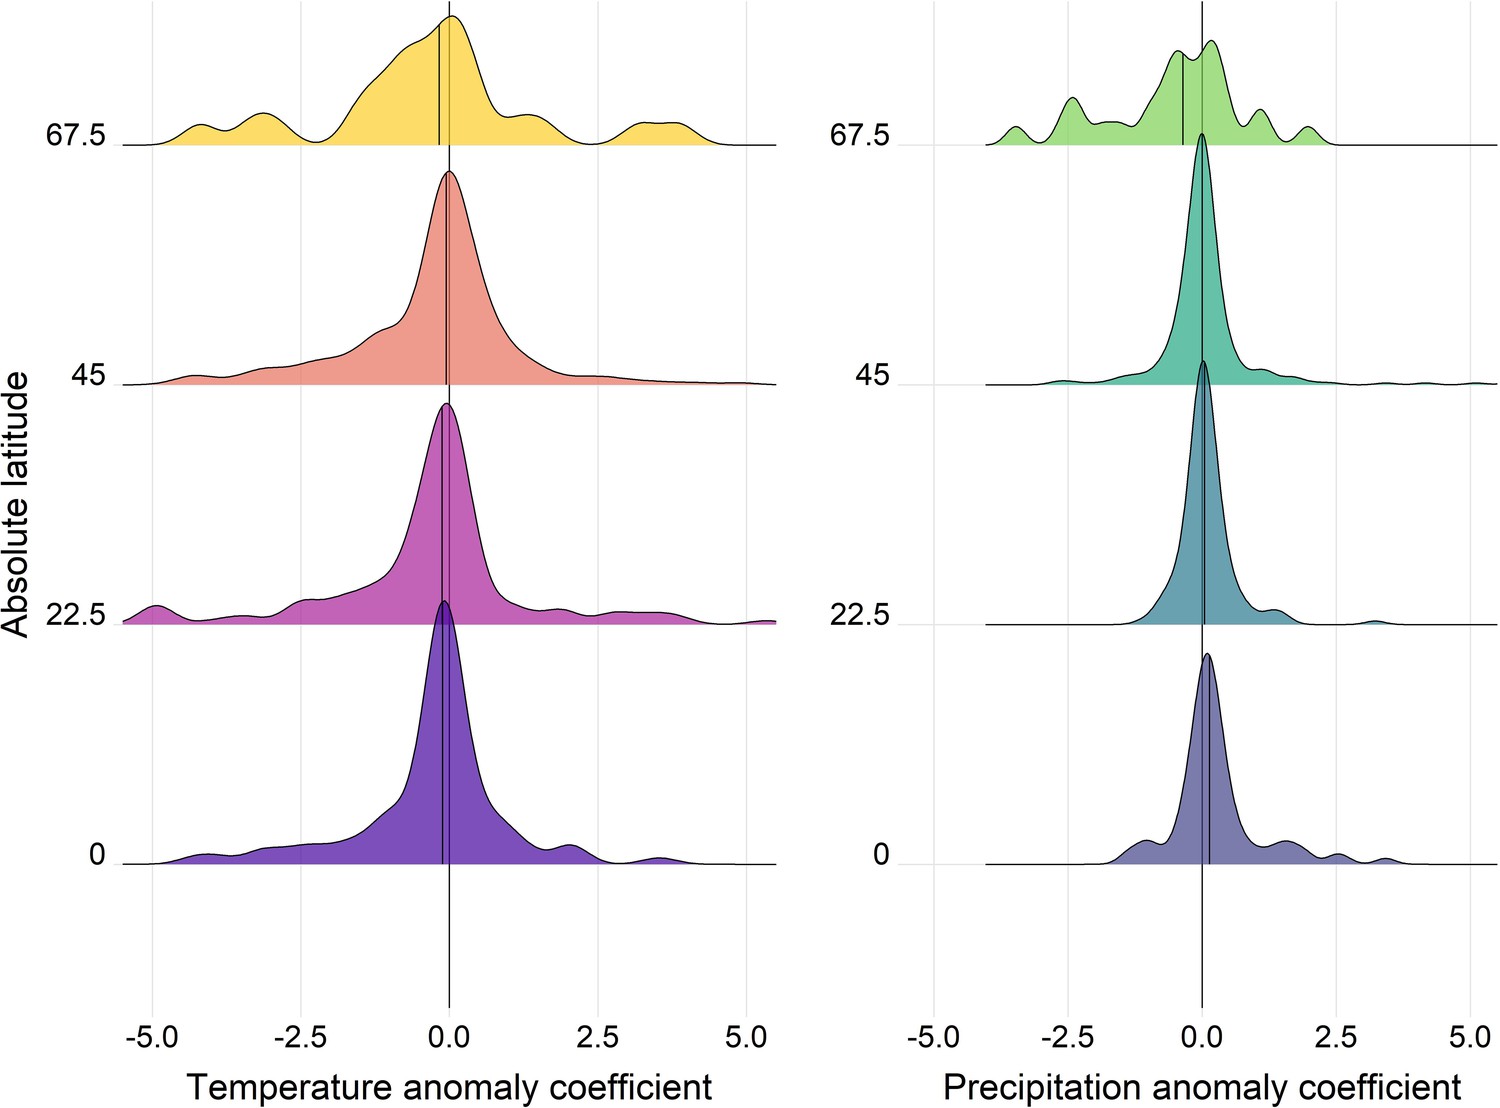
Density distributions of temperature (left) and precipitation (right) coefficients on abundance change with respect to the absolute latitude of the record location in the terrestrial mammals.
Records were grouped based on their absolute latitude in categories of 22.5° e.g. 0 category indicates records found at absolute latitudes of 0-22.5°.
Appendix 1—figure 18

Posterior predictions for the influence of the record length on absolute temperature (a) and precipitation (b) effects on abundance changes in the terrestrial mammals.
Points give the absolute weather effect for each record (N = 486). Only absolute weather effects <4 are displayed on the figure. Black lines are posterior means from the best predictive Gamma model including life-history effects.
Appendix 1—figure 19
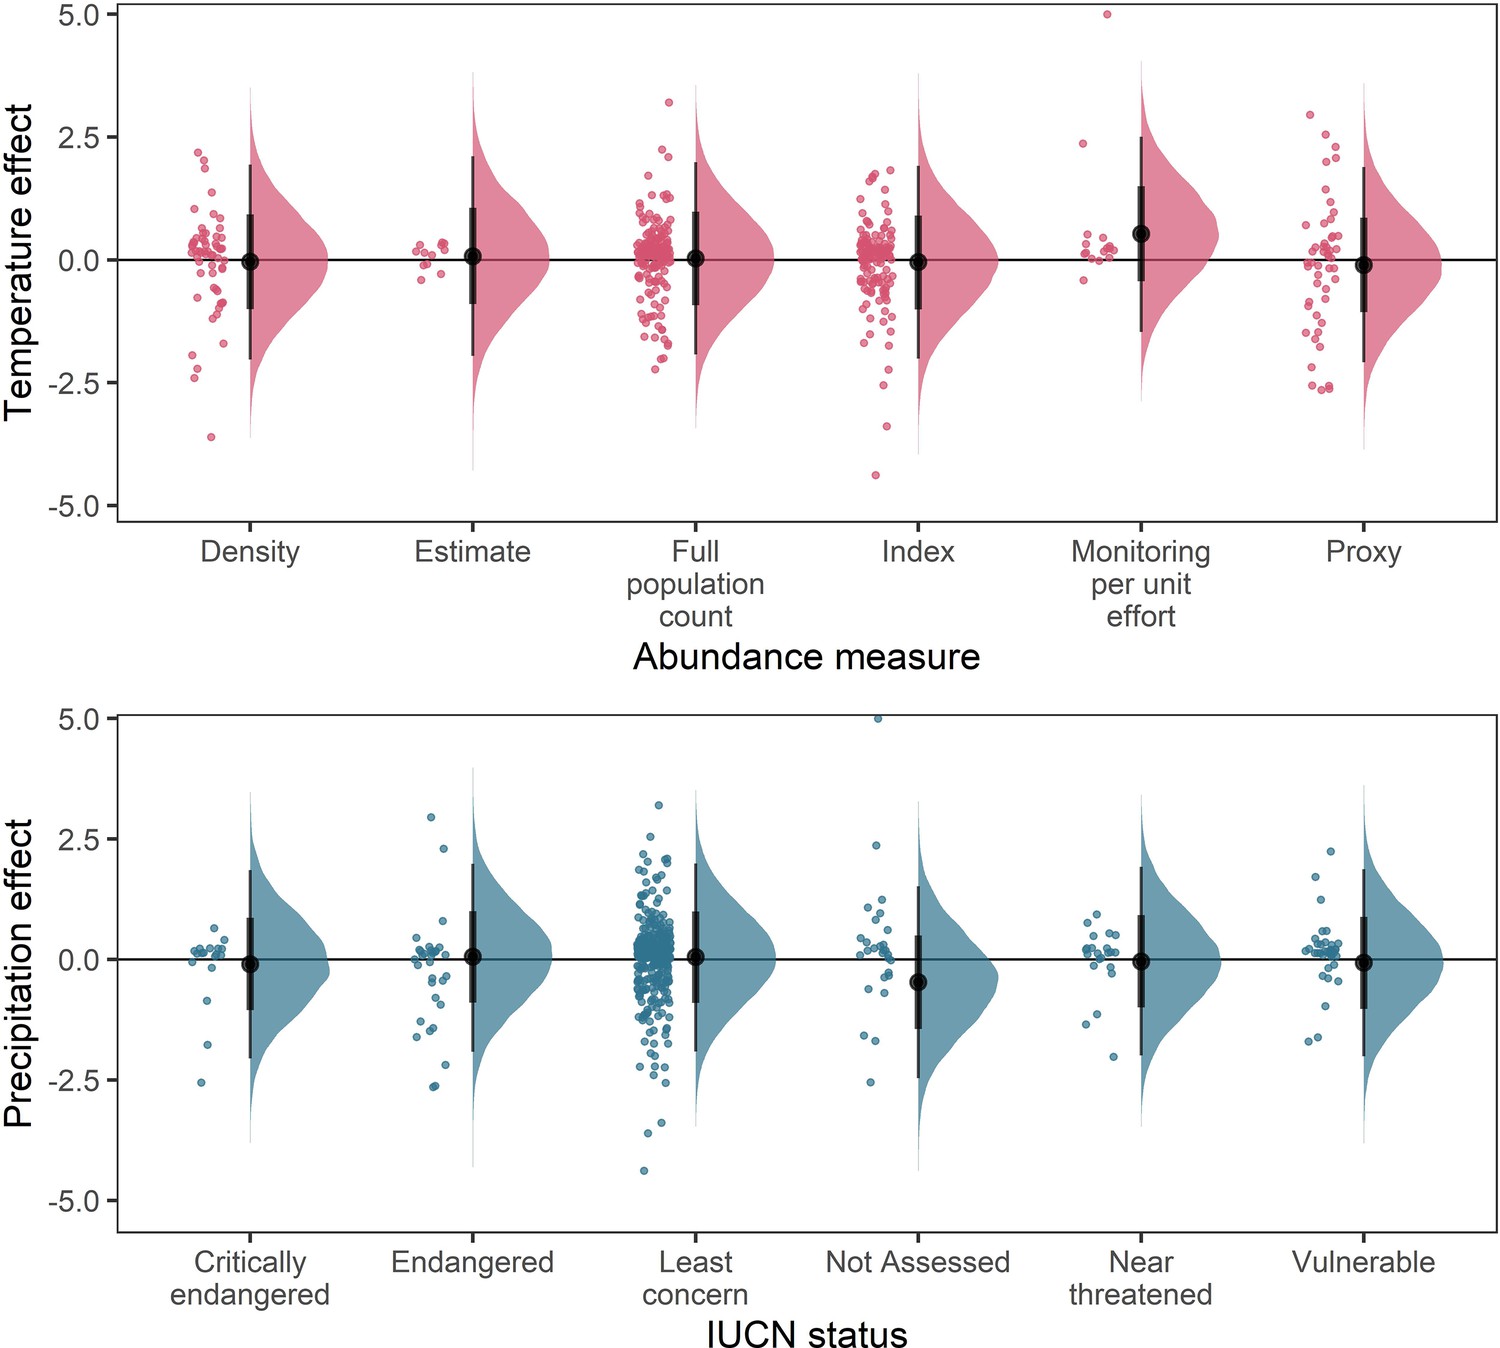
Posterior predictions for a Gaussian meta-regression model of temperature coefficients with the method of estimating abundance (top) and temperature coefficients with IUCN red-list status.
To explore the potential impact of varying data-sources and reliability of the abundance data, we performed a further model selection to explore how the abundance measure type and IUCN red-list status influence temperature and precipitation responses (as in equation 3). For temperature coefficients the model including abundance measure type had a higher predictive performance than the base model (Δelpd = 3.13). For precipitation coefficients the model including IUCN red-list status had a higher predictive performance than the base model (Δelpd = 0.13). However, posterior predictions revealed that these predictive differences were not substantive, with posterior distributions centred on 0 for most abundance measure types (top) and IUCN statuses (bottom). The predictive differences are most likely a result of coefficients observed in the Monitoring per unit effort measure type (top) and the Not Assessed status (bottom), both of which have low sample size in the terrestrial mammals.
Appendix 1—figure 20
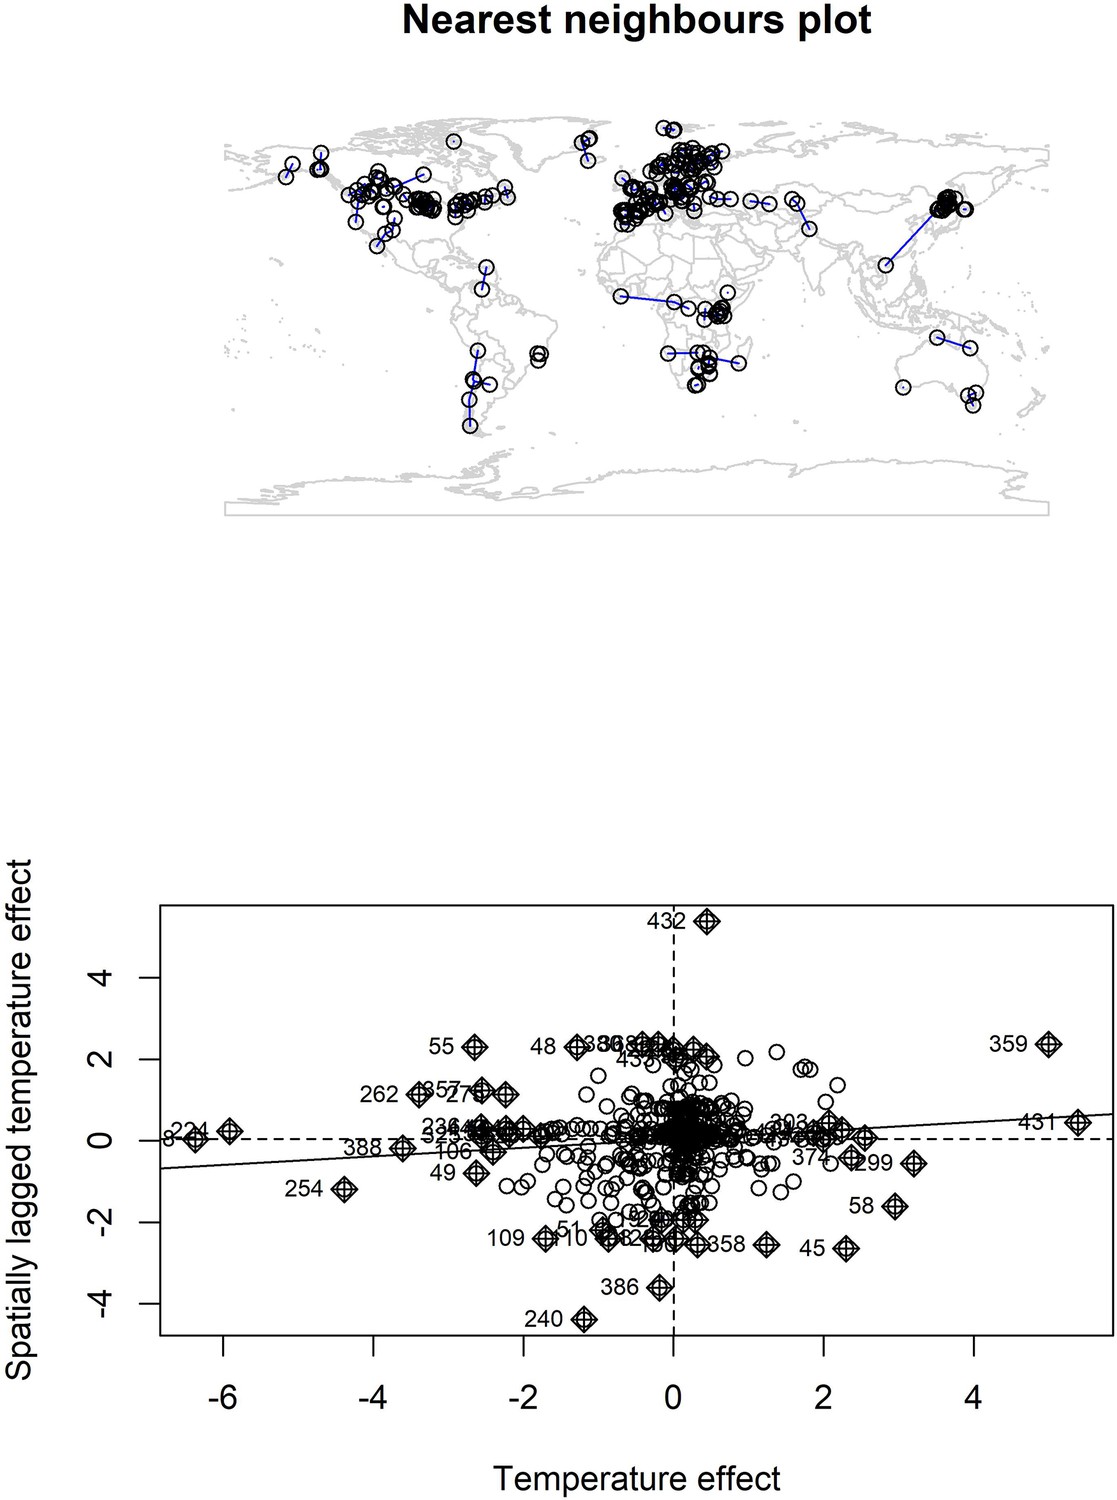
Nearest neighbour plot for abundance record localities and Moran’s I plot for temperature coefficients.
We explored spatial autocorrelation in the coefficients of the GAM models (equation 2) using Moran’s I calculations with a nearest neighbours approach. Top – nearest neighbours plot for each abundance record in the study. We found low magnitude Moran’s I for both temperature (I = 0.11, p = 0.03) and precipitation (I = 0.05, p > 0.05), but a significant Moran’s I for temperature. Bottom – Moran’s I plot for temperature effects indicates weak correlation between temperature effects and spatially lagged temperature effects, but the Moran’s I plot indicates this is due to a small number of studies with high spatially lagged values.
Appendix 1—figure 21
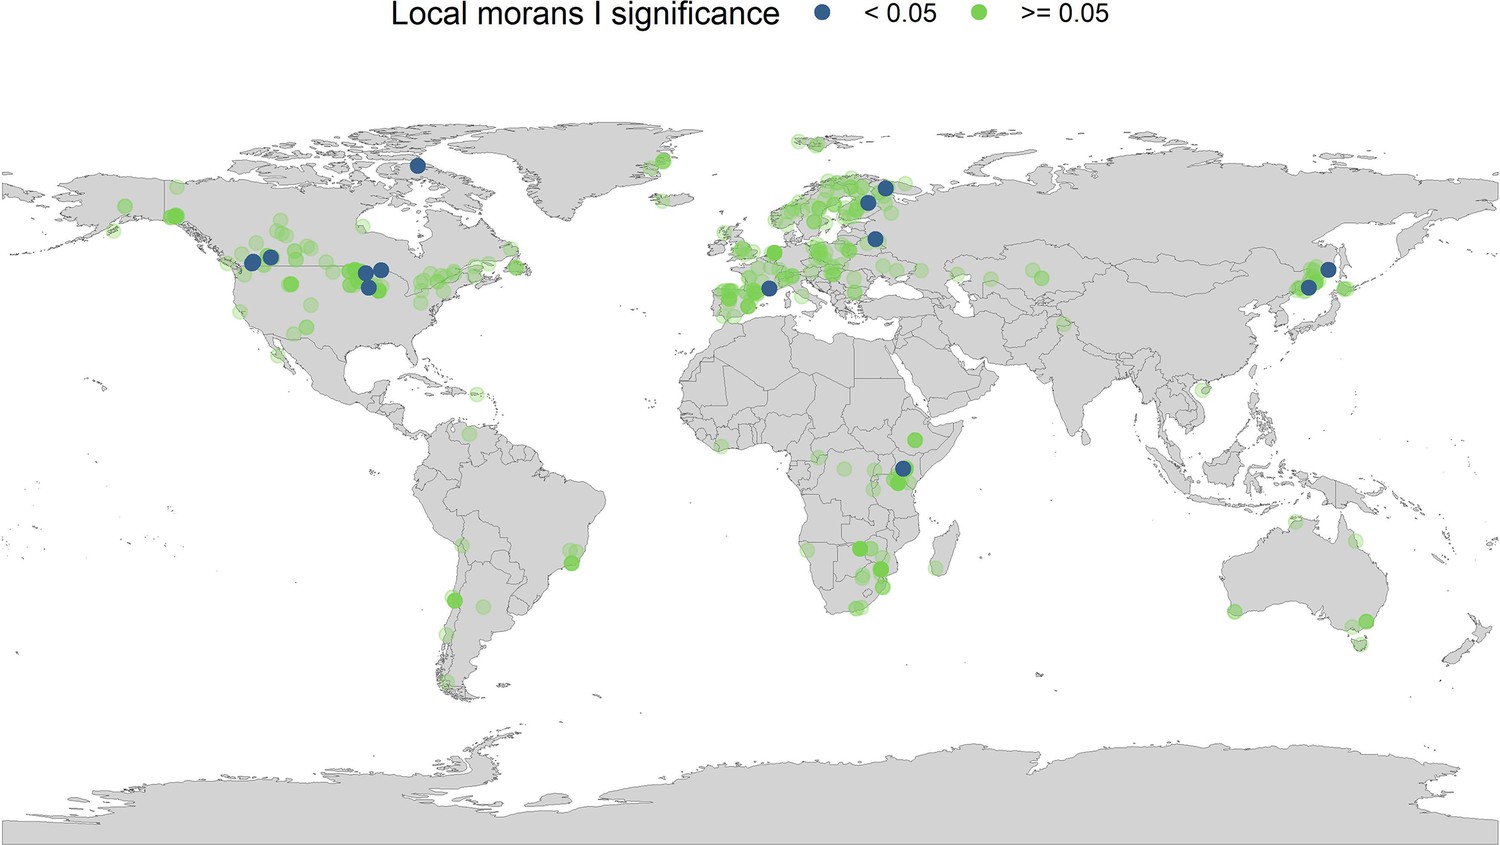
Local Moran’s I significance for temperature coefficients.
In addition to the global Moran’s I analysis for temperature, we ran a local Moran’s I for the temperature coefficients. Each point on the map gives the local Moran’s I significance rating (95% level) and the spatial location of all records in the study. The local Moran’s I indicates that a small number of spatially autocorrelated points is dictating general spatial autocorrelation patterns in the abundance records.
Appendix 1—figure 22
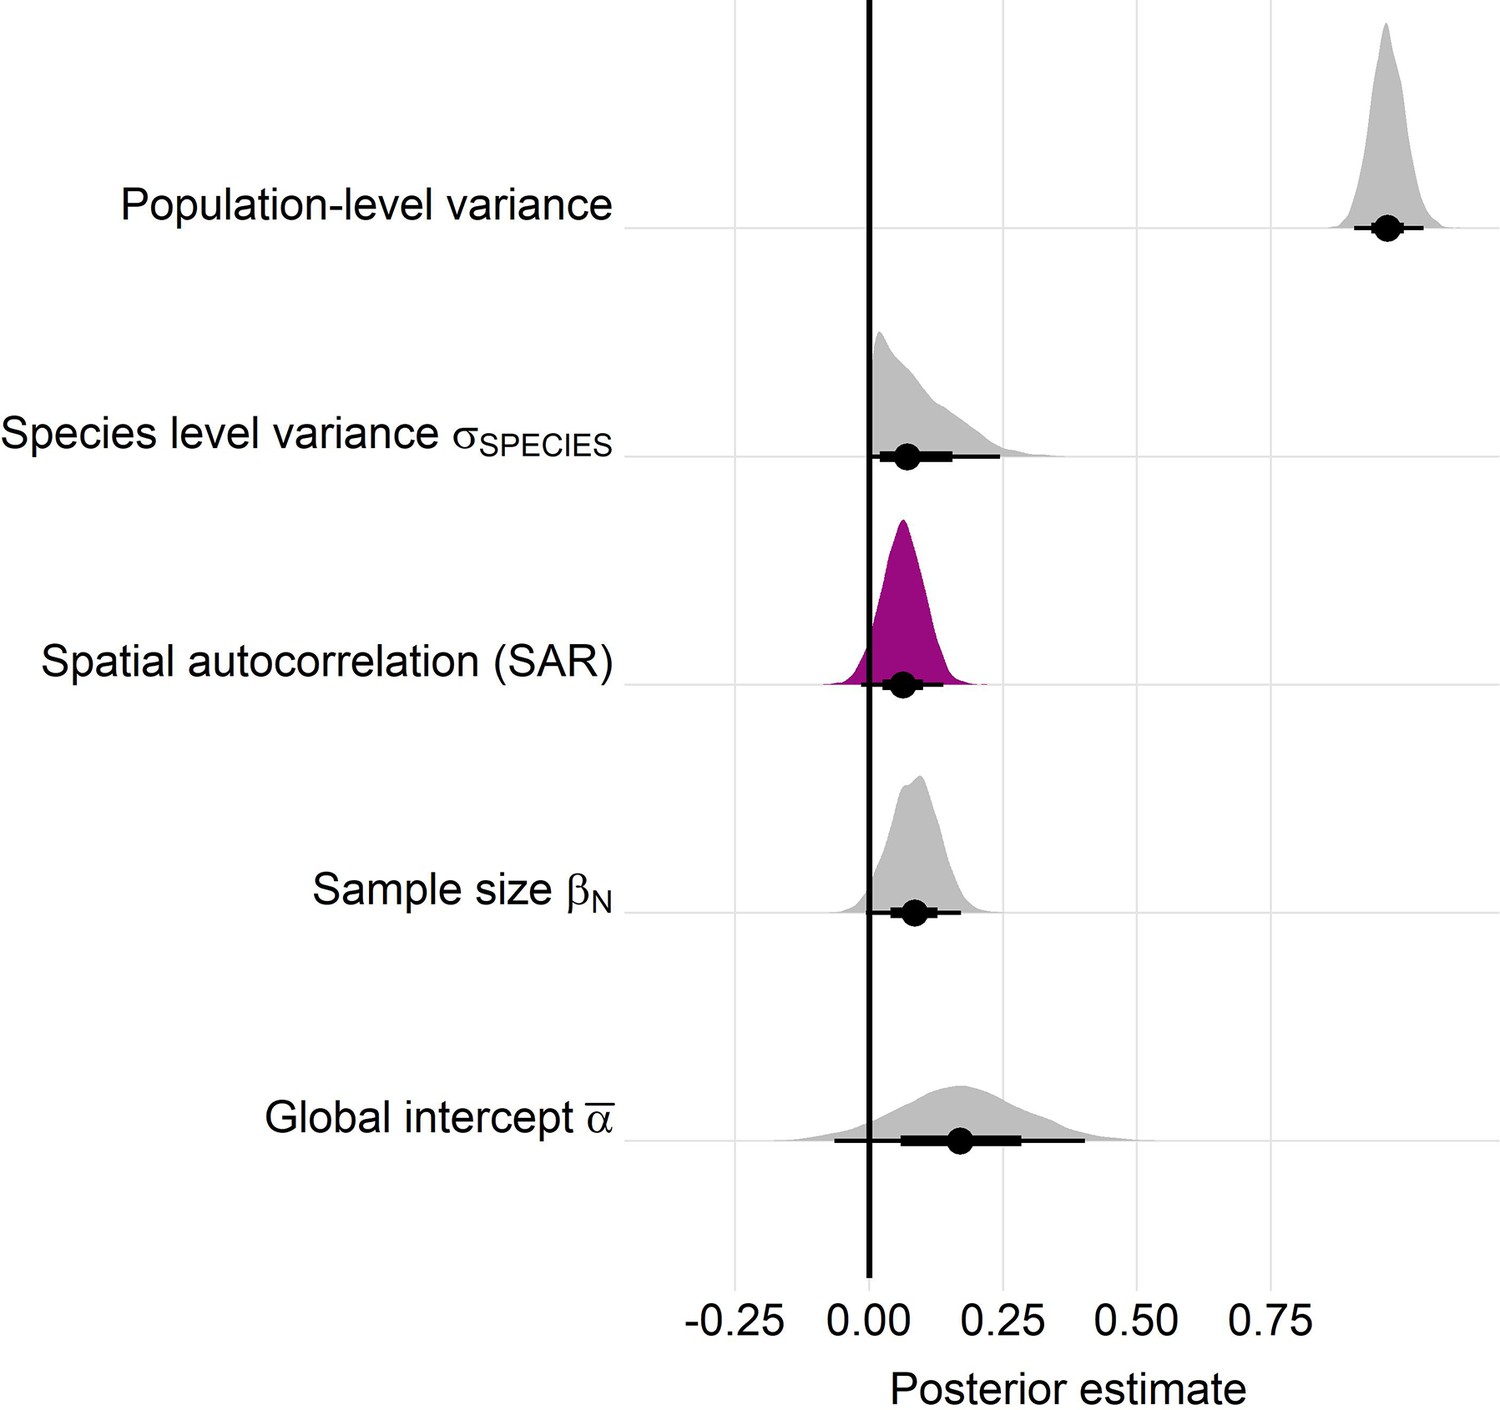
Posterior estimates for a Gaussian meta-regression model of temperature coefficients with an explicit spatially autocorrelated term across the terrestrial mammals.
Posterior density distributions for each key model parameter (as in equation 2) given with half eye plots, where the point indicates the posterior average, and the bar is calculated using a cumulative distribution function. Purple density indicates the posterior estimate for the spatially autocorrelated term, whose posterior distribution overlapped with zero. Furthermore, leave-one-out cross validation indicated that the base model excluding spatial autocorrelation had a higher predictive performance than the model including the spatial term.
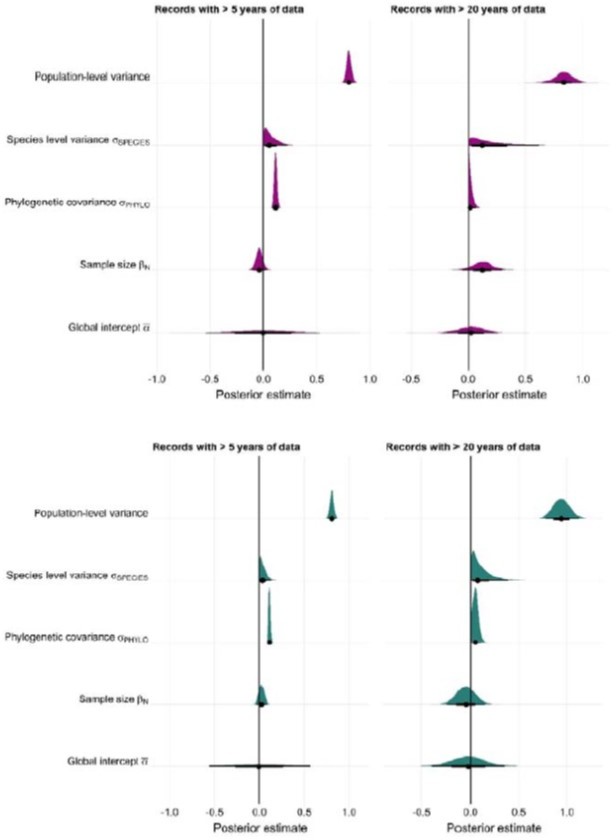
Appendix 1—figure 23
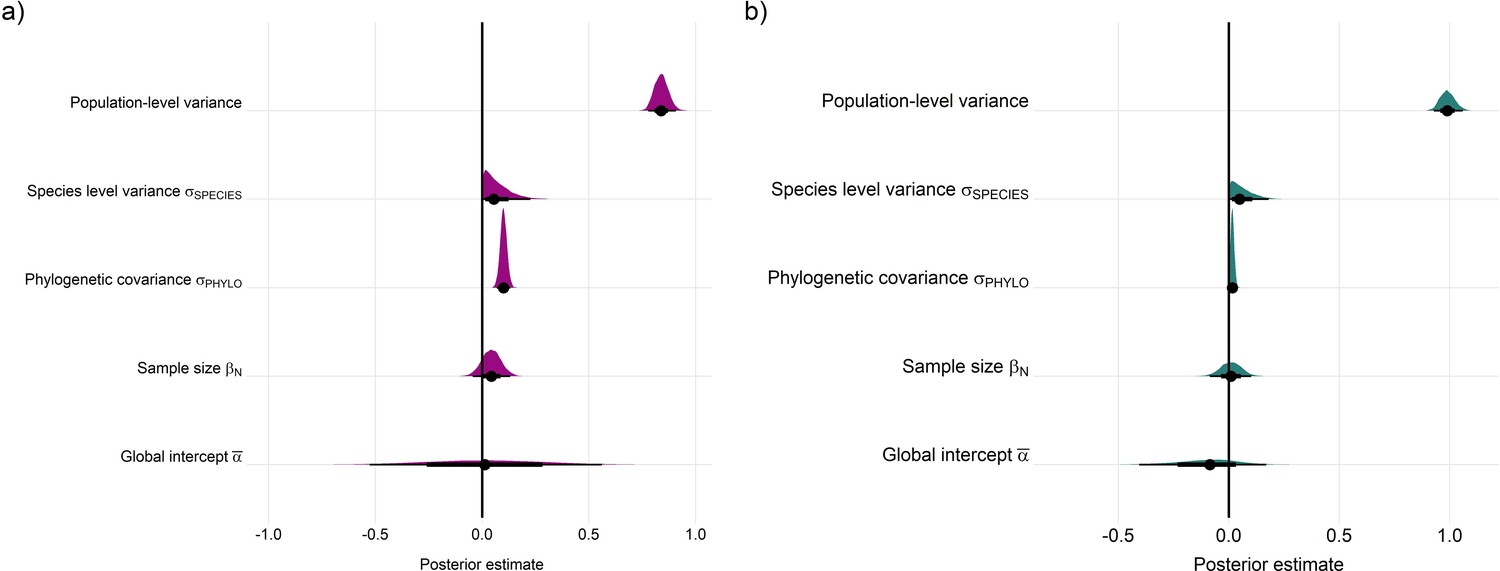
Posterior estimates for Gaussian meta-regression models for temperature (a) and precipitation (b) variance across the terrestrial mammals.
Posterior density distributions for each key model parameter (as in equation 2) given with half eye plots, where the point indicates the posterior average, and the bar is calculated using a cumulative distribution function.
Appendix 1—figure 24
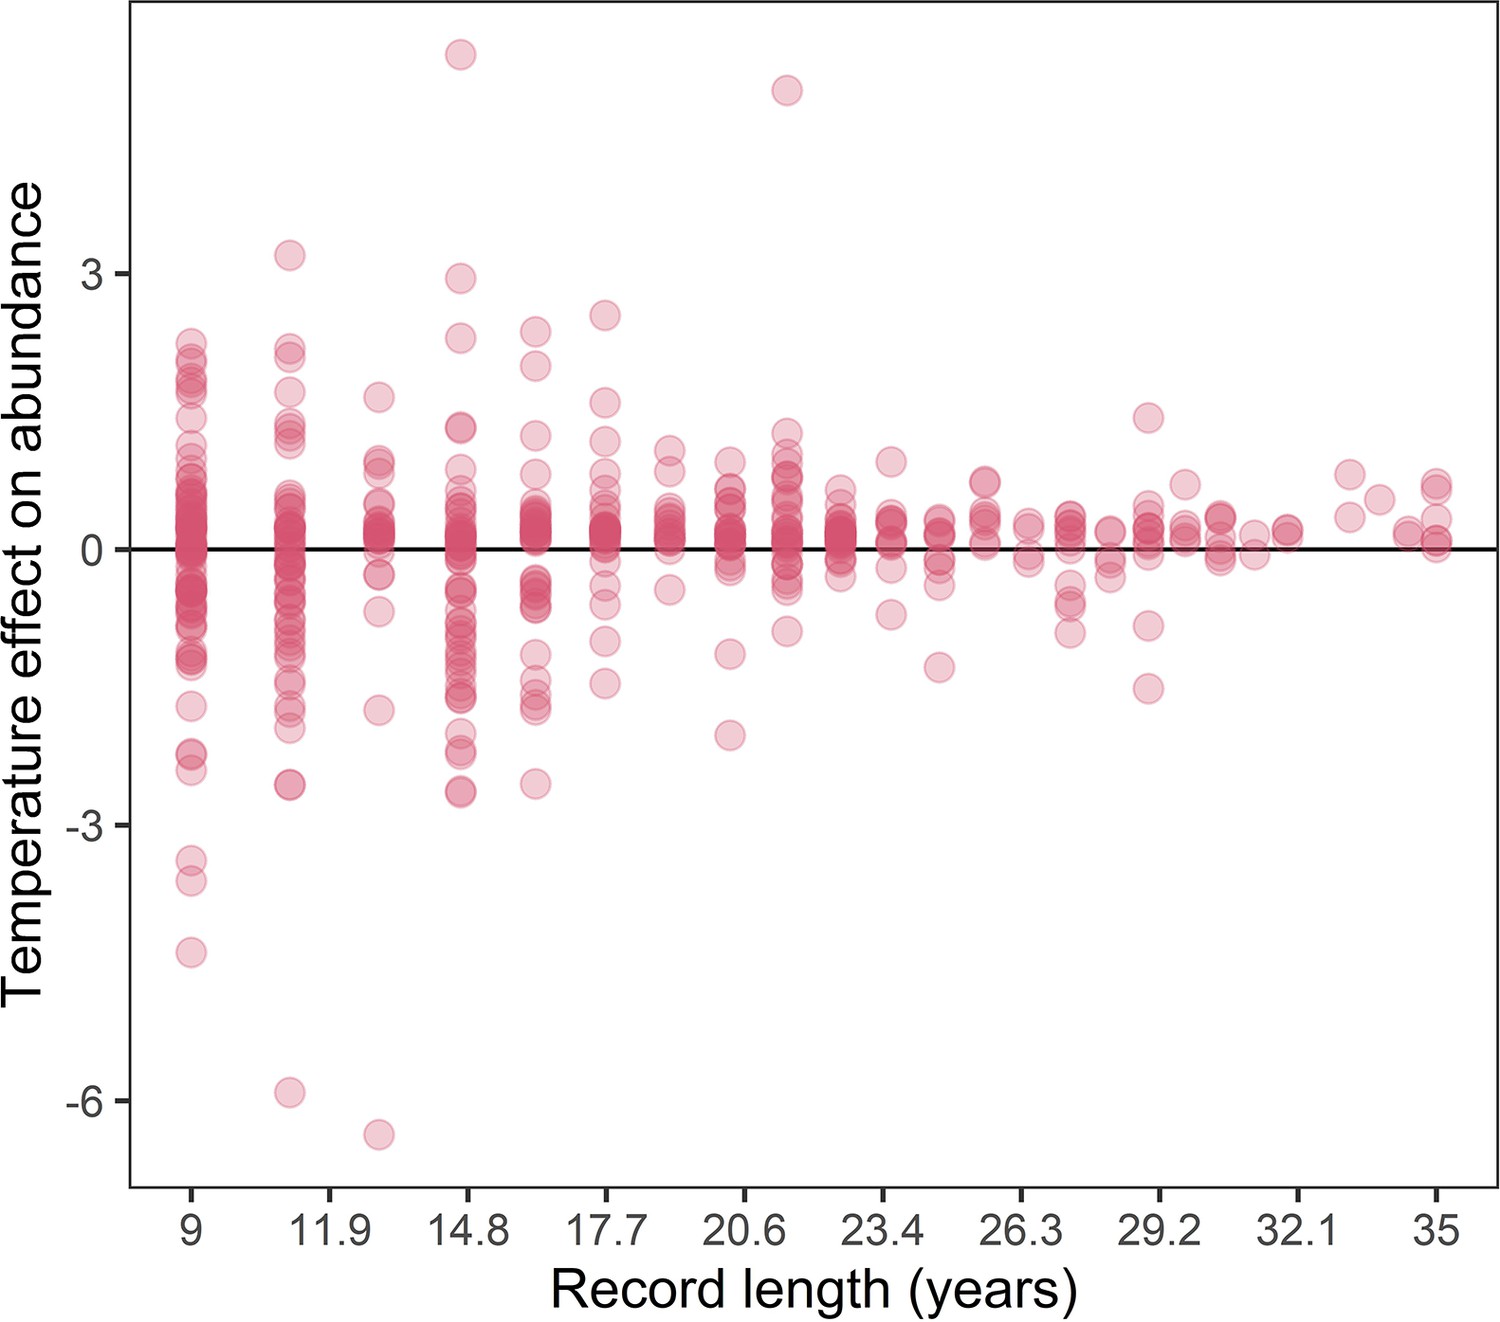
The association between record length and population responses to temperature anomalies in the terrestrial mammals.
Points are the temperature responses of individual records. This figure highlights increased variance in temperature responses for shorter population records.
Appendix 1—figure 25
Posterior predictions of Gamma regressions between litter size and absolute responses to temperature (a), and maximum longevity and absolute responses to precipitation (b) for a high-quality subset of data ≥20 years.
Standardisation was performed using z-scores of the natural-log of raw life-history traits. The values on each x-axis are split into equal bins of 0.2 units from the minimum to the maximum life-history value. Points are coefficient means, with standard error bars. The black lines are the mean posterior predictions from the best predictive model, where predictions were calculated averaging over all other covariates and varying effects in the model. The shaded intervals are the 90% quantile prediction intervals.
Appendix 1—figure 26
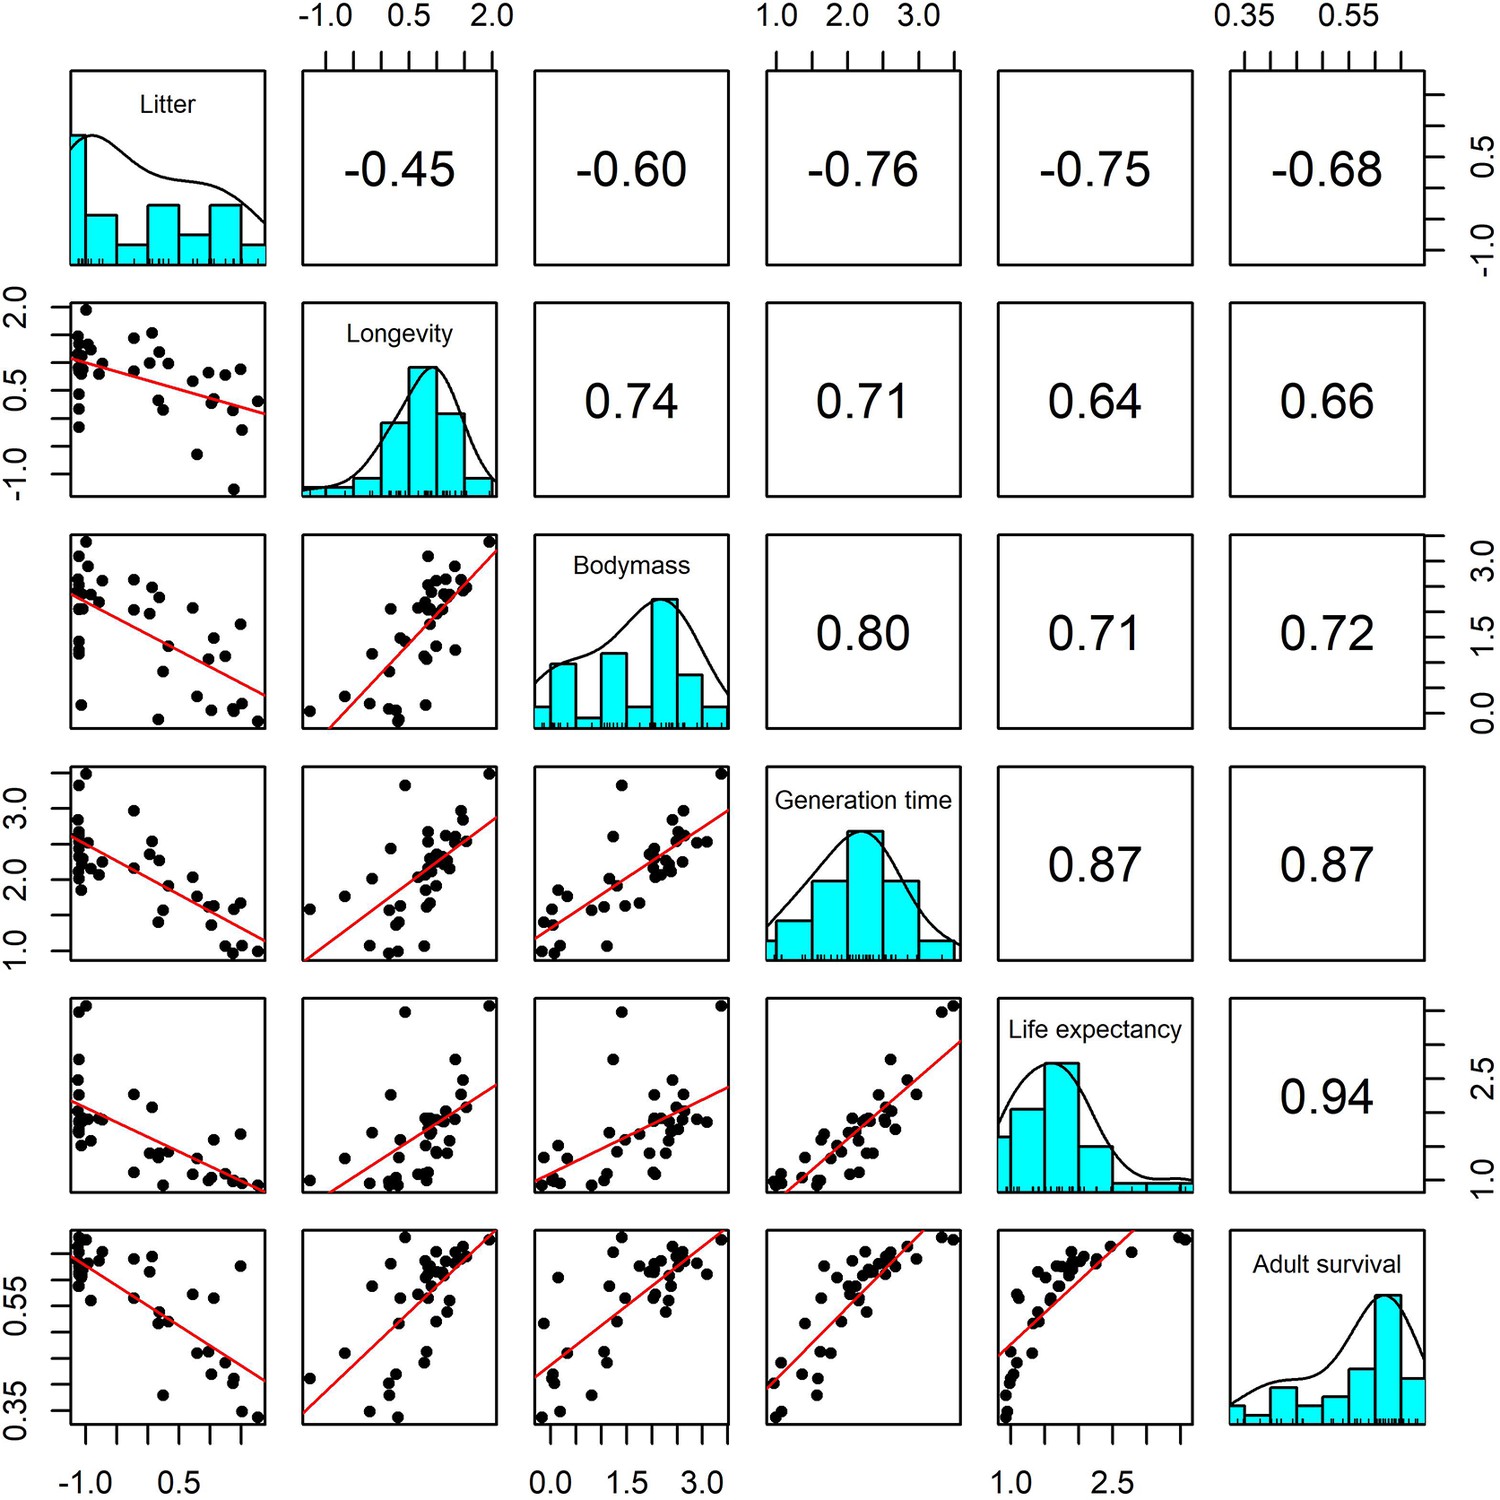
Pairwise Pearson correlation plots for all life-history traits explored for a subset of 37 terrestrial mammal species.
Standardisation was performed using z-scores of the natural-log of raw life-history traits. Longevity, litter size and body mass we obtained from the sources highlighted in the Methods. The life-history traits generation time, life-expectancy and adult survival were obtained from the COMADRE database of animal matrix population models (Salguero-Gómez et al., 2016). Numbers are the Pearson’s correlation coefficient. Generally, there was high covariance in all life-history traits.
Appendix 1—figure 27
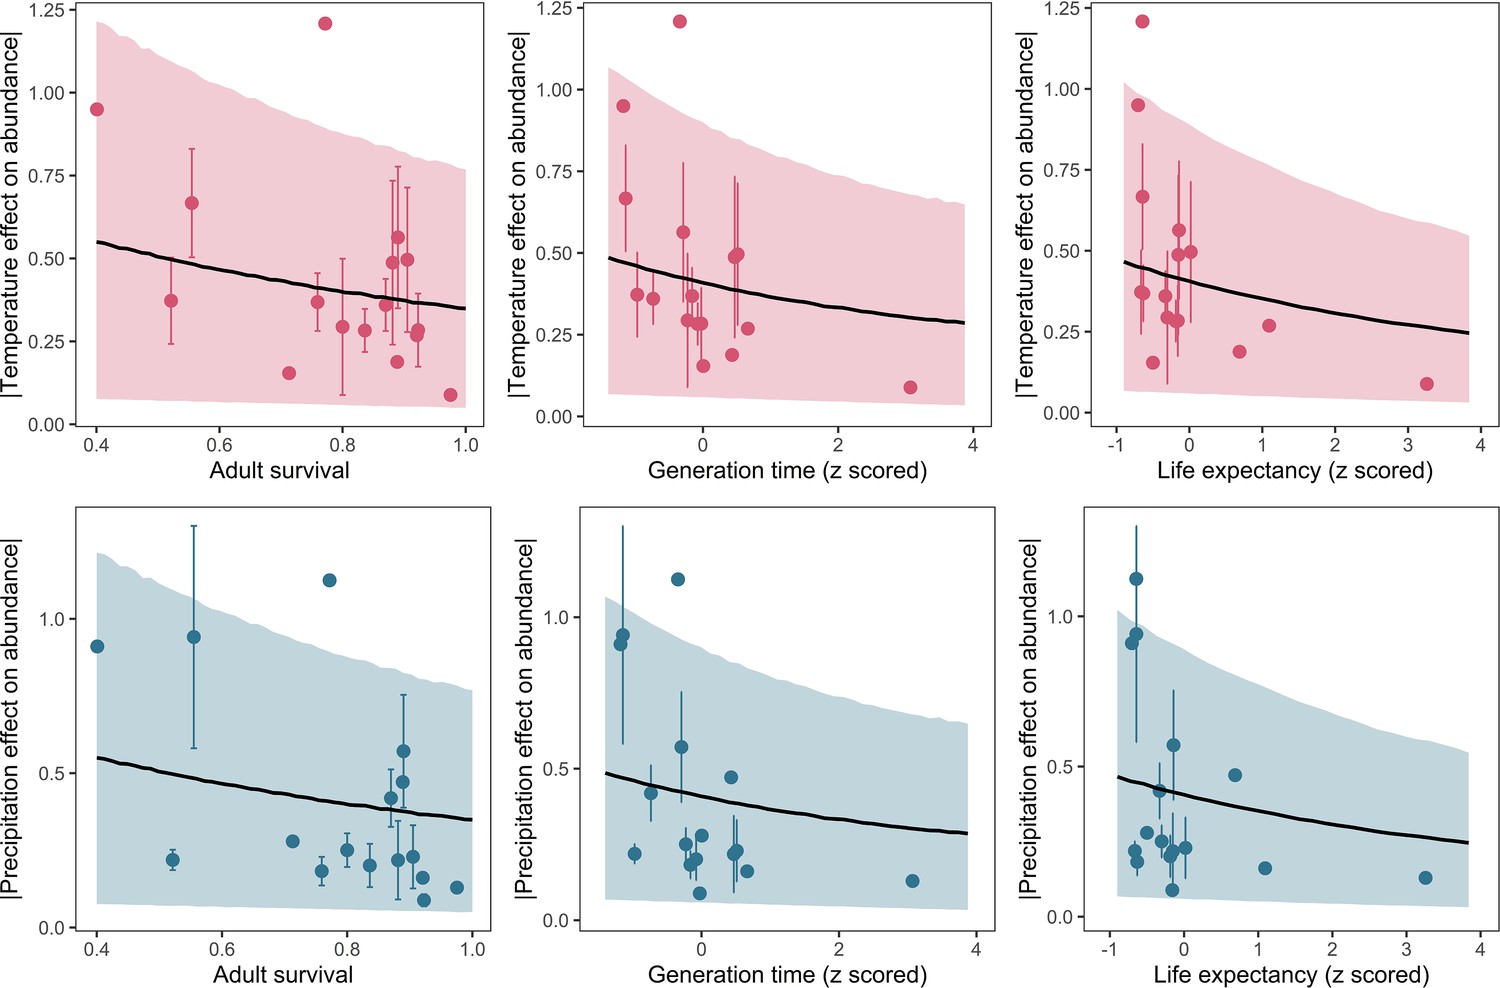
Posterior predictions of Gamma regressions between high-quality life-history traits from structured population models, and both temperature (top) and precipitation (bottom).
Standardisation was performed using z-scores of the natural-log of raw life-history traits. The life-history traits were obtained from the COMADRE database of animal matrix population models (Salguero-Gómez et al., 2016). Points are coefficient means, with standard error bars. The black lines are the mean posterior predictions from the model, which excluded both phylogenetic and species-level variation. The shaded intervals are the 90% quantile prediction intervals.
Author response image 1
Author response image 2

Tables
Author response table 1
| Model | predictors | LOO elpd | LOO elpd error | elpd difference | elpd error difference | LOO information criterion |
|---|---|---|---|---|---|---|
| temp_base_5yr | base | 840.15 | 46.76 | 0.00 | 0.00 | -1,680.31 |
| temp_lh_uni_5yr | longevity+ bodymass + litter | 839.90 | 47.11 | -0.25 | 1.34 | -1,679.81 |
Author response table 2
| Model | predictors | LOO elpd | LOO elpd error | elpd difference | elpd error difference | LOO information criterion |
|---|---|---|---|---|---|---|
| precip_lh_uni_5yr | longevity+ bodymass + litter | 796.61 | 42.92 | 0.00 | 0.00 | -1,593.21 |
| precip_base_5yr | base | 795.98 | 42.95 | -0.62 | 0.96 | -1,591.96 |
Author response table 3
| Model | predictors | LOO elpd | LOO elpd error | elpd difference | elpd error difference | LOO information criterion |
|---|---|---|---|---|---|---|
| temp_litter_20yr_nophylo | litter | -40.95 | 10.18 | 0.00 | 0.00 | 81.89 |
| temp_lh_uni_20yr_nophylo | longevity +bodymass + litter | -42.06 | 10.25 | -1.11 | 0.32 | 84.12 |
| temp_longevity-20yr-nophylo | longevity | -42.99 | 10.64 | -2.05 | 1.98 | 85.99 |
| temp_base_20yr_nophylo | base | -43.85 | 11.14 | -2.91 | 2.25 | 87.71 |
Author response table 4
| Model | predictors | LOO elpd | LOO elpd error | elpd difference | elpd error difference | LOO information criterion |
|---|---|---|---|---|---|---|
| precip_longevity_20yr_nophylo | longevity | -22.49 | 11.53 | 0.00 | 0.00 | 44.97 |
| precip_base_20yr_nophylo | base | -22.95 | 12.35 | -0.46 | 1.70 | 45.90 |
| precip_litter_20yr_nophylo | litter | -23.09 | 11.64 | -0.60 | 0.90 | 46.18 |
| precip_lh-uni-20yr_nophylo | longevity + bodymass + litter | -24.06 | 11.79 | -1.57 | 1.23 | 48.12 |
Additional files
-
Supplementary file 1
Model selection results tables for effects of life-history on population responses to weather anomalies in terrestrial mammals.
- https://cdn.elifesciences.org/articles/74161/elife-74161-supp1-v2.docx
-
Transparent reporting form
- https://cdn.elifesciences.org/articles/74161/elife-74161-transrepform1-v2.pdf
Download links
A two-part list of links to download the article, or parts of the article, in various formats.
Downloads (link to download the article as PDF)
Open citations (links to open the citations from this article in various online reference manager services)
Cite this article (links to download the citations from this article in formats compatible with various reference manager tools)
Life history predicts global population responses to the weather in terrestrial mammals
eLife 11:e74161.
https://doi.org/10.7554/eLife.74161


