Th2 single-cell heterogeneity and clonal distribution at distant sites in helminth-infected mice
- Department of Infection Biology, Universitätsklinikum Erlangen and Friedrich-Alexander, University Erlangen-Nürnberg, Germany
- Institute of Clinical Microbiology, Immunology and Hygiene, University Hospital Erlangen and Friedrich-Alexander-University Erlangen-Nürnberg, Germany
- Institute of Human Genetics, Universitätsklinikum Erlangen and Friedrich-Alexander University Erlangen-Nürnberg, Germany
Figures
Figure 1 with 3 supplements
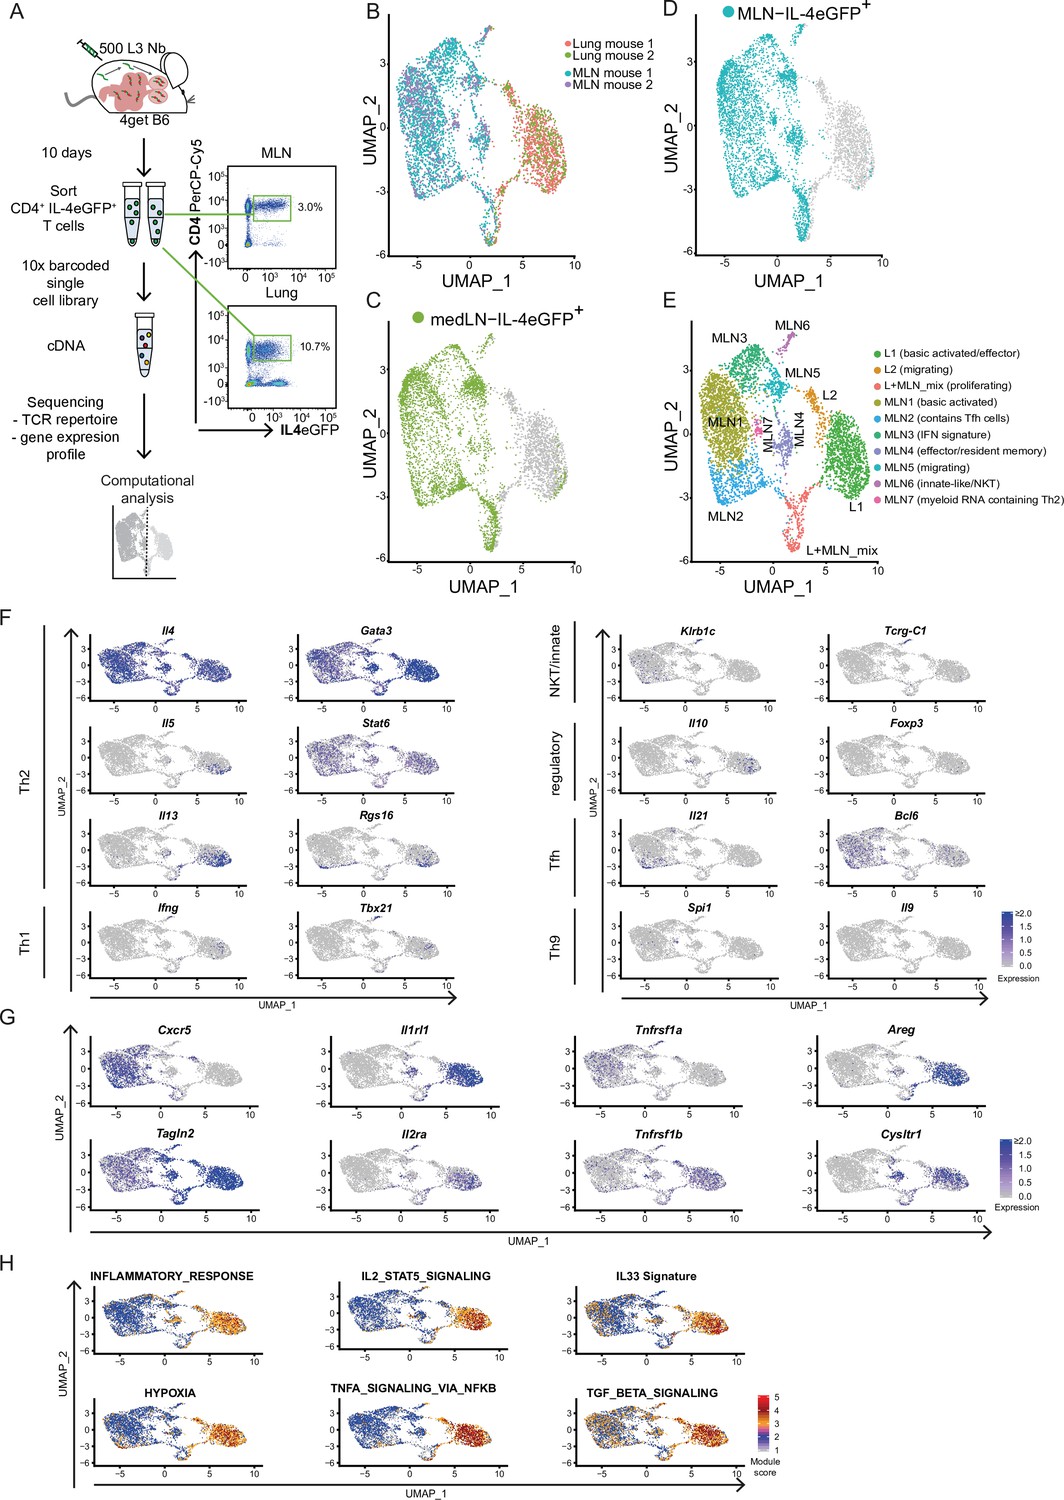
Th2 cells of mesenteric lymph node (MLN) and lung adopt tissue-specific RNA signatures.
(A) General experimental outline. MLN and lung cells of two individual Nippostrongylus brasiliensis (Nb)-infected IL-4eGFP reporter mice (4get B6) were sorted for IL-4eGFP+CD4+ cells 10 days post infection. Then combined transcriptome and T-cell receptor (TCR) repertoire sequencing were performed. Flow cytrometry plots show the frequency of Th2 cells (IL-4eGFP+CD4+ cells) in MLN and lung. (B) Uniform Manifold Approximation and Projection (UMAP) representation of MLN and lung cells 10 days post Nb infection. (C, D) medLN and MLN cells sequenced in a separate run were plotted on the existing UMAP defined in the initial MLN + lung sequencing run by integration based on shared anchor genes to demonstrate similarity of medLN and MLN cells. (E) De novo unsupervised clustering approach with manually added cell type description. Clusters are indicated on UMAP. (F) Expression of selected CD4 T-cell subset defining genes, (G) genes that are differently expressed between MLN and lung, or (H) gene signature module scores for single cells plotted on top of UMAP representation. Each of the independent single-cell sequencing experiments is based on two mice.
Figure 1—figure supplement 1
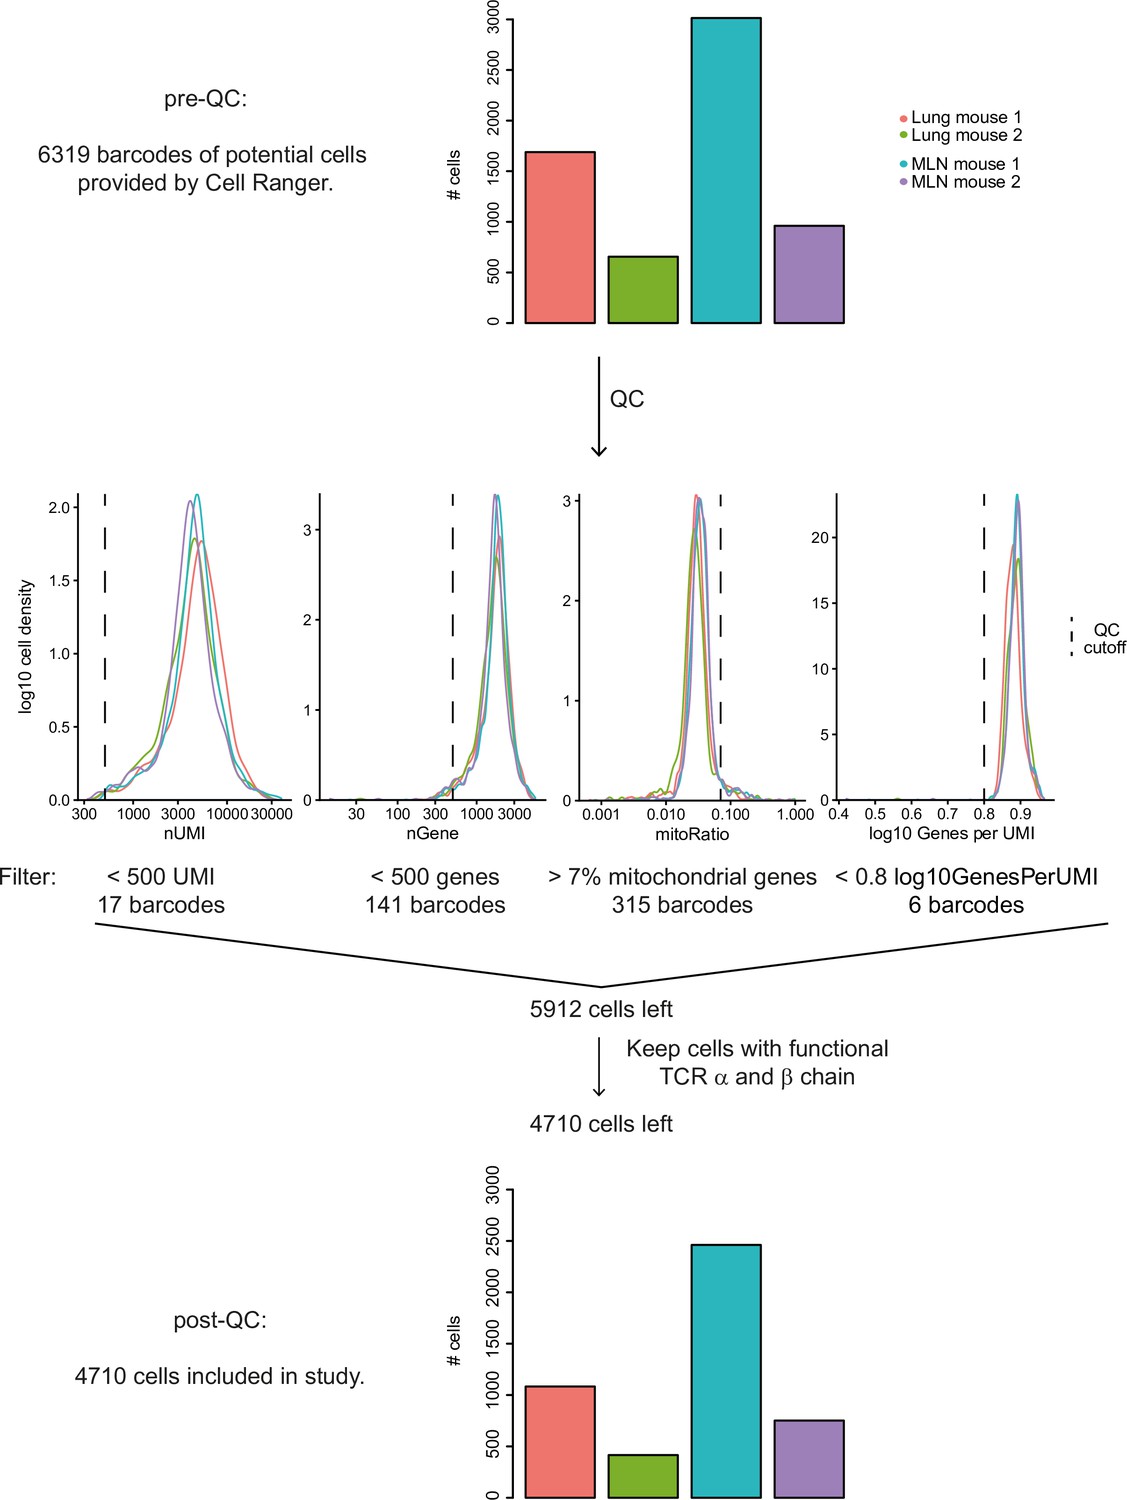
Quality control of Th2 single-cell sequencing 10 days post Nippostrongylus brasiliensis (Nb) infection.
Overview of QC workflow. Numbers of potential cells pre-QC are given for different mice and organs (upper panel). Histograms visualize exclusion of potential cells by various cut offs (middle). Numbers of included cells post QC are visualized for different mice and organs (lower panel). Functional T-cell receptor (TCR) chains according to Cell Ranger definition.
Figure 1—figure supplement 2
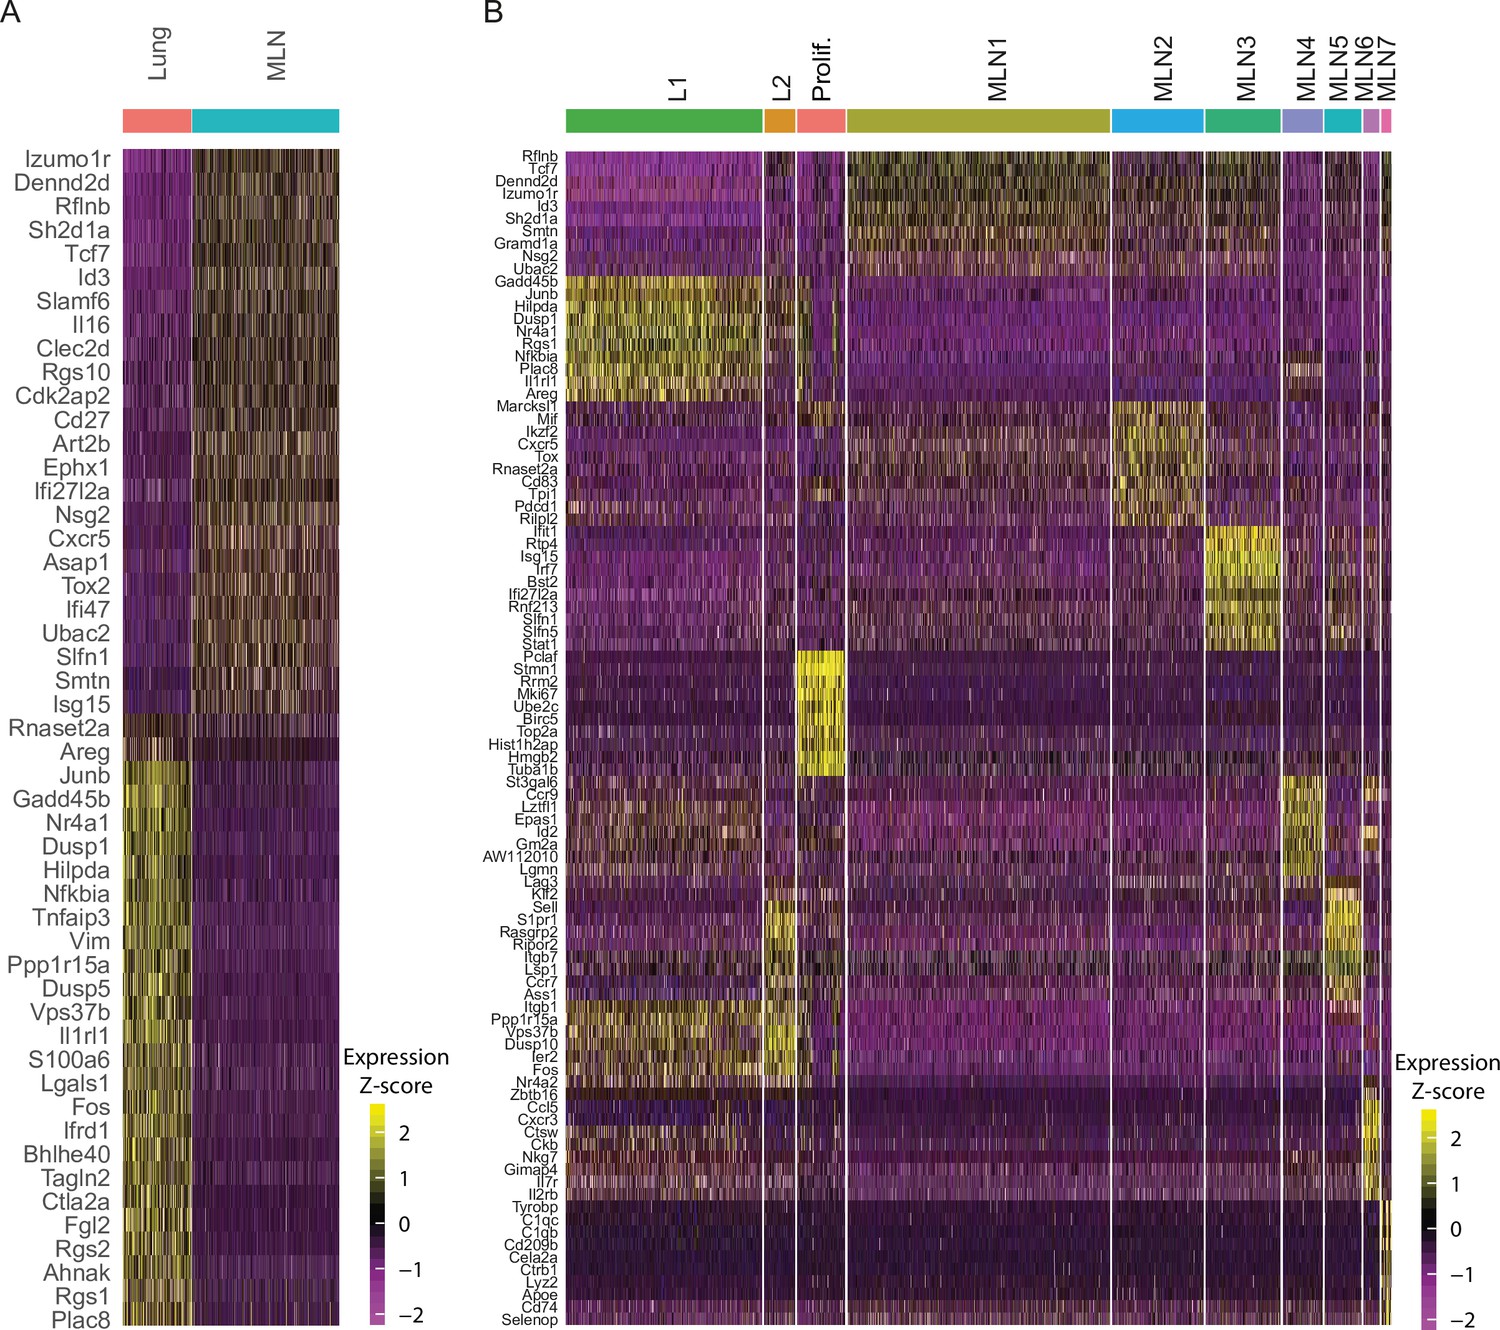
Comparison of mesenteric lymph node (MLN) and lung Th2 cells after Nippostrongylus brasiliensis (Nb) infection on single-cell level.
(A) Heatmap of top 25 most up- and most downregulated genes between MLN and lung IL-4eGFP+CD4+ cells. (B) Heatmap of top 10 upregulated genes for each cluster compared to all other cells (related to Figure 1C,D).
Figure 1—figure supplement 3
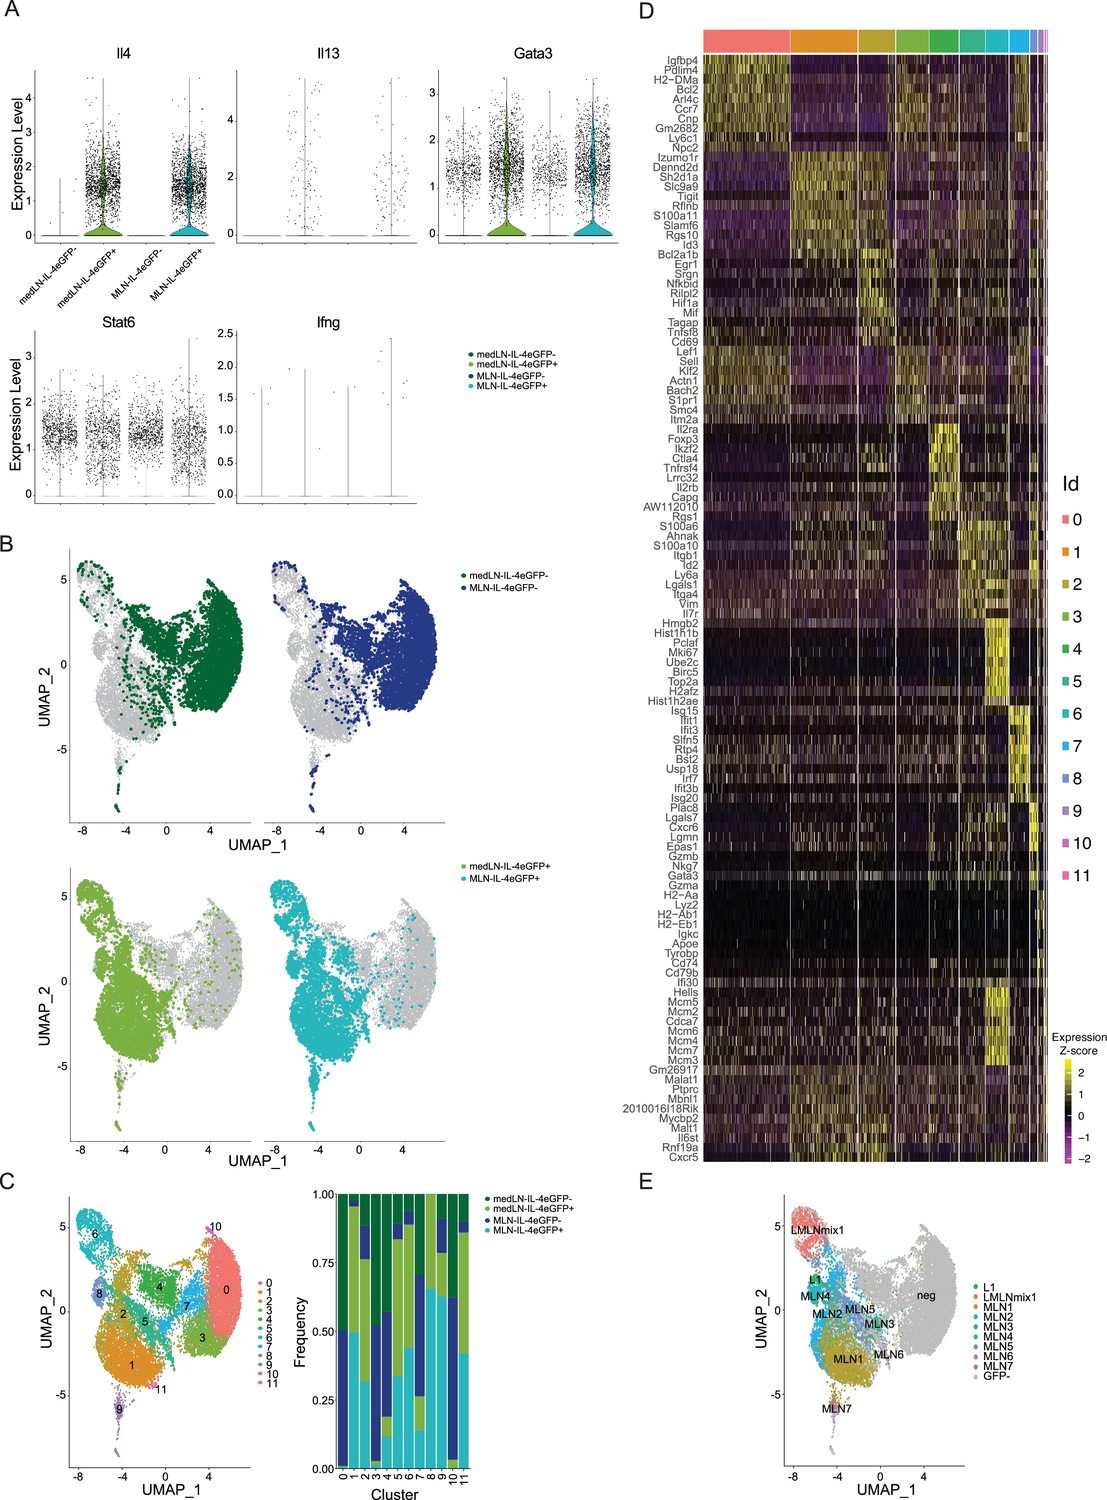
Comparison of medLN and mesenteric lymph node (MLN) Th2 cells after Nippostrongylus brasiliensis (Nb) infection on single-cell level.
At day 10 after Nb infection single-cell transcriptome sequencing was performed on IL-4eGFP+CD4+ and IL-4eGFP−CD4+ cells from medLN and MLN of 4get mice. (A) Expression of key Th2 marker genes (Il4, Il13, Gata3, and Stat6) and Th1 marker Ifng for comparison. (B) UMAPs of all sequenced cells combined separately overlayed with cells of each condition as indicated. (C) Unsupervised clustering was performed and clusters are indicated on UMAP. Composition of each cluster according to conditions is given (medLN IL-4eGFP−, medLN IL-4eGFP+, MLN IL-4eGFP−, MLN-IL-4eGFP+). (D) Heatmap of top 10 upregulated genes for each cluster compared to all other cells. (E) IL-4eGFP+ cells were assigned to cluster identities of the MLN and lung sequencing run for comparison. Inferred cluster identities are indicated on UMAP. Sequencing was performed for medLN and MLN of two mice.
Figure 2 with 3 supplements
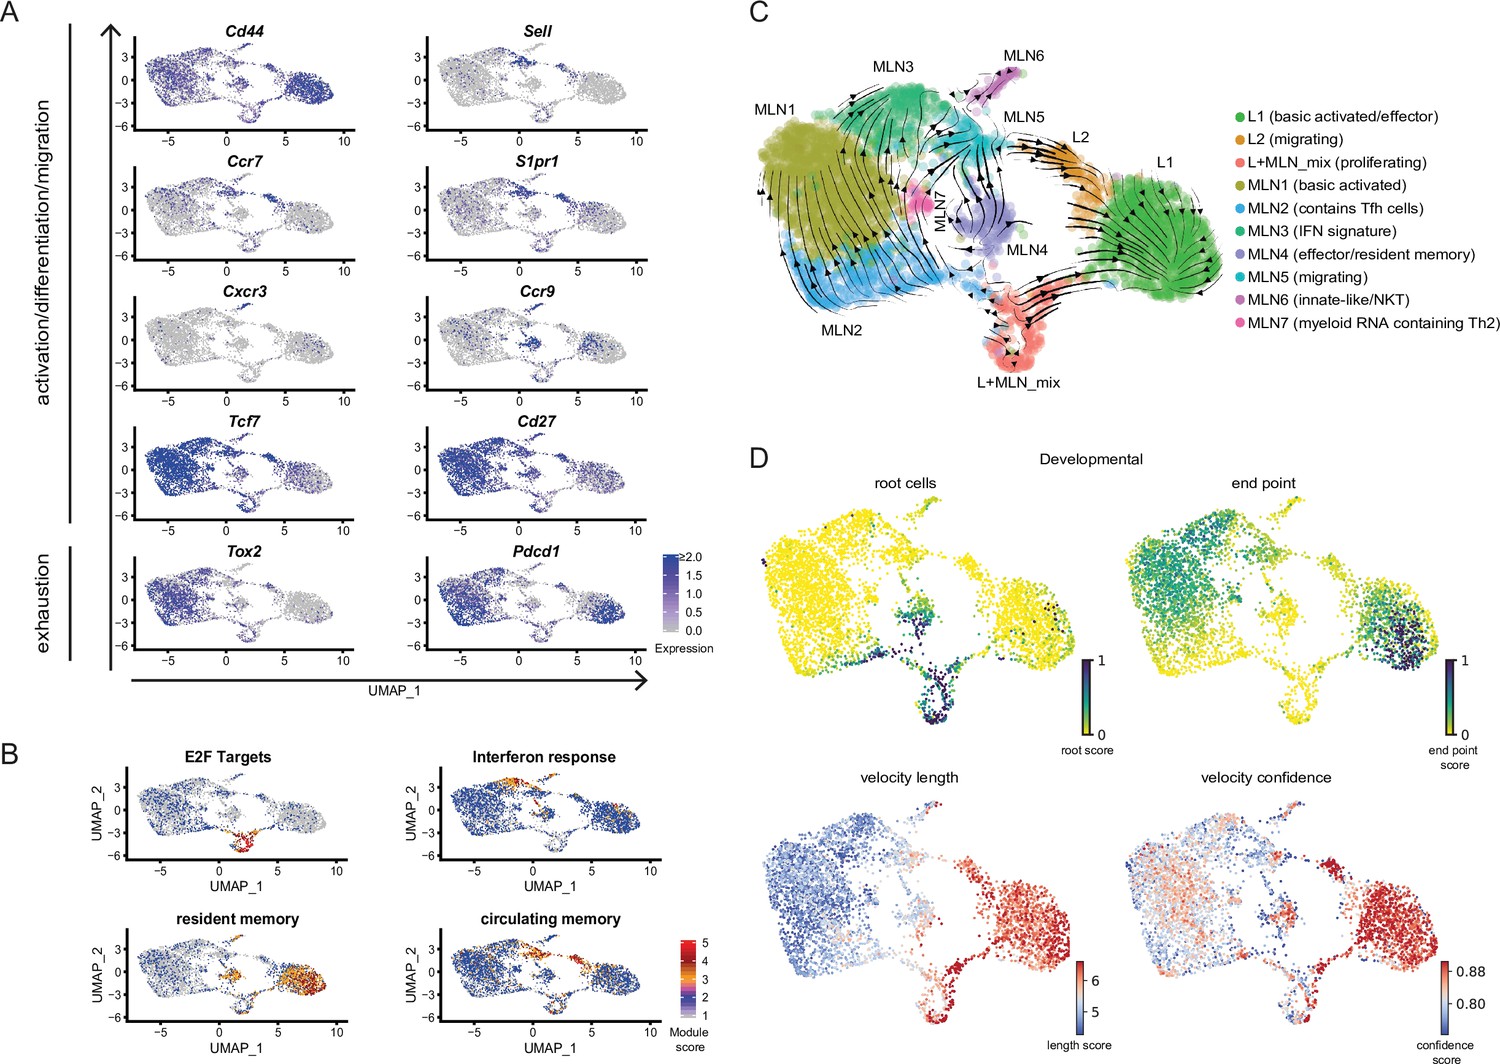
Conserved expression profiles for migratory and effector Th2 populations between organs and their inferred developmental paths.
(A) Expression of selected marker genes associated with biological processes or (B) gene signature scores for single cells on top of UMAPs. (C) RNA velocity analysis. Arrows present inferred developmental paths. (D) RNA velocity defined root cells and developmental endpoints as well as inferred differentiation speed (velocity length) and velocity confidence for cells are visualized on UMAPs.
Figure 2—figure supplement 1
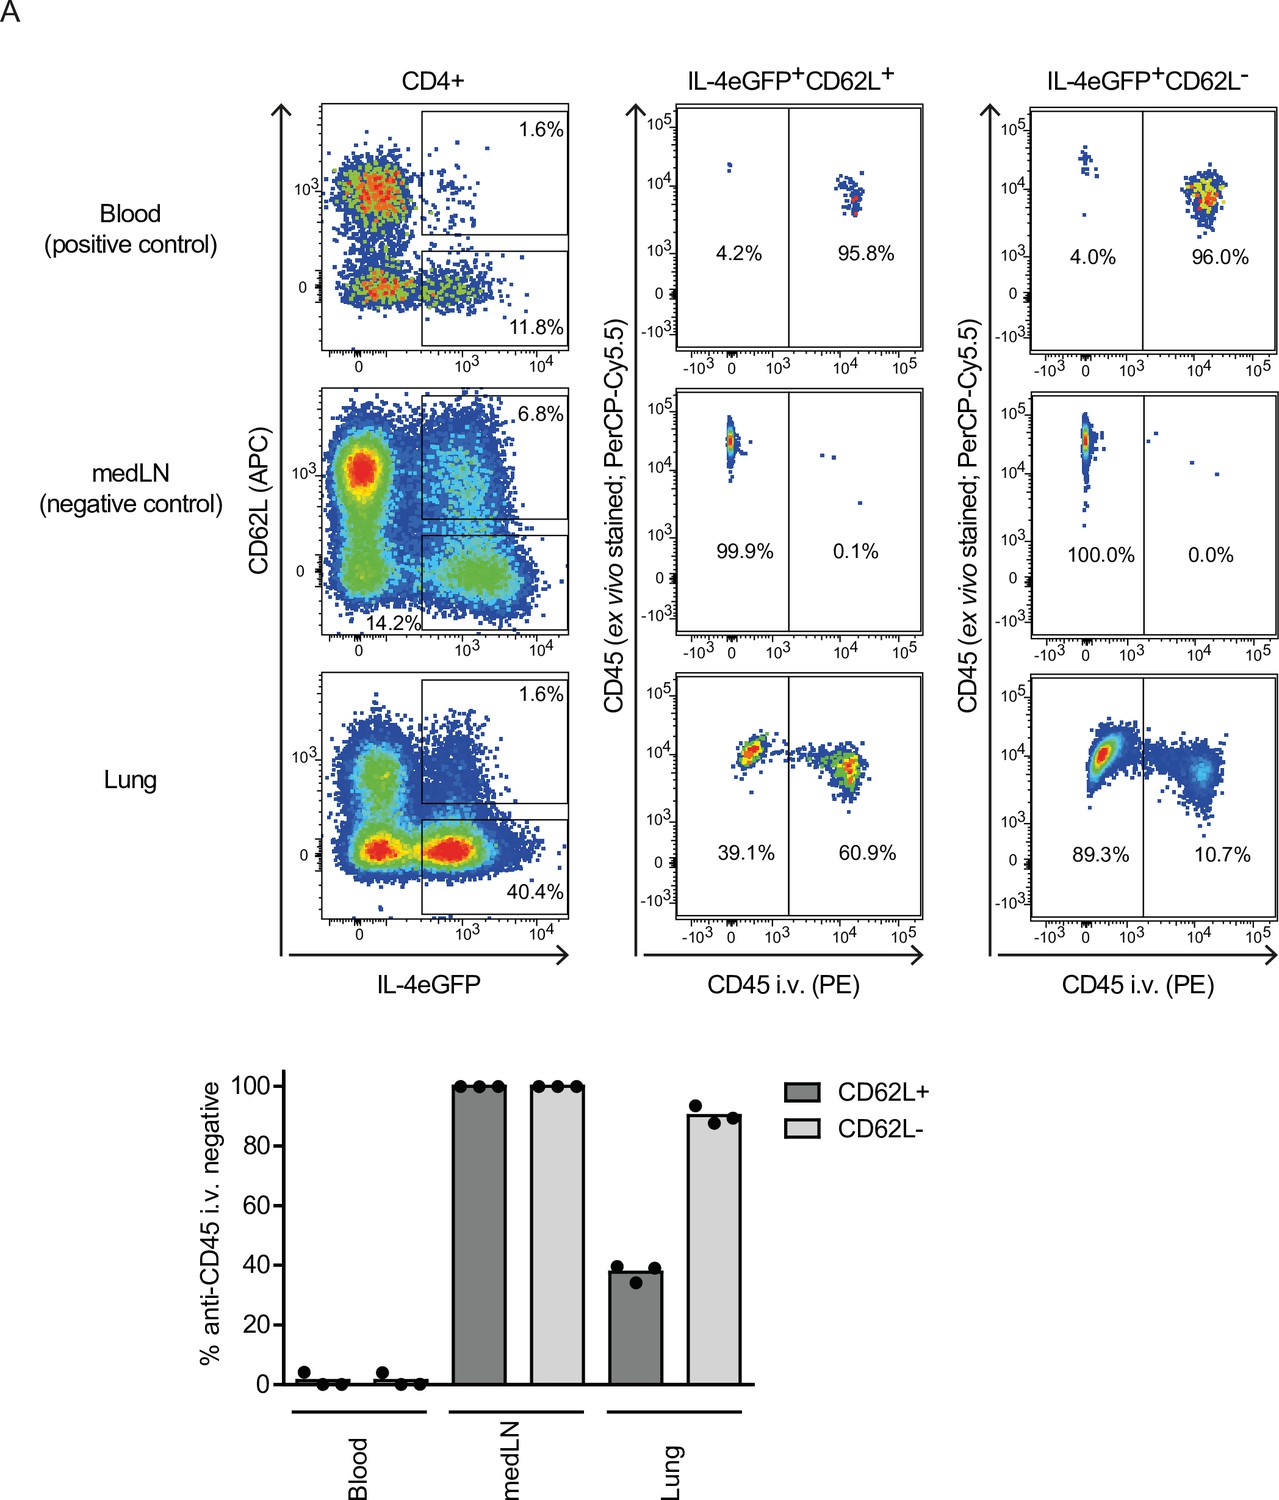
Vasculature stain for IL-4eGFP +CD4+ subsets from lung tissue.
At day 10 after Nippostrongylus brasiliensis (Nb) infection, 4get mice were injected with anti-CD45-PE i.v. 5 min before blood (positive control), medLN (negative control), and lung were collected to label cells in vasculature. Then cells were additionally stained for CD4, CD62L, and CD45-PerCP-Cy5.5 ex vivo, analyzed by flow cytometry and gated as indicated. The proportion of IL-4eGFP+CD4+, CD62L−, or CD62L+ cells being not stained by intravenous vascular CD45 staining was determined.
Figure 2—figure supplement 2
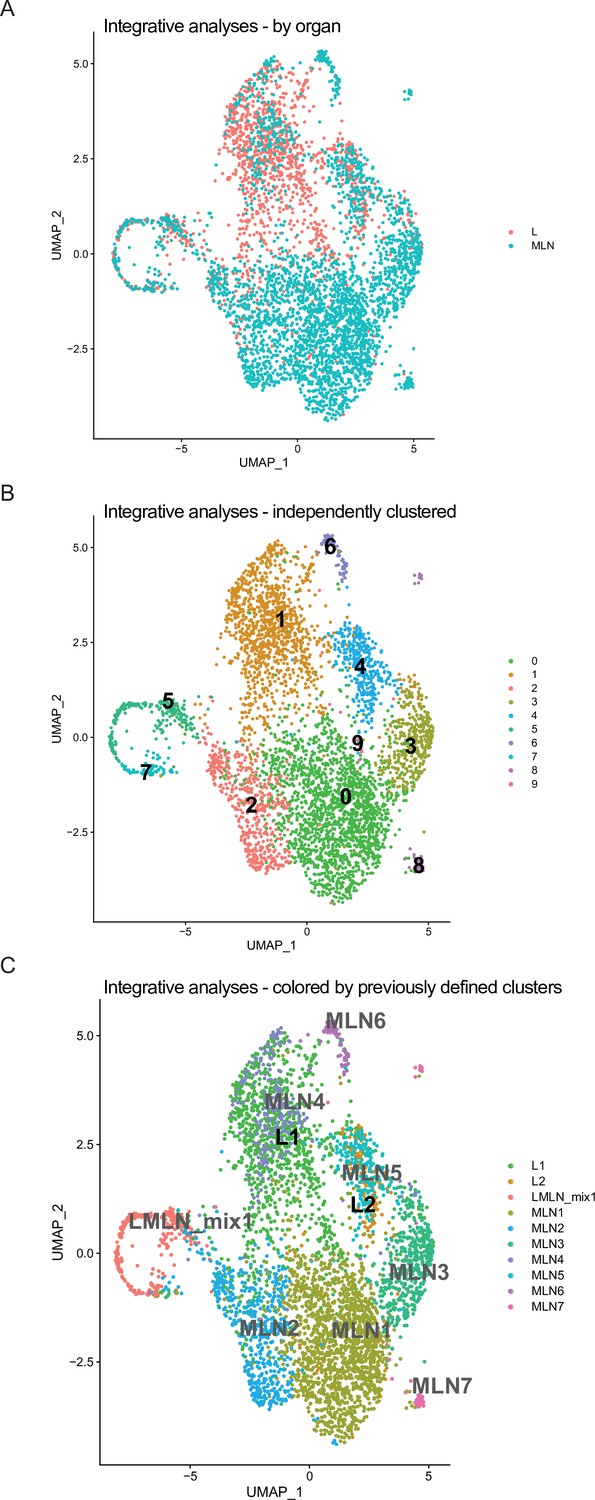
Integrative similarity analyses of mesenteric lymph node (MLN) and lung Th2 cells after Nippostrongylus brasiliensis (Nb) infection.
Single-cell data of IL-4eGFP+CD4+ MLN and lung were integrated based on shared anchor genes, forcing cells to cluster with most similar cells of the other organ. (A) UMAP of MLN and lung integrated data colored by organ. (B) Unsupervised clustering was performed and cluster is indicated on UMAP. (C) Cells are colored based on clusters defined when organ data were not integrated beforehand to highlight which cluster of MLN and lung share similarities between organs.
Figure 2—figure supplement 3
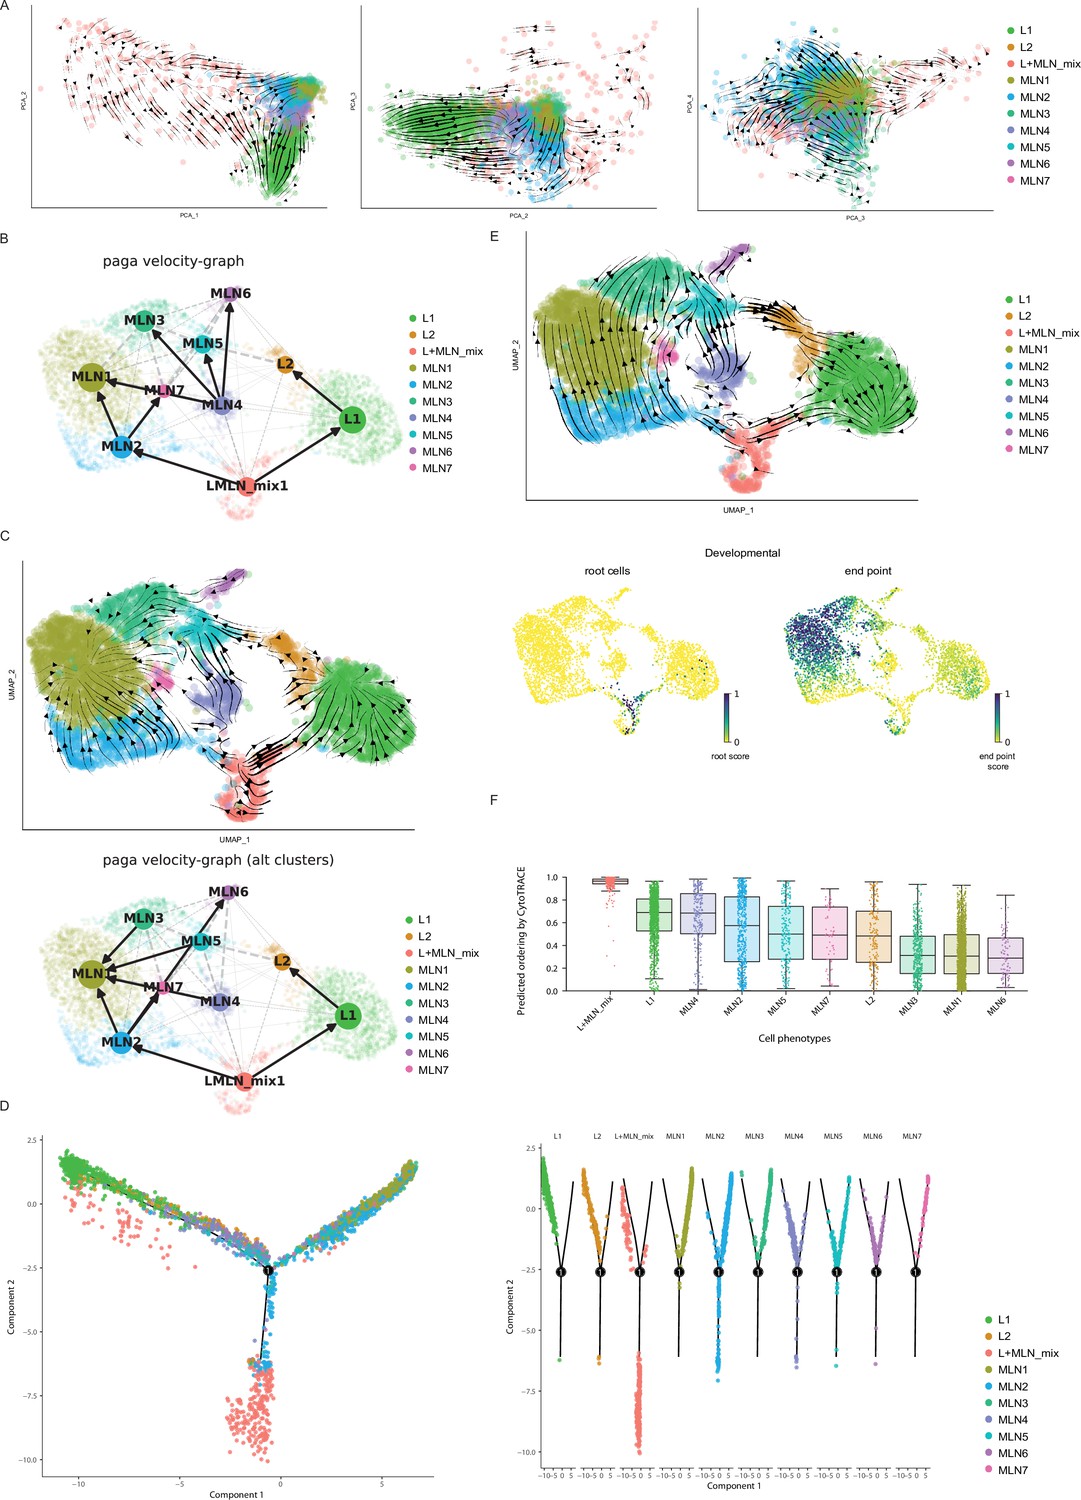
Prediction of developmental paths for Th2 cells of mesenteric lymph node (MLN) and lung after Nippostrongylus brasiliensis (Nb) infection.
(A) RNA velocity indicated as arrows on top of PCA scatter plots. (B) Paga velocity graph highlighting potential developmental directions based on the dynamic RNA velocity model. (C) RNA velocity graph and paga velocity graph based on the stochastic RNA velocity model. (D) Monocle analyzes ordering cells based on their progress in a developmental process with branching points highlighting differentiation decisions. (E) Cell cycle was regressed out before RNA velocity analyzes was performed. Inferred developmental directions, root cells, and endpoints are shown (F).
Figure 3 with 1 supplement
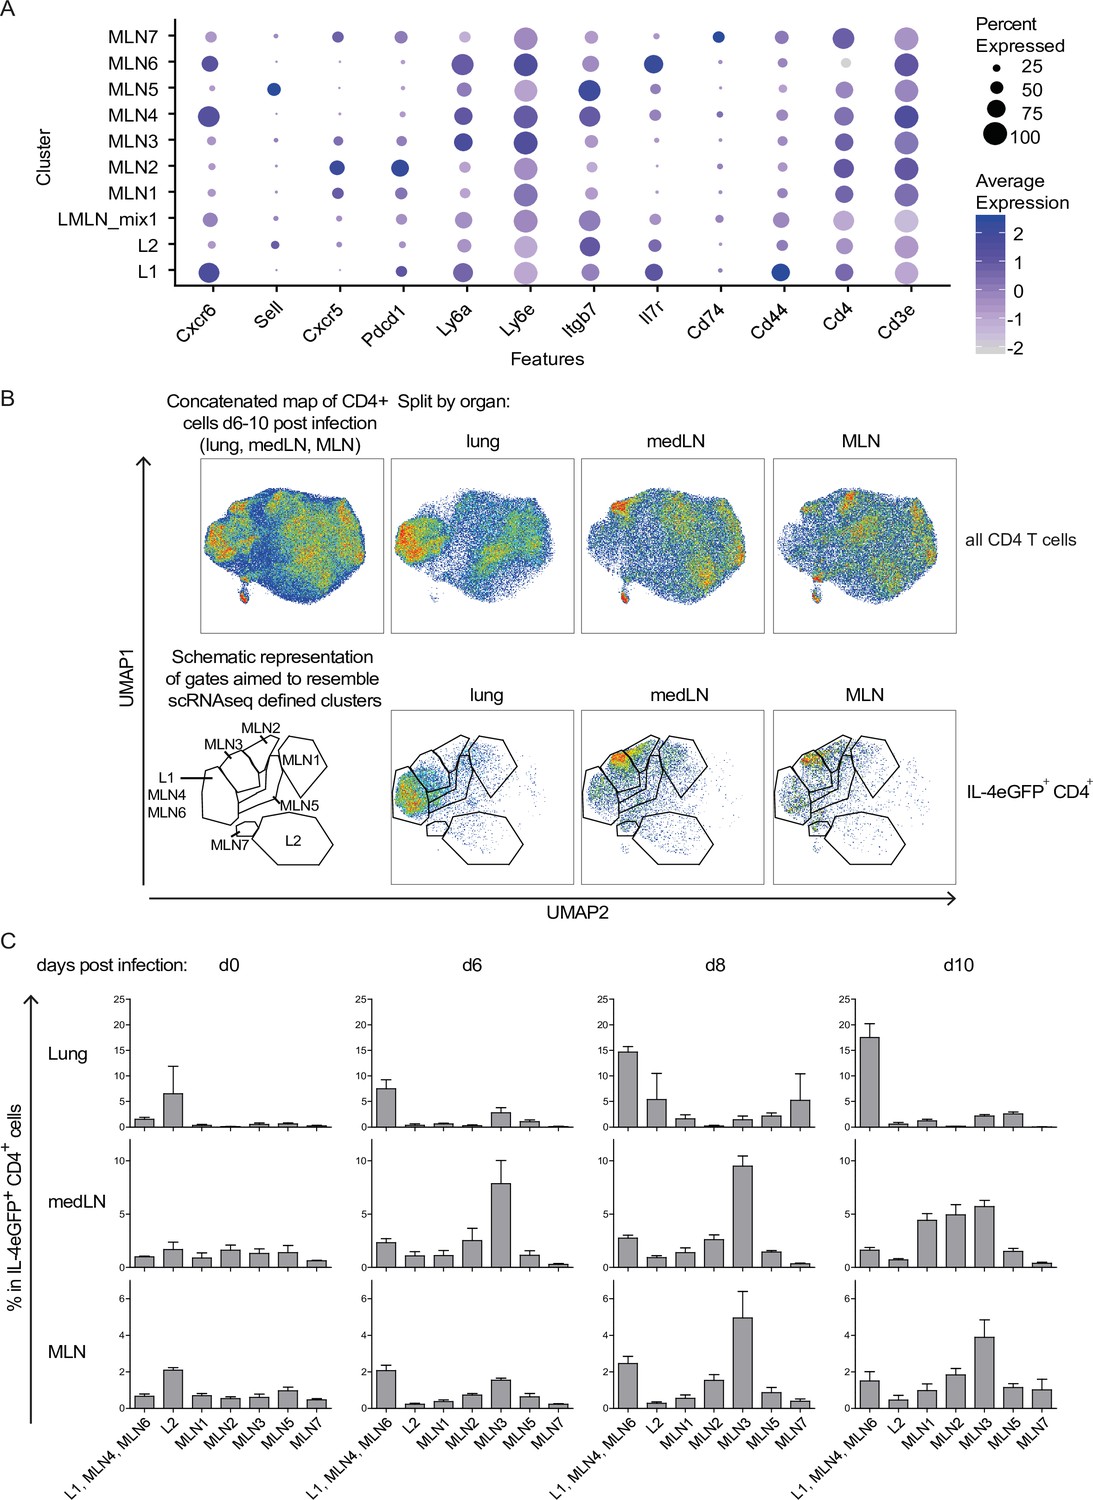
Th2 subset distribution in Nippostrongylus brasiliensis (Nb) infection time course.
CD4-expressing cells from lung, medLN, and mesenteric lymph node (MLN) of IL-4eGFP reporter (4get) mice were stained for markers defined by single-cell sequencing at indicated days after Nb infection. (A) Selection of transcriptionally defined marker genes encoding for surface receptors. (B) Surface staining for selected markers on protein level was performed followed by flow cytometric analysis. CD4+ cells were computationally selected, down sampled and a UMAP of the data was generated. Shown are CD4 T cells of all organs after infection (days 6, 8, and 10 post Nb infection) concatenated into one UMAP and splitted by organ (upper row). The same is given for IL-4eGFP+CD4+ cells (lower row). Gates are aimed to resemble transcriptionally defined cluster on protein level. (C) Quantified distribution of IL-4eGFP+CD4+ cells in UMAP gates over the course of Nb infection. For (B, C), n = 3 mice per time point; error bars represent standard error (SE).
Figure 3—figure supplement 1
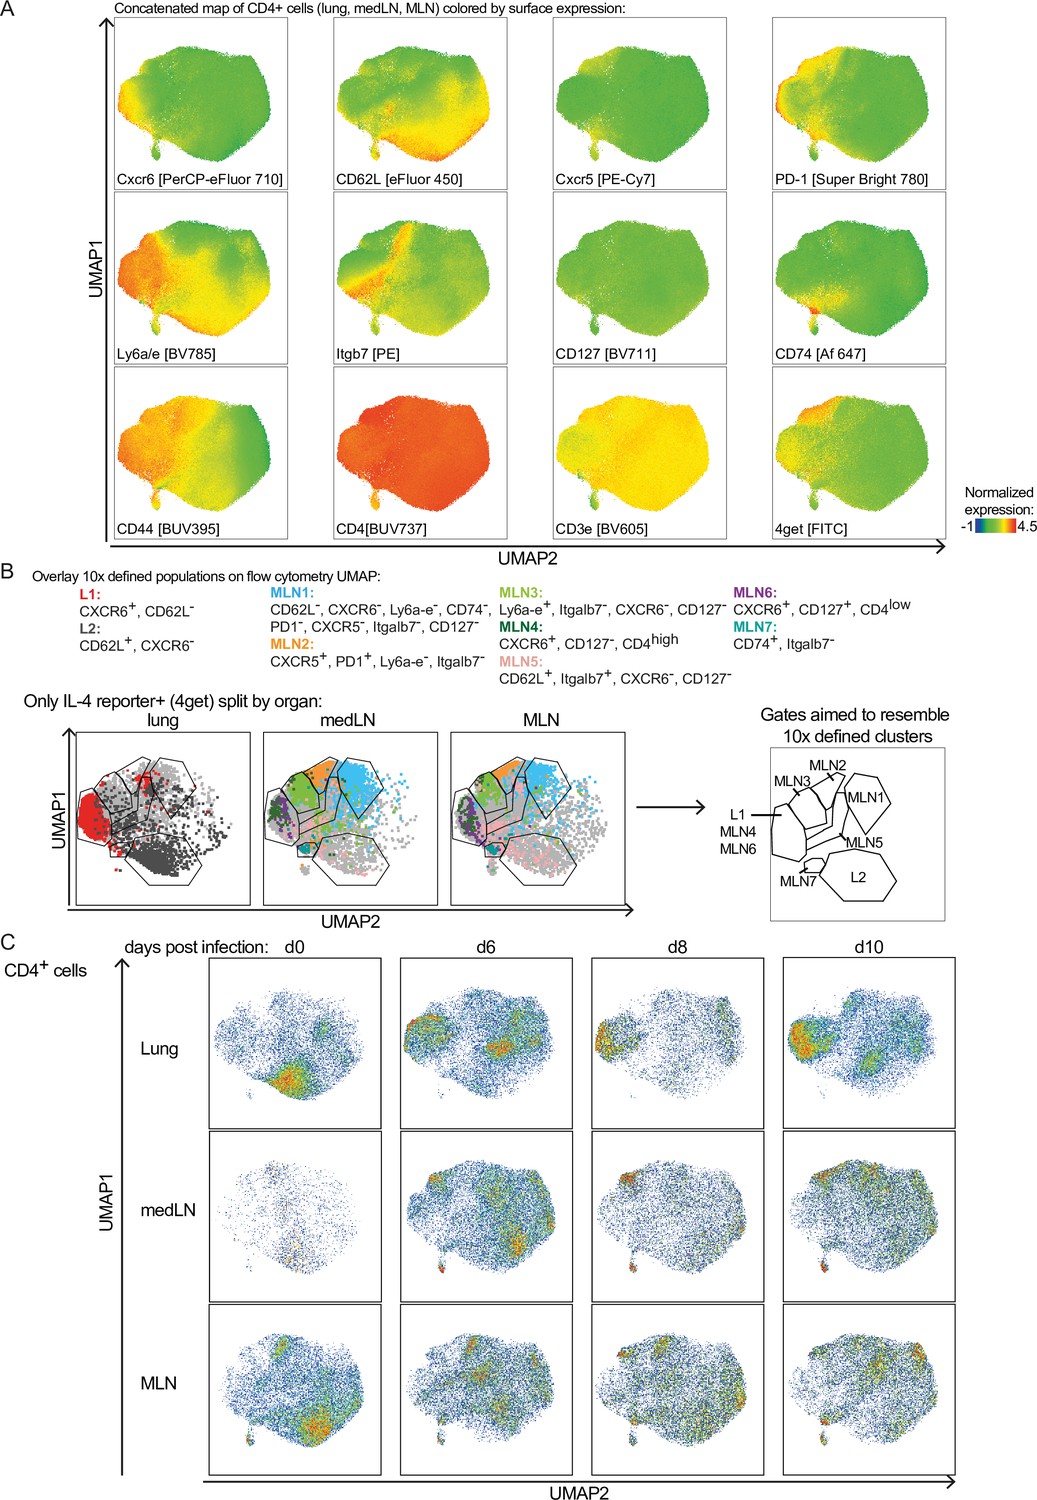
Surface receptor stain aimed to resemble transcriptionally defined clusters on protein level.
CD4+ T cells of medLN, mesenteric lymph node (MLN), and lung from 4get mice were flow cytometrically analyzed at day 10 of Nippostrongylus brasiliensis (Nb) infection. (A) Expression pattern of stained markers on UMAP of CD4+ T cells. (B) Marker used to define cluster that resemble transcriptionally defined cluster on protein level for surface staining of cells. Cells gated by these markers are highlighted on the UMAP and are used as a template to draw gates representing different cluster. (C) CD4+ cells shown on UMAP in pseudocolor plots representing cell density. The plot is splitted by organ and time point post Nb infection.
Figure 4
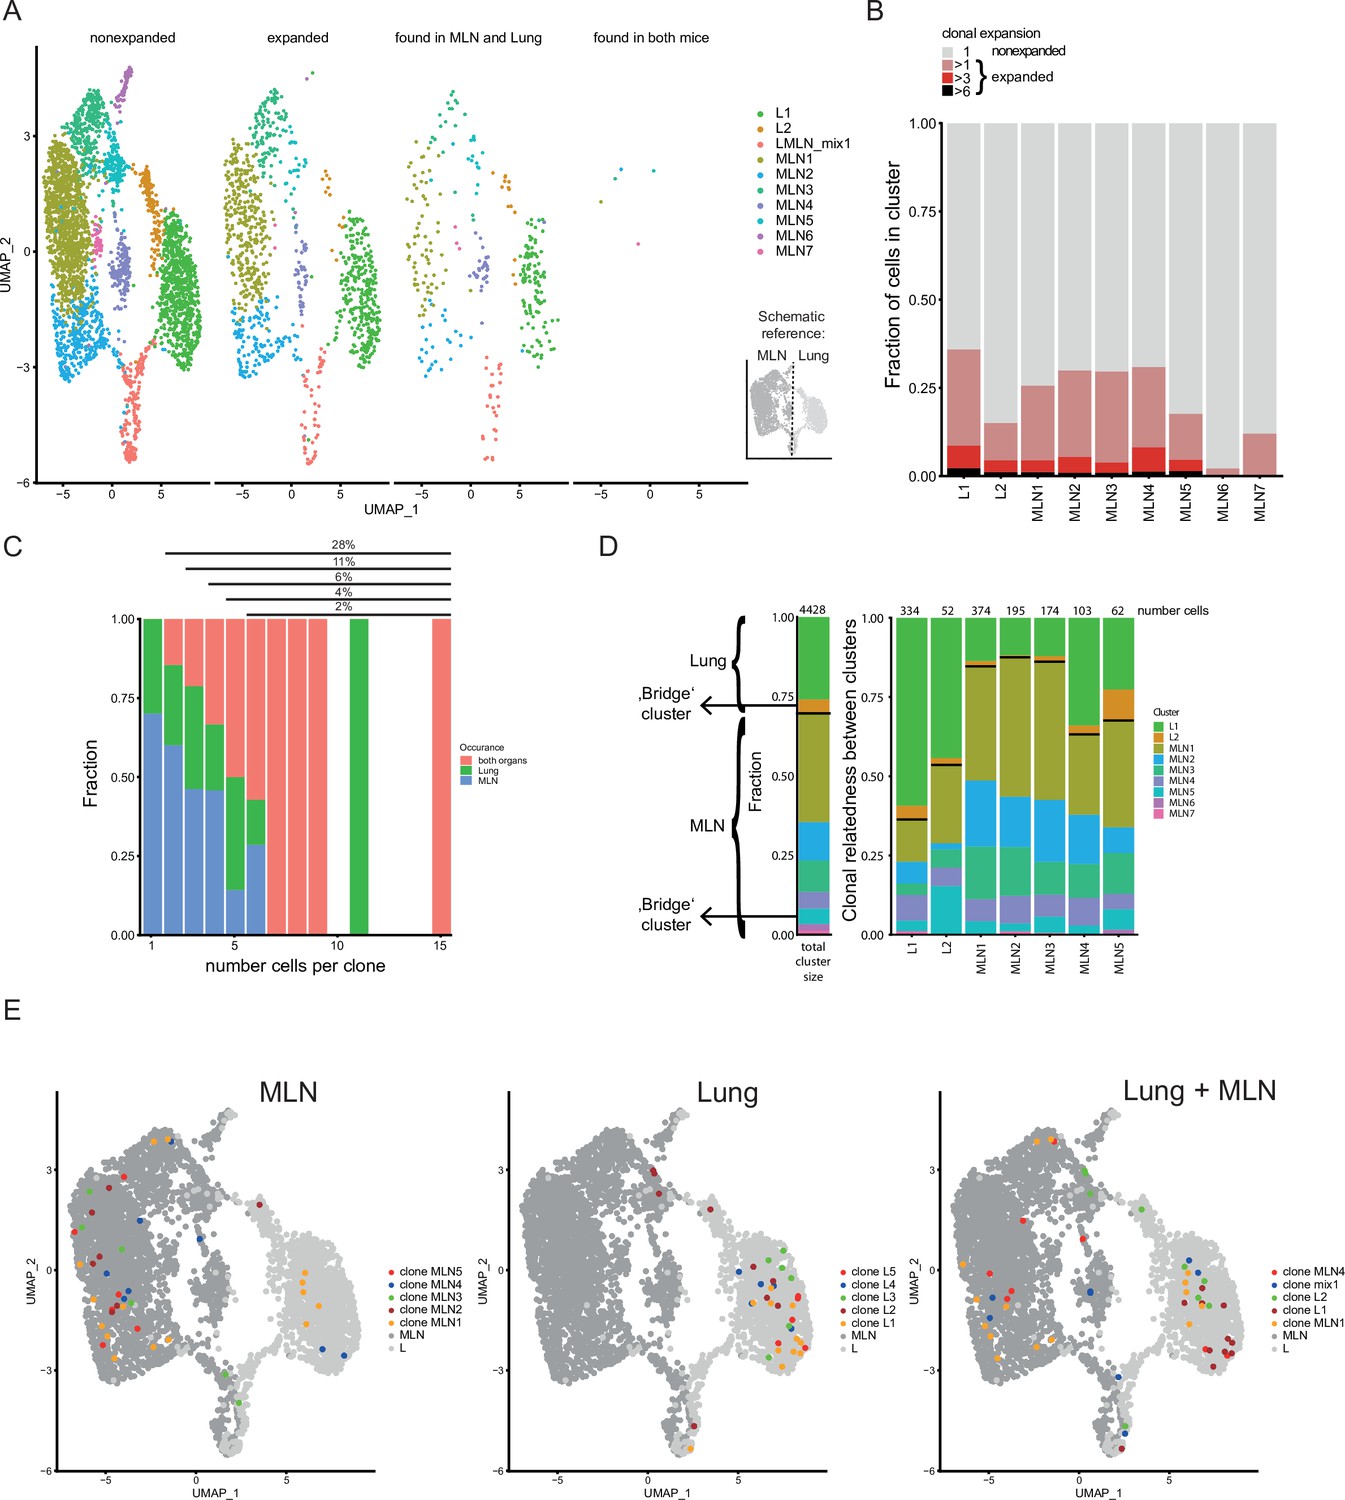
Clonal relatedness of Th2 cells in mesenteric lymph node (MLN) and lung.
(A) UMAP of MLN and lung cells split by cells with unique T-cell receptors (TCRs) (nonexpanded), cells with the same TCRs found in more than one cell (expanded), cells with the same TCRs found in both organs and cells with the same TCRs found in both mice. Cells are colored by cluster. Schematic drawing roughly highlights how MLN and lung cells are separated on UMAP. (B) Stacked bar plot on the presence of expanded clones per cluster. Expansion level relates to overall presence in the dataset. (C) Fraction of cells in MLN, lung, and both organs in relation to clone expansion. Numbers above indicate proportion of expanded cells in total population. (D) Clonal relatedness between clusters. The stacked bar to the left gives the fraction of each cluster in the dataset as a reference (proliferating cluster was excluded). Stacked bar graphs to the right visualize for every expanded clone of a cluster where other members of a clone are found (cluster distribution). Numbers above bars represent the number of cells that each bar represents. Bars for clusters with only few expanded clones are not shown. Black horizontal lines separate the MLN and lung clusters in the bar graphs. Cluster of cells with a migratory signature is highlighted as ‘bridge cluster’. (E) Top 5 expanded clones by occurrence in MLN (left), lung (center), or in total dataset (right).
Figure 5 with 2 supplements
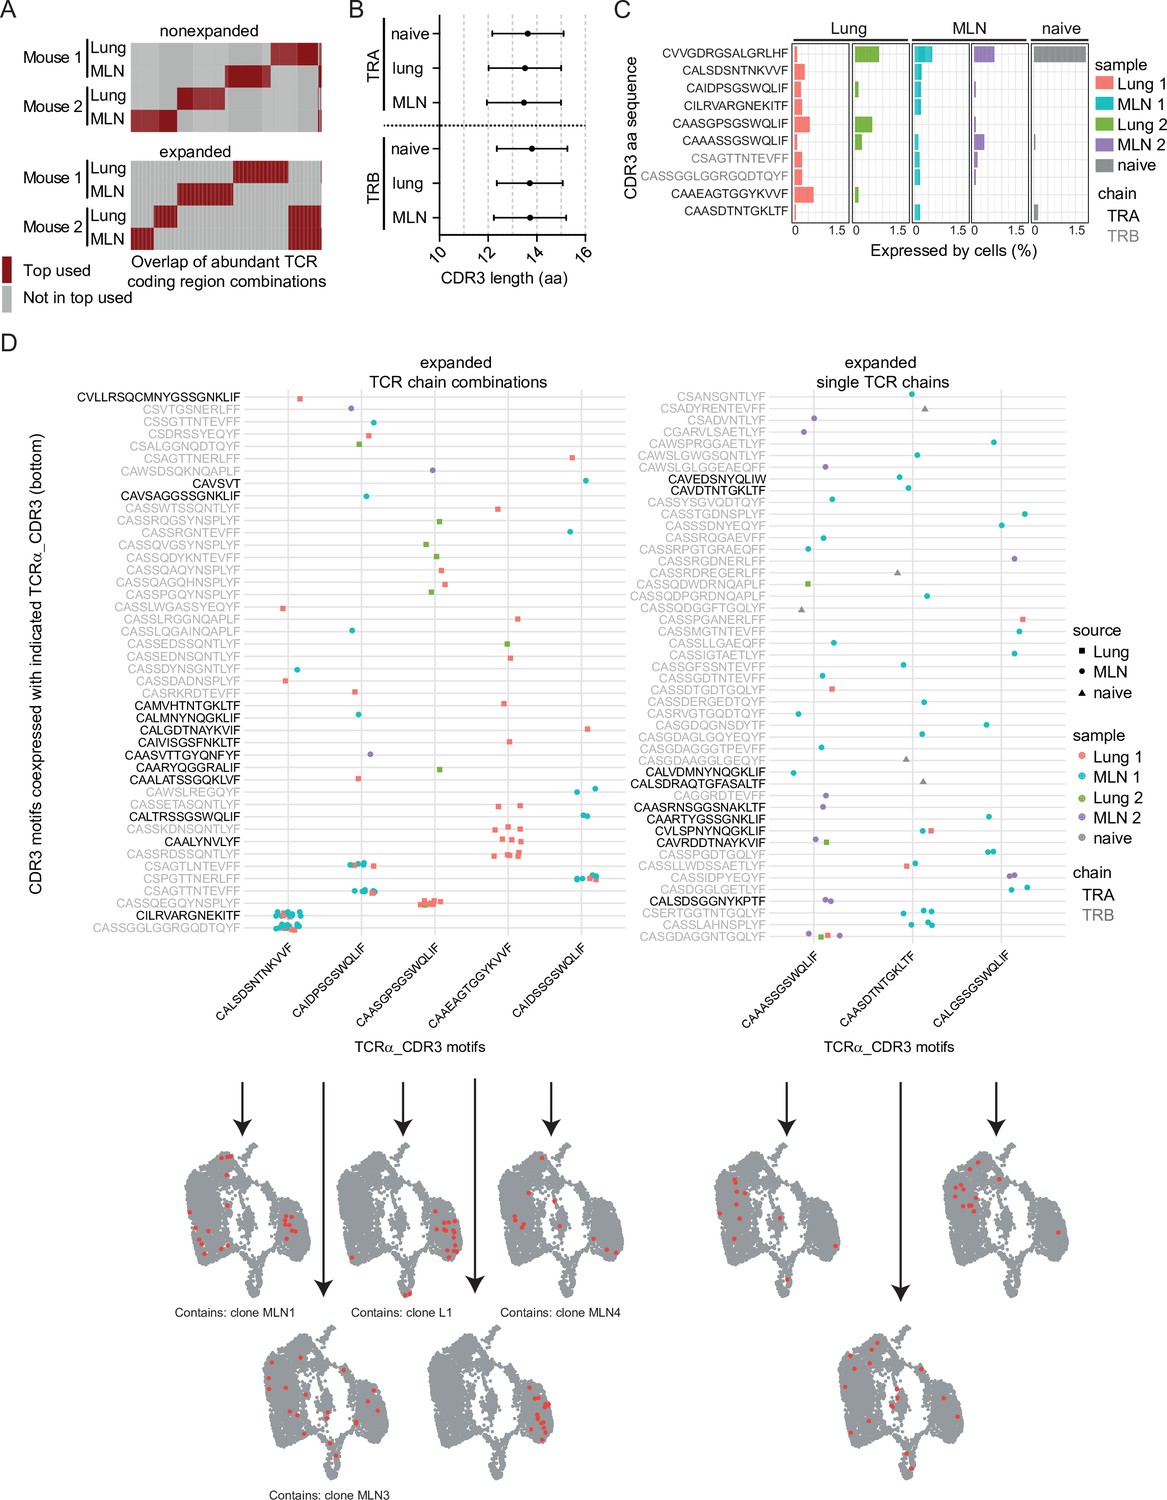
Expanded CDR3 motifs in Th2 cells of Nippostrongylus brasiliensis (Nb)-infected mice.
T-cell receptor (TCR) repertoire analysis of mesenteric lymph node (MLN) and lung Th2 cells at day 10 post Nb infection. (A) TCR segment combination analysis for overlap of the hundred most commonly used TCR segment combinations (V, J, and C region for TCRα; V, D, J, and C region for TCRβ) between different mice and organs. Analysis is performed separately for nonexpanded and expanded clones. (B) Amino acid sequence length of TCRα and TCRβ CDR3 regions. We compare CDR3 regions from peripheral blood T cells of naive wild-type C57BL/6 mice (naive) with CDR3 regions of Th2 cells from MLN and lung of Nb-infected mice. (C) Most abundant CDR3 amino acid sequences in cells of dataset presented as percent of each sample. (D) Combinations of TCRα-related CDR3 motifs (x-axis) with indicated CDR3 motifs of TCRβ or a second TCRα chain (y-axis) that occurred more than once were counted. Then TCRα chains were ranked by abundance in these combinations (left). We also present highly expanded TCRα_CDR3 sequences found in combination with various TCRβ or TCRα chains (right). At the bottom, cells that express the corresponding CDR3 sequences from the x-axis are highlighted on top of UMAP representation of the dataset. We also indicate if a CDR3 sequence is associated with the top expanded clones (Figure 4E) below UMAP plots.
-
Figure 5—source data 1
R script for analyzes of expanded CDR3 motifs from TCR single cell sequencing data.
- https://cdn.elifesciences.org/articles/74183/elife-74183-fig5-data1-v2.txt
Figure 5—figure supplement 1
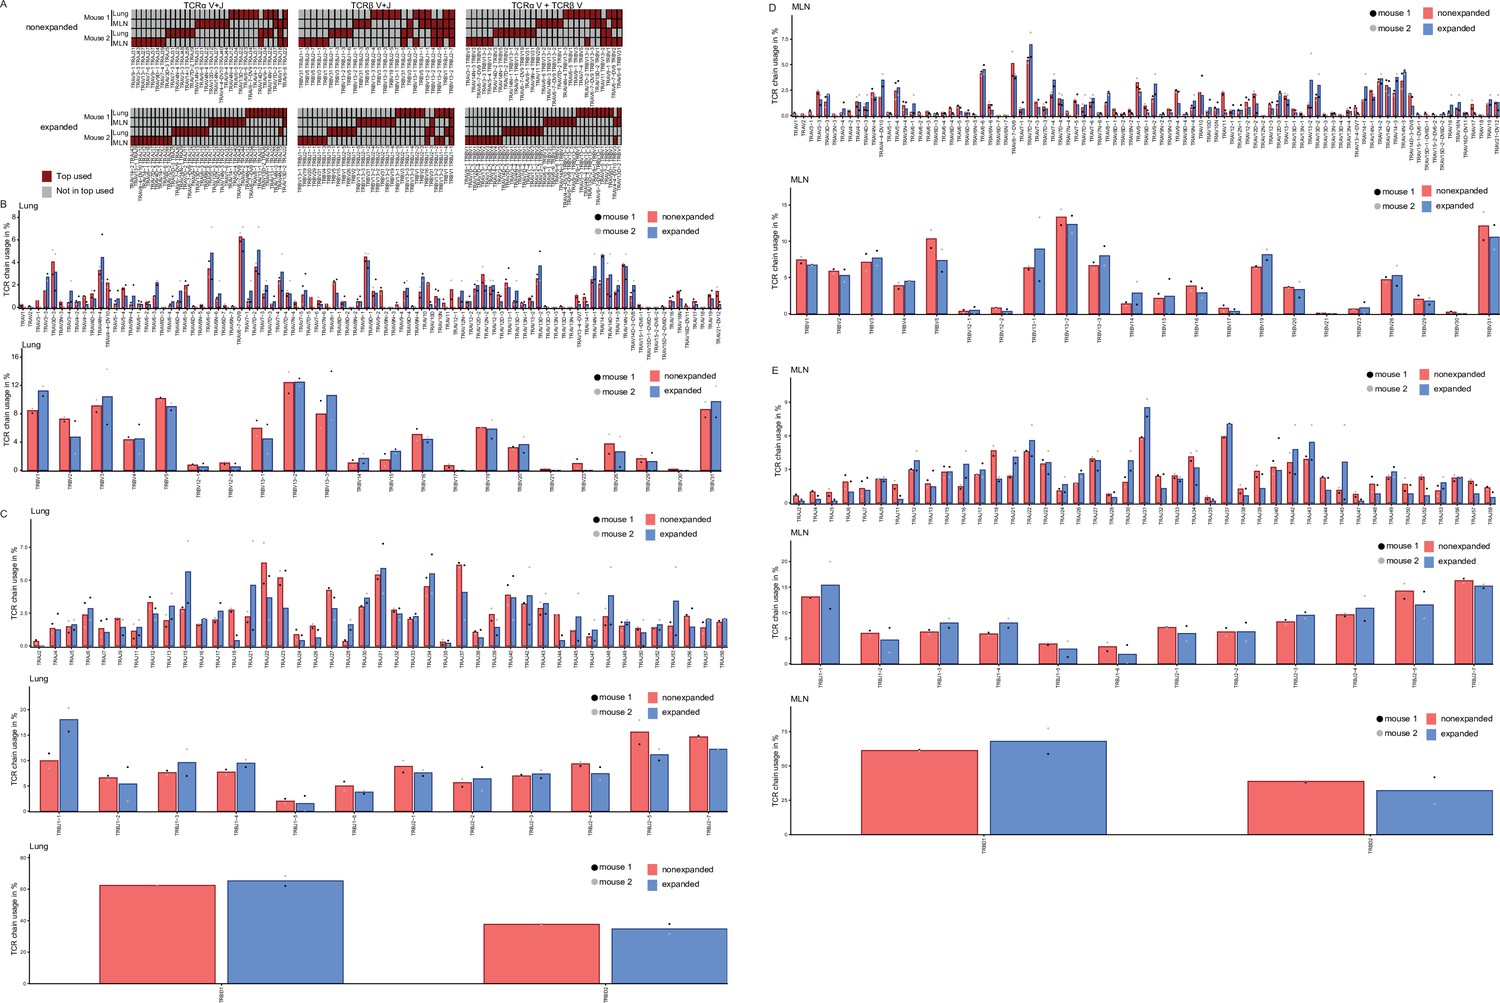
T-cell receptor (TCR) repertoire analysis of mesenteric lymph node (MLN) and lung Th2 cells at day 10 post Nippostrongylus brasiliensis (Nb) infection.
(A) Overlap of functional TCRs that use the same combination of TCRα V + J segments (left), TCRβ V + J segments (center), or TCRα V + TCRβ V segments (right) among the 10 top used combinations for each sample. This was determined separately for expanded and nonexpanded clones. One cell of each clone was considered to avoid expansion bias. Changes in variable regions were not further taken into account for overlap determination. (B) Usage of different TCRα variable or TCRβ variable segments in lung Th2 cells. (C) Usage of different TCRα joining, TCRβ joining, and diversity segments in lung Th2 cells. (D) and (E) as (B) and (C) but for MLN.
Figure 5—figure supplement 2
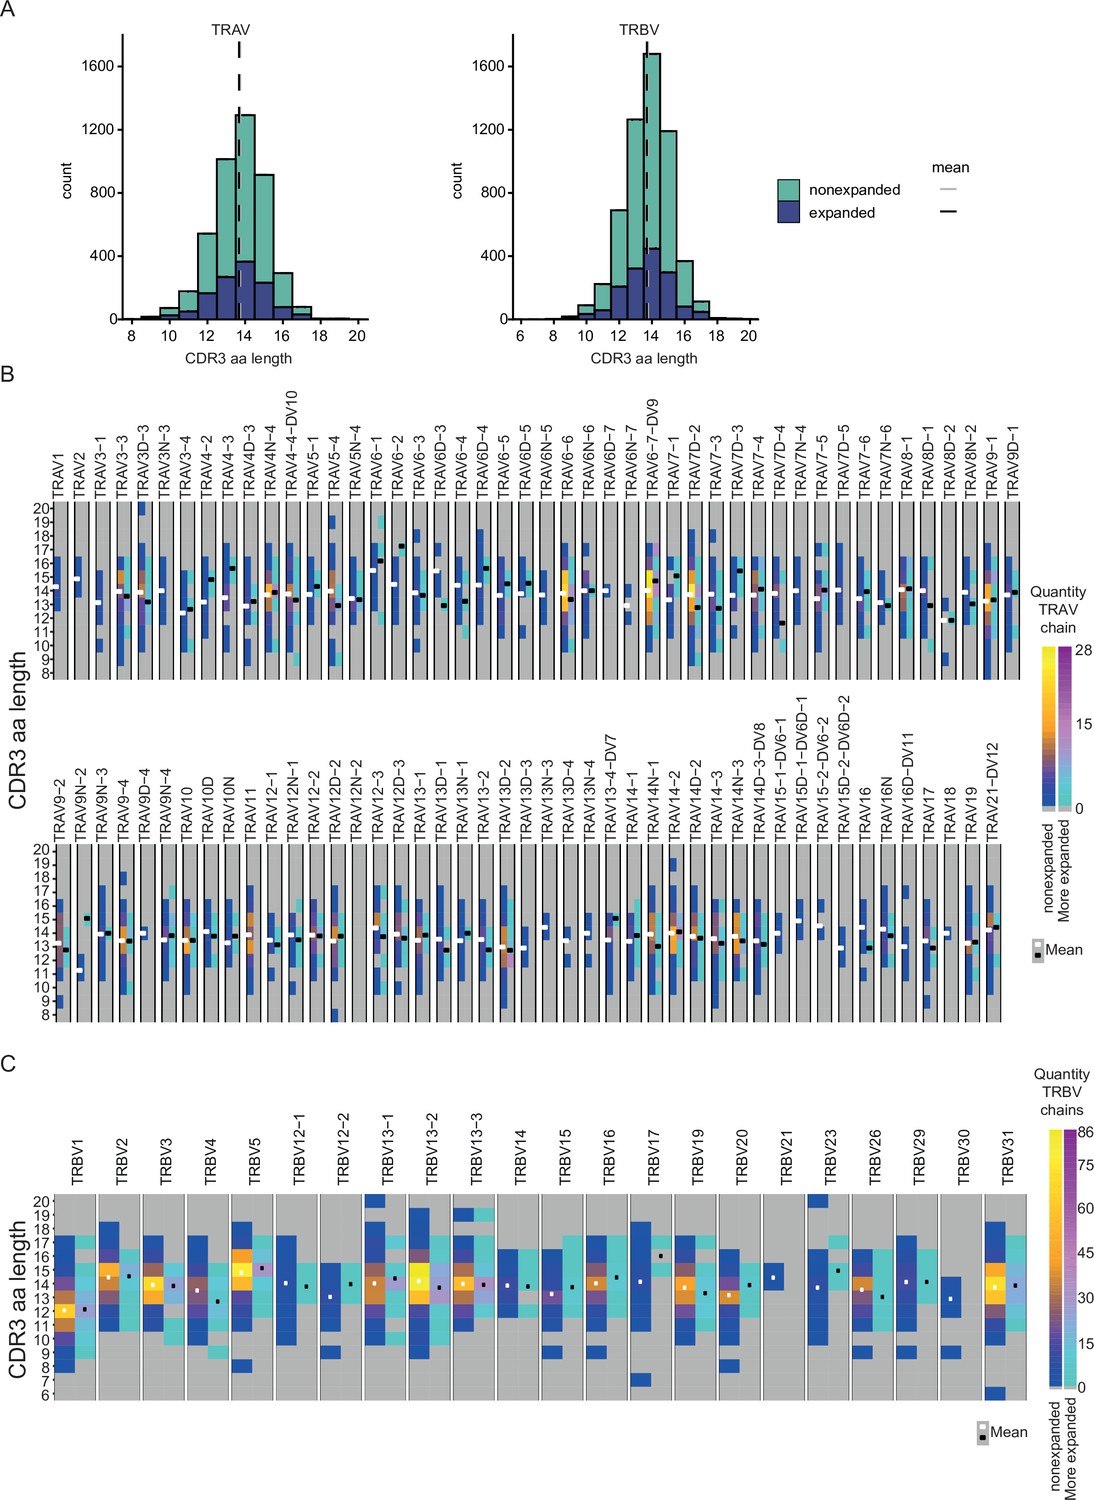
CDR3 length of Th2 TCRα and TCRβ chains 10 days post Nippostrongylus brasiliensis (Nb) infection.
(A) TCRα and TCRβ CDR3 amino acid length. Data of mesenteric lymph node (MLN) and lung cells were combined. CDR3 length was determined separately for expanded and nonexpanded clones. One cell of each clone was considered to avoid expansion bias. (B) CDR3 amino acid length distribution for all used TCRα variable segments or (C) all used TCRβ variable segments.
Figure 6 with 1 supplement
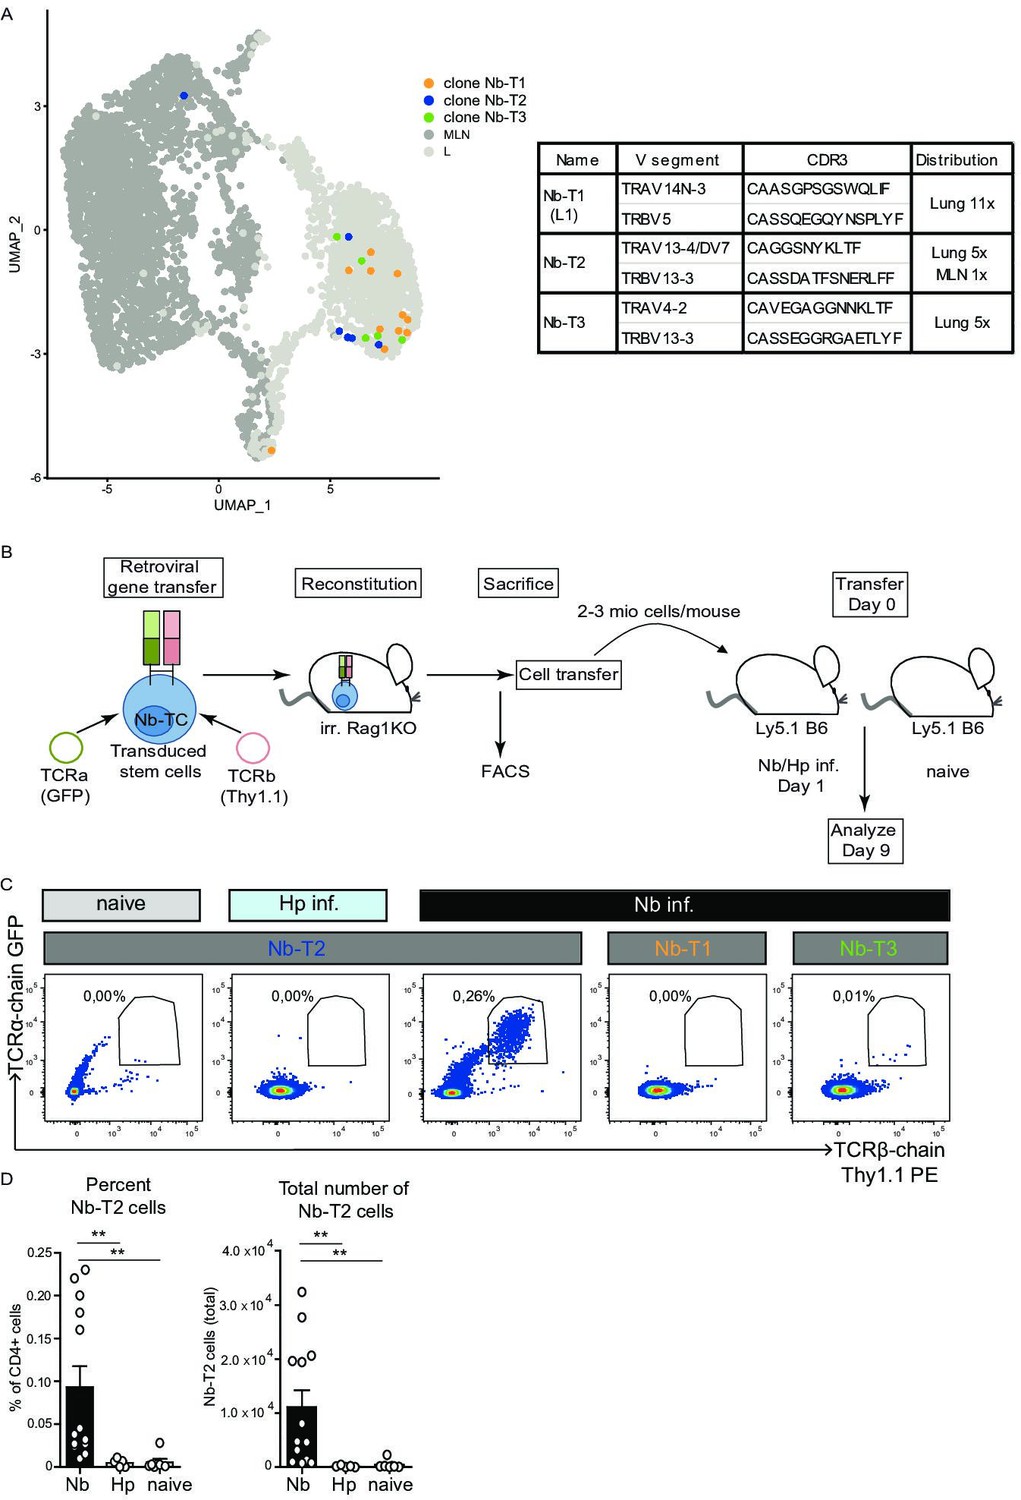
Expansion of Nb-T2 T-cell receptor (TCR) cells in mesenteric lymph node (MLN) after Nippostrongylus brasiliensis (Nb) infection.
Hematopoietic stem cells were transduced with retroviral vectors for expression of potential Nb-specific clones (Nb-T1, Nb-T2, and Nb-T3) and used to generate retrogenic mice. (A) UMAP overlay shows distribution of TCRs selected for retrogenic expression. V gene segments, CDR3 sequence, and distribution between organs for selected lung-expanded TCR clones (Nb-T1, Nb-T2, and Nb-T3). (B) Eight weeks after reconstitution of irradiated Rag1KO mice with TCR chain and fluorescent marker-encoding retrovirus containing retrogenic Rag1 stem cells, T cells were harvested, transferred to Ly5.1 B6 wild-type mice which were then infected with Nb or Heligmosomoides polygyrus (Hp) as control. (C) Plots show the percentage of TCR transgenic cells (GFP+, Thy1.1+) among live CD4+ cells from constructs Nb-T1, Nb-T2, and Nb-T3 in the MLN of recipient mice at day 9 post infection. (D) Percentage and total number of Nb-T2 cells in MLN. Quantification is based on six independent experiments. Statistical significance determined by Mann–Whitney U test; **p < 0.001.
Figure 6—figure supplement 1
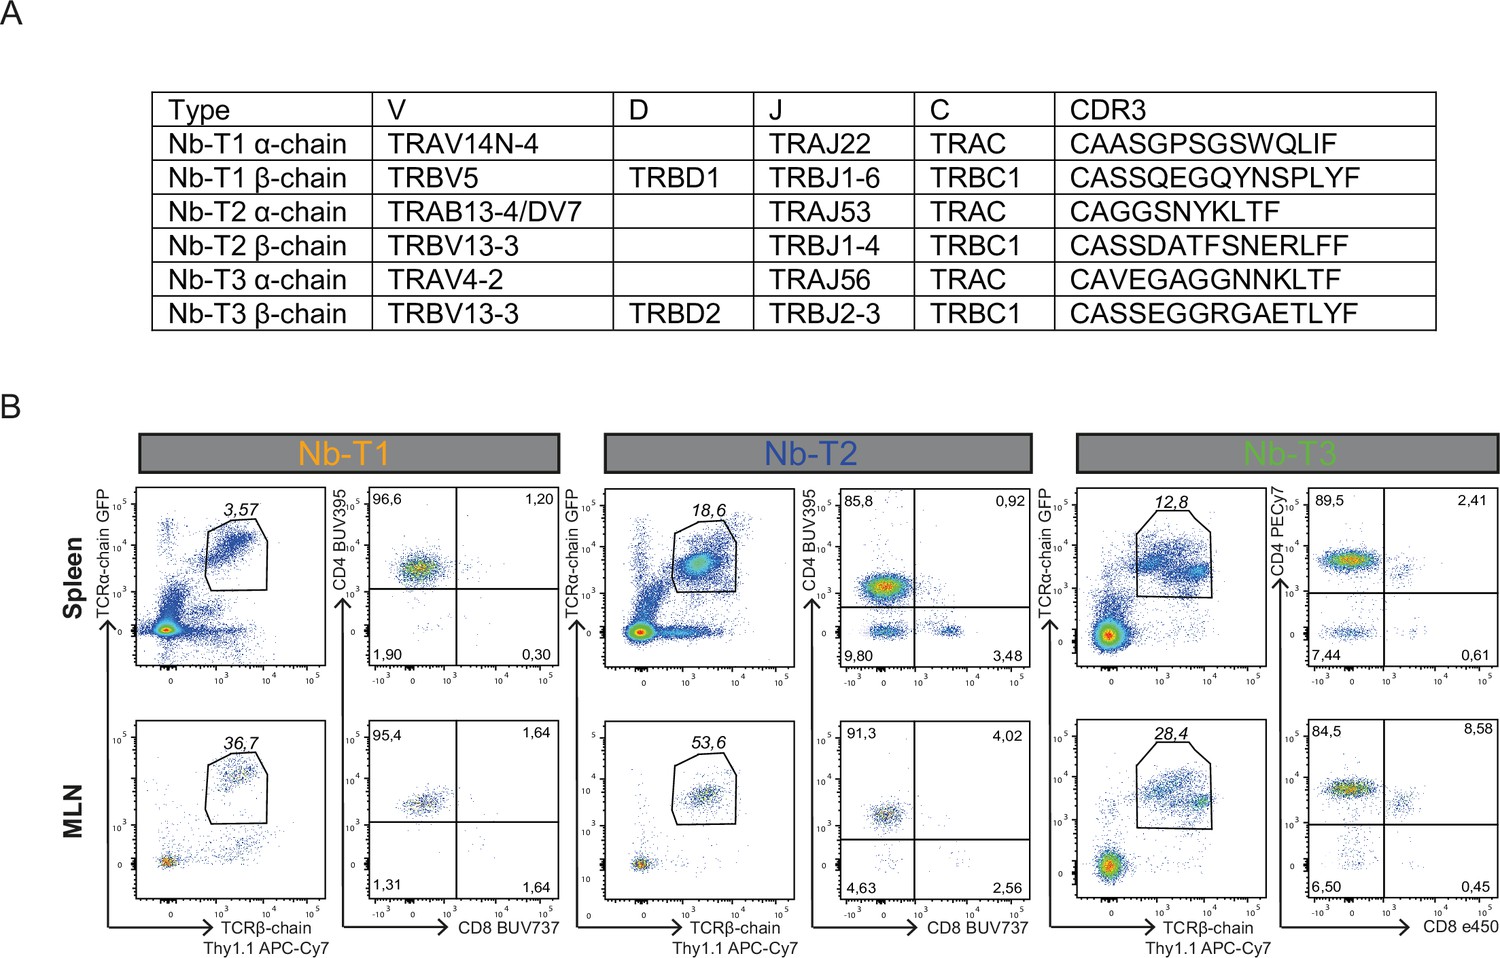
Differentiation into CD4+ T-cell receptor (TCR) transgenic cells.
(A) Composition of TCRα and TCRβ chains of TCRs to be overexpressed in TCR retrogenic mice. (B) Eight weeks after reconstitution of irradiated Rag1KO mice, T-cell development was evaluated by flow cytometry in spleen and mesenteric lymph node (MLN). TCR expression is inferred by expression of GFP (TCRα chain) and Thy1.1 (TCRβ chain). Pre-gating on living singlets was performed. Further gates are applied to distinguish between CD4 and CD8 expressing cells. Representative plots are shown.
Tables
Key resources table
| Reagent type (species) or resource | Designation | Source or reference | Identifiers | Additional information |
|---|---|---|---|---|
| Mus musculus, C57BL/6 background, female | 4get mice | Mohrs et al., 2001 | IL-4eGFP reporter mouse | |
| Antibody | anti-CD16/32, unconjugated, clone 2.4G2, Rat Monoclonal Antibody | BioXCell | (1:200) | |
| Antibody | anti-CD4, PerCP/Cyanine5.5, clone RM4-5, Rat Monoclonal Antibody | Invitrogen | 45-0042-82 | (1:200) |
| Antibody | anti-CD4, BUV737, clone RM4-5, Rat Monoclonal Antibody | BD | Cat#: 612844 | (1:100) |
| Antibody | anti-CXCR6 PerCP-eFluor 710, clone DANID2, Rat Monoclonal Antibody | Invitrogen | Cat#: 46-9186-82 | (1:100) |
| Antibody | anti-CD62L, eFluor 450, clone MEL-14, Rat Monoclonal Antibody | Invitrogen | Cat#: 48-0621-82 | (1:200) |
| Antibody | anti-CD127, BV711, clone SB/199, Rat Monoclonal Antibody | BD | Cat#: 565490 | (1:100) |
| Antibody | anti-Ly-6A/E (Sca-1), BV785, clone D7, Rat Monoclonal Antibody | BioLegend | Cat#: 108139 | (1:100) |
| Antibody | anti-CD3e, BV605, clone 145-2 C11, Armenian Hamster Monoclonal Antibody | BD | Cat#: 563004 | (1:100) |
| Antibody | anti-CD279 (PD-1), Super Bright 780, clone J43, Armenian Hamster Monoclonal Antibody | Invitrogen | Cat#: 78-9985-82 | (1:400) |
| Antibody | anti-CD74, Alexa Fluor 647, clone In1/CD74, Rat Monoclonal Antibody | BioLegend | Cat#: 151004 | (1:100) |
| Antibody | anti-CD44, BUV395, clone IM7, Rat Monoclonal Antibody | BD | Cat#: 740215 | (1:100) |
| Antibody | anti-CD185 (CXCR5), PE/Cyanine7, clone L138D7, Rat Monoclonal Antibody | BioLegend | Cat#: 145516 | (1:100) |
| Antibody | anti-integrin β7, PE, clone FIB27, Rat Monoclonal Antibody | BioLegend | Cat#: 121006 | (1:100) |
| Antibody | TotalSeq-C0301 is a mix of anti-mouse MHC class I and anti-mouse Ly-5 antibodies, clone M1/42 and 30-F11, Rat Monoclonal Antibodies; Hashtag 1 Antibody; Barcode Sequence ACCCACCAGTAAGAC; mouse 1 med LN | BioLegend | Cat#: 155861 | (3 μl for 6 × 10⁶ cells) |
| Antibody | TotalSeq-C0302 is a mix of anti-mouse MHC class I and anti-mouse Ly-5 antibodies, clone M1/42 and 30-F11, Rat Monoclonal Antibodies; Hashtag 2 Antibody; Barcode Sequence GGTCGAGAGCATTCA; mouse 2 med LN | BioLegend | Cat#: 155863 | (3 μl for 6 × 10⁶ cells) |
| Antibody | TotalSeq-C0303 is a mix of anti-mouse MHC class I and anti-mouse Ly-5 antibodies, clone M1/42 and 30-F11, Rat Monoclonal Antibodies; Hashtag 3 Antibody; Barcode Sequence CTTGCCGCATGTCAT; mouse 1 MLN | BioLegend | Cat#: 155865 | (3 μl for 6 × 10⁶ cells) |
| Antibody | TotalSeq-C0304 is a mix of anti-mouse MHC class I and anti-mouse Ly-5 antibodies, clone M1/42 and 30-F11, Rat Monoclonal Antibodies; Hashtag 4 Antibody; Barcode Sequence AAAGCATTCTTCACG; mouse 2 MLN | BioLegend | Cat#: 155867 | (3 μl for 6 × 10⁶ cells) |
| Other | LIVE/DEAD Fixable Lime (506) Viability Kit | Invitrogen | Cat#: L34990 | (1:1000) |
| Software, algorithm | R | R Development Core Team, 2021 | Versions 3.5.1, 4.0.0 | |
| Software, algorithm | Cell Ranger | Zheng et al., 2017 | Versions 2.1.1, 3.0.1, 6.1.2 | |
| Software, algorithm | Seurat | Stuart et al., 2019 | Versions 3.1.1, 4.1.0 | |
| Software, algorithm | kallisto/bustools | Bray et al., 2016 | Versions 0.46.2/0.40.0 | |
| Software, algorithm | scVelo | Bergen et al., 2020 | Version 0.2.3 | |
| Software, algorithm | monocle | Trapnell et al., 2014 | Version 2.16.0 | |
| Software, algorithm | CytoTRACE | Trapnell et al., 2014 | Version 0.3.3 | |
| Software, algorithm | FlowSOM | Van Gassen et al., 2015 | Version 1.20.0 | |
| Software, algorithm | CytoTree | Dai et al., 2021 | Version 1.3.0 |
Additional files
Download links
A two-part list of links to download the article, or parts of the article, in various formats.
Downloads (link to download the article as PDF)
Open citations (links to open the citations from this article in various online reference manager services)
Cite this article (links to download the citations from this article in formats compatible with various reference manager tools)
Th2 single-cell heterogeneity and clonal distribution at distant sites in helminth-infected mice
eLife 11:e74183.
https://doi.org/10.7554/eLife.74183


