Nephronectin-integrin α8 signaling is required for proper migration of periocular neural crest cells during chick corneal development
- Department of Biosciences, Rice University, United States
Figures
Figure 1 with 1 supplement
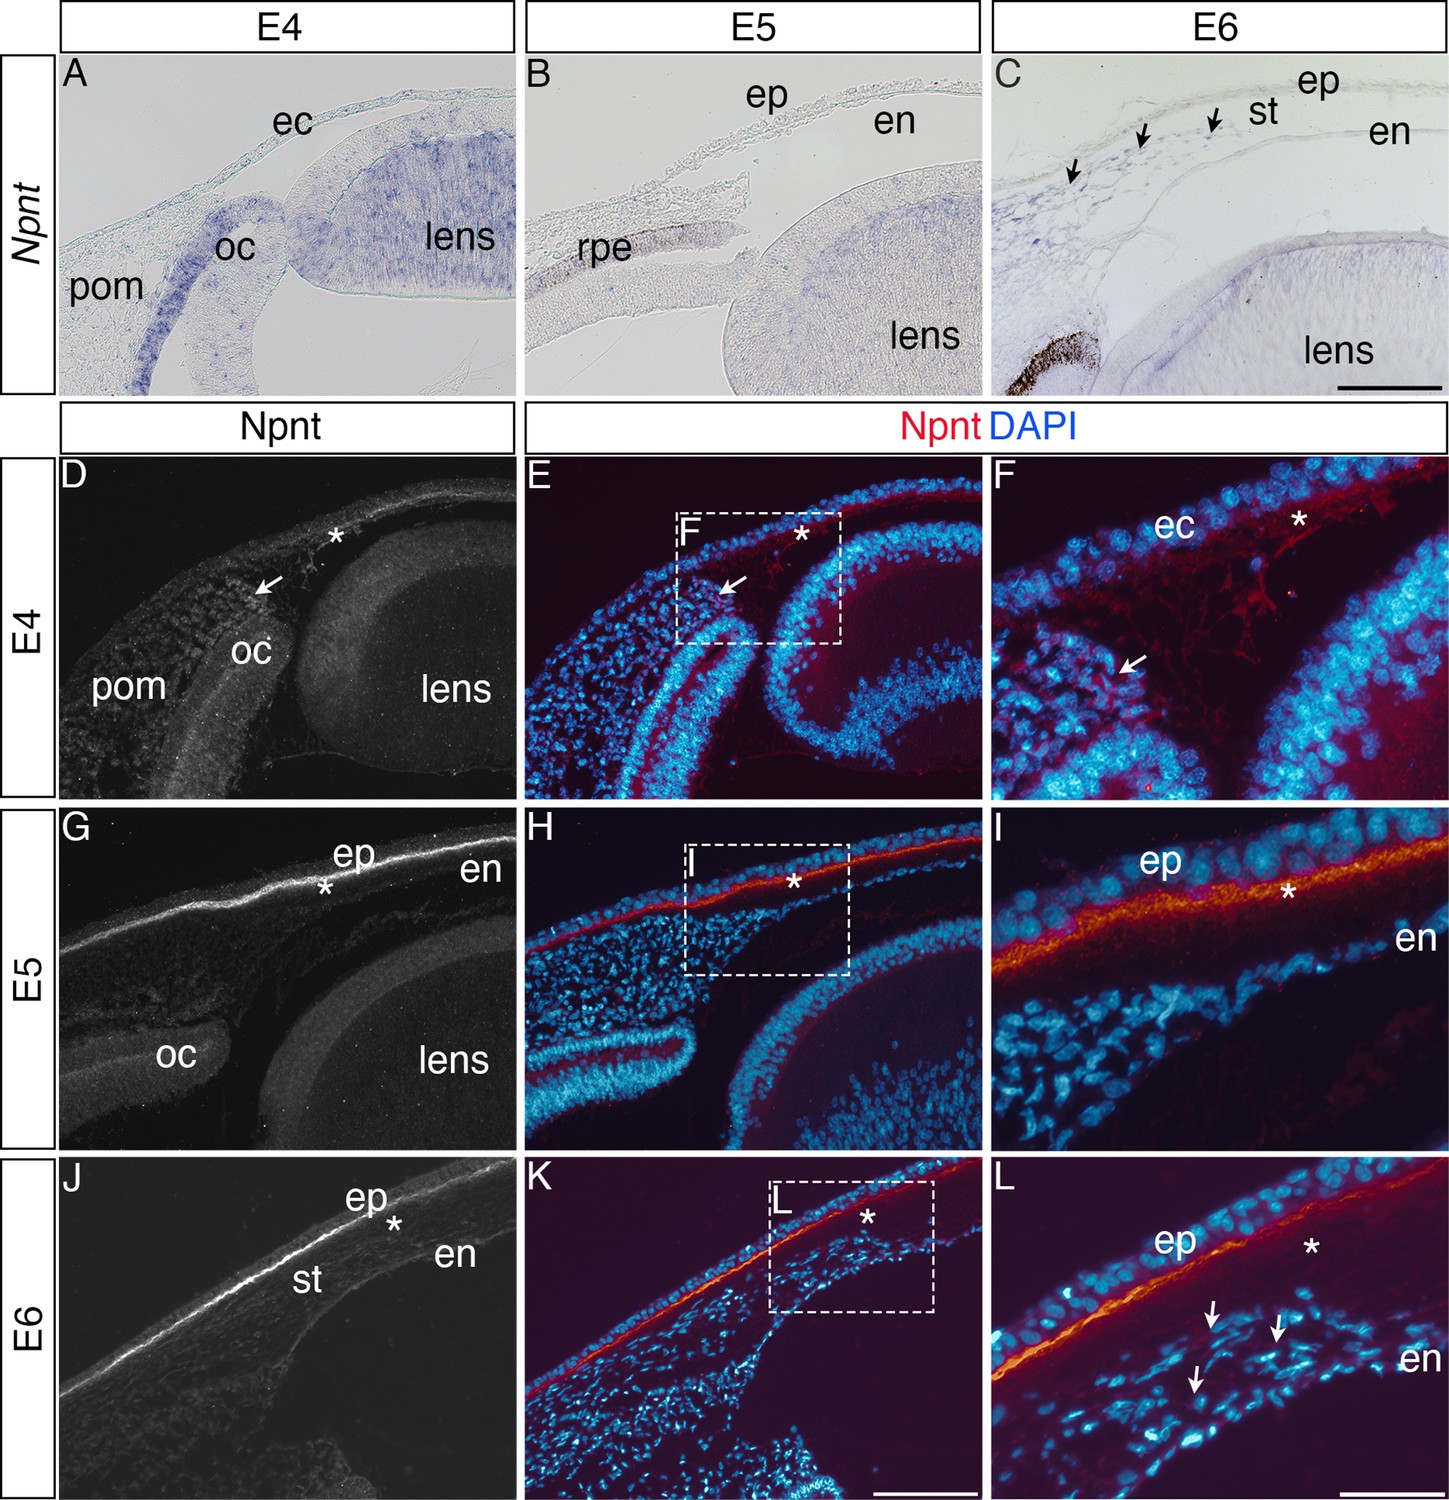
Nephronectin (Npnt) expression during early ocular development.
Expression of Npnt mRNA and protein was examined via section in situ hybridization (A–C) or immunohistochemistry (D–L). (A, B) Npnt expression in the retina pigment epithelium layer of the optic cup and region of the presumptive lens fiber cells at embryonic day (E)4 and E5. (C) Initial expression of Npnt by periocular neural crest (pNC) is observed during the second wave of migration into the stroma (black arrows). (D–F) At E4, Npnt protein was detected in the optic cup, lens epithelium, in the periocular mesenchyme proximal to the presumptive cornea region (arrow), and in the matrix of the primary stroma (asterisk). (G–I) At E5, vivid expression of Npnt protein is localized in the primary stroma adjacent to the corneal epithelium and diffusely throughout the primary stroma (asterisk), and persists at low levels in the optic cup and lens epithelium. At E6, vivid expression of Npnt protein persists in the primary stroma adjacent to the corneal epithelium and it remains diffusely expressed throughout the primary stroma (asterisk). At this time, low expression of Npnt protein is also observed in the migratory periocular neural crest cells invading the primary stroma (arrows in L). ec, ectoderm; oc, optic cup; pom, periocular mesenchyme; rpe, retinal pigment epithelium; st, stroma; en, corneal endothelium; ep, corneal epithelium. Scale bars: 100 μm.
Figure 1—figure supplement 1

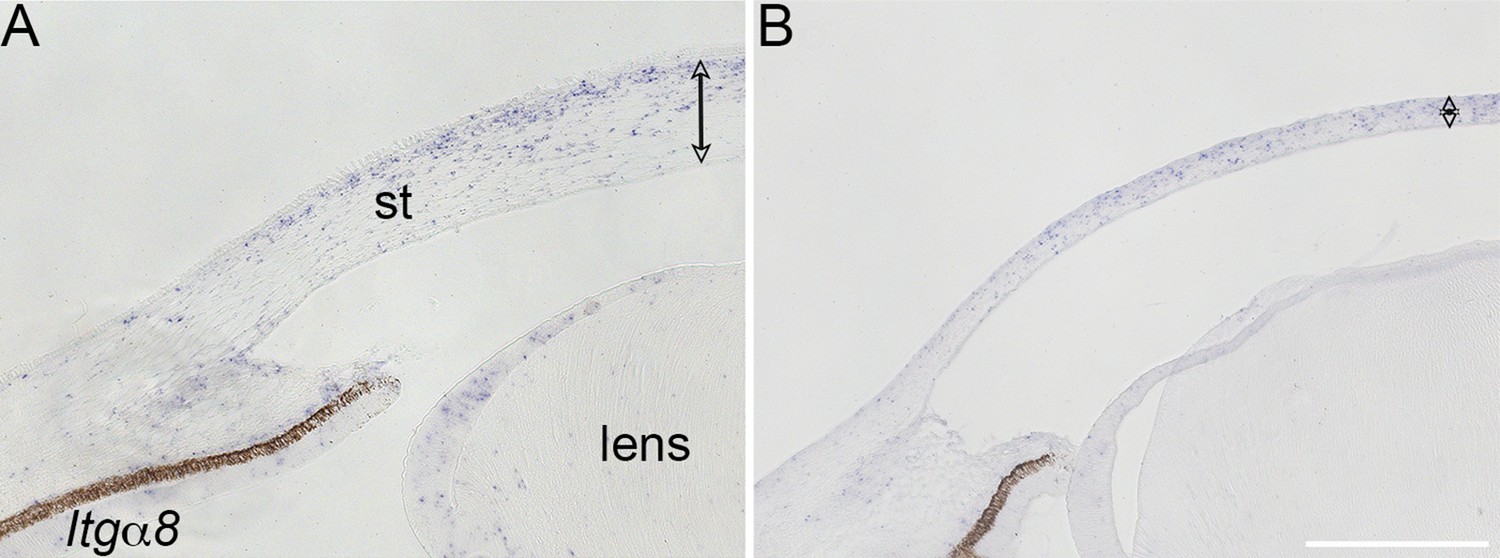
Expression of nephronectin (Npnt) transcripts and protein during late stages of development of the chick cornea.
(A–C) Section in situ hybridization showing localization of Npnt in the stroma of embryonic day (E)7, E9, and E12 corneas. (D–F) Immunohistochemistry showing that Npnt (red) is localized in the extracellular matrix (ECM) directly adjacent to the corneal epithelium at E7 and E9 (D, E, arrows), and in the corneal epithelium at E9 (F, arrows). Sections are counterstained with DAPI (blue). Scale bars represent 100 μm. ep, epithelium; st, stroma; en, corneal endothelium.
Figure 2 with 1 supplement

Corneal thickness is reduced in Npntkd corneas.
(A) Schematic of in ovo injection of viral constructs (green) to cover the anterior region of stage 8 chick embryo. Following 7 days of incubation, embryos were screened for GFP expression in the anterior eye region. Knockdown was verified by section in situ hybridization, which revealed reduced expression of Npnt in Npntkd cornea compared with control. (B–E) Hematoxylin and eosin staining showing control (B, D) and thinner Npntkd corneas (C, E). Statistical analysis on measurements taken from (N = 5 control and N = 4 Npntkd corneas) revealed (F) significant reduction in thickness of Npntkd corneas. **p<0.01. ep, corneal epithelium; st, stroma; en, corneal endothelium;. Scale bars: 100 μm (B, C), 100 μm (D, E).
Figure 2—figure supplement 1
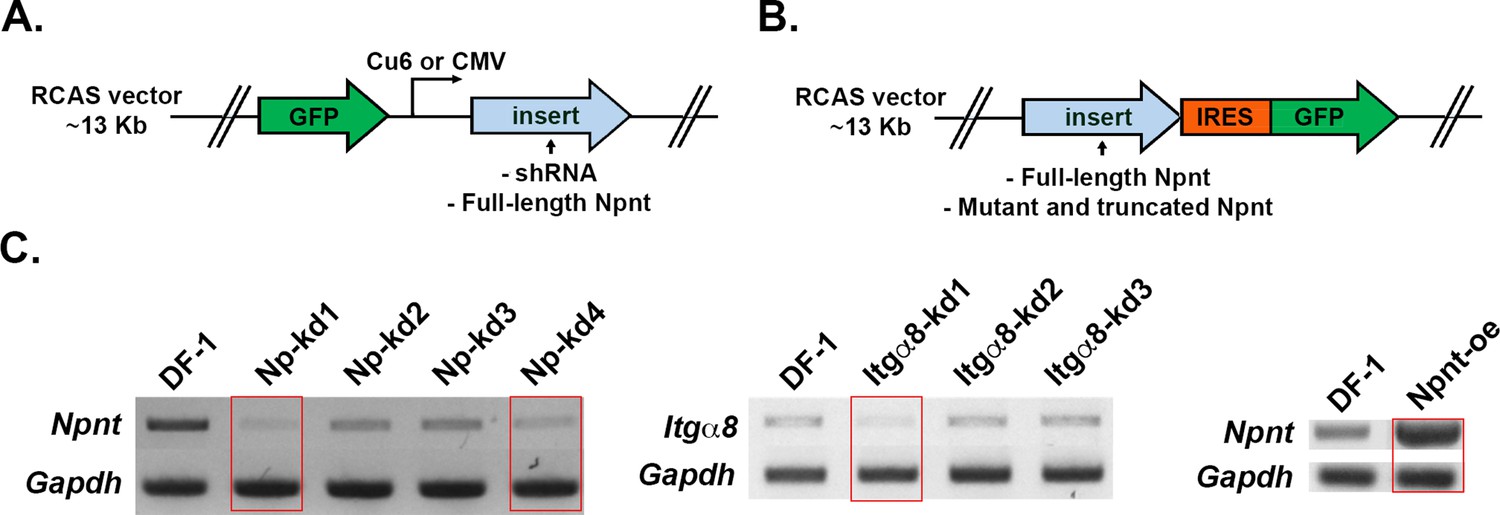
Diagram of replication-competent ASLV long terminal repeat with a splice acceptor (RCAS) vectors used for expression of either (A) GFP alone (control) or GFP together with inserts of shRNA or full-length nephronectin (Npnt).
(B) The full-length or mutated and truncated versions of Npnt driven by the viral LTR promoter and GFP driven by the IRES promoter. (C) For RT-PCR, cells plated in 30 mm dishes were homogenized in 1 mL TRIzol, and RNA was isolated following the manufacturer’s protocol. RNA samples were treated with Turbo DNA-free kit (Invitrogen) to remove residual genomic DNA, and cDNA pools were generated using SuperScript First Strand System (Invitrogen). Semi-quantitative PCR was conducted using HotStart-IT Taq polymerase (Affymetrix). Knockdown efficiency was measured on 2% agarose gel using glyceralde-hyde-3-phosphate dehydrogenase (GAPDH) as a loading control. Red rectangles indicate the constructs that were chosen for the knockdown and overexpression experiments. Primers for RT-PCR are located in Supplementary file 1.
Figure 3 with 2 supplements
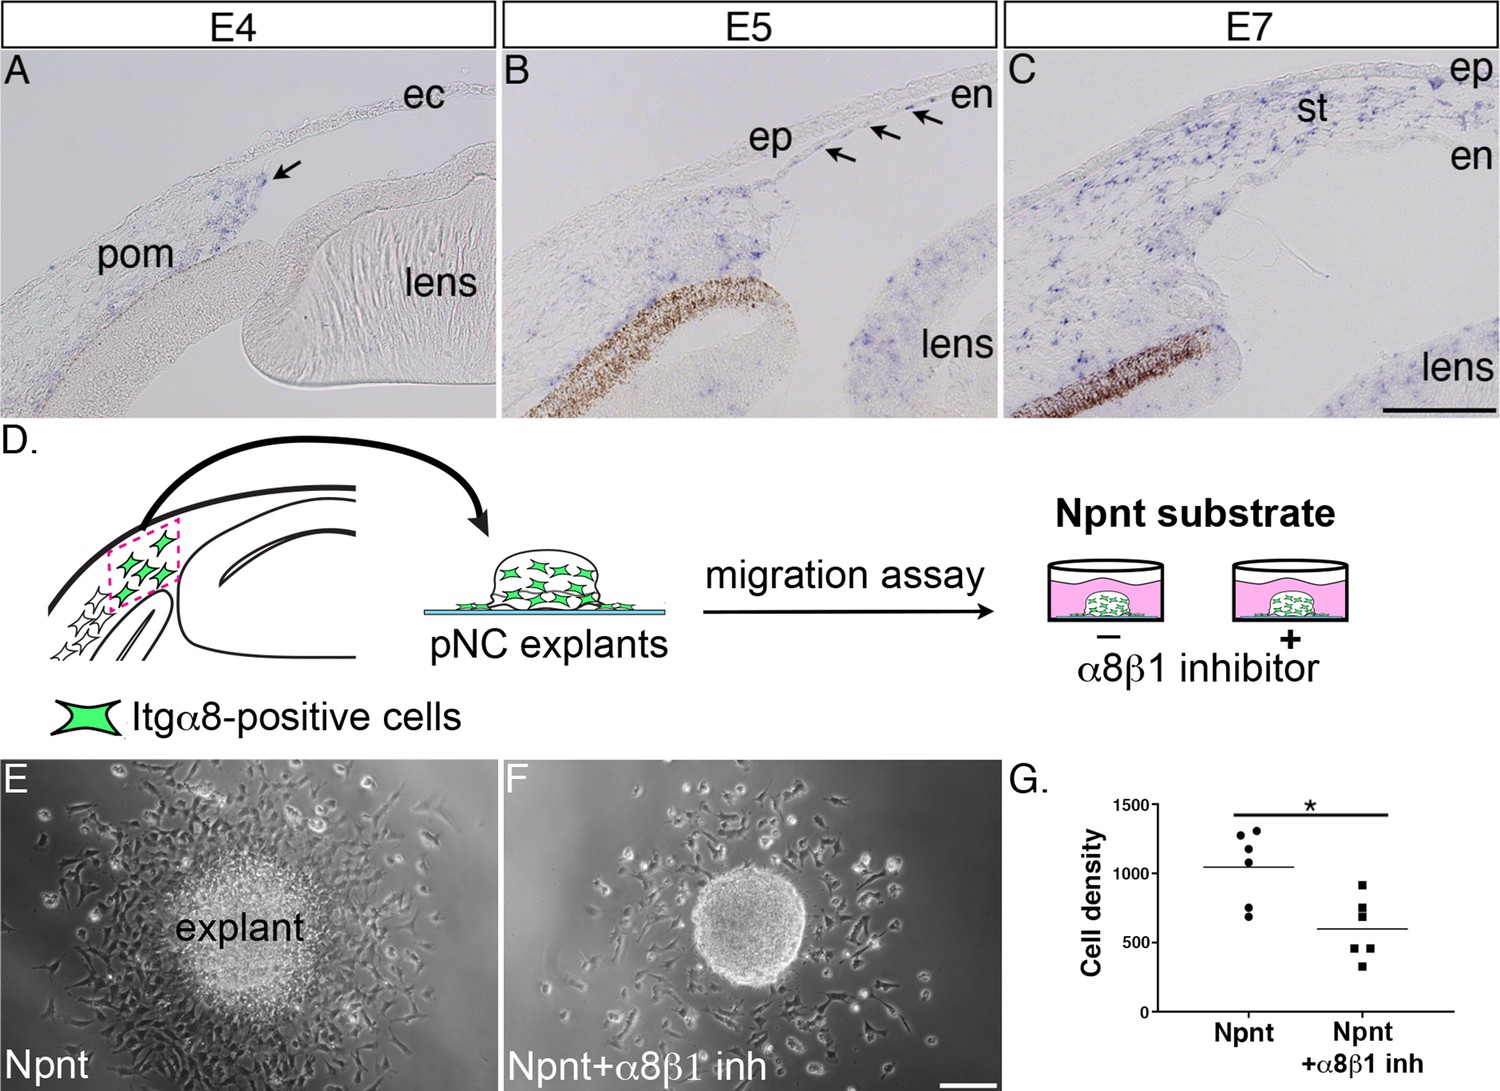
Itgα8 is expressed periocular neural crest (pNC) during cornea development and plays a role in cell migration.
(A) Expression of Itgα8 is observed in pNC prior to their migration into the cornea at embryonic day (E)4 (arrow). (B) Itgα8 is subsequently expressed in the corneal endothelium at E5 (arrows) and (C) the migratory pNC in the corneal stroma at E6. (D) Schematic showing the isolation of periocular mesenchyme used for generating pNC explants for in vitro migration on Npnt-coated substrate in the presence or absence of α8β1 inhibitor. (E) Explant cultured on Npnt substrate showing robust cell migration after 12 hr. (F) Explant cultured on Npnt substrate in the presence of α8β1 inhibitor showing fewer cell migration after 12 hr. (G) Statistical analysis performed on N = 6 explants on Npnt substrate and N = 6 explants on Npnt substrate plus inhibitor revealed significant reduction in cell density of migratory cells in the presence of the inhibitor. *p<0.05. ec, ectoderm; pom, periocular mesenchyme; en, corneal endothelium; ep, corneal epithelium; st, stroma. Scale bars: 100 μm.
Figure 3—video 1
Migration of periocular neural crest (pNC) from mesenchyme explant on nephronectin (Npnt)-coated substrate.
Time-lapse movie was taken over 17 hr with images taken every 3 min and 27 s. The cells are shown in bright-field and fluorescent Hoechst nuclear staining (blue). Relates to Figure 3E.
Figure 3—video 2
Migration of periocular neural crest (pNC) from mesenchyme explant on nephronectin (Npnt)-coated substrate in the presence of α8β1 inhibitor.
Time-lapse movie was taken over 17 hr with images taken every 3 min and 27 s. The cells are shown in bright-field and fluorescent Hoechst nuclear staining (blue). Relates to Figure 3F.
Figure 4 with 1 supplement
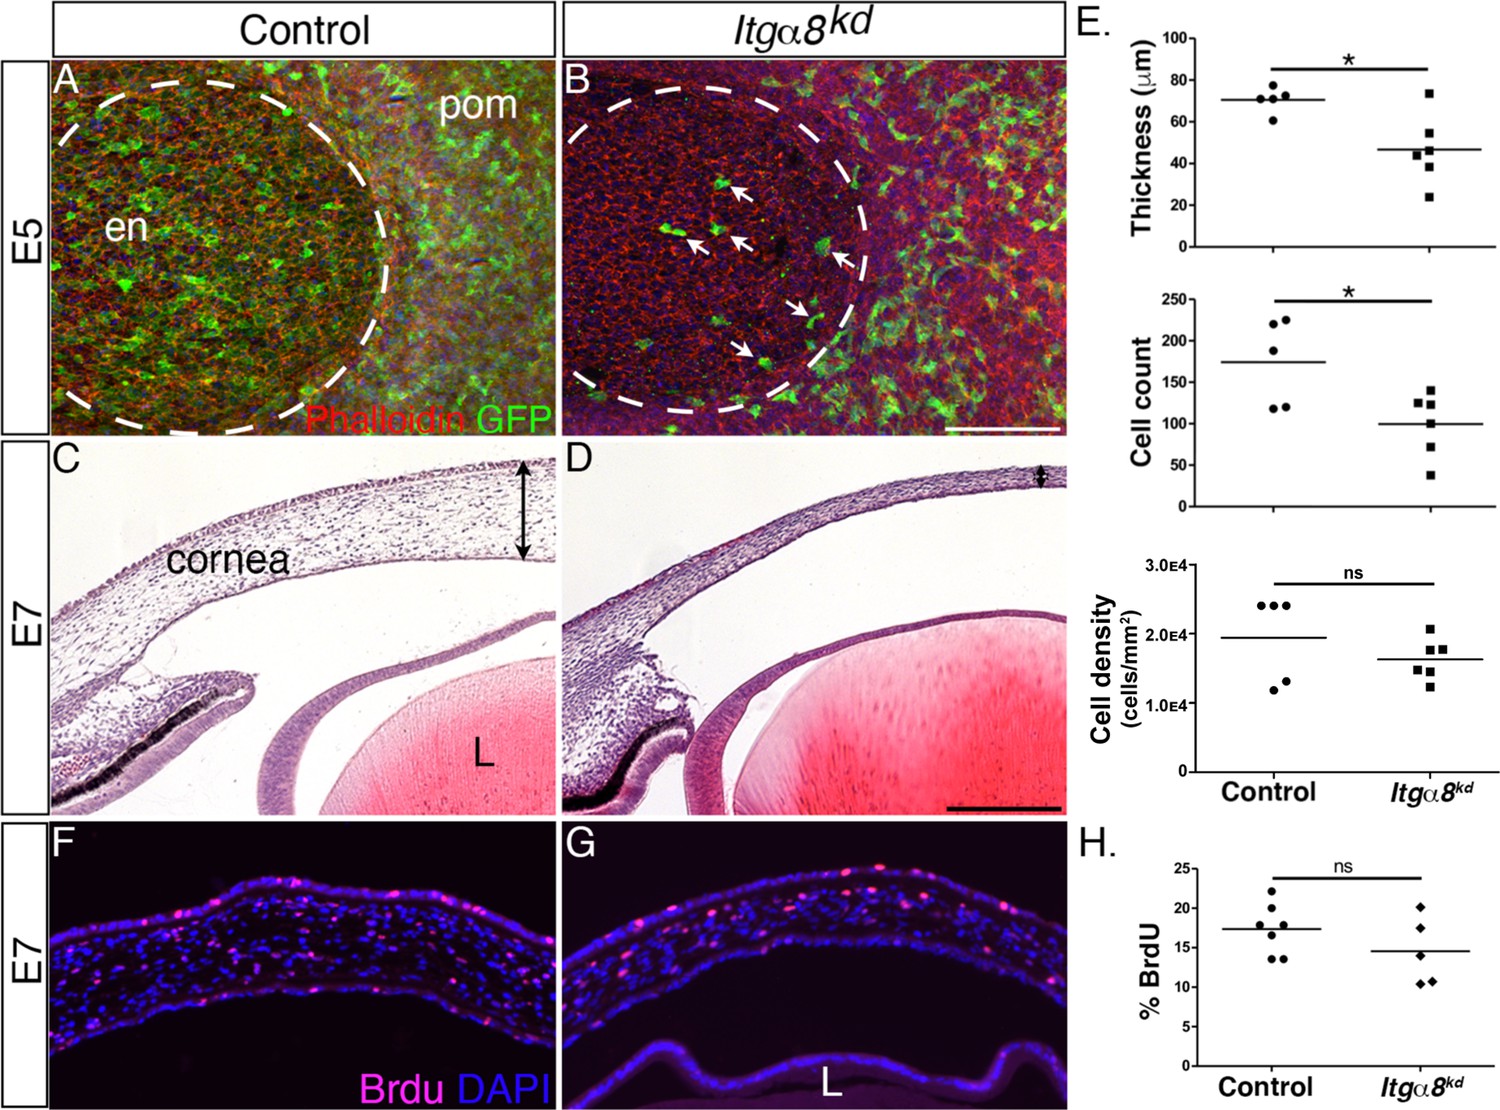
Knockdown of Itgα8 reduces periocular neural crest (pNC) migration and results in reduced corneal thickness.
(A, B) Whole-mount embryonic day (E)5 anterior eyes immunostained for GFP and counterstained with phalloidin to reveal cell membranes. (A) Control eye showing robust expression of GFP by pNC cells that migrated into the corneal region to form the endothelial layer. (B) Itgα8kd eye showing that relatively fewer GFP cells migrated into the cornea (arrows). Dotted lines demark the boundary between the cornea and periocular mesenchyme. (C, D) Hematoxylin and eosin staining of E7 corneal section showing (C) normal corneal thickness in control and (D) reduced corneal thickness in Itgα8kd embryos. Double-sided arrows indicate corneal thickness. (E) Statistical analysis of measurements taken from N = 5 control and N = 6 Itgα8kd corneas revealed significant reduction in thickness and cell count, and no difference in cell density in Itgα8kd corneas, *p<0.05. (F, G) Bromodeoxyuridine (BrdU) immunofluorescent analysis of cell proliferation in E7 corneal sections. Quantification of BrdU-positive cells in the corneal stroma was performed by normalizing to the total number of DAPI-positive cells. (H) Statistical analysis from N = 7 control and N = 5 Itgα8kd revealed no difference between control and Itgα8kd corneas. ns, not significant; en, corneal endothelium; pom, periocular mesenchyme; L, lens. Scale bars: 100 μm.
Figure 4—figure supplement 1
Validation of Itgα8 knockdown in vivo.
Stage 8 chick embryos were injected in the cranial region with control and Itgα8-shRNA viral constructs, and reincubated until embryonic day (E)7. Section in situ hybridization was performed using riboprobes for Itgα8. (A) Section of control cornea showing Itgα8 expression in the corneal stroma, iris, and lens epithelium. (B) Section of Itgα8kd cornea showing reduced expression of Itgα8 in the thin cornea, iris, and lens epithelium. The double-sided arrows indicate cornea thickness. st, corneal stroma. Scale bar, 200 μm.
Figure 5
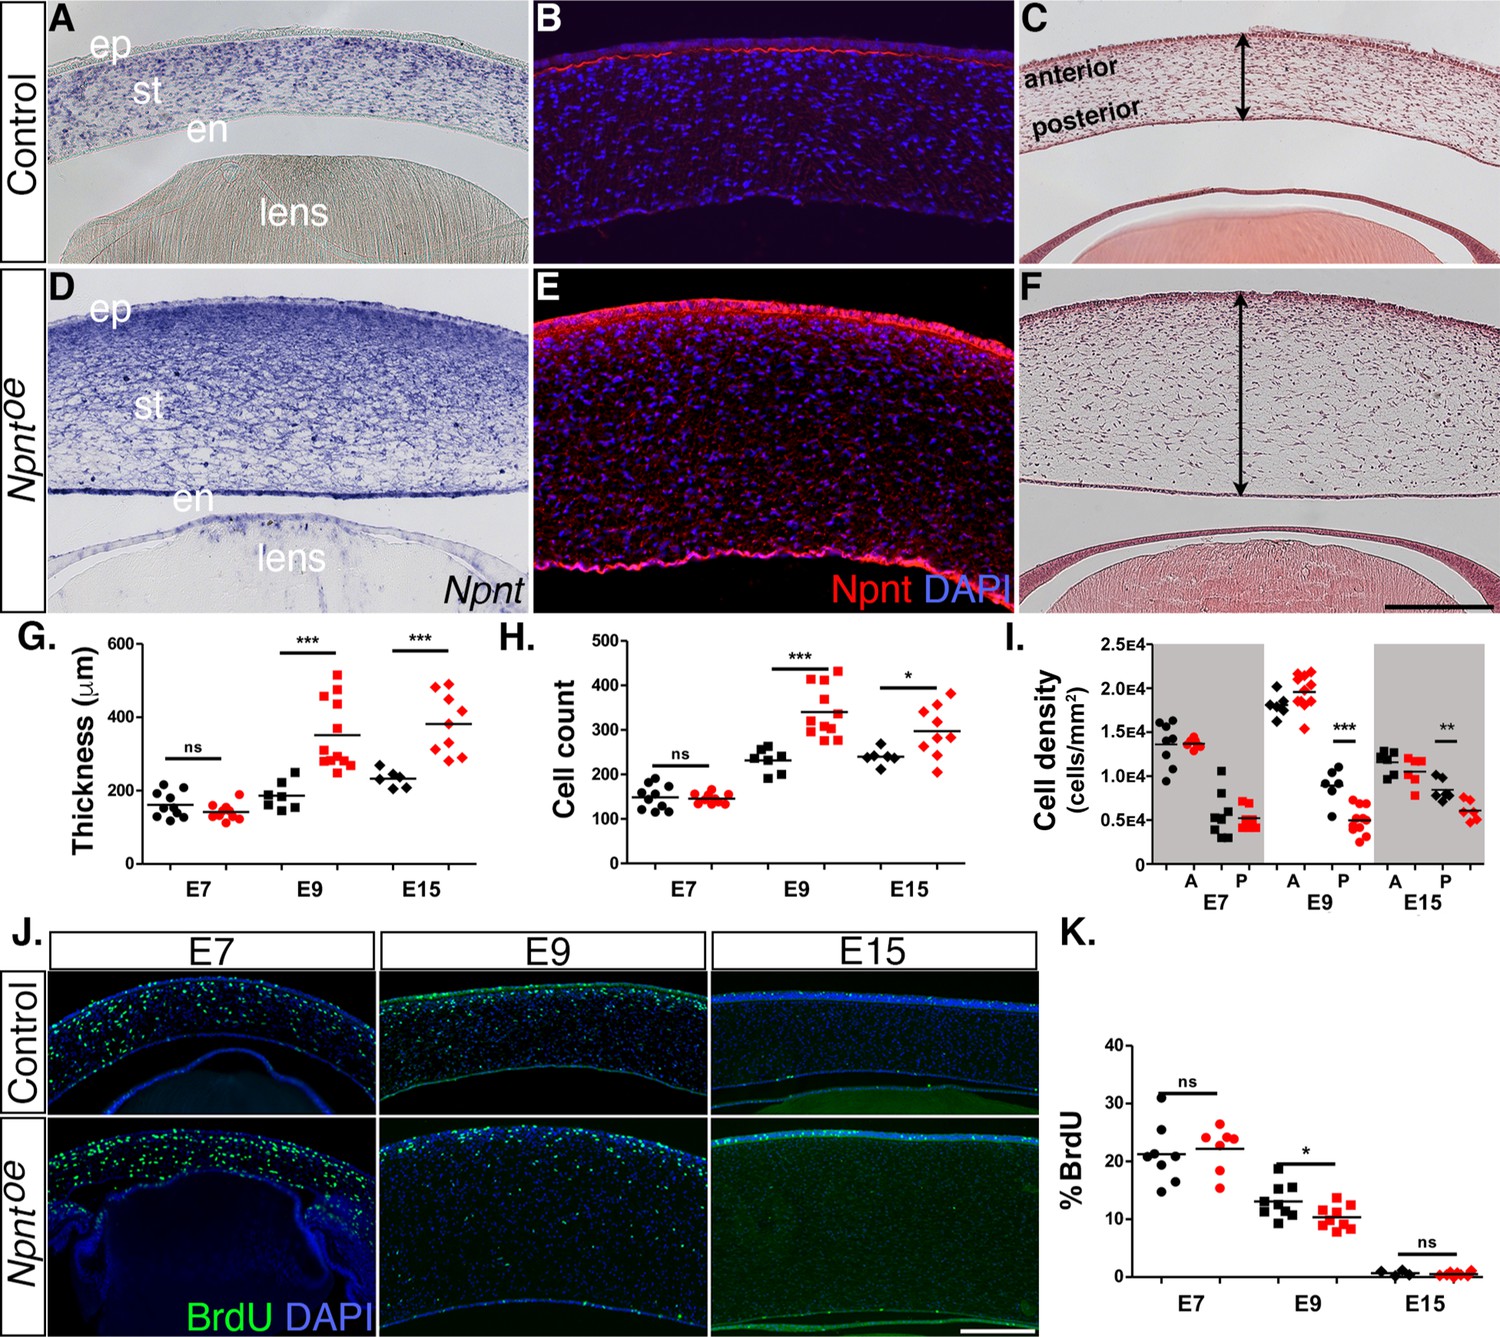
Effects of overexpression of nephronectin (Npnt) during corneal development.
Embryos were injected with RCAS virus expressing GFP alone (control) or GFP and the full-length Npnt protein, and corneas were analyzed at the developmental stages indicated. (A–F) Representative corneal sections from embryonic day (E)9 control (A–C) and Npntoe corneas (D–F) showing levels of Npnt transcript (A, D) and protein (B, E) expression, and hematoxylin and eosin staining indicating corneal thickness (double-sided arrows, C, F). (G, H) Measurements for corneal thickness and cell counts were taken from E7, N = 10 control, N = 10 Npntoe; E9; N = 7 control, N = 12 Npntoe; E15; N = 6 control, N = 9 Npntoe. Bar graphs show no difference at E7, but a significant increase at E9 and E15 in corneal thickness (G) and corneal cells (H). (I) Cell densities were determined from E7, N = 8 control, N = 7 Npntoe; E9; N = 6 control, N = 11 Npntoe; E15; N = 7 control, N = 6 Npntoe. Bar graph shows that there were no differences at E7 and anterior cell densities at E9 and E15, but the posterior cell densities were significantly decreased. (J, K) Bromodeoxyuridine (BrdU) analysis and quantification of cell proliferation in corneal sections taken from E7, N = 8 control, N = 7 Npntoe; E9; N = 9 control, N = 9 Npntoe; E15; N = 7 control, N = 6 Npntoe. No significant differences were observed at E7 and E15, but there was a significant reduction at E9. ns, not significant; *p<0.05; **p<0.01; ***p<0.001. ep, corneal epithelium; st, stroma; en, corneal endothelium. Scale bars: 100 μm.
Figure 6
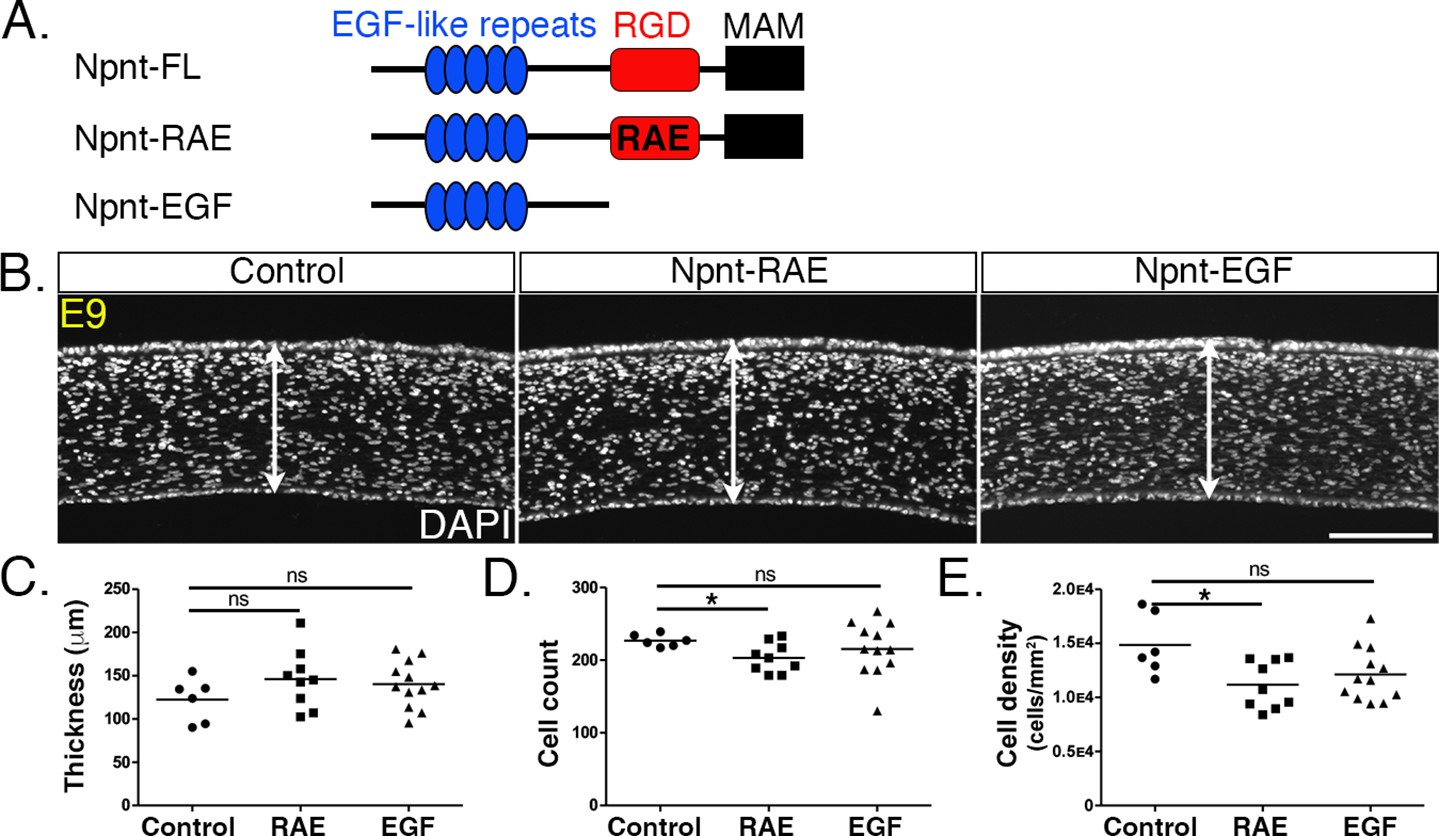
Overexpression of versions of nephronectin (Npnt) with either mutant or truncated RGD domains does not increase corneal thickness.
(A) Schematic showing the full-length Npnt, Npnt with mutated RGD to RAE sequence, and the truncated version containing only the epidermal growth factor (EGF) domain. (B) Representative sections of embryonic day (E)9 corneas showing corneal thicknesses (double-sided arrows) following overexpression of control, RGD mutant, and truncated versions of Npnt. (C–E) Quantification of measurements taken from N = 5 control, N = 9 RAE, and N = 12 EGF showing (C) no significant differences in corneal thickness. (D, E) Significant reduction in cell count and density in RGD mutant, but no difference in the truncated version. ns, not significant; *p<0.05. Scale bar: 100 μm.
Figure 7 with 1 supplement
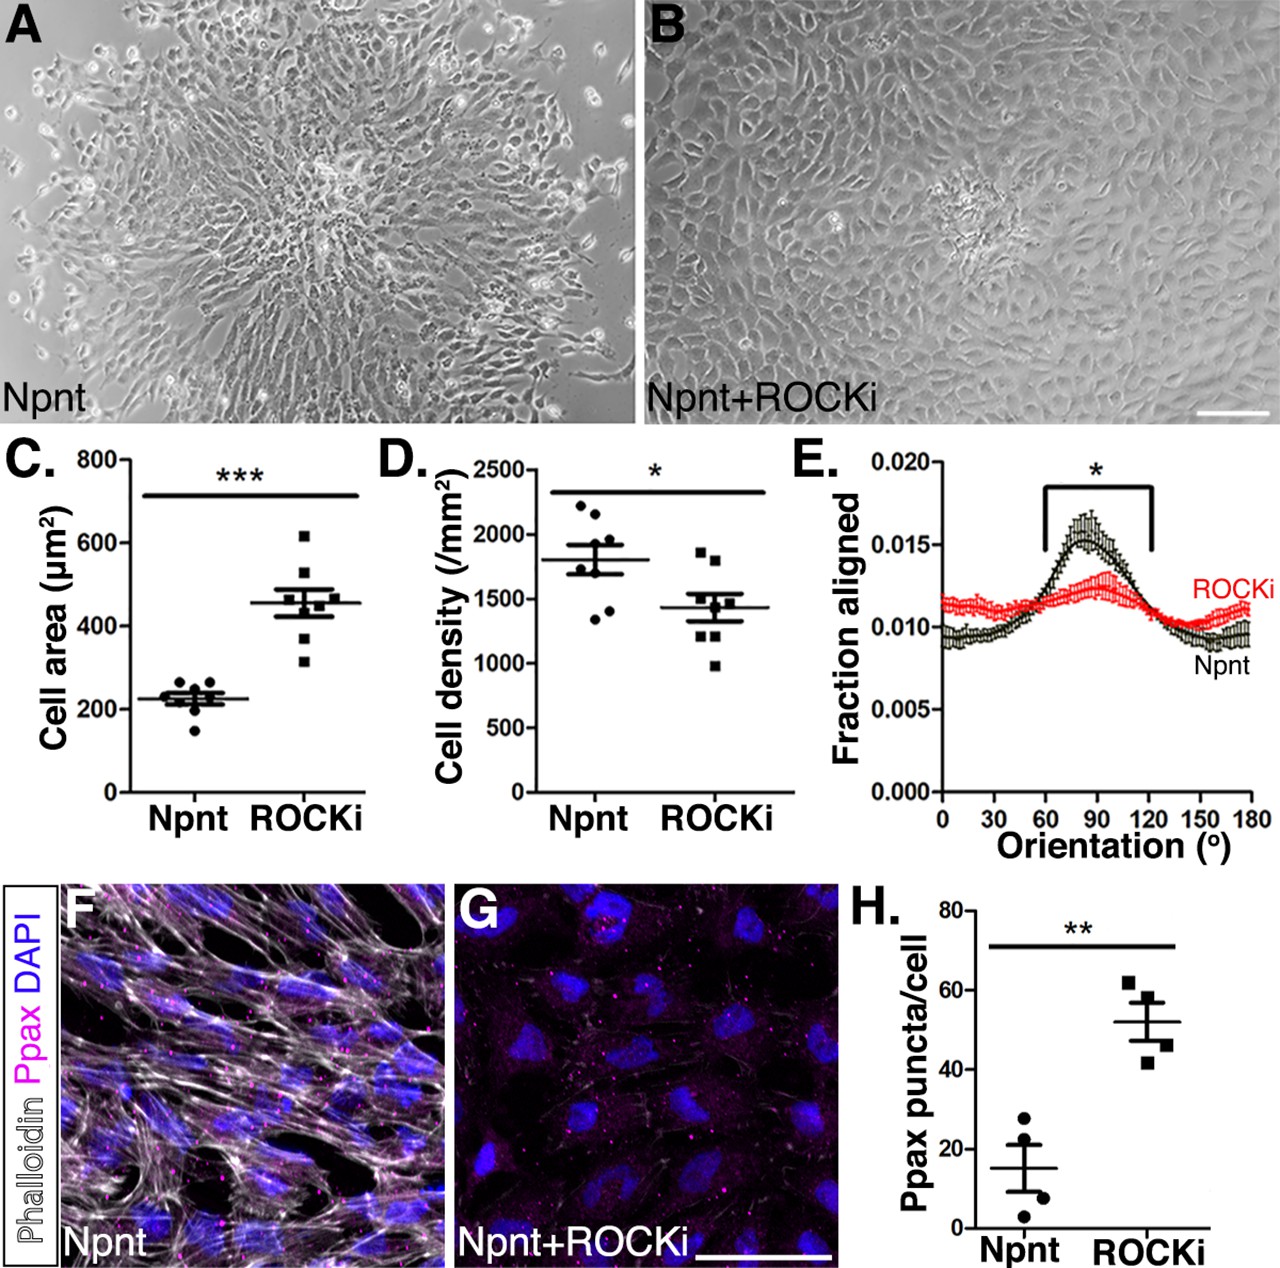
Inhibition of Rho-kinase attenuates periocular neural crest (pNC) migration on nephronectin (Npnt).
(A–D) Comparisons of pNC migration from explants cultured for 24 hr on either (A) Npnt substrate alone or in the presence of (B) the ROCK inhibitor Y27632. (C, D) Quantification of cell area taken from N = 8 Npnt and N = 8 Npnt plus ROCK inhibitor showing significant reduction in (C) cell area and (D) cell migration in the presence of ROCK inhibitor. (E) Quantification of cell orientation from N = 6 Npnt and N = 6 Npnt plus ROCK inhibitor explants showing significant difference in the fraction aligned between 90° ± 30°. (F, G) Cells stained for actin (phalloidin) and focal adhesion (pY118 paxillin) showing (F) formation of actin stress fibers and focal adhesions by pNC migrating on Npnt. (G) Substantial decrease in actin stress fibers in the presence of the ROCK inhibitor. (H) Quantification taken from N = 4 Npnt and N = 4 ROCK inhibitor explants, showing significant increase in the number of pY118 paxillin-positive puncta. *p<0.05; **p<0.01. Scale bars: (A, B) 100 μm; (F, G) 50 μm.
Figure 7—figure supplement 1
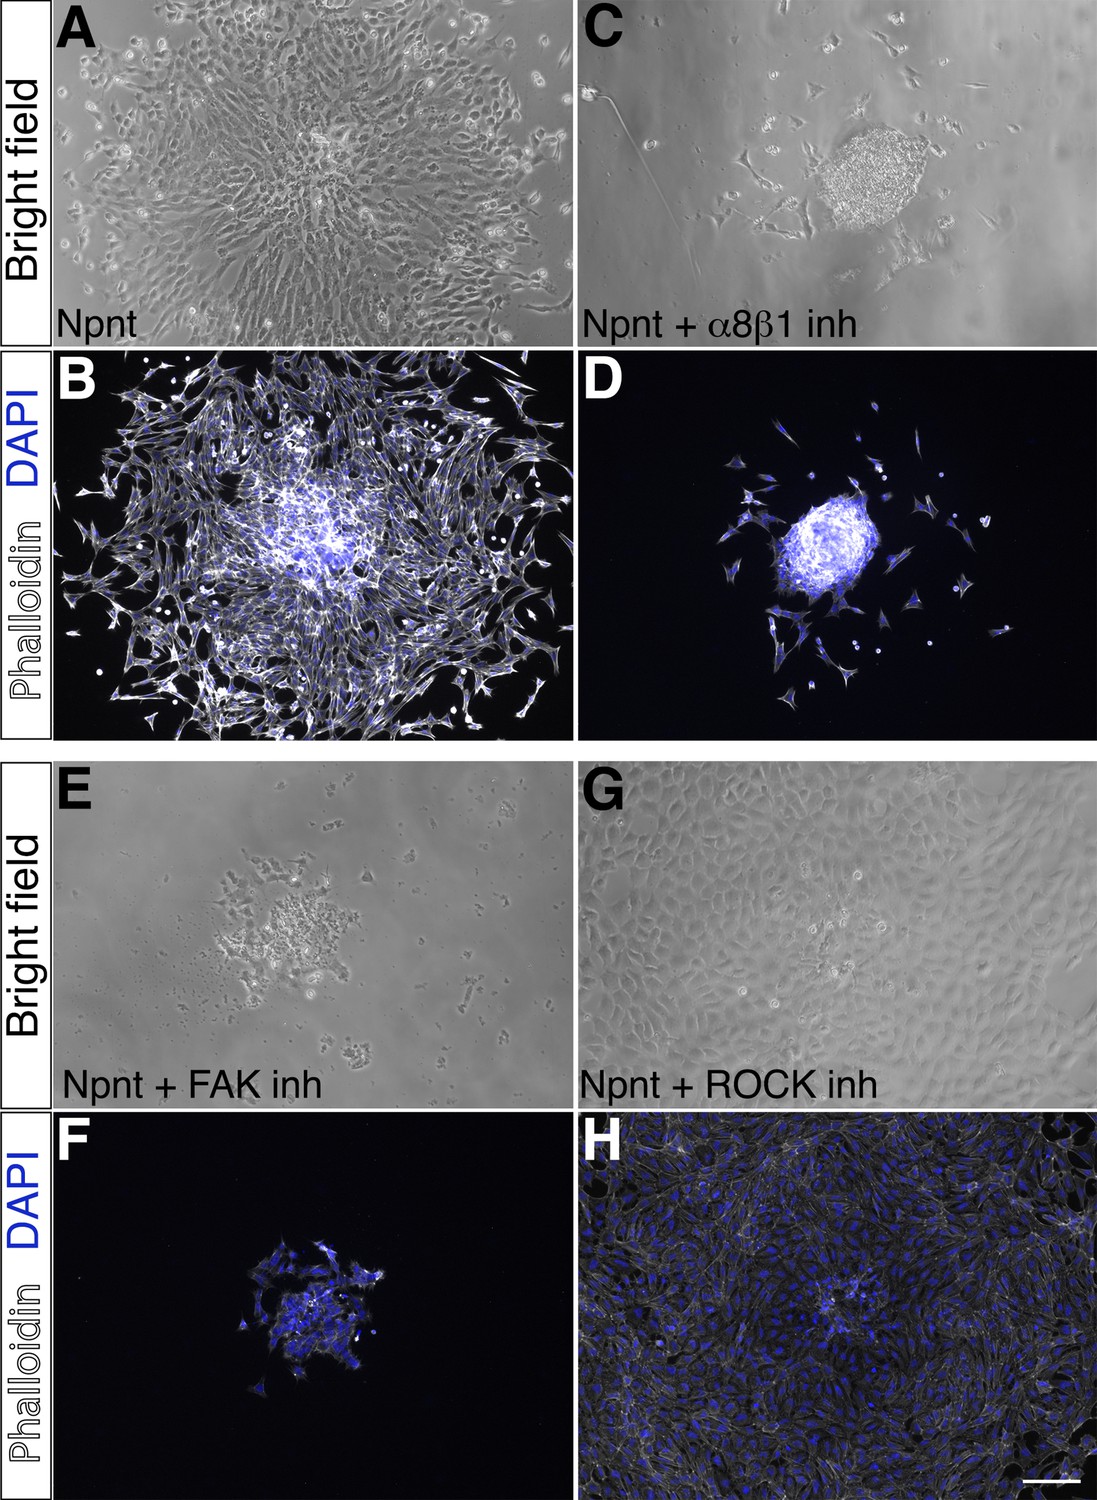
Analysis of periocular neural crest (pNC) migration on nephronectin (Npnt) substrate in the presence of inhibitors of components of the migratory signaling pathway.
pNC explants were examined for cell migration after 24 hr culture on Npnt substrate with or without inhibitors. (A, B) Control showing robust migration of pNC on Npnt substrate and strong phalloidin staining. (C, D) Migration of pNC is attenuated in the presence of α8β1 inhibitor. (E, F) Inhibition of the focal adhesion kinase (FAK) also attenuated pNC migration and in addition; only a few cells remained attached to the Npnt substrate. (G, H) The ROCK inhibitor substantially decreased the formation of actin stress fibers as indicated by the low level of phalloidin staining compared to (B). Scale bar, 100 μm.
Figure 8
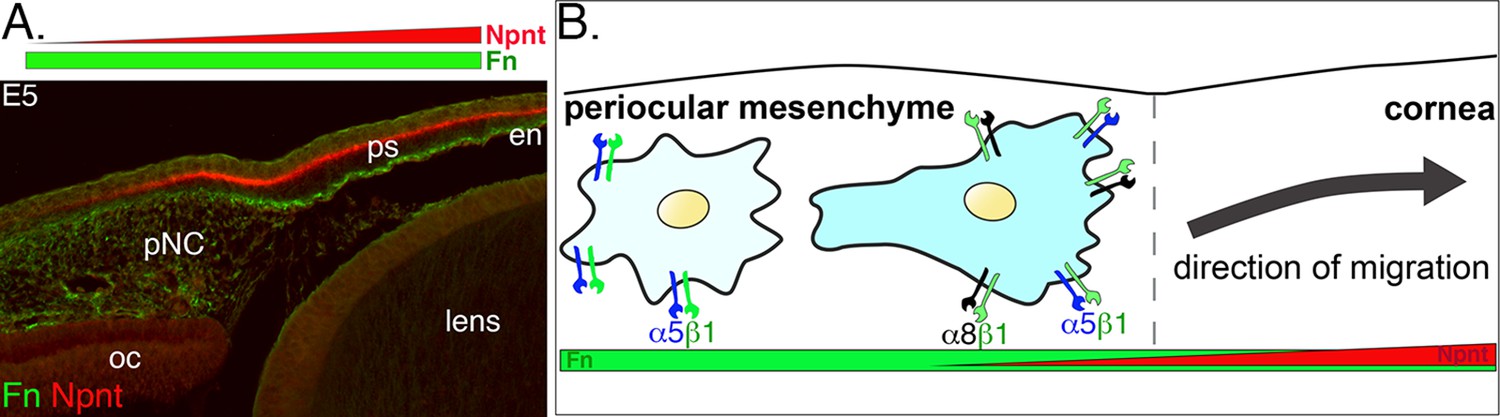
Dynamics of periocular neural crest (pNC) response to the extracellular matrix (ECM) in the context of the expression of nephronectin (Npnt) and fibronectin (Fn) during corneal development.
(A) Cross-section of embryonic day (E)5 eye immunostained for Npnt and Fn. Npnt appears in an increasing gradient from the periocular region into the cornea, whereas Fn stains both the periocular mesenchyme and cornea. (B) All pNC respond to Fn via expression of α5β1, but a subpopulation of pNC that reside in the region adjacent to the presumptive cornea express both α5β1 and α8β1, and become competent to also read the additional gradient of Npnt in the ECM, thus migrating into the corneal region. oc, optic cup; ps, primary stroma; en, corneal endothelium.
Author response image 1
Author response image 2
Tables
Key resources table
| Reagent type (species) or resource | Designation | Source or reference | Identifiers | Additional information |
|---|---|---|---|---|
| Transfected construct (Gallus gallus) | shRNA: Npnt | This paper | See Materials and methods, section ‘Production of RCAS virus’ | |
| Transfected construct (G. gallus) | shRNA: Itga8 | This paper | See Materials and methods, ‘Production of RCAS virus’ | |
| Biological sample (G. gallus) | Primary periocular neural crest | This paper | See Materials and methods, section ‘In vitro explant culture’ | |
| Biological sample (G. gallus) | DF-1 cells | ATCC | Cat# CRL12203 | Lot# 58217603, no mycoplasma contamination detected |
| Antibody | Anti-Npnt (rabbit polyclonal) | Biorbyt | Cat# orb221700; RRID:AB_2905548 | IF (1:100) |
| Antibody | Anti-GFP (mouse monoclonal) | Invitrogen | Cat# A-6455; RRID:AB_221570 | IF (1:500) |
| Antibody | Anti-fibronectin (mouse monoclonal) | DHSB | Cat# B3/D6; RRID:AB_2105970 | IF (1:30) |
| Antibody | Anti-phosphorylated paxillin (rabbit polyclonal) | Invitrogen | Cat# 44-722G; RRID:AB_2533733 | IF (1:200) |
| Antibody | Anti-BrdU (mouse monoclonal) | DHSB | Cat# G3G4; AB_2618097 | IF (1:30) |
| Chemical compound, drug | Bromodeoxyuridine | Sigma | Cat# B5002 | |
| Chemical compound, drug | Poly-d-lysine | Sigma | Cat# P6407 | |
| Recombinant DNA reagent | pSLAX13 | Addgene | Cat# CT#232 | |
| Recombinant DNA reagent | RCAS plasmid | Hughes et al., 1987;doi.org/10.1128/jvi.61.10.3004–3012.1987 | ||
| Recombinant RNA reagent | Integrin α8 RNA probe | This paper | PCR primers | Supplementary file 1 |
| Recombinant RNA reagent | Nephronectin RNA probe | This paper | PCR primers | Supplementary file 1 |
| Peptide, recombinant protein | α8β1 inhibitor | Sato et al., 2009;doi.org/10.1074/jbc.M900200200 | GenScript | |
| Peptide, recombinant protein | Nephronectin (human) | R&D Systems | 9560NP-050 | 1.5 µg/cm2 |
| Peptide, Recombinant protein | Nephronectin (mouse) | R&D Systems | AF4298-NP-50 | 1.5 µg/cm2 |
| Commercial assay or kit | CloneEZ PCR cloning kit | GenScript | Cat# L00339 | |
| Commercial assay or kit | DIG RNA Labelling Kit (SP6/T7) | Roche | Cat# 11175025910 | |
| Chemical compound, drug | PF-573228 | Sigma-Aldrich | Cat# PZ0117-5MG | 10 µM |
| Chemical compound, drug | Y27632 | Sigma-Aldrich | Cat# Y0503 | 10 µM |
| Other | DAPI stain | Roche | D8417 | (1 µg/mL) |
| Other | Phalloidin | Invitrogen | A-12380 | (1:200) |
Additional files
-
Supplementary file 1
Table showing the primer sequences used for riboprobe synthesis.
- https://cdn.elifesciences.org/articles/74307/elife-74307-supp1-v2.docx
-
Supplementary file 2
Table showing the shRNA target sequences used for knockdown studies.
- https://cdn.elifesciences.org/articles/74307/elife-74307-supp2-v2.docx
-
Supplementary file 3
Table showing the primers used to validate Npnt and Itgα8 knockdown efficiency.
- https://cdn.elifesciences.org/articles/74307/elife-74307-supp3-v2.docx
-
Transparent reporting form
- https://cdn.elifesciences.org/articles/74307/elife-74307-transrepform1-v2.docx
-
Source data 1
- https://cdn.elifesciences.org/articles/74307/elife-74307-data1-v2.xlsx
-
Source data 2
Gel images for the data reported in Figure 2—figure supplement 1C.
- https://cdn.elifesciences.org/articles/74307/elife-74307-data2-v2.pdf
Download links
A two-part list of links to download the article, or parts of the article, in various formats.
Downloads (link to download the article as PDF)
Open citations (links to open the citations from this article in various online reference manager services)
Cite this article (links to download the citations from this article in formats compatible with various reference manager tools)
Nephronectin-integrin α8 signaling is required for proper migration of periocular neural crest cells during chick corneal development
eLife 11:e74307.
https://doi.org/10.7554/eLife.74307


