BehaviorDEPOT is a simple, flexible tool for automated behavioral detection based on markerless pose tracking
- Department of Physiology, University of California, Los Angeles, United States
- UCLA Neuroscience Interdepartmental Program, University of California, Los Angeles, United States
- UCLA Molecular, Cellular, and Integrative Physiology Program, University of California, Los Angeles, United States
- Department of Neurology, University of California, Los Angeles, United States
- Department of Psychiatry, University of California, Los Angeles, United States
- Department of Psychology, University of California, Los Angeles, United States
Figures
Figure 1 with 1 supplement
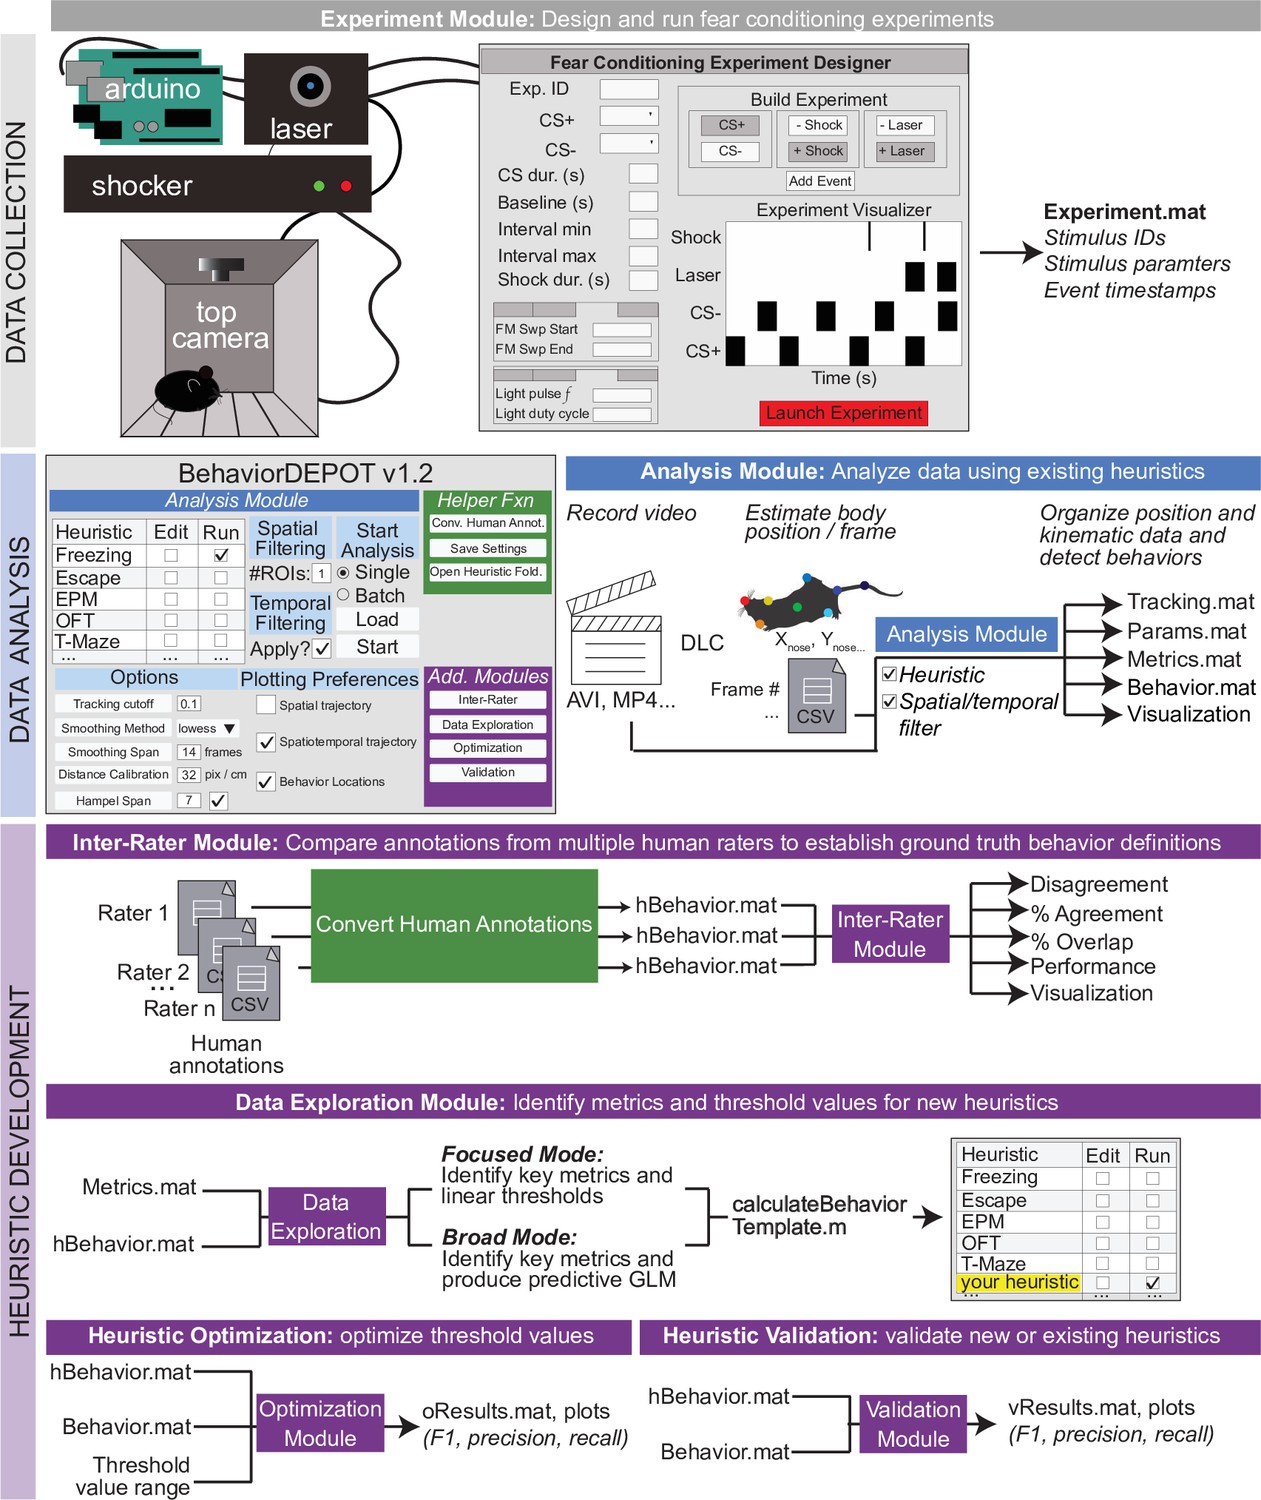
BehaviorDEPOT is a general-purpose behavioral analysis software comprising six modules.
The Experiment Module is a MATLAB application with a graphical interface that allows users to design and run fear conditioning experiments. The software uses Arduinos to interface with commercially available hardware (e.g. shockers and lasers) to control stimuli. The Analysis Module imports keypoint tracking data, calculates postural and kinematic metrics, detects behaviors, and analyzes the results of behavior experiments. Four additional modules help users develop custom heuristics. The Inter-Rater Module compares human annotations, helping researchers settle on ‘ground truth’ definitions of behavior. These human definitions serve as reference data for behavioral detection heuristics. The data exploration module identifies features of movement with the highest predictive value for specific behaviors. The optimization module identifies combinations of feature thresholds that maximize behavioral detection. The validation module reports the accuracy of heuristics.
Figure 1—figure supplement 1
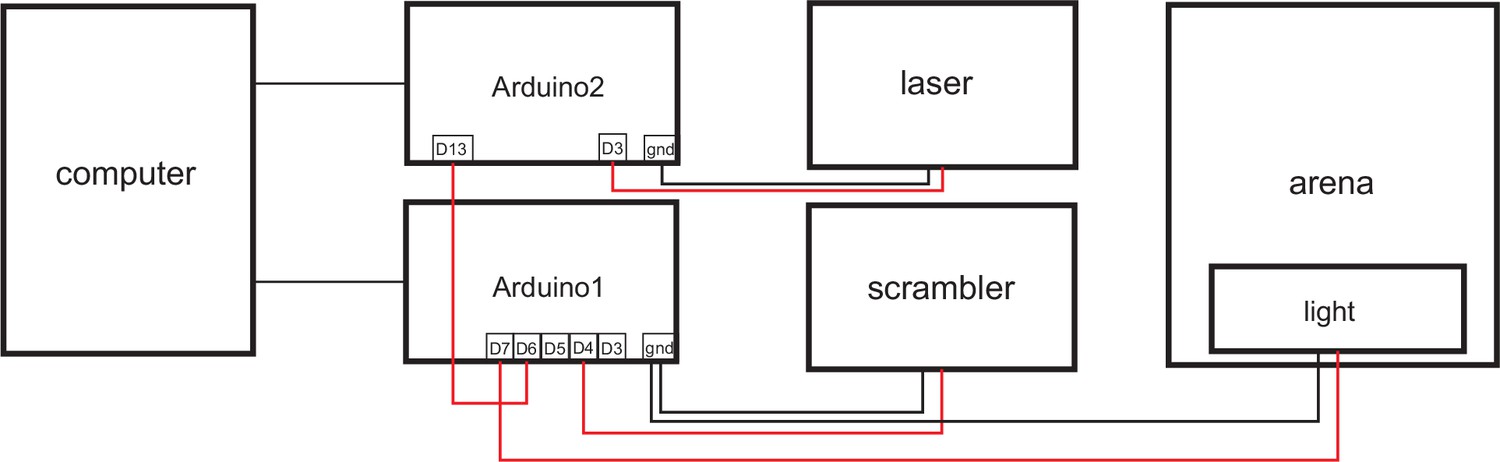
Example arrangement of Arduino interface between computer, fear conditioning, and optogenetics hardware.
The Experiment Module controls two Arduinos that control delivery of the scrambled shocker, and a light (for use as a conditioned cue), and the laser for optogenetics, respectively. MATLAB software triggers the conditioned tone.
Figure 2 with 2 supplements
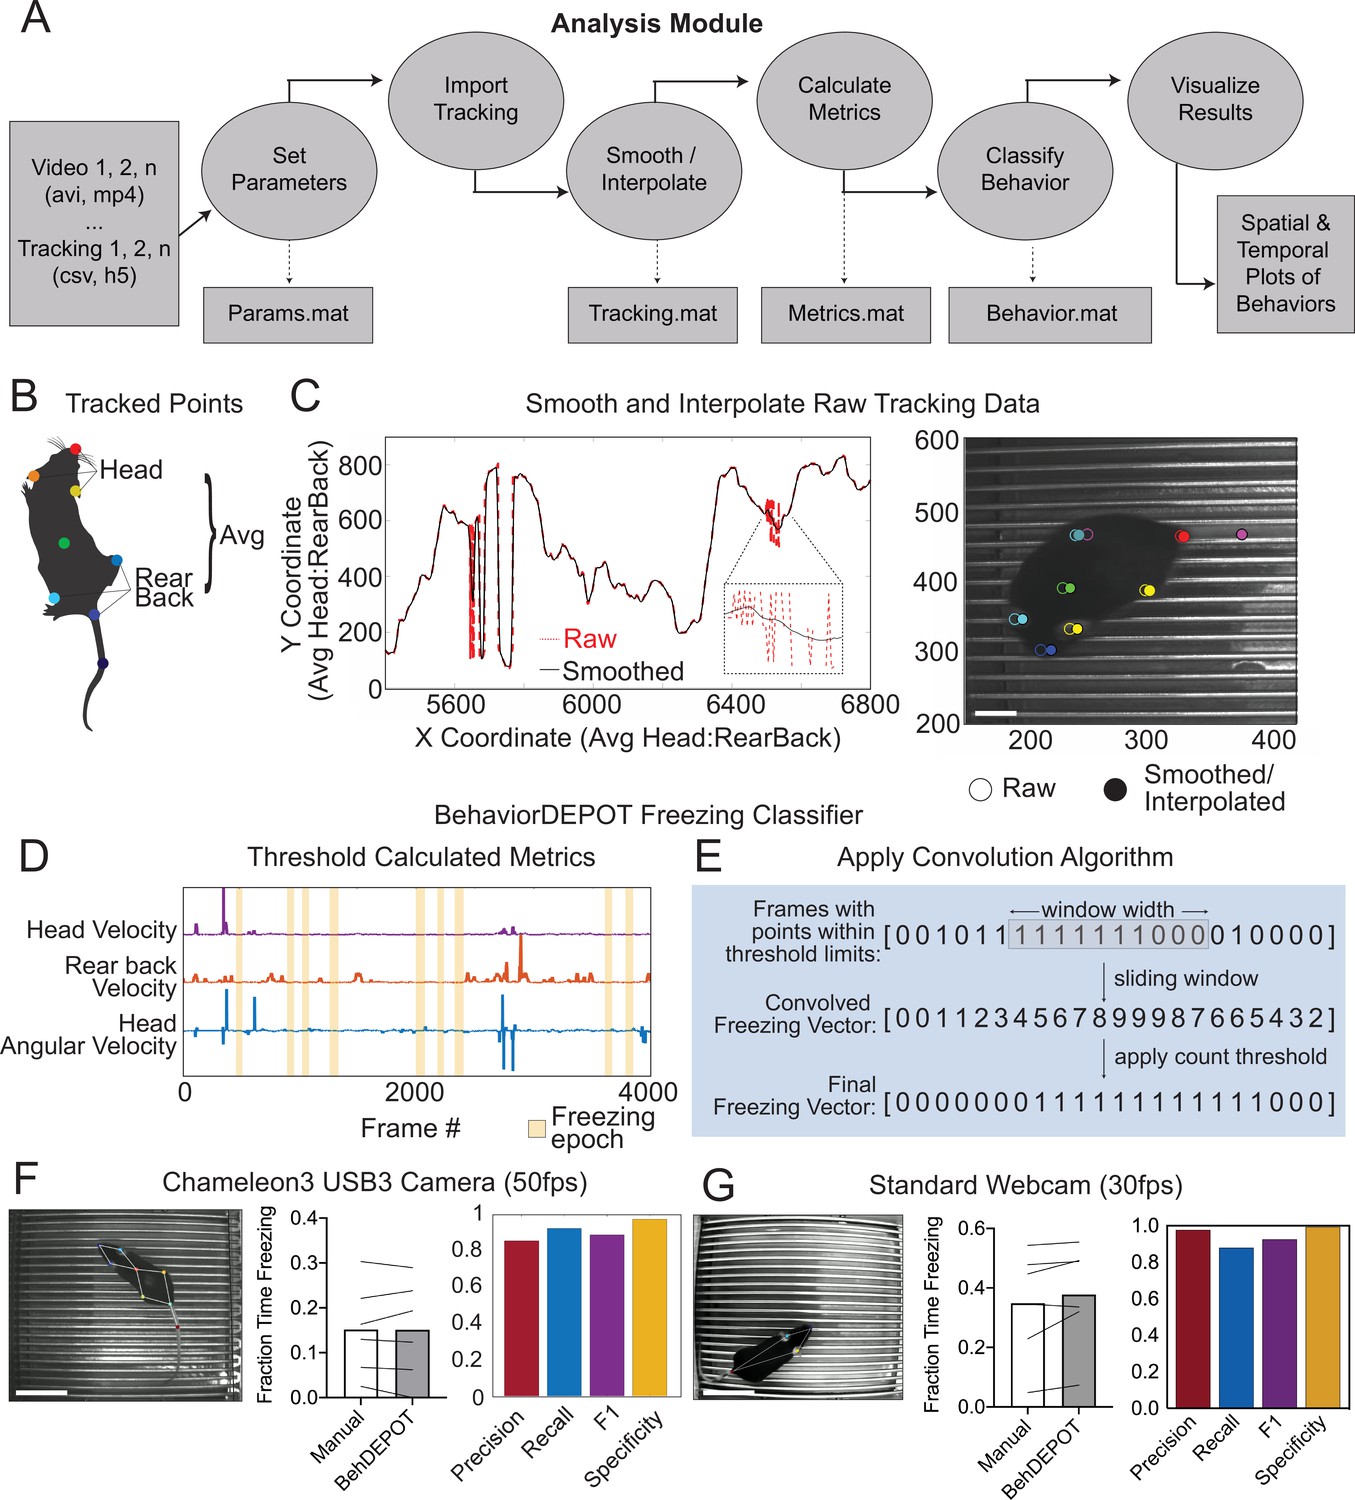
The Analysis Module.
(A) The Analysis Module workflow. Videos and accompanying pose tracking data are the inputs. Pose tracking and behavioral data is vectorized and saved in MATLAB structures to facilitate subsequent analyses. (B) Metrics based on individual tracked points and weighted averages are calculated and stored in BehaviorDEPOT data matrices. (C) Visualization of the effects of the LOWESS smoothing and interpolation algorithms for the weighted average of head and rear back (left) and for all tracked points in a representative example frame (right; scale bar, 2 cm). (D) Visualization of metrics that form the basis of the BehaviorDEPOT freezing heuristic. Colored lines represent framewise metric values. Yellow bars indicate freezing epochs. (E) Visualization of the convolution algorithm employed by the BehaviorDEPOT freezing heuristic. A sliding window of a specified width produces a convolved freezing vector in which each value represents the number of freezing frames visible in the window at a given frame. An adjustable count threshold converts the convolved freezing vector into the final binary freezing vector. (F) Evaluation of freezing heuristic performance on videos recorded at 50 fps with a high resolution, high framerate camera (p=0.95, paired t-test, N=6; Precision: 0.86, Recall: 0.92, F1: 0.89, Specificity: 0.97). Scale bar, 5 cm. (G) Evaluation of freezing heuristic performance on videos recorded at 30fps with a standard webcam (p=0.10, paired t-test, N=6; Precision: 0.98, Recall: 0.88, F1: 0.93, Specificity: 0.99). Scale bar, 5 cm.
Figure 2—figure supplement 1
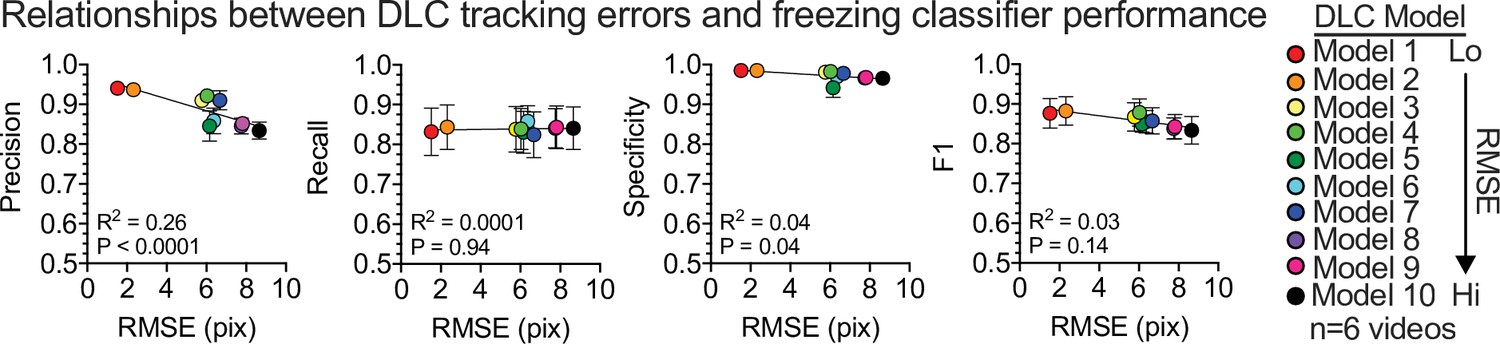
Performance of the freezing heuristic based on DLC mean tracking error.
Heuristic performance statistics plotted against root mean squared error (RMSE) of the DLC model. N=6 videos were tested to generate average heuristic performance for each model. Error bars, S.E.M. R and P values indicate summary statistics for simple linear regression.
Figure 2—figure supplement 2
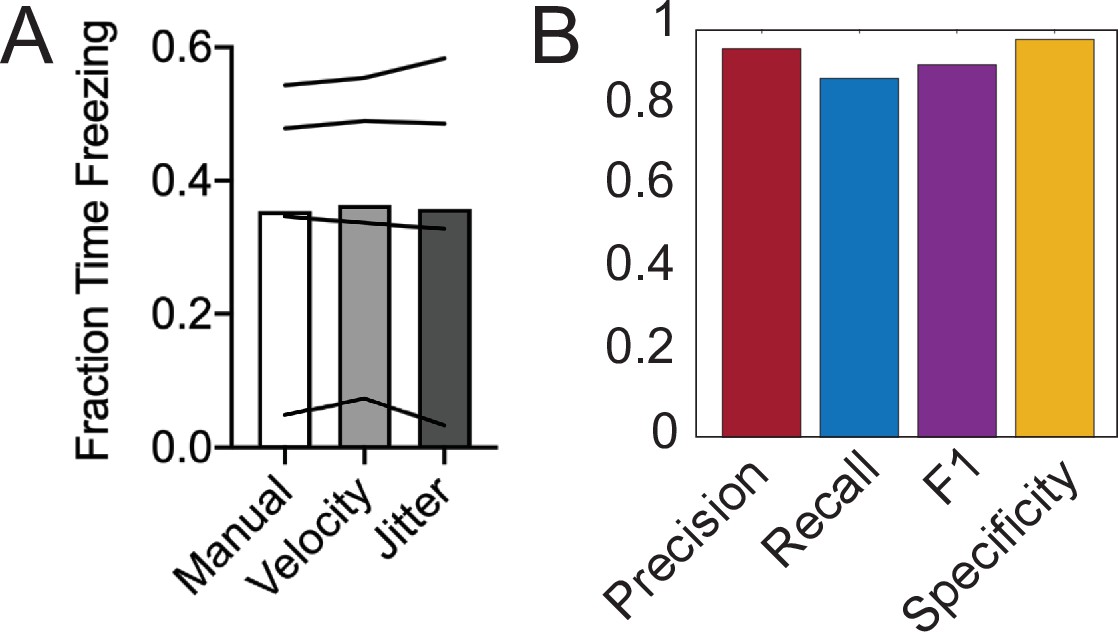
Performance of the ‘Jitter’ Freezing Heuristic on Webcam videos.
(A) Human vs. velocity vs. jitter freezing annotations (F(1.4,4.2)=0.32, P=0.67, RM one-way ANOVA). (B) Evaluation of freezing heuristic performance on videos recorded at 30fps with a standard webcam (Precision: 0.95, Recall: 0.88, F1: 0.97, Specificity: 0.91).
Figure 3 with 1 supplement
Use Case 1: Optogenetics.
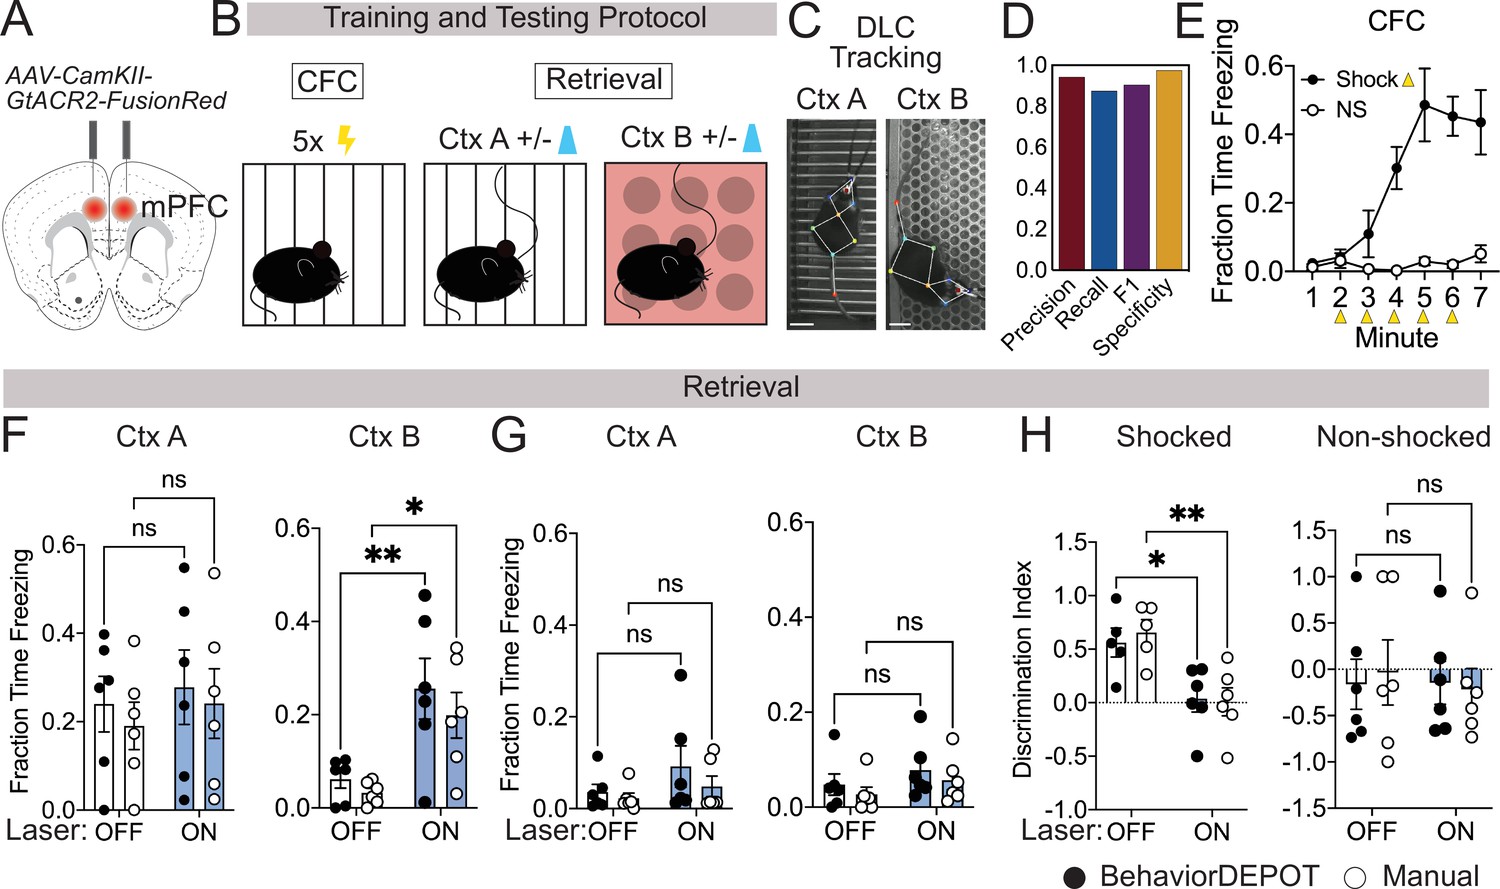
(A) AAV1-CamKII-GtACR2-FusionRed was injected bilaterally into medial prefrontal cortex (mPFC). (B) Behavioral protocol. Mice underwent contextual fear conditioning on day 1. On day 2, mice were returned to the conditioned context or a novel context in a counterbalanced fashion and received 2x2 min 473 nm laser stimulation separated by 2 min laser off intervals. (C) Example DLC tracking of mice attached to patch cords in different contexts. Scale bars, 2cm. (D) Performance of freezing heuristic (Precision: 0.94, Recall: 0.87, F1: 0.91, Specificity: 0.98). (E) Quantification of contextual freezing during training analyzed with BehaviorDEPOT. F–G. Comparing human annotations to BehaviorDEPOT freezing heuristic. (F) Shocked mice: freezing in context A (left) and context B (right) with and without mPFC silencing (CtxA: Flaser(1,10)=0.42, p=0.53; Frater(1,10)=0.35, p=0.57; Off vs. On: PBD = 0.91, PManual = 0.86; CtxB: Flaser(1,10)=26.51, p=0.0004; Frater(1,10)=0.08, p=0.78; Off vs. On: PBD = 0.008, PMan = 0.02; Two-way repeated measures ANOVA and Sidak’s test, N=6 mice per group). (G) Non-shocked controls: freezing in context A (left) and context B (right) with and without mPFC silencing (Ctx A: Flaser(1,10)=3.60, p=0.09; Frater(1,10)=0.79, p=0.39; Off vs. On: PBD = 0.30, PManual = 0.76; CtxB: Flaser(1,10)=1.486, P=0.25; Frater(1,10)=1.59, p=0.24; Off vs. On: PBD = 0.52, PManual = 0.54; Two-way repeated measures ANOVA, N=6 mice per group). (H) Discrimination index = (FreezeA - FreezeB) / (FreezeA +FreezeB) for shocked mice (Flaser(1,10)=17.54, p=0.002; Frater(1,8)=0.09, p=0.77; Mixed-effects analysis, On vs. Off: PBD = 0.02, PManual = 0.004, Sidak’s test, N=5–6 per group) and non-shocked controls (Flaser(1,10)=0.07, p=0.80; Frater(1,8)=0.02, p=0.90; Two-way ANOVA; On vs. Off: PBD = ,0.99 PManual = 0.87, Sidak’s test, N=6 per group). Error bars represent S.E.M.
Figure 3—figure supplement 1
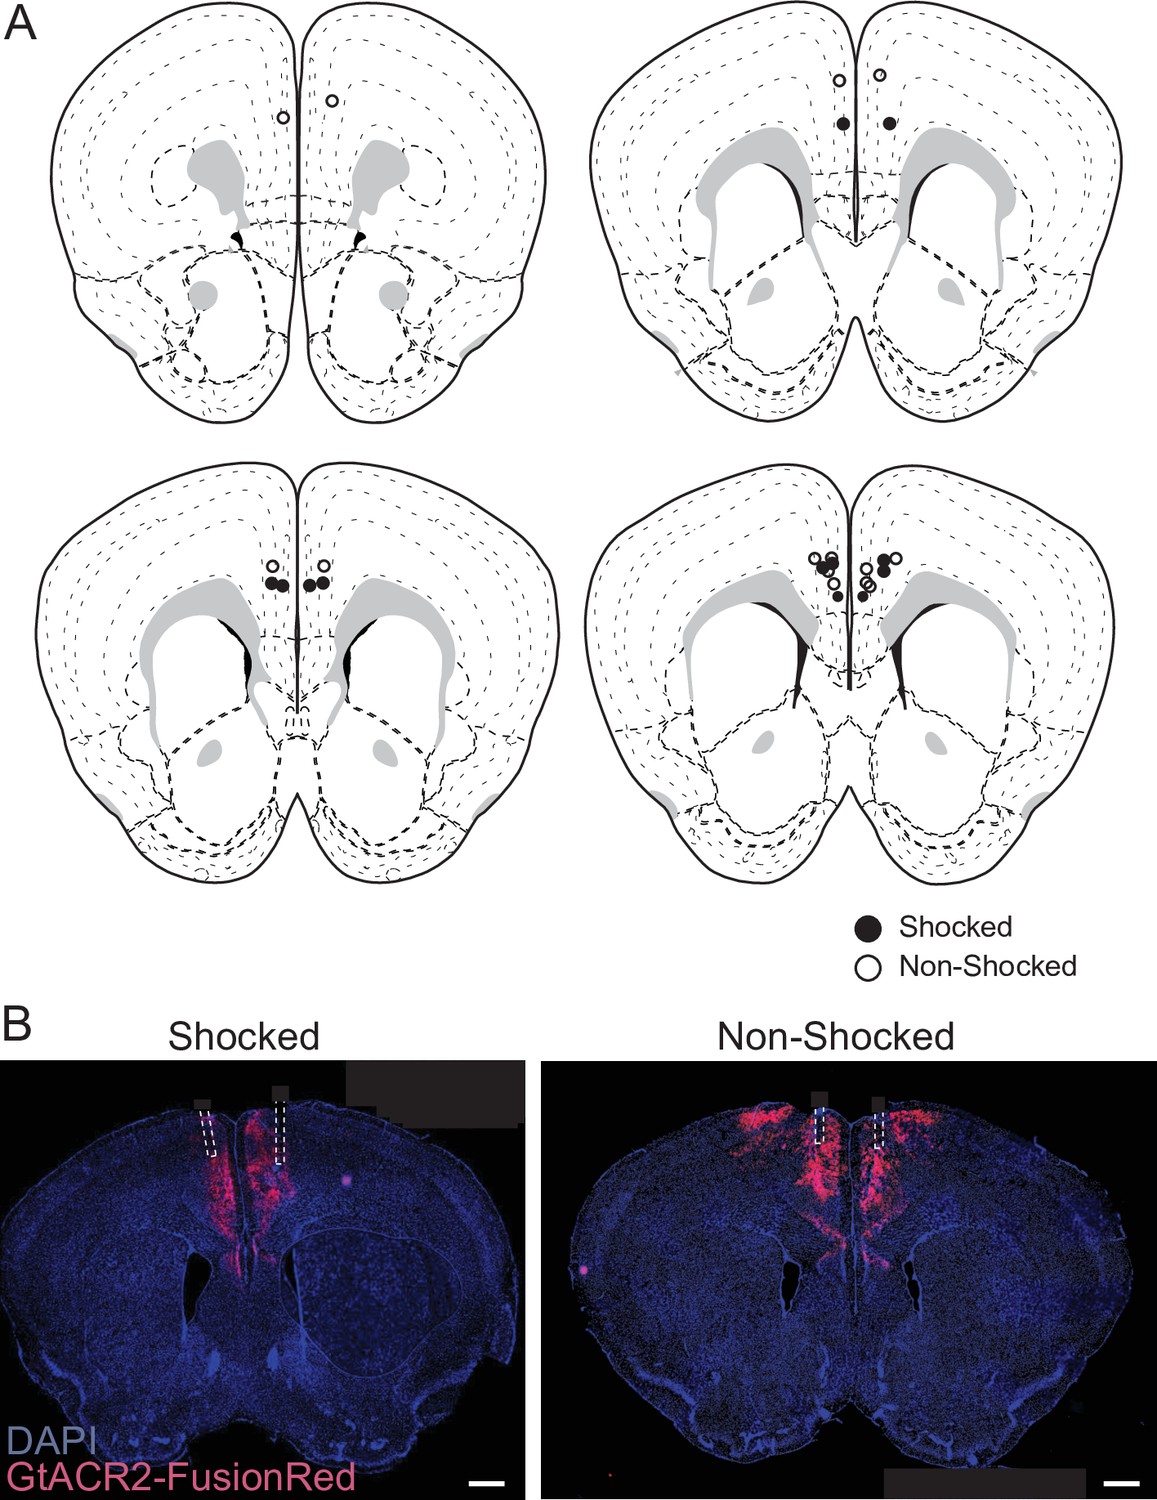
Histology for optogenetics viral injections and fiber implants.
(A) Optic fiber cannula placements for experiment described in Figure 3. (B) StGtACR2 -FusionRed expression and bilateral fiber placement for representative shocked and non-shocked mice. Scale bar, 500 µm.
Figure 4

Use Case 2: Mice wearing Miniscopes.
(A) Design for MiniCAM, an open-source camera designed to interface with Miniscopes and pose tracking. (B) Still frame from MiniCAM recording of mouse wearing a V4 Minscope. DLC tracked points are labeled with rainbow dots. Scale bar, 2 cm. (C) Performance of freezing heuristic on videos of mouse wearing Miniscope recorded with MiniCAM (Precision: 0.85; Recall: 0.93; F1 Score: 0.89; Specificity: 0.84). (D) Task design. (E) Sample BehaviorDEPOT output for mouse wearing Miniscope during PMA. Map displays animal position over time as well as freezing locations (black squares). (F) Summary behavioral data for training. (G) Summary behavioral data for retrieval. (H) GCaMP7-exressing mPFC neurons imaged through a V4 Miniscope. Scale bars, 100 μm. (I) Example Ca2+ traces from platform (top) and tone (bottom) modulated cells during time on the platform (blue) or time freezing (pink). (J) Receiver operating characteristic (ROC) curves that were calculated for platform-modulated cells (excited cell: auc = 0.71; suppressed cell: auc = 0.35, unmodulated cell: auc = 0.45) and freezing-modulated cells (excited cell: auc = 0.81; suppressed cell: auc = 0.32; unmodulated cell: auc = 0.42). (K) Example field of view showing locations of freezing- and platform-modulated mPFC neurons. (L) Proportion of modulated cells of each functional type from 513 cells recorded across 3 mice. Error bars represent S.E.M.
Figure 5
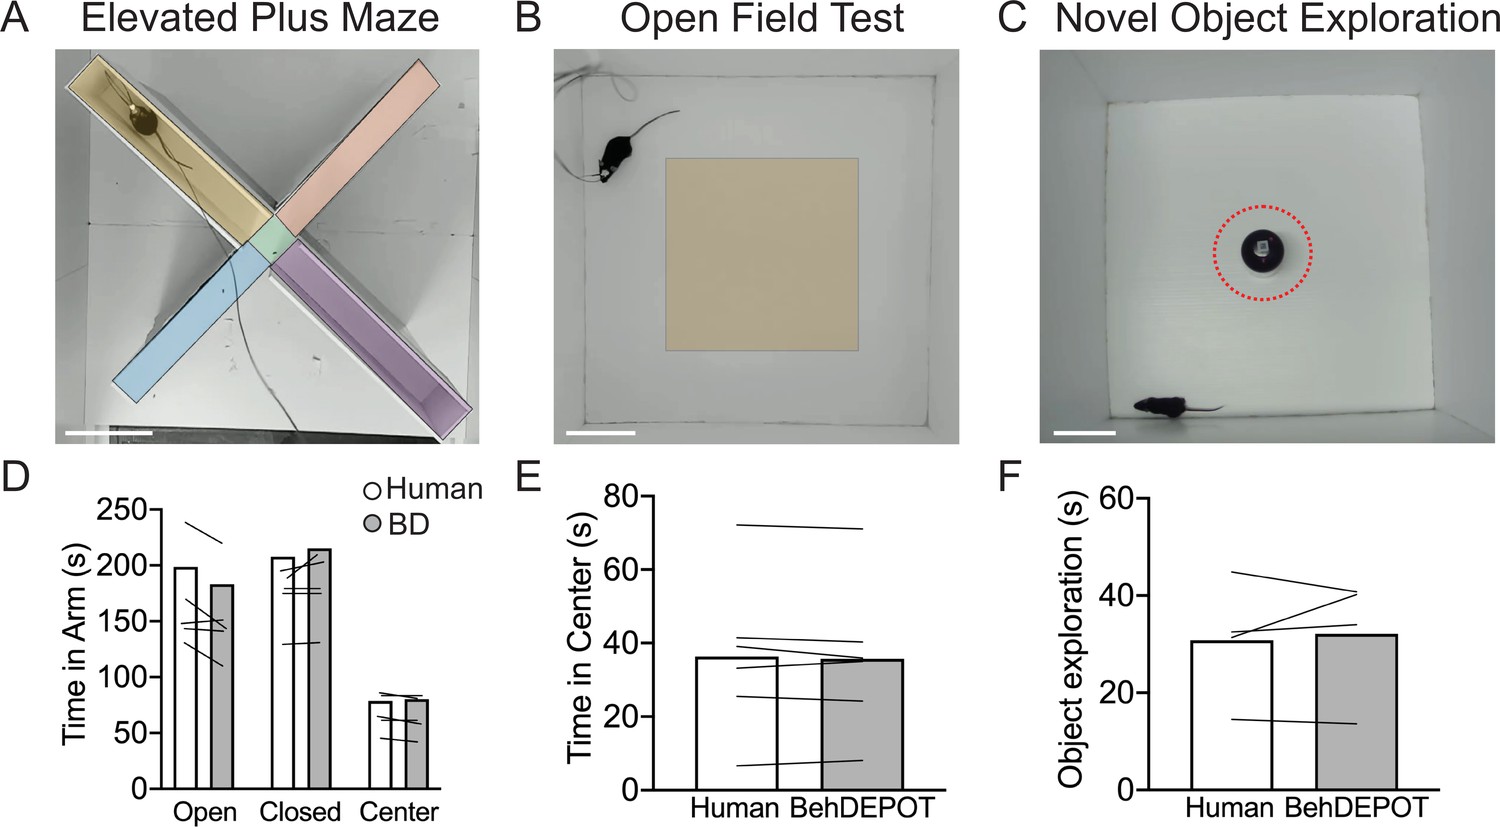
Use cases 3–5: EPM, OFT, NOE.
(A–C) Screens shot from Analysis Module showing user-defined ROIs in the EPM, OFT and NOE. Scale bars, 10 cm. (D) Statistical comparison of human vs. BehaviorDEPOT ratings for time in each arm (FRater (1, 4)=2.260, p=0.21, FArm(2,8)=12.69, P=0.003, Two-way ANOVA; Human vs BD: POpen = 0.15, PClosed = 0.66, PCenter = 0.99, Sidak post-hoc test, N=5 mice). (E) Statistical comparison of human vs. BehaviorDEPOT ratings for time in center (P=0.50, paired t-test, N=6 mice). (F) Statistical comparison of human vs. BehaviorDEPOT ratings for time in center (P=0.66, paired t-test, N=4 mice).
Figure 6
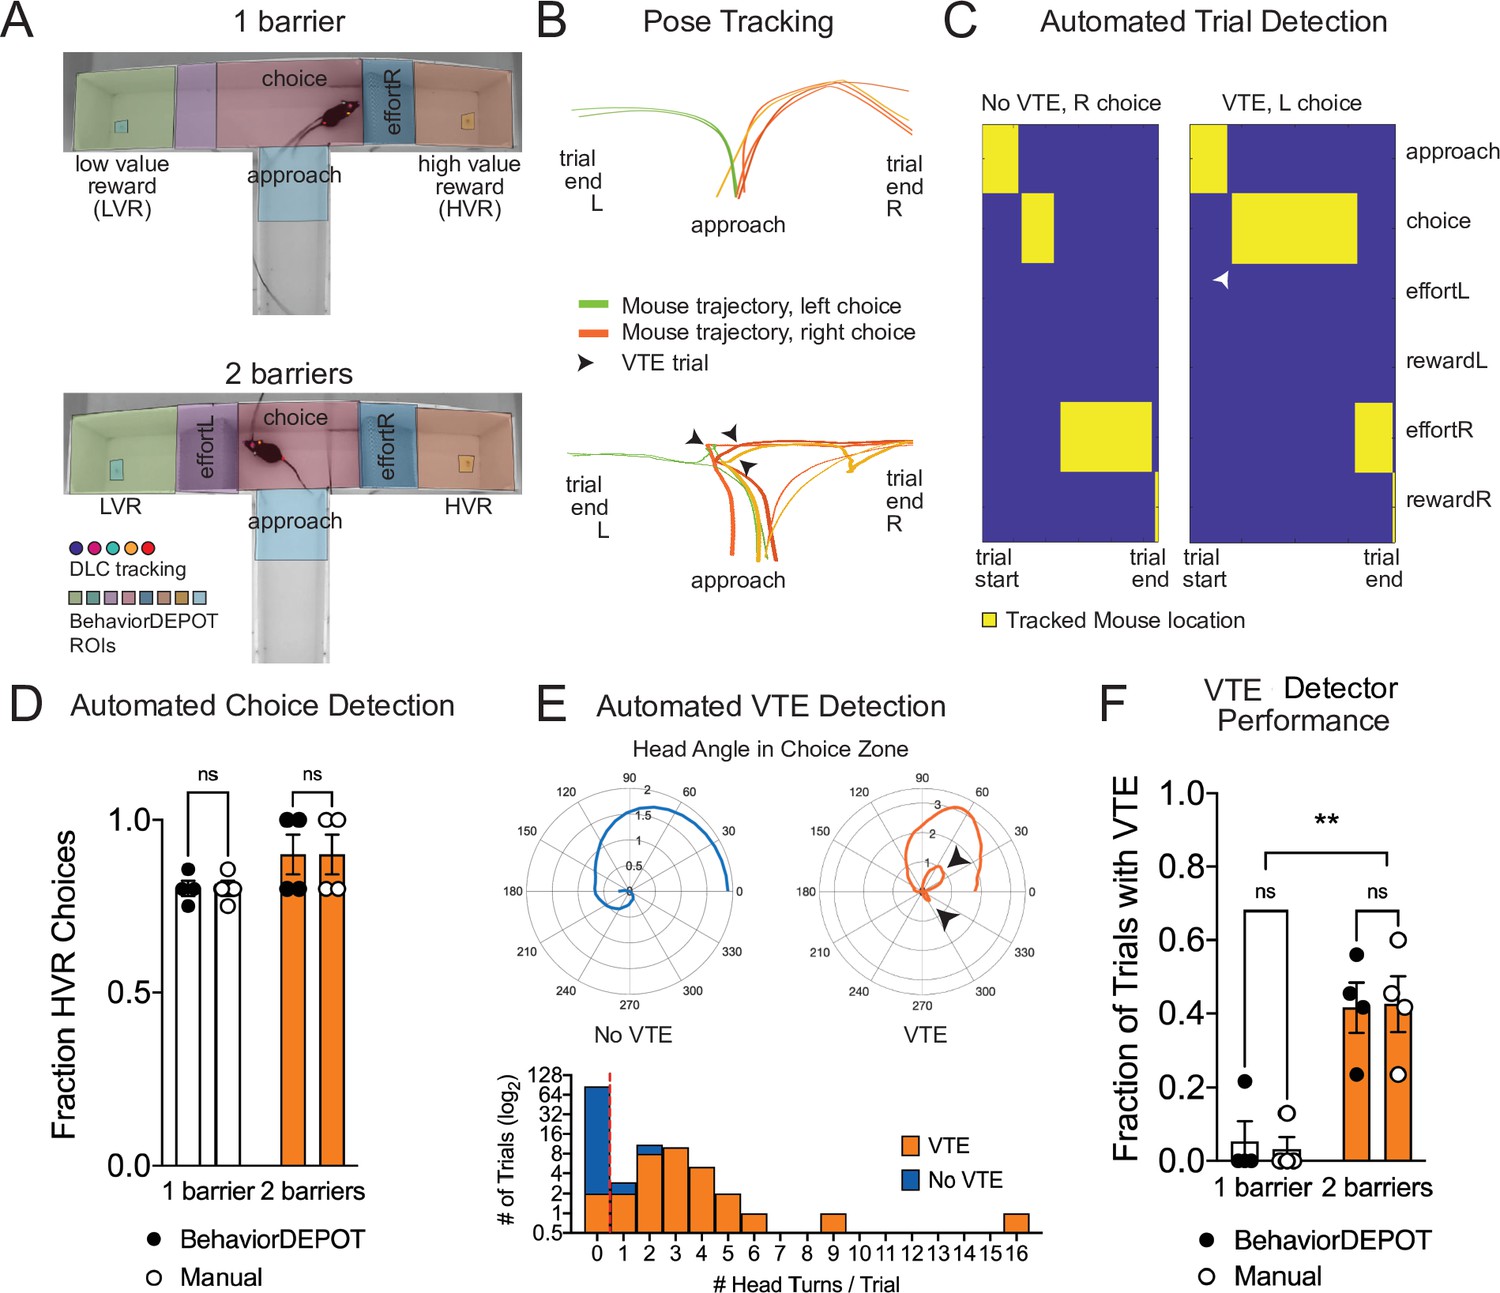
Use Case 6: Automated analysis of an effort-based decision-making T-maze task.
(A) Screen shots showing DLC tracking in a one-barrier (top) and two-barrier (bottom) T-maze and ROIs used for analysis in BehaviorDEPOT. (B) Sample mouse trajectories in a one-barrier (top) and two-barrier (bottom) T-maze. Lines represent individual trials for one mouse. Orange lines represent right choices, green lines represent left choices, and thick lines indicate vicarious trial and error (VTE). (C) Illustration of automated trial definitions. (D) Automated choice detection using BehaviorDEPOT. BehaviorDEPOT indicated choice with 100% accuracy (FRater(1,6)=6.84, P>0.99, FBarriers(1,7)=4.02, P=0.09; FSubject(6,7)=0.42, P=0.84, two-way ANOVA with Sidak post-hoc comparisons, 84 trials, N=4 mice). (E) Top: Polar plots show representative head angle trajectories when the mouse was in the choice zone during a trial without VTE (left) and with VTE (right). Bottom: Histogram of head turns per trial for trials without VTE (blue) and with VTE (orange). Red dotted line indicates selected threshold. (F) Fraction of trials with VTE during one-barrier and two-barrier sessions, comparing manual annotations to BehaviorDEPOT classification (FRaterxBarriers(1,6)=0.04, P=0.85, FRater(1,7)=0.03, P=0.85; FBarriers(1,6)=22.9, P=0.003, two-way ANOVA with Sidak post-hoc comparisons, 102 trials, N=4 mice). Error bars represent S.E.M.
Figure 7
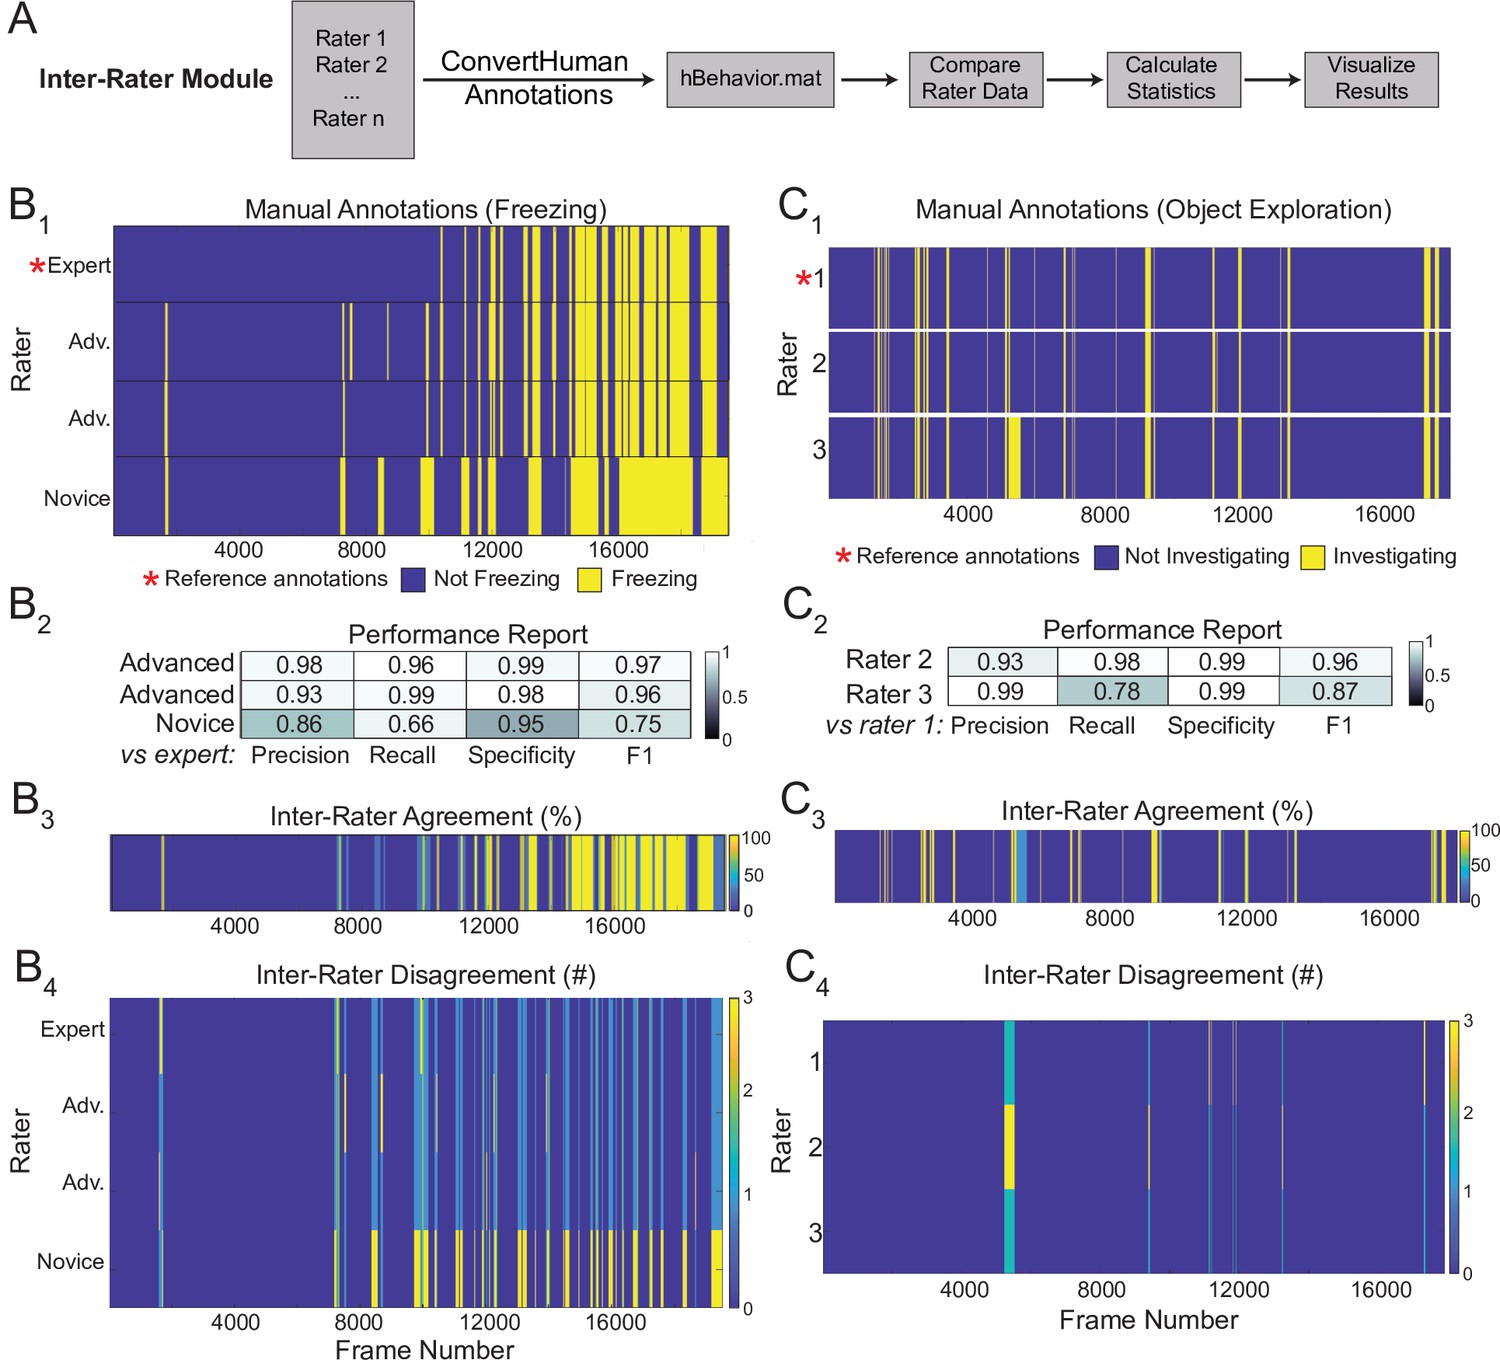
Sample outputs of the Inter-Rater Module.
(A) The Inter-Rater Module imports reference annotations, converts them to a BehaviorDEPOT-friendly format, aligns annotations, and reports statistics about agreement between raters. (B1) Alignment of freezing annotations from four raters with different levels of annotation experience. (B2) Summary report of inter-rater error rates for freezing. (B3) Visualizations of framewise agreement levels for multiple raters for freezing. (B4) Visualizations of framewise disagreements for multiple raters for freezing. (C1) Alignment of NOE annotations from three raters with different levels of annotation experience. (C2) Summary report of inter-rater error rates for NOE. (C3) Visualizations of framewise agreement levels for multiple raters for NOE. (C4) Visualizations of framewise disagreements for multiple raters for NOE.
Figure 8
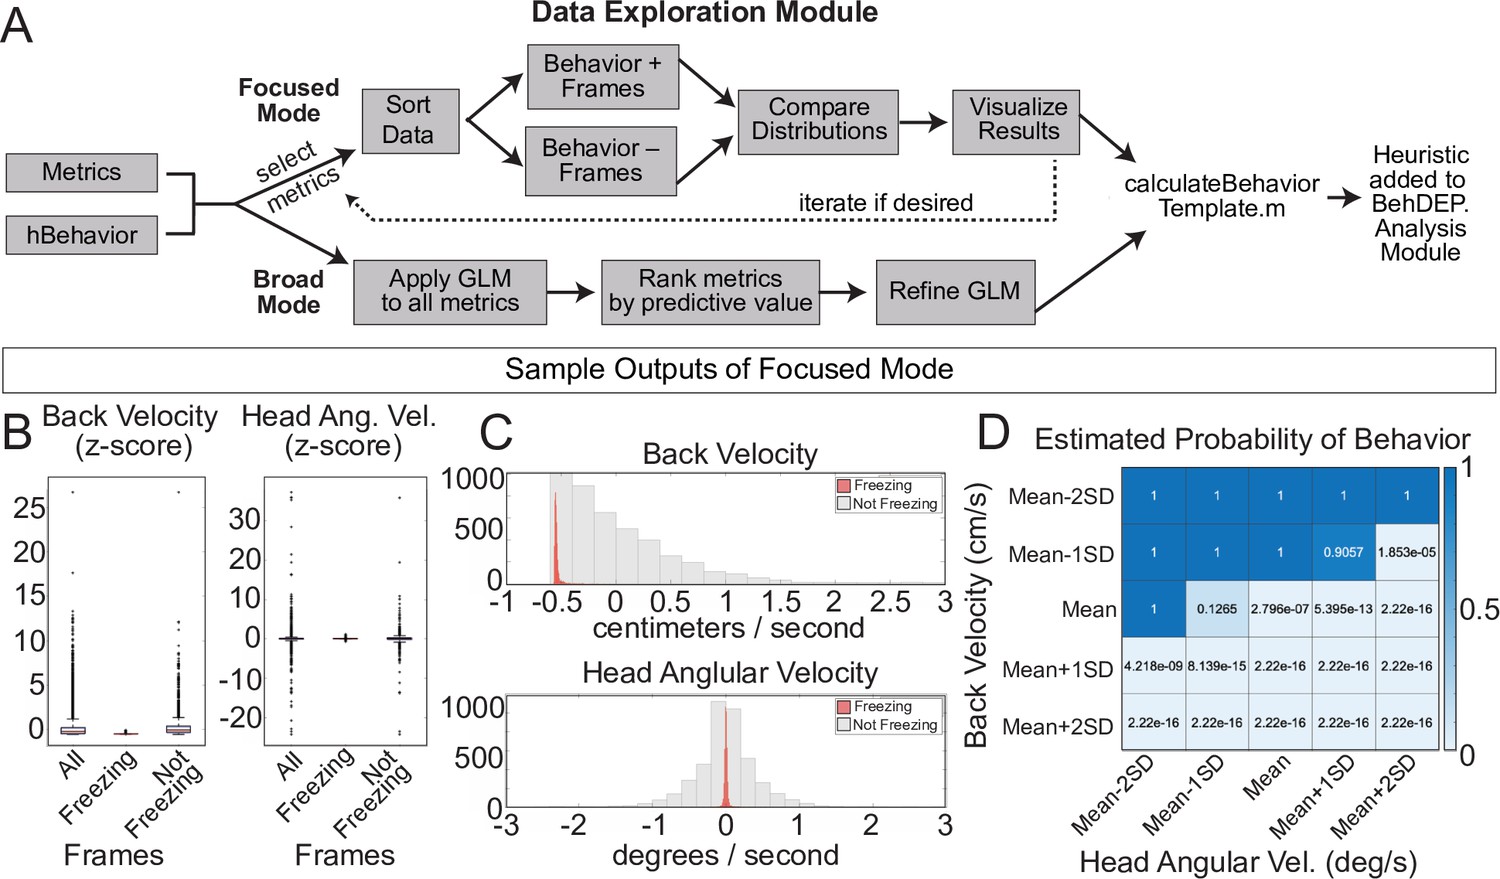
The Data Exploration Module.
(A) The Data Exploration Module takes in metrics from the Analysis Module along with reference annotations. It sorts the data, separating frames containing the behavior of interest from those without and then visualizes and compares the distribution of values for metrics of interest. (B) Distributions of Z-scored values for head velocity (left) and change in head angle (right) are distinct for freezing vs. not freezing frames. Box plots represent median, 25th, and 75th percentile. Error bars extend to the most extreme point that is not an outlier (C) Histograms showing distribution of Z-scored values for back velocity (top) and head angular velocity (bottom) for freezing (red) vs. not-freezing (grey) frames. (D) A generalized linear model (GLM) computes the predictive power of given metrics for frames containing the behavior of interest.
Figure 9

Analysis of External Data using Optimization and Validation Modules.
(A) Optimization Module workflow. This module sweeps through a range of thresholds for metrics calculated based on tracked points and then compares the resulting behavioral classification to human annotations. (B1,2) DLC tracking in rat and mouse freezing in videos obtained from other laboratories. (C1,2) Heatmaps showing F1 scores following iterative sweeps through a range of thresholds for two metrics: back velocity and angular velocity of the head. Red box marks highest F1 score. (D1,2) F1 scores from a subsequent sweep through two additional value ranges for window width and count threshold from the smoothing algorithm. Red box marks highest F1 score. (E) Validation Module workflow. (F) The BehaviorDEPOT heuristic performed robustly on videos of rats recorded in a different lab (Precision = 0.93; Recall = 0.88; F1=0.91; Specificity = 0.96). BehaviorDEPOT freezing detection was comparable to highly trained human raters (N=4 videos, P=0.89, Mann-Whitney U). (G) The BehaviorDEPOT heuristic performed robustly on videos of mice recorded in a different lab (Precision = 0.98; Recall = 0.92; F1=0.95; Specificity = 0.95). BehaviorDEPOT freezing detection was comparable to highly trained human raters (N=4 videos, P=0.49, Mann-Whitney U).
Figure 10
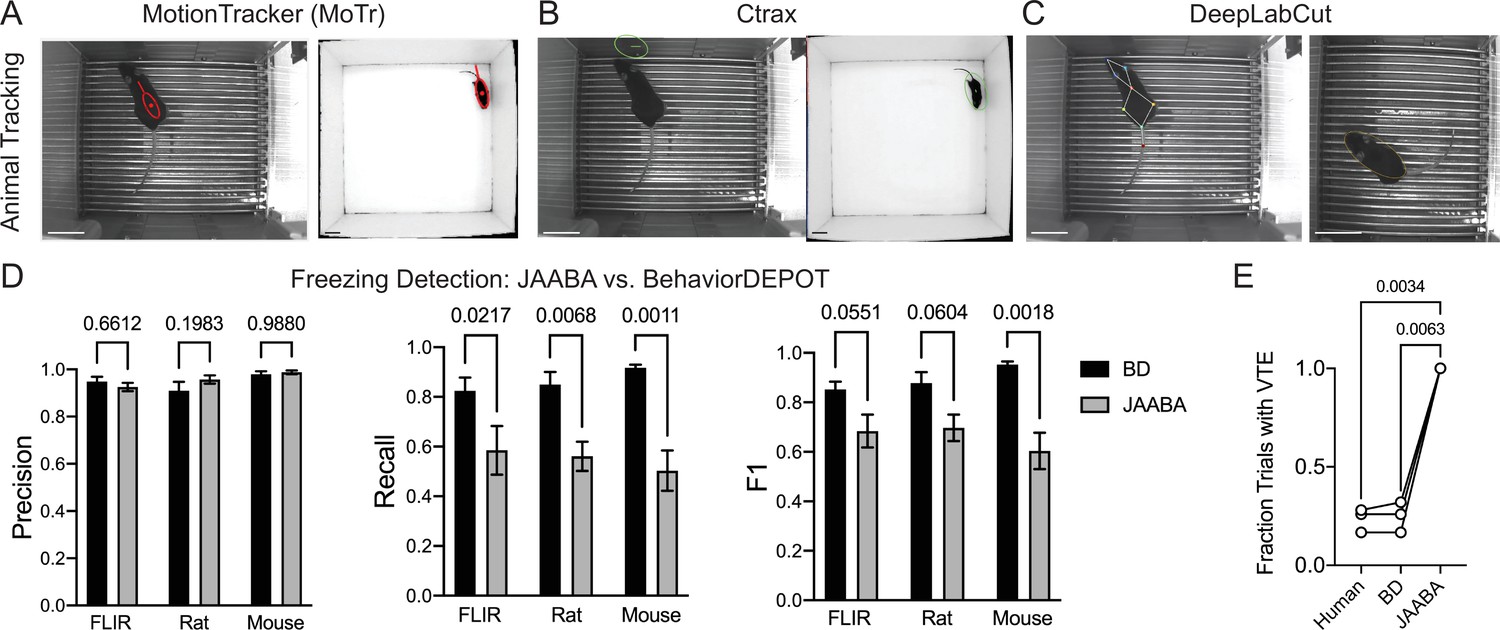
Comparisons with JAABA.
(A) MoTr tracking in a standard fear conditioning chamber (left) and an open field (right). (B) Ctrax tracking in a standard fear conditioning chamber (left) and an open field (right). (C) DLC tracking in a standard fear conditioning chamber (left) and estimated ellipse based on keypoint tracking (right). (D) Quantification of freezing detection errors for BehaviorDEPOT and JAABA (Precision: FClassifier(1,12)=0.58, P=0.46; Recall: FClassifier(1,11)=51.27, P<0.001; F1: FClassifier(1,11)=51.27, P<0.001, N=4–6 videos, 2-way ANOVA with Sidak’s multiple comparison test). (E) Comparison of VTE detection by human, BehaviorDEPOT, and JAABA (FClassifier(1.072,2.143)=340.2, P=0.0021, N=3 videos, Repeated measures one-way ANOVA with Tukey multiple comparison’s test). Scale bars, 5 cm.
Additional files
-
Supplementary file 1
List and descriptions of tracked keypoints and keypoints calculated by the Analysis Module.
- https://cdn.elifesciences.org/articles/74314/elife-74314-supp1-v1.xlsx
-
Supplementary file 2
List and descriptions of metrics calculated by the Analysis Module.
- https://cdn.elifesciences.org/articles/74314/elife-74314-supp2-v1.xlsx
-
Supplementary file 3
List of required inputs and automatically generated outputs for every module.
- https://cdn.elifesciences.org/articles/74314/elife-74314-supp3-v1.xlsx
-
Supplementary file 4
Descriptions of error rates in DLC keypoint tracking networks and descriptions of held-out video sets used to test each heuristic.
- https://cdn.elifesciences.org/articles/74314/elife-74314-supp4-v1.xlsx
-
Supplementary file 5
Descriptions of DLC models used to assess the relationship between DLC mean error and freezing heuristic performance.
- https://cdn.elifesciences.org/articles/74314/elife-74314-supp5-v1.xlsx
-
MDAR checklist
- https://cdn.elifesciences.org/articles/74314/elife-74314-mdarchecklist1-v1.docx
Download links
A two-part list of links to download the article, or parts of the article, in various formats.
Downloads (link to download the article as PDF)
Open citations (links to open the citations from this article in various online reference manager services)
Cite this article (links to download the citations from this article in formats compatible with various reference manager tools)
BehaviorDEPOT is a simple, flexible tool for automated behavioral detection based on markerless pose tracking
eLife 11:e74314.
https://doi.org/10.7554/eLife.74314


