Connexin hemichannels with prostaglandin release in anabolic function of bone to mechanical loading
- Department of Biochemistry and Structural Biology, University of Texas Health Science Center at San Antonio, United States
- School of Life Sciences, Northwestern Polytechnical University, China
- Department of Biomedical Engineering and Chemical Engineering, University of Texas at San Antonio, United States
- Department of Orthopedics, The Second Xiangya Hospital, Central South University, China
Figures
Figure 1 with 3 supplements
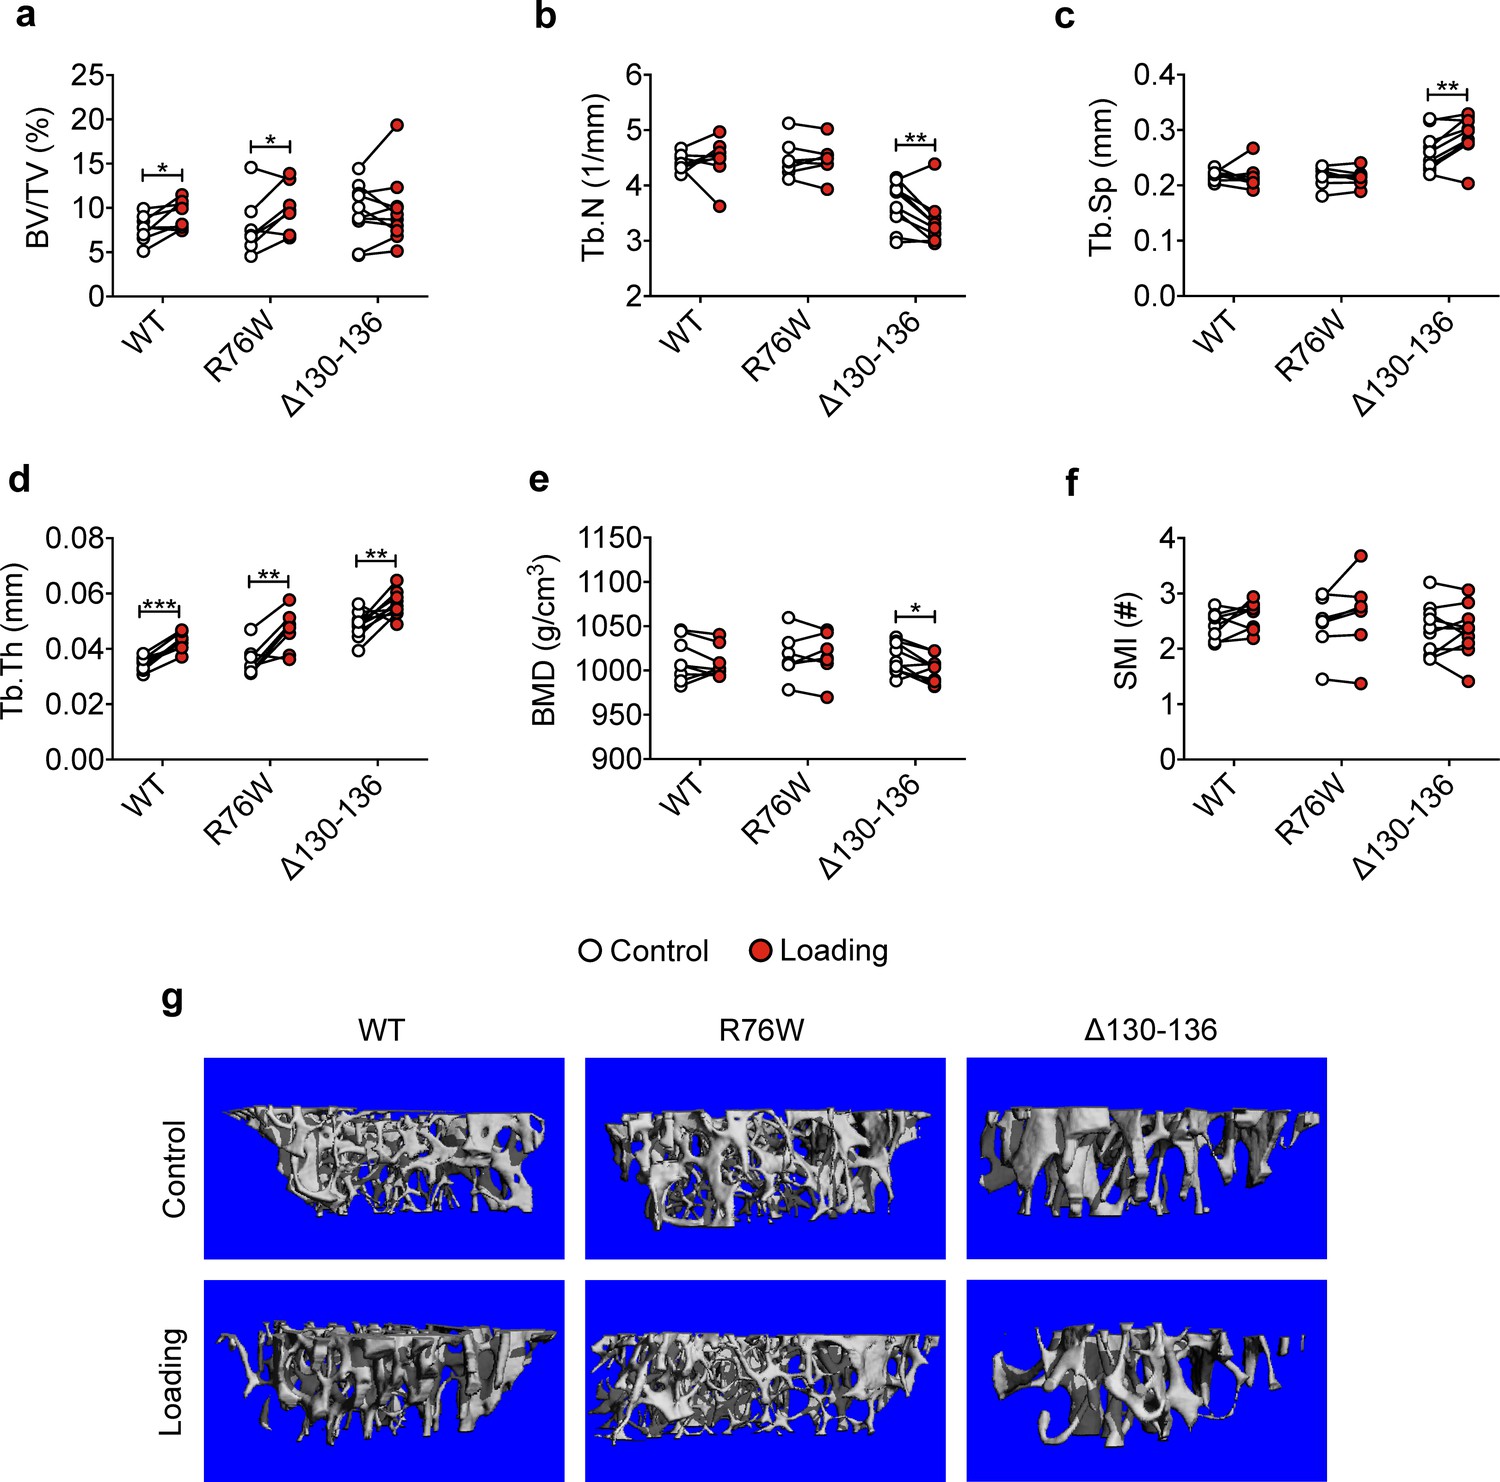
Attenuation or reversal of anabolic responses to mechanical loading in tibial metaphyseal trabecular bone of ∆130–136 mice.
μCT was used to assess metaphyseal trabecular bone of WT, R76W, and ∆130–136 mice; (a) bone volume fraction, (b) trabecular number, (c) trabecular separation, (d) trabecular thickness, (e) bone mineral density, and (f) structure model index. n = 7–10/group. (g) Representative 3D models of the metaphyseal trabecular bone for all groups. Data are expressed as mean ± SD. *, p < 0.05; **, p < 0.01; ***, p < 0.001. Statistical analysis was performed using paired t-test for loaded and contralateral, unloaded tibias within each genotype.
-
Figure 1—source data 1
Trabecular micro-CT data of transgenic and wild-type mice.
- https://cdn.elifesciences.org/articles/74365/elife-74365-fig1-data1-v1.xlsx
Figure 1—figure supplement 1
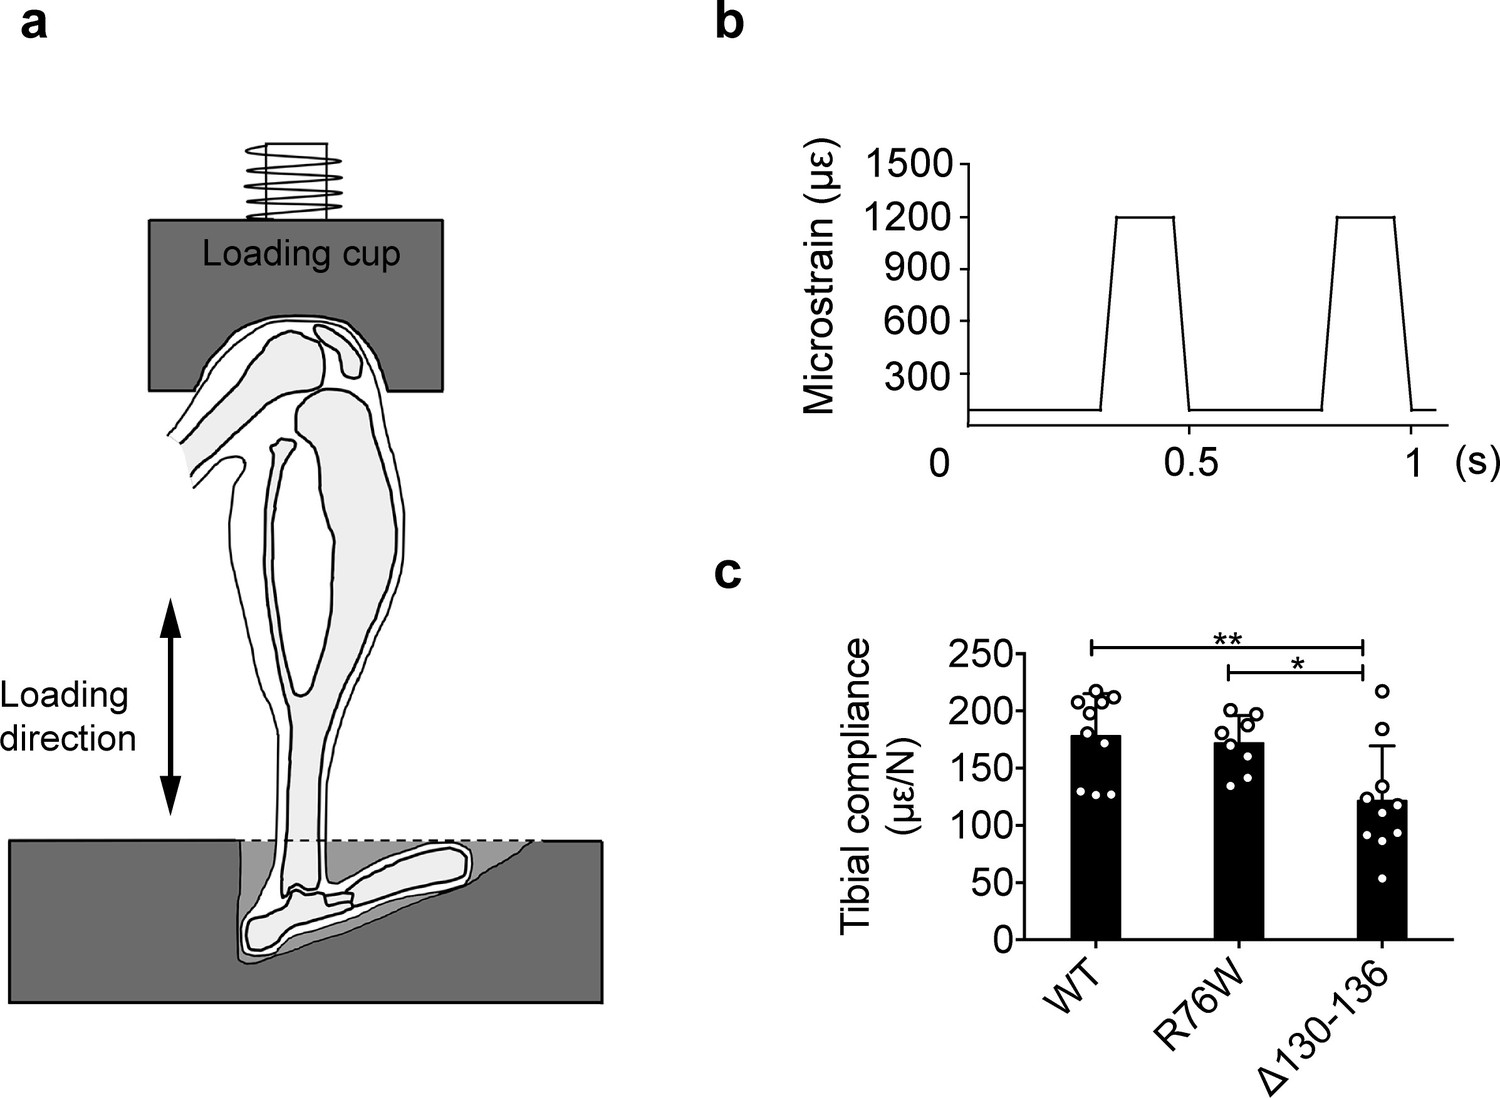
Experimental setup for in vivo axial loading.
(a) Diagram of the left tibia positioned at the loading device and the direction of loading. (b) Schematic graph of 1 s of the daily 5 min loading signal. Approximately 1200 microstrain was detected on the medial mid-shaft surface of the tibia. (c) The average compliance of the relationship between applied load and resulting strain on the medial mid-shaft of WT, R76W, and ∆130–136 mice. n = 8–10/group. Data are expressed as mean ± SD. *, p < 0.05; **, p < 0.01. Statistical analysis was performed using one-way ANOVA with Tukey test among groups with different genotypes.
-
Figure 1—figure supplement 1—source data 1
Raw data of compliances for Figure 1—figure supplement 1c.
- https://cdn.elifesciences.org/articles/74365/elife-74365-fig1-figsupp1-data1-v1.xlsx
Figure 1—figure supplement 2
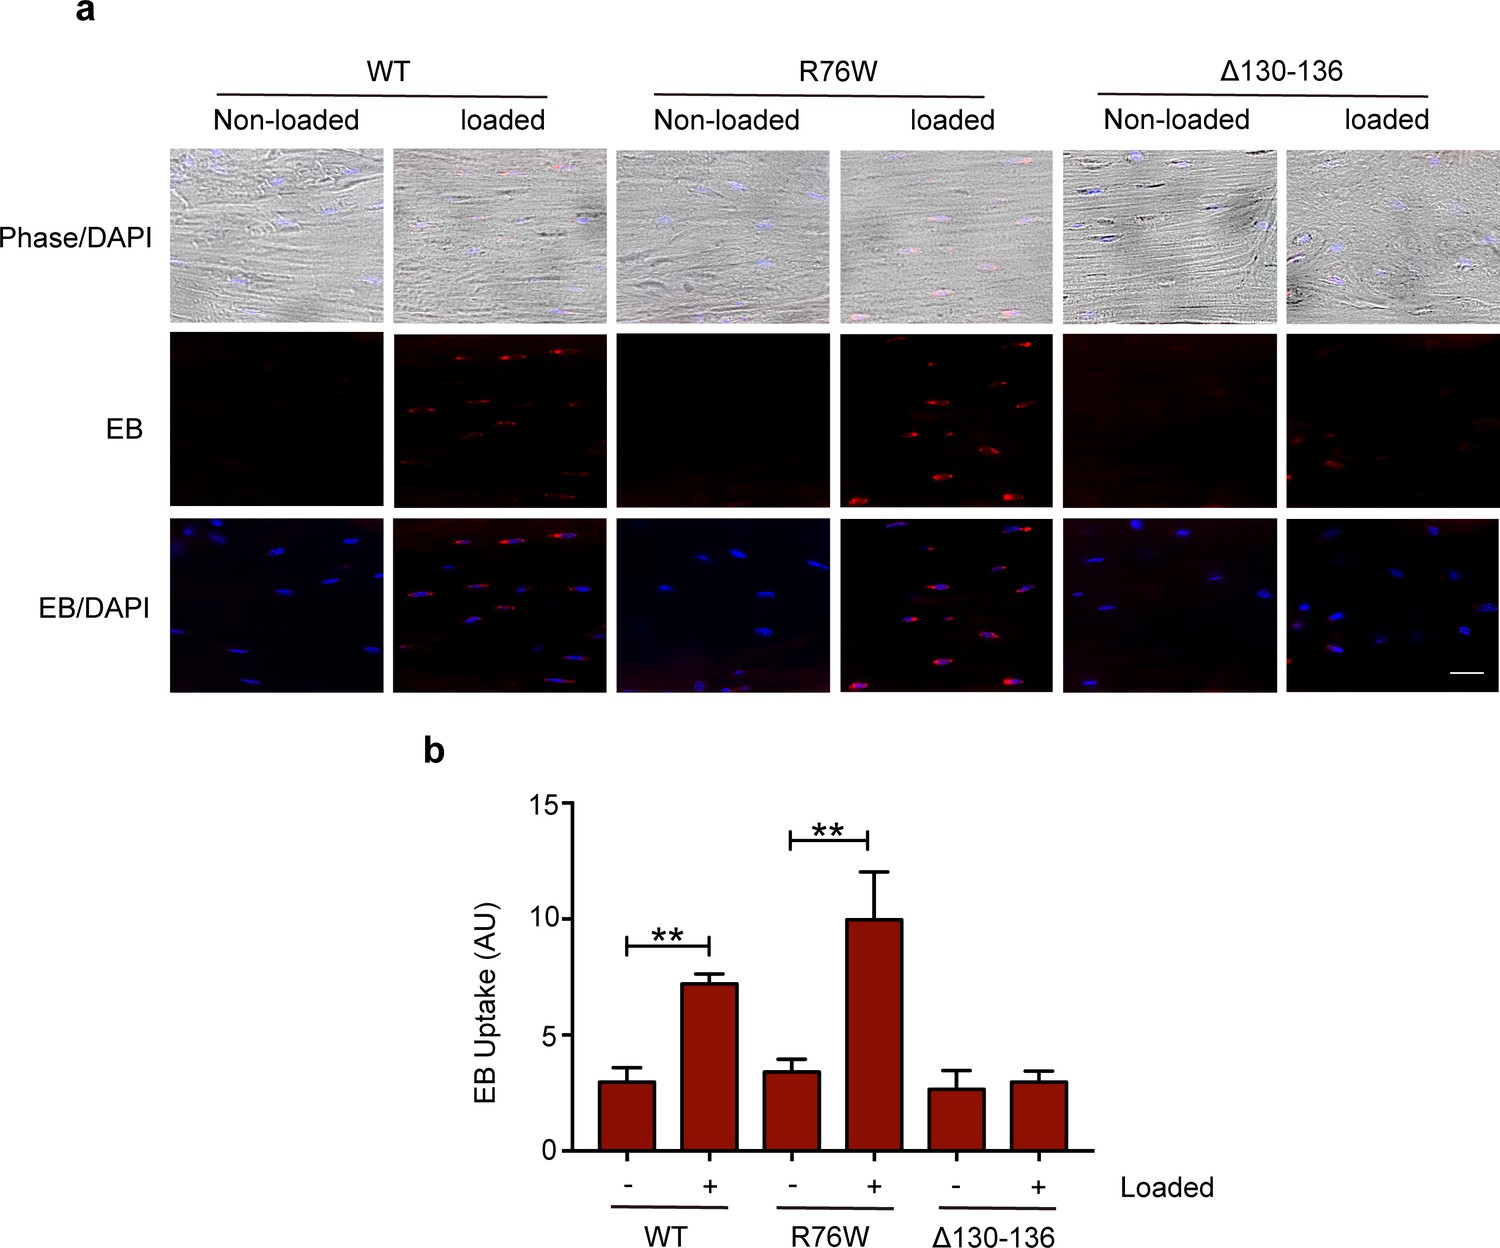
Hemichannel opening is inhibited in ∆130–136 mice.
(a) Representative images of Evans blue (EB) dye uptake in control and loaded tibial bone in WT, R76W, and ∆130–136 mice. Scale bar, 60 μm. (b) Quantitative analysis of Evans blue (EB) dye uptake. n = 3/group. Data are represented as mean ± SD. **, p< 0.01. Statistical analysis was performed using paired t-test for loaded and contralateral within each genotype.
-
Figure 1—figure supplement 2—source data 1
Raw data of dye uptake for Figure 1—figure supplement 2b.
- https://cdn.elifesciences.org/articles/74365/elife-74365-fig1-figsupp2-data1-v1.xlsx
Figure 1—figure supplement 3
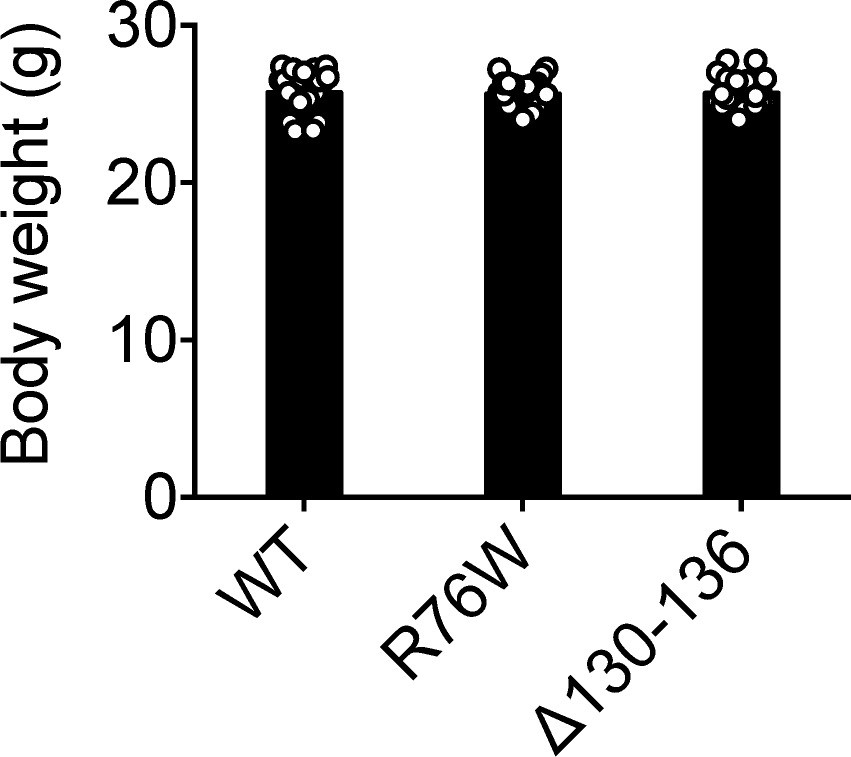
Body weights of transgenic mice.
The body weights of WT, R76W, and ∆130–136 mice at the beginning of mechanical loading. n = 22/group. Data are expressed as mean ± SD. Statistical analysis was performed using one-way ANOVA with Tukey test among different genotypes.
-
Figure 1—figure supplement 3—source data 1
Raw data of body weight for Figure 1—figure supplement 3.
- https://cdn.elifesciences.org/articles/74365/elife-74365-fig1-figsupp3-data1-v1.xlsx
Figure 2
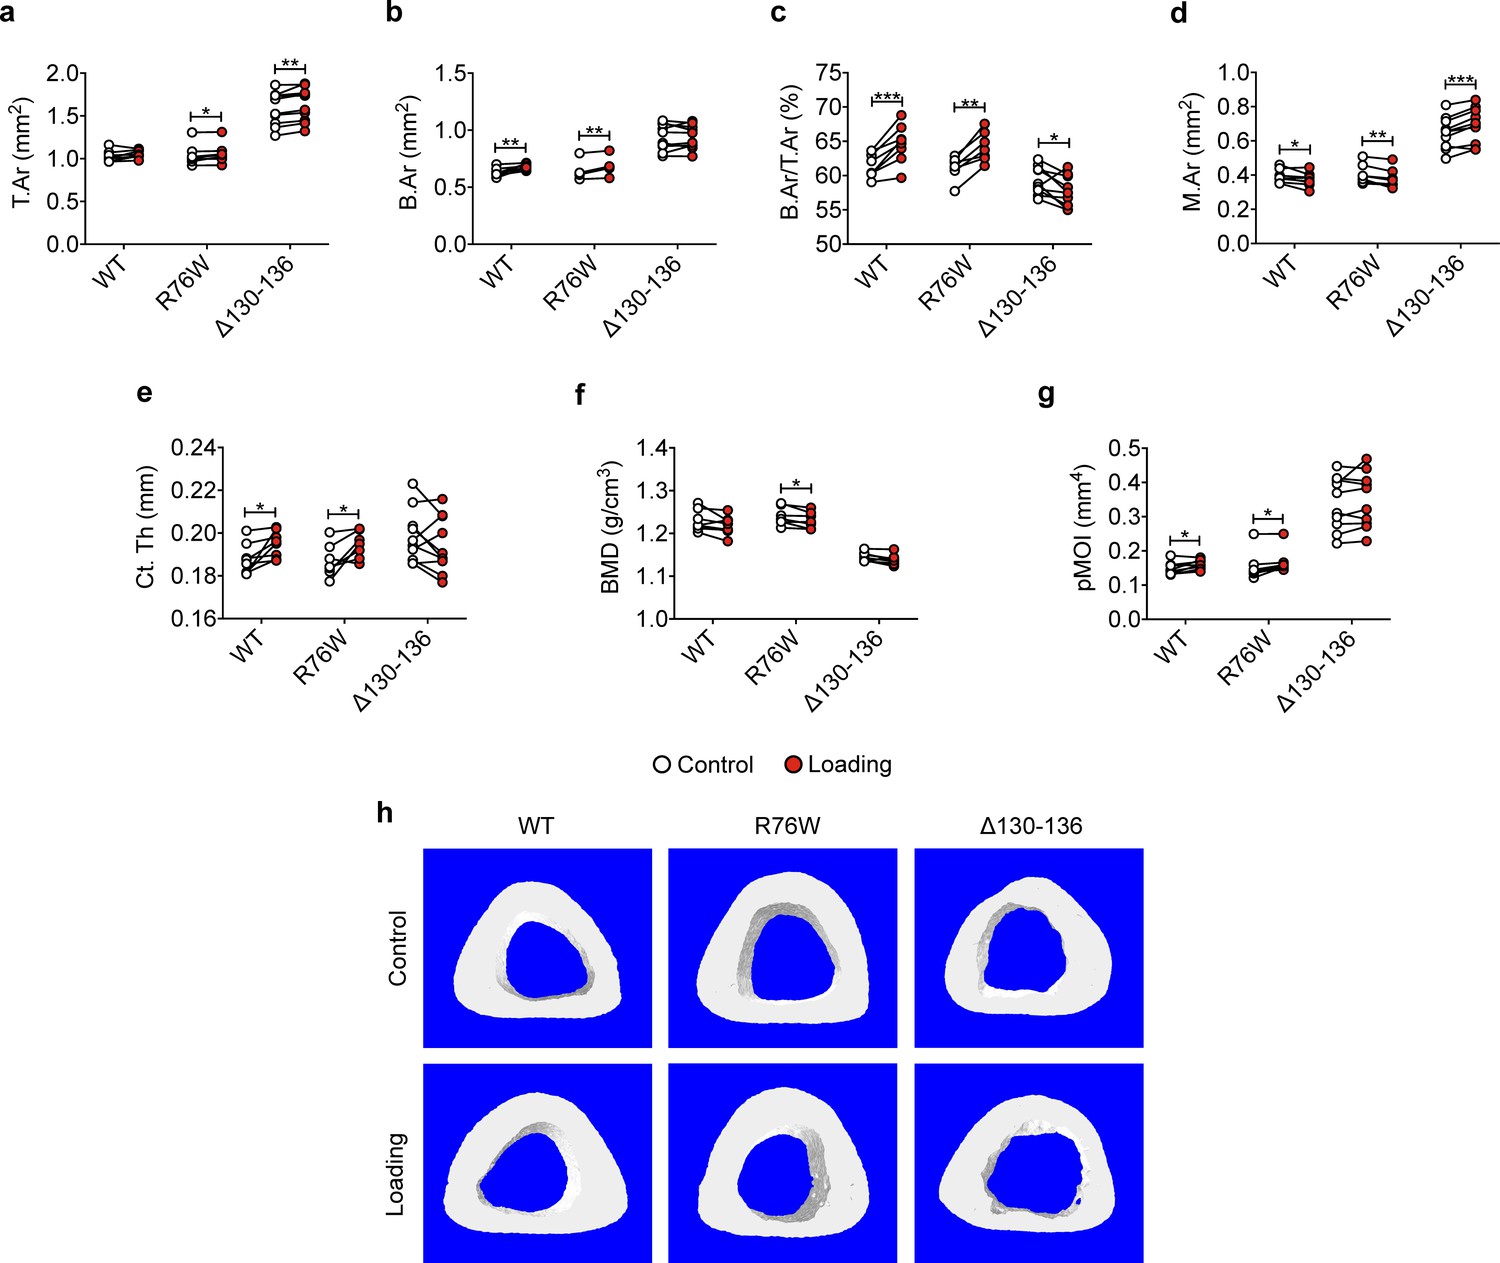
Attenuation or reversal of anabolic responses to mechanical loading in midshaft cortical bone of ∆130–136 mice.
μCT was used to assess tibial midshaft cortical bone (50% site) of WT, R76W, and ∆130–136 mice; (a) total area, (b) bone area, (c) bone area fraction, (d) bone marrow area, (e) cortical thickness, (f) bone mineral density, and (g) polar moment of inertia. n = 7–10/group. (h) Representative 3D models of the tibial midshaft cortical bone for all groups. Data are expressed as mean ± SD. *, p < 0.05; **, p < 0.01; **, p < 0.001. Statistical analysis was performed using paired t-test for loaded and contralateral, unloaded tibias within each genotype.
-
Figure 2—source data 1
Cortical micro-CT data of transgenic and wild-type mice.
- https://cdn.elifesciences.org/articles/74365/elife-74365-fig2-data1-v1.xlsx
Figure 3
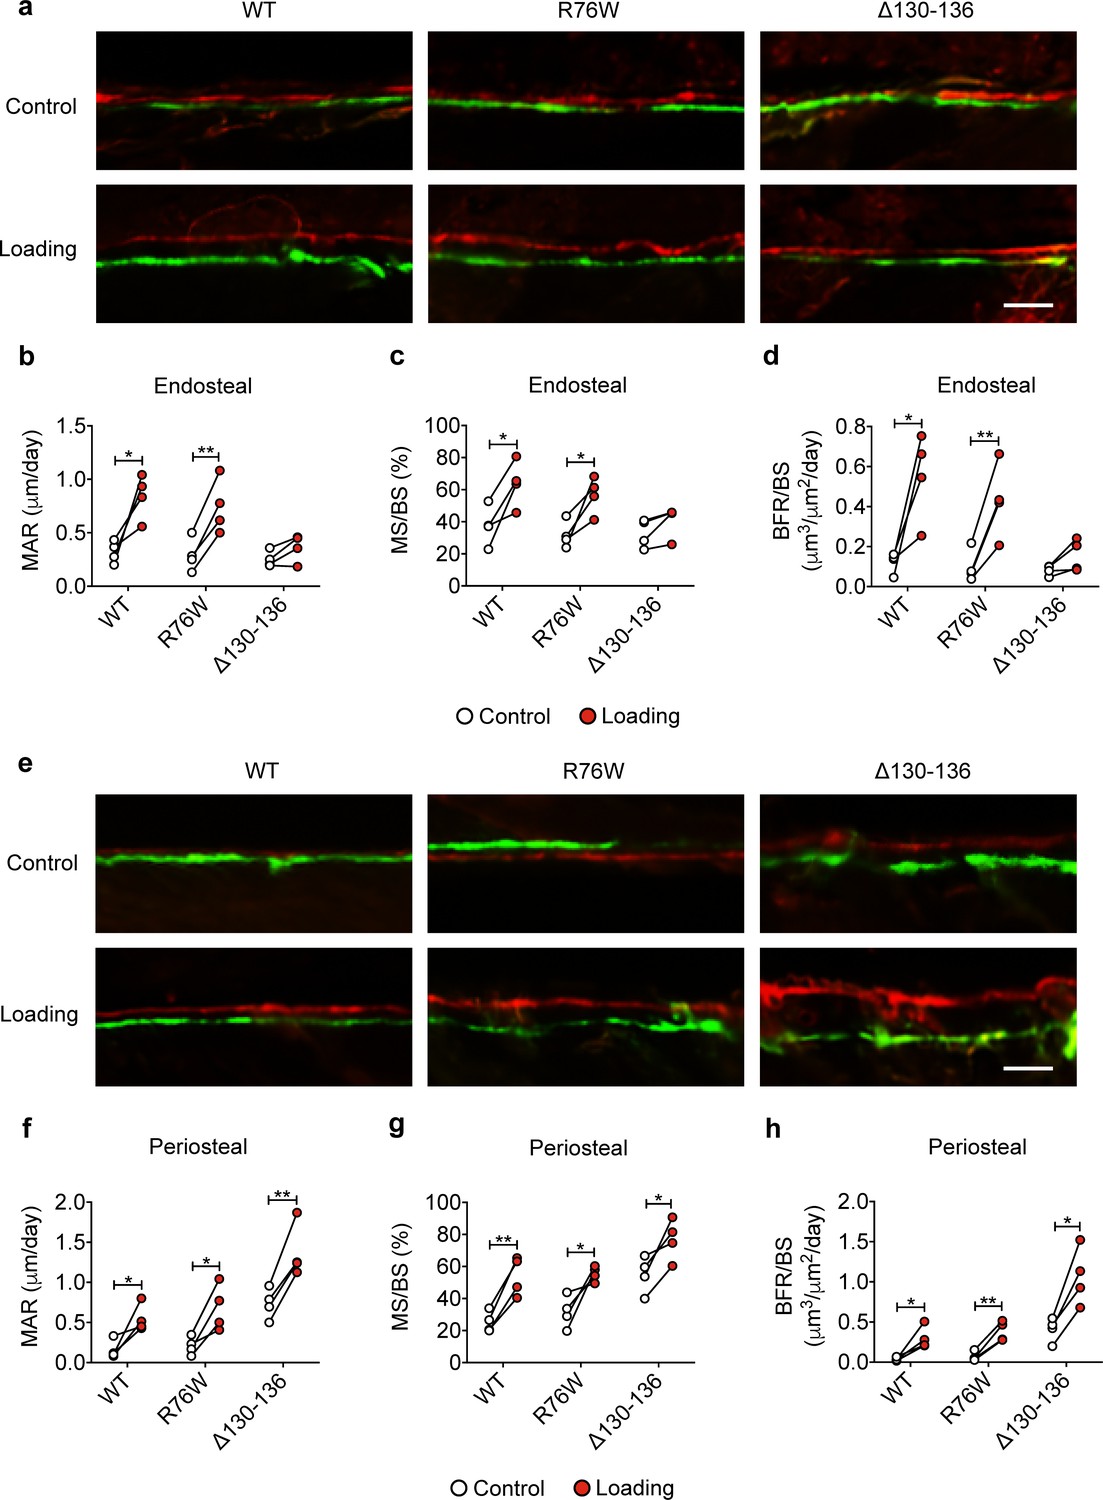
Reduced midshaft endosteal osteogenic responses to mechanical loading in ∆130–136 mice.
Dynamic histomorphometric analyses were performed on the tibial midshaft cortical endosteal and periosteal surfaces after 2 weeks of tibial loading of WT, R76W, and ∆130–136 mice. Representative images of calcein (green) alizarin (red) double labeling on (a) endosteal and (e) periosteal surface. Scale bar: 50 μm. Mineral apposition rate (MAR) (b, f), mineralizing surface/bone surface (MS/BS) (c, g), and bone formation rate (BFR/BS) (d, h) were assessed for endosteal (b–d) and periosteal (f–h) surfaces n = 4/group. Data are expressed as mean ± SD. *, p < 0.05; **, p < 0.01. Statistical analysis was performed using paired t-test for loaded and contralateral, unloaded tibias within each genotype.
-
Figure 3—source data 1
Raw data of periosteal and endosteal bone formation of transgenic and wild-type mice.
- https://cdn.elifesciences.org/articles/74365/elife-74365-fig3-data1-v1.xlsx
Figure 4 with 1 supplement

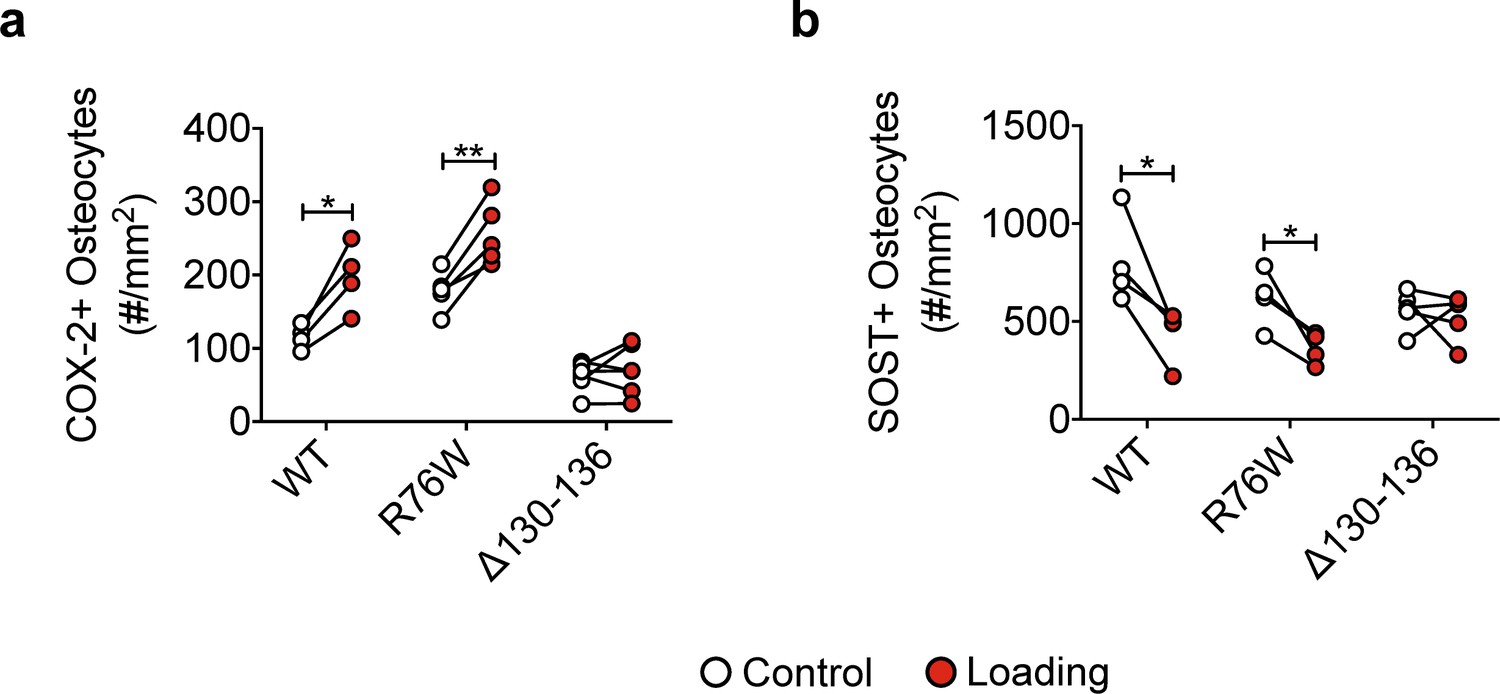
Inhibition of the loading-induced PGE2 secretion and osteoblast activity, and promotion of osteoclast activity in ∆130–136 mice.
(a) ELISA analysis of PGE2 in bone marrow-flushed tibial diaphysis after 5 days of tibial loading, in WT, R76W, and ∆130–136 mice. n = 6–8/group. (b, c) Representative images and quantitative analysis of COX-2-postive osteocytes (black arrows) in the tibial midshaft cortical bone after 2 weeks of loading in WT, R76W, and ∆130–136 mice. Scale bar: 30 μm. n = 4–6/group. (d, e) Representative images and quantitative analysis of the SOST-positive osteocytes (black arrows) in tibial midshaft cortical bone after 2 weeks of tibial loading in WT, R76W, and ∆130–136 mice. Scale bar: 30 μm. n = 4–5/group. (f) Gene expression of Sost in bone marrow-flushed tibial diaphysis of WT, R76W, and ∆130–136 mice. n = 5/group. (g and h) Toluidine blue staining was used to determine the number of endosteal osteoblasts (yellow arrows) on tibial midshaft cortical bone in WT, R76W, and ∆130–136 mice after 2 weeks of loading. Scale bar: 30 μm; n = 6/group. mRNA expression of osteoblast markers, Runx2 (i), Bglap2 (j) and Dmp1 (k) in bone marrow-flushed tibial diaphysis of WT, R76W, and ∆130–136 mice. n = 4–5/group. (l) Representative images of tibial midshaft endosteal surface stained for TRAP (black arrows). Scale bar: 30 μm. (m and n) Histomorphometric quantitation of osteoclasts per bone perimeter (m) and osteoclast surface per bone perimeter (n) (n = 4–5/group). All quantitative data are expressed as mean ± SD. *, p < 0.05; **, p < 0.01; ***, p < 0.001. Statistical analysis was performed using paired t-test for loaded and contralateral, unloaded tibias within each genotype.
-
Figure 4—source data 1
Raw data of PGE2 level for Figure 4a.
- https://cdn.elifesciences.org/articles/74365/elife-74365-fig4-data1-v1.xlsx
-
Figure 4—source data 2
Raw data of immumohistochemical, TRAP and toluidine blue staining of transgenic and wild-type mice.
- https://cdn.elifesciences.org/articles/74365/elife-74365-fig4-data2-v1.xlsx
-
Figure 4—source data 3
Raw data of RT-qPCR of transgenic and wild-type mice.
- https://cdn.elifesciences.org/articles/74365/elife-74365-fig4-data3-v1.xlsx
Figure 4—figure supplement 1
Bone marker protein expression in WT, R76W, and ∆130–136 mice.
(a) Quantitative analysis of the COX-2-positive osteocytes per bone area in tibial midshaft cortical bone after 2 weeks of mechanical loading in WT, R76W, and ∆130–136 mice. n = 4–6/group. (b) Quantitative analysis of the SOST -positive osteocytes per bone area in tibial midshaft cortical bone after 2 weeks of mechanical loading in WT, R76W, and ∆130–136 mice. n = 4–6/group. Data are expressed as mean ± SD. *, p < 0.05; **, p < 0.01; ***, p < 0.001. Statistical analysis was performed using paired t-test for loaded and contralateral within each genotype.
-
Figure 4—figure supplement 1—source data 1
Raw data of COX-2 and SOST quantification for Figure 4—figure supplement 1a,b.
- https://cdn.elifesciences.org/articles/74365/elife-74365-fig4-figsupp1-data1-v1.xlsx
Figure 5 with 2 supplements
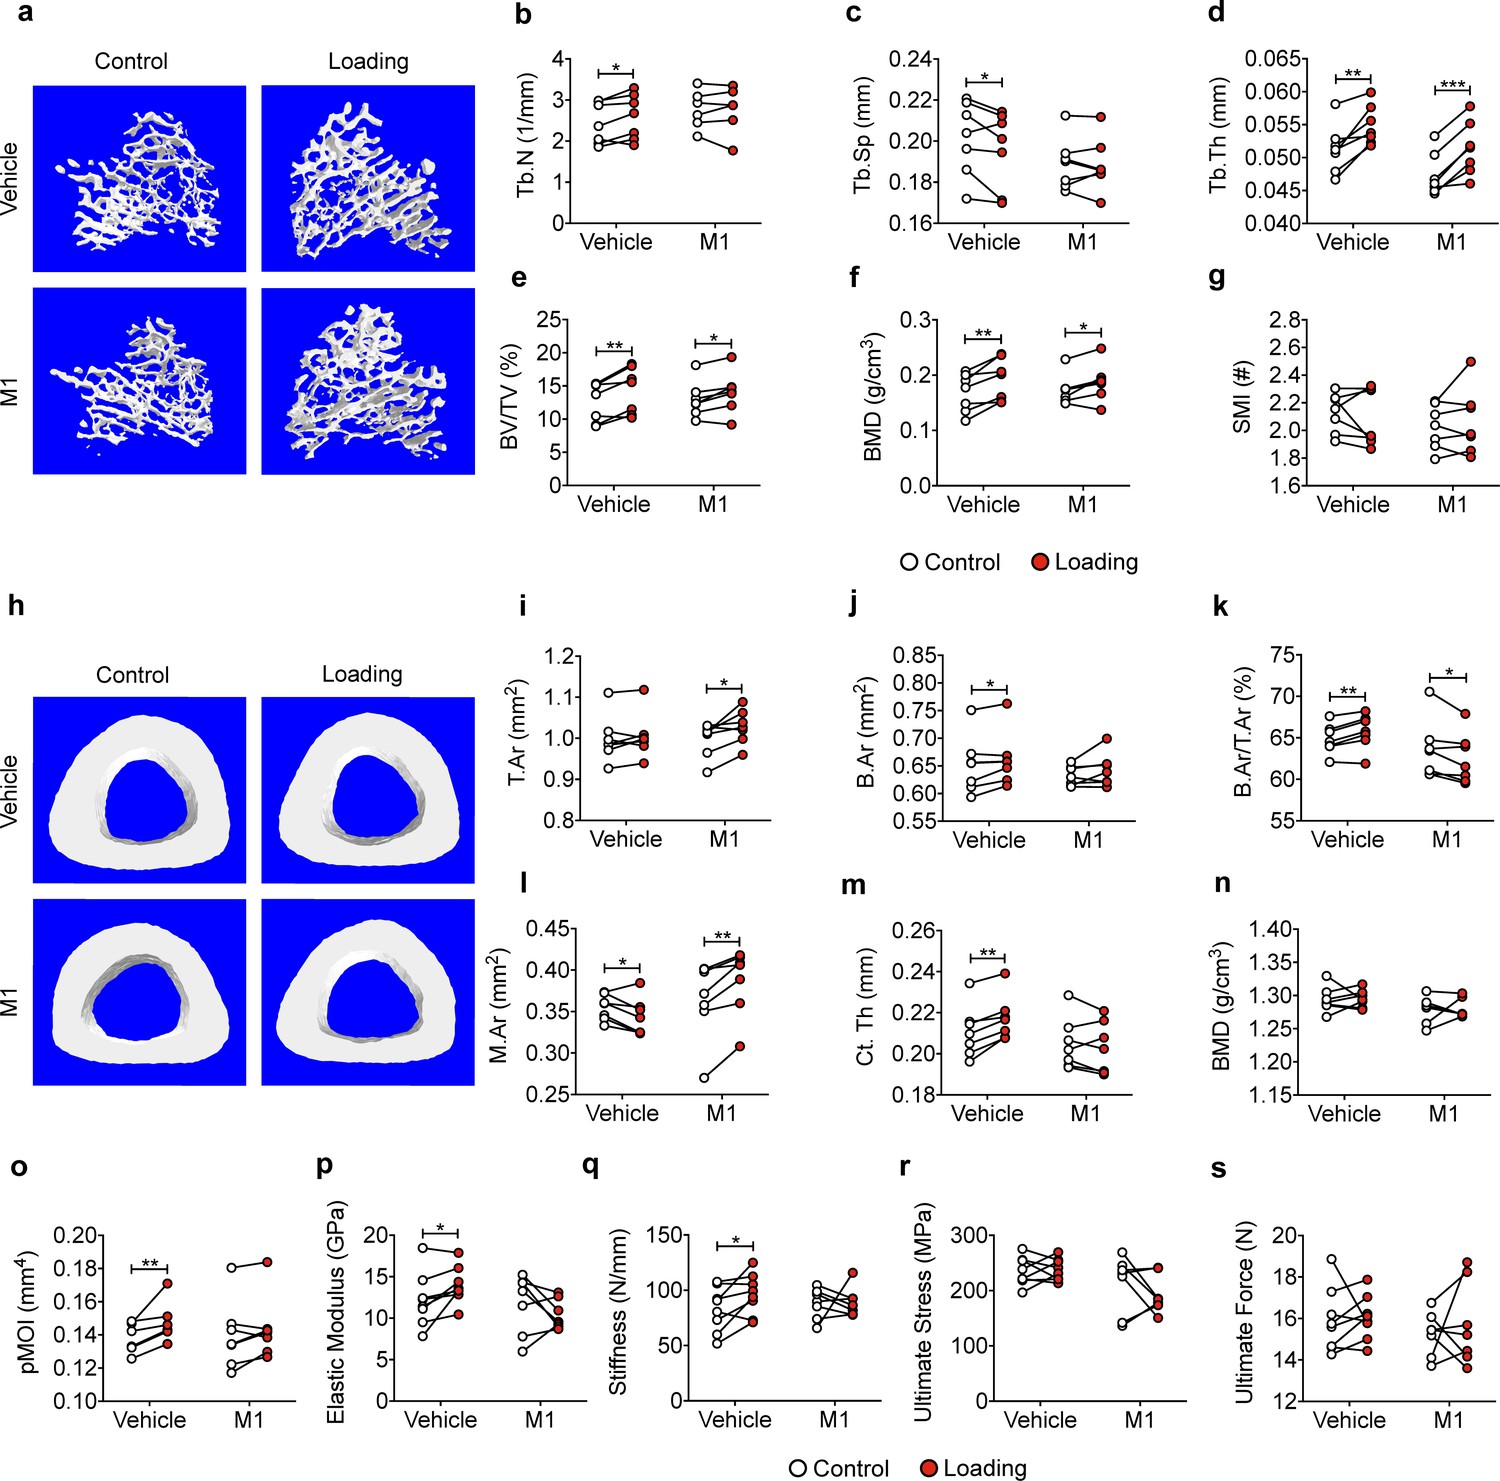
Inhibition of Cx43 hemichannels by Cx43(M1) antibody impairs anabolic effects of mechanical loading on trabecular and cortical bones.
(a) Representative 3D models of the metaphyseal trabecular bone of vehicle and Cx43(M1)-treated mice. (b–g) μCT was used to assess structural parameters of trabecular bone; (b) trabecular number, (c) trabecular separation, (d) trabecular thickness, (e) bone volume fraction, (f) bone mineral density, and (g) structure model index in vehicle and Cx43 (M1)-treated mice. n = 7/group. (H) Representative 3D models of the tibial midshaft cortical bone (50% site) in vehicle and Cx43(M1)-treated mice. (i–n) μCT was used to assess structural parameters of cortical bone; (i) total area, (j) bone area, (k) bone area fraction, (l) bone marrow area, (m) cortical thickness, (n) bone mineral density and (o) polar moment of inertia in vehicle and Cx43(M1)-treated mice. n = 7/group. (p–s) The three-point bending assay was performed for tibial bone of vehicle and Cx43 (M1)-treated mice; (p) elastic modulus, (q) stiffness, (r) ultimate stress, and (s) ultimate force. n = 7–8/group. Data are expressed as mean ± SD. *, p < 0.05; **, p < 0.01; ***, p < 0.001. Statistical analysis was performed using paired t-test for loaded and contralateral within each treatment.
-
Figure 5—source data 1
Micro-CT data of vehicle and Cx43(M1)-treated mice.
- https://cdn.elifesciences.org/articles/74365/elife-74365-fig5-data1-v1.xlsx
-
Figure 5—source data 2
Three-point bending data of vehicle and Cx43(M1)-treated mice.
- https://cdn.elifesciences.org/articles/74365/elife-74365-fig5-data2-v1.xlsx
Figure 5—figure supplement 1
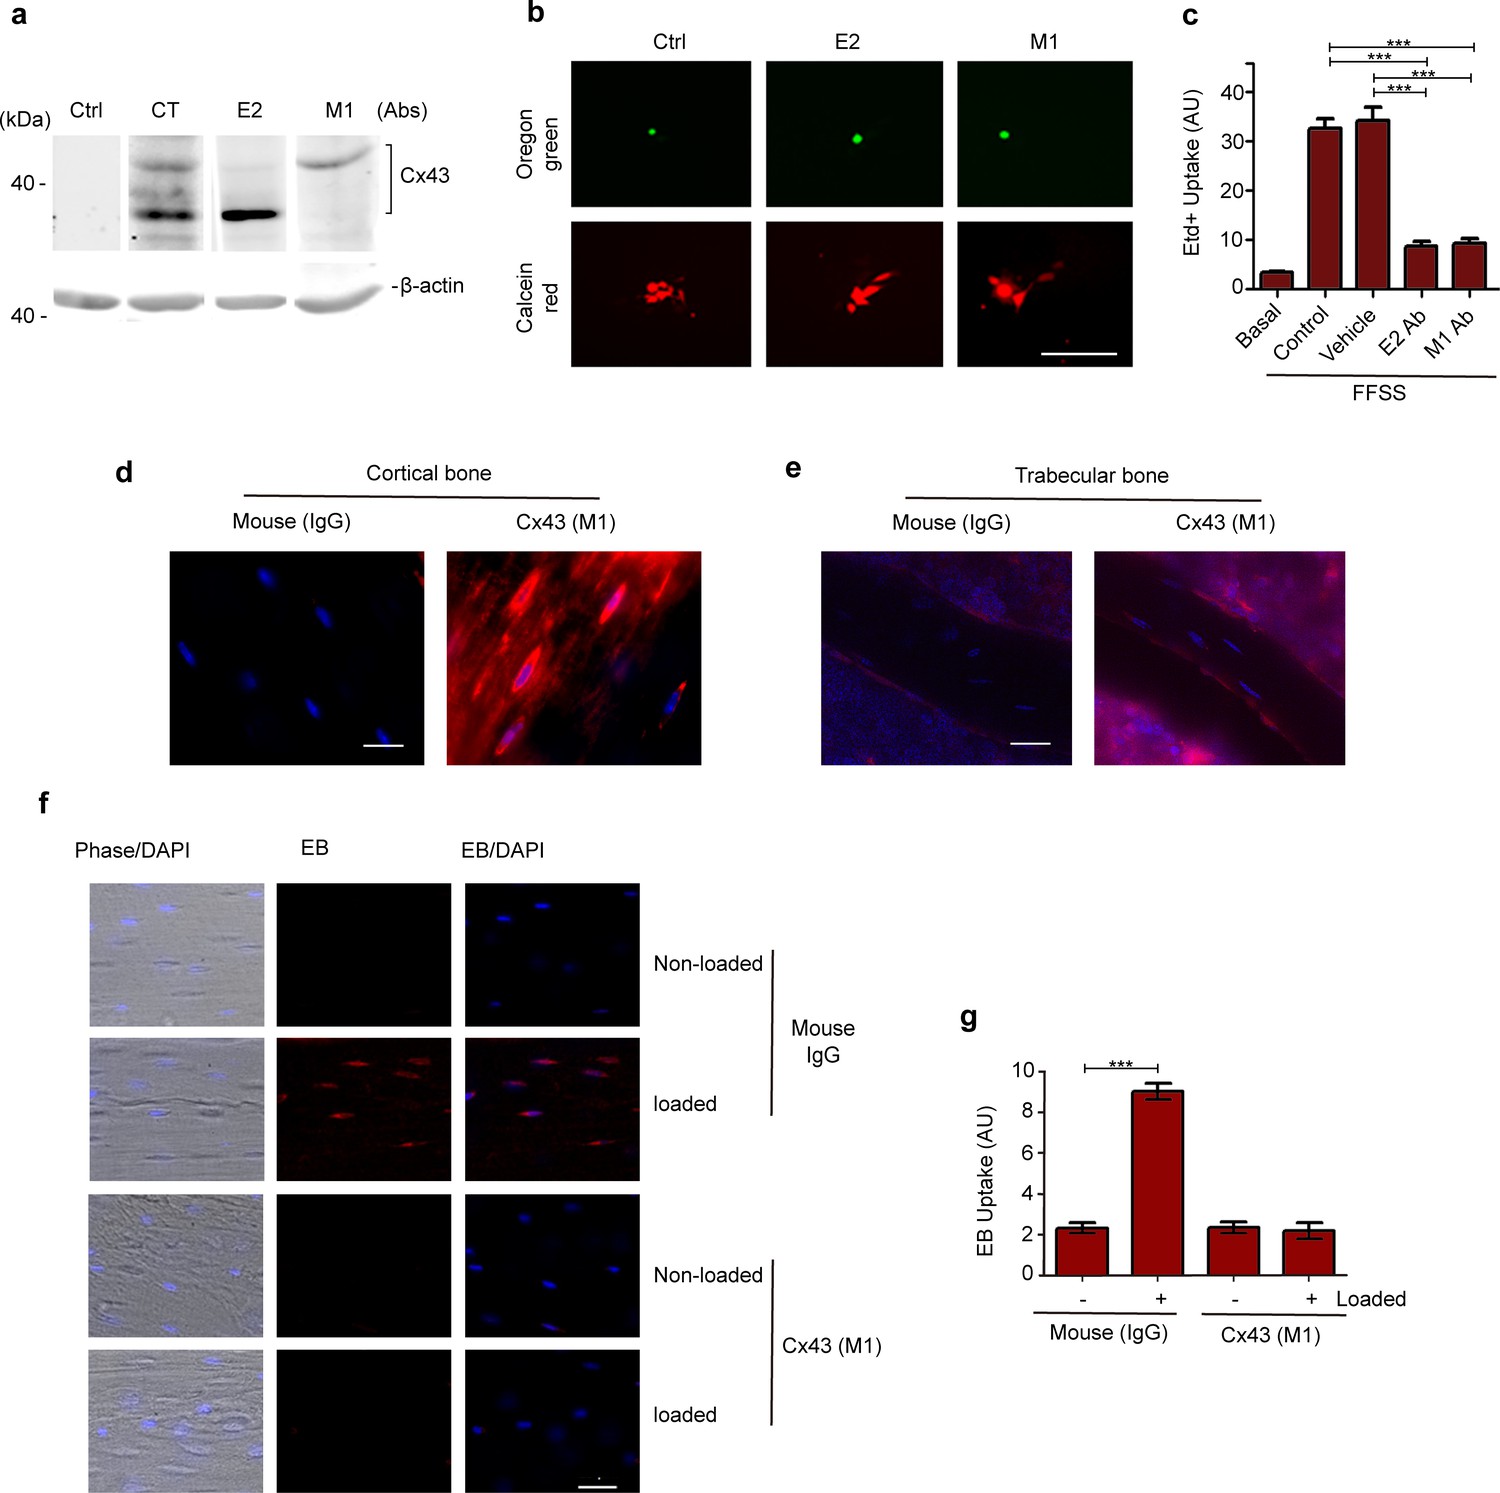
Monoclonal antibody of Cx43 inhibits hemichannel opening induced by mechanical stress in vitro and in vivo.
(a) Parachuting dye coupling assay was conducted to determine gap junction coupling in MLO-Y4 cells loaded with Oregon green 488 BAPTA-AM (Mr: 1751 Da) as a cell tracker probe and calcein red-orange AM (Mr: 789 Da). Scale bar, 100 μm. (b) MLO-Y4 cells were preincubated with Cx43(E2), Cx43(M1), PBS (vehicle) or rhodamine-conjugated anti-mouse IgG (control) and then subjected to fluid flow shear stress (FFSS) (eight dynes/cm2) for 10 min and followed by ethidium bromide (Etd+) dye uptake assay. n = 4/group. (c, d) Representative images of Cx43(M1) detected with rhodamine-conjugated anti-mouse IgG in tibial midshaft cortical bone and trabecular bone. Bar, 50 μm. (e) Representative images of Evans blue (EB) dye uptake in control and tibial loaded bone in the absence or presence of Cx43(M1) antibody. Scale bar, 40 μm. (f) Quantitative analysis of Evans blue (EB) dye uptake. n = 3/group. Data are expressed as mean ± SD. *, p < 0.05; **, p < 0.01; ***, p < 0.001. Statistical analysis was performed using paired t-test for loaded and contralateral within each treatment or two-way ANOVA with Tukey test among different groups.
-
Figure 5—figure supplement 1—source data 1
Raw data of dye uptake for Figure 5—figure supplement 1c and g.
- https://cdn.elifesciences.org/articles/74365/elife-74365-fig5-figsupp1-data1-v1.zip
-
Figure 5—figure supplement 1—source data 2
Full scan of western blots for Figure 5—figure supplement 1a.
- https://cdn.elifesciences.org/articles/74365/elife-74365-fig5-figsupp1-data2-v1.xlsx
Figure 5—figure supplement 2
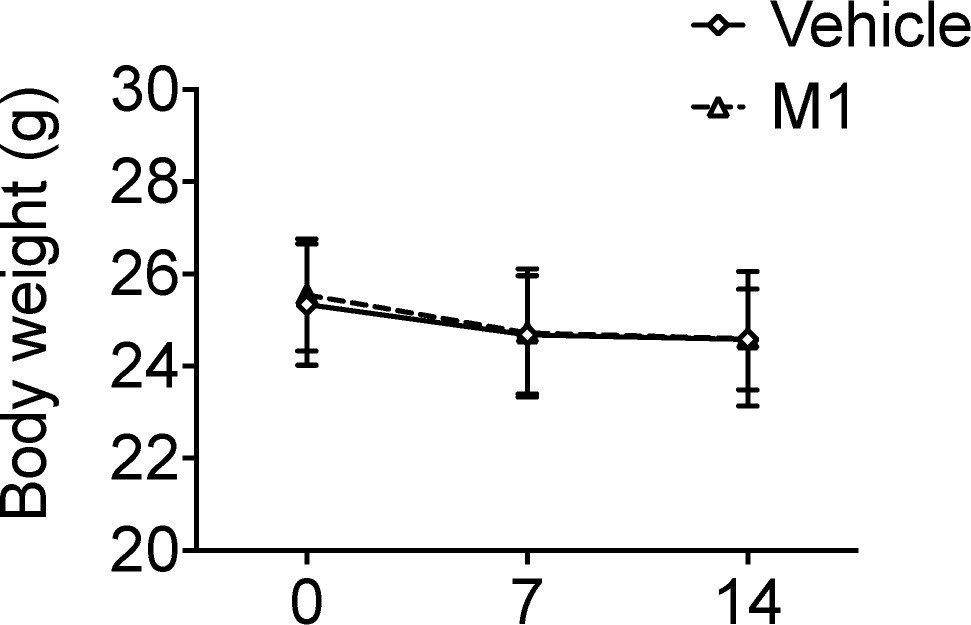
Body weights of mice during 2 weeks of tibial loading.
Weekly body weights of vehicle and Cx43(M1)-treated groups. n = 18/group. Data are expressed as mean ± SD. Statistical analysis was performed using one-way ANOVA with Tukey test among different genotypes.
-
Figure 5—figure supplement 2—source data 1
Raw data of body weight for Figure 5—figure supplement 2a.
- https://cdn.elifesciences.org/articles/74365/elife-74365-fig5-figsupp2-data1-v1.xlsx
Figure 6
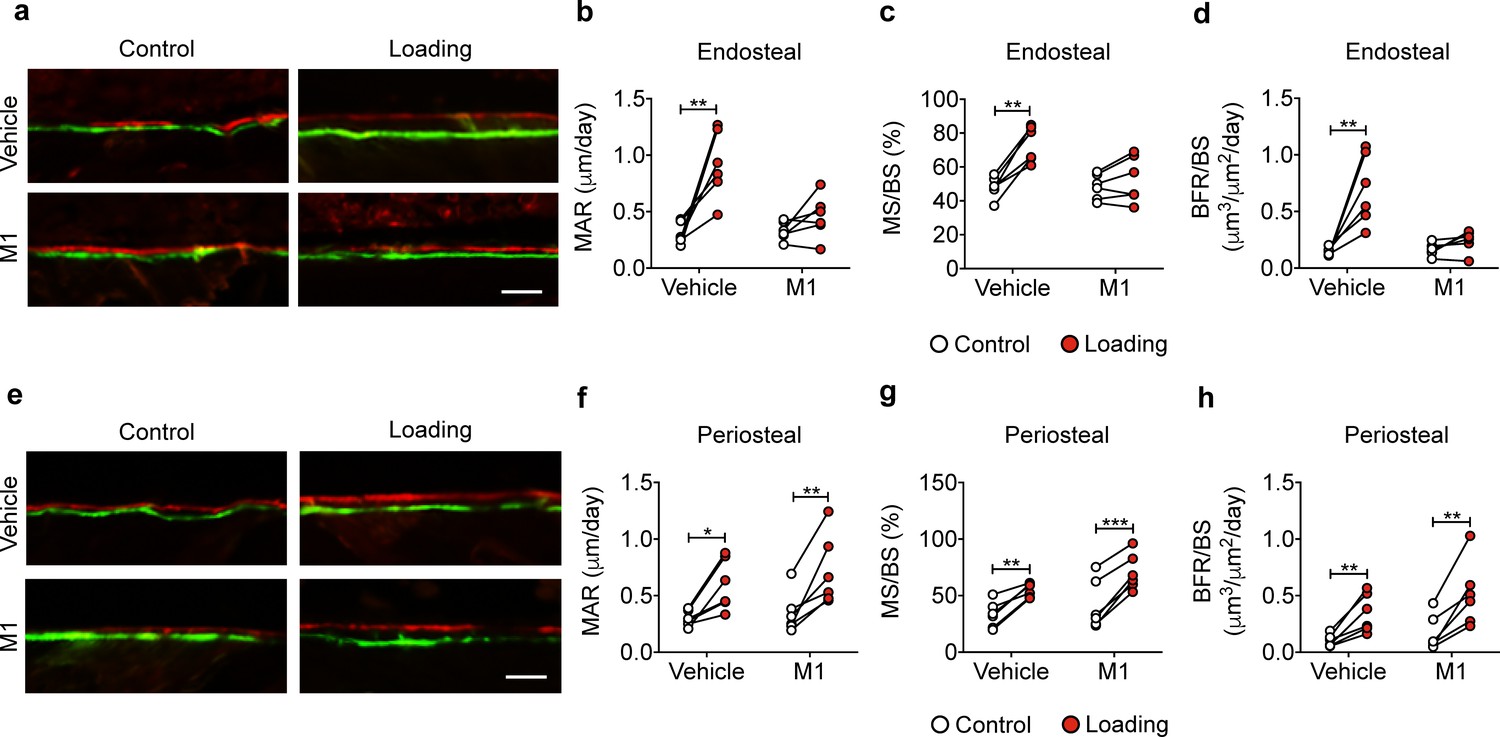
Cx43(M1) inhibits the load-induced increase in midshaft endosteal osteogenesis.
Dynamic histomorphometric analyses were performed on the tibial midshaft cortical endosteal (a–d) and periosteal (e–h) surfaces after 2 weeks of loading in vehicle and Cx43(M1)-treated mice. (a, e) Representative images of calcein (green) alizarin (red) double labeling on (a) endosteal and (e) periosteal surface Scale bar: 50 μm. Mineral apposition rate (MAR), mineralizing surface/bone surface (MS/BS), and bone formation rate (BFR/BS) were assessed for (b–d) endosteal and (f–h) periosteal surfaces (n = 6/group). Data are expressed as mean ± SD. *, p < 0.05; **, p < 0.01; ***, p < 0.001. Statistical analysis was performed using paired t-test for loaded and contralateral within each treatment.
-
Figure 6—source data 1
Raw data of periosteal and endosteal bone formation of vehicle and Cx43(M1)-treated mice.
- https://cdn.elifesciences.org/articles/74365/elife-74365-fig6-data1-v1.xlsx
Figure 7 with 1 supplement
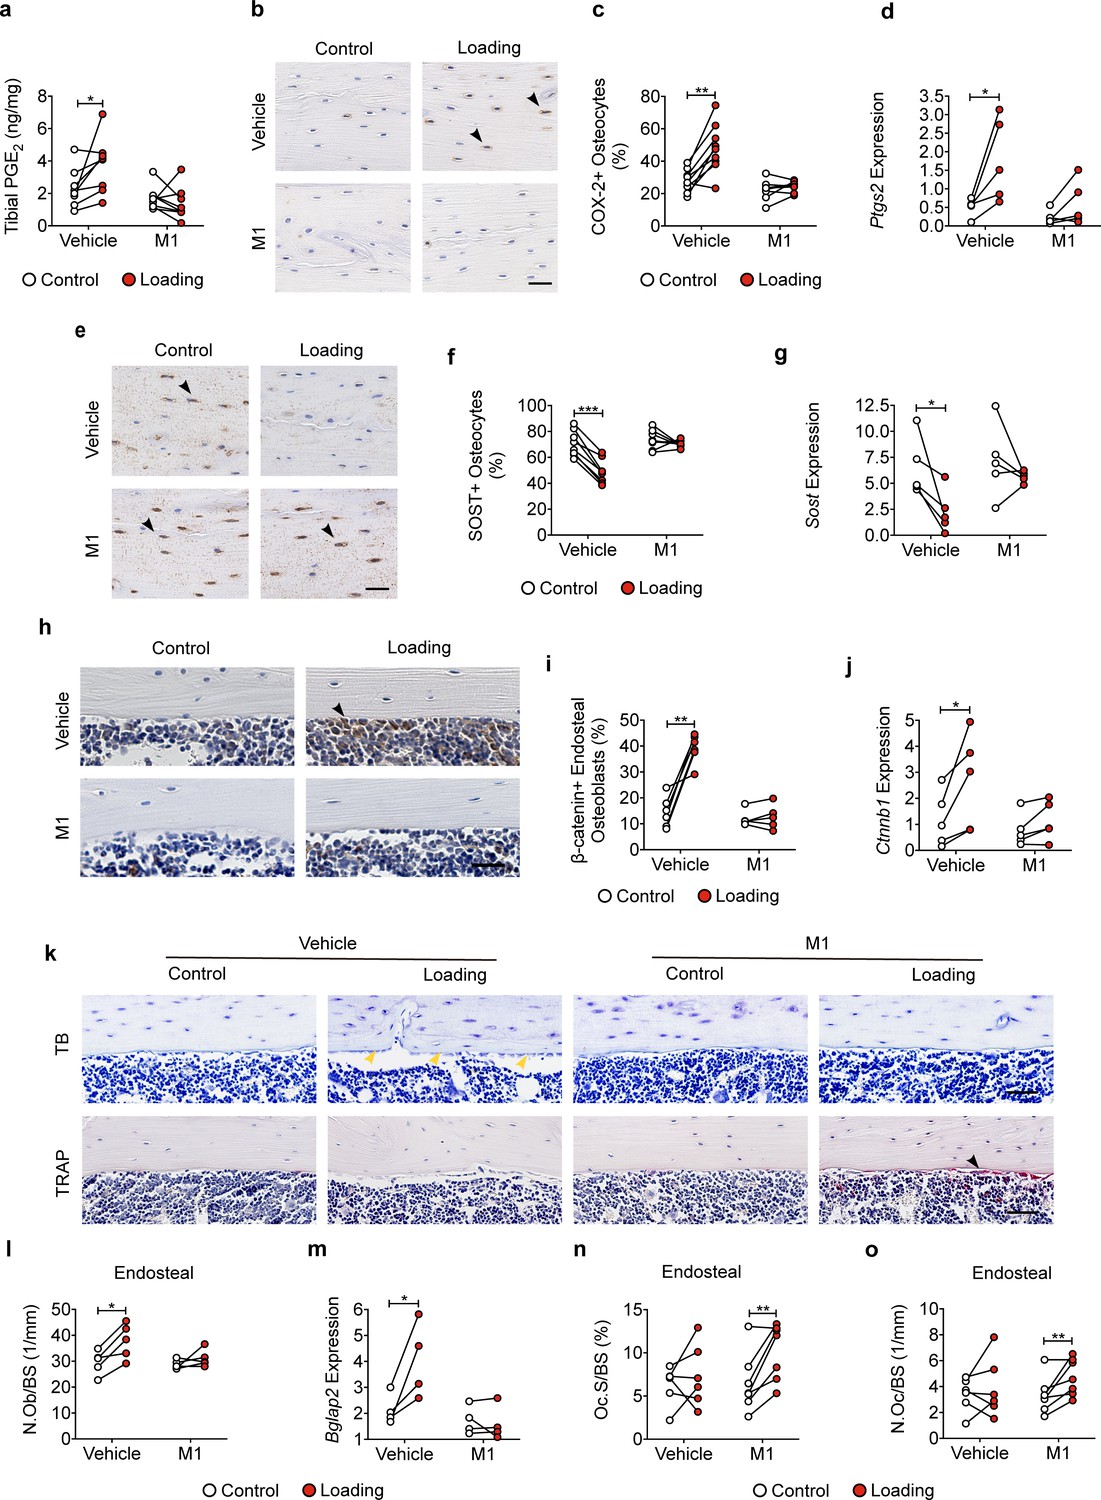
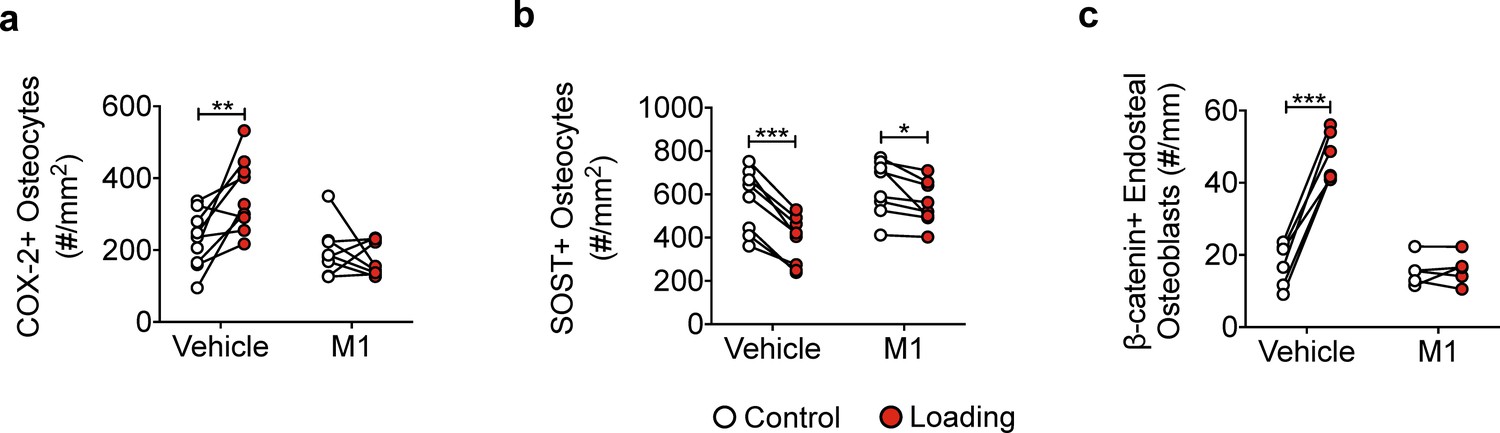
Cx43(M1) impedes the loading-induced increased PGE2 secretion and osteoblast activity, and decreased osteoclast activity.
(a) ELISA analysis of PGE2 in bone marrow-flushed tibial diaphysis after 5 days of mechanical loading in vehicle and Cx43(M1)-treated mice (n = 8/group). (b, c) Representative images and quantitative analysis of COX-2-postive osteocytes (yellow arrows) in tibial midshaft cortical bone after 2 weeks of loading in vehicle and Cx43(M1)-treated mice. Scale bar: 30 μm. n = 8–9/group. (d) Ptgs2 mRNA determined by RT-qPCR in bone marrow-flushed tibial diaphysis of vehicle and Cx43(M1)-treated mice. n = 4/group. (e, f) Representative images and quantitative analysis of the SOST-positive osteocytes (yellow arrows) in tibial midshaft cortical bone after 2 weeks of mechanical loading in vehicle and Cx43(M1)-treated mice. Scale bar: 30 μm (n = 8/group). (g) Sost mRNA determined by RT-qPCR from bone marrow-flushed tibial diaphysis of vehicle and Cx43(M1)-treated mice. n = 4/group. (h, i) Representative images and quantitative analysis of the β-catenin-positive periosteal cells (black arrows) on tibial midshaft endosteal surface after 2 weeks of loading in vehicle and Cx43(M1)-treated mice. Scale bar: 20 μm; n = 5–6/group. (j) Ctnnb1 mRNA determined by RT-qPCR in bone marrow-flushed tibial diaphysis of vehicle and Cx43(M1)-treated mice. n = 4/group. (k) Representative images of tibial midshaft endosteal surface stained for toluidine blue (top panel) or TRAP (low panel). The yellow arrows indicate osteoblasts and the black arrows indicate the TRAP-positive osteoclasts. Scale bar: 30 μm. (l) Histomorphometric quantitation of osteoblast per bone perimeter (n = 5–7/group). (m) Bglap2 mRNA determined by RT-qPCR in bone marrow-flushed tibial diaphysis of vehicle and Cx43(M1)-treated mice. n = 4/group. (n, o) Histomorphometric quantitation of osteoclast per bone perimeter (n) and osteoclast surface per bone perimeter (o) (n = 5–7/group). Data are expressed as mean ± SD. *, p < 0.05; **, p < 0.01; ***, p < 0.001. Statistical analysis was performed using paired t-test for loaded and contralateral within each treatment.
-
Figure 7—source data 1
Raw data of PGE2 level for Figure 7a.
- https://cdn.elifesciences.org/articles/74365/elife-74365-fig7-data1-v1.xlsx
-
Figure 7—source data 2
Raw data of immumohistochemical, TRAP and toluidine blue staining of vehicle and Cx43(M1)-treated mice.
- https://cdn.elifesciences.org/articles/74365/elife-74365-fig7-data2-v1.xlsx
-
Figure 7—source data 3
Raw data of RT-qPCR of vehicle and Cx43(M1)-treated mice.
- https://cdn.elifesciences.org/articles/74365/elife-74365-fig7-data3-v1.xlsx
Figure 7—figure supplement 1
Bone marker protein expression in vehicle- and Cx43(M1)-treated mice.
(a, b) Quantitative analysis of the COX-2-positive or SOST-positive osteocytes per bone area in tibial midshaft cortical bone after 2 weeks of loading in vehicle and Cx43(M1)-treated mice. n = 8–9/group. (c) Quantitative analysis of the β-catenin-positive osteoblasts per bone perimeter in tibial midshaft cortical bone after 2 weeks of mechanical loading in vehicle and Cx43(M1)-treated mice. n = 4–6/group. Data are expressed as mean ± SD. *, p < 0.05; **, p < 0.01; ***, p < 0.001. Statistical analysis was performed using paired t-test for loaded and contralateral within each treatment.
-
Figure 7—figure supplement 1—source data 1
Raw data of COX-2, SOST, and β-catenin quantification for Figure 7—figure supplement 1a-c.
- https://cdn.elifesciences.org/articles/74365/elife-74365-fig7-figsupp1-data1-v1.xlsx
Figure 8 with 2 supplements
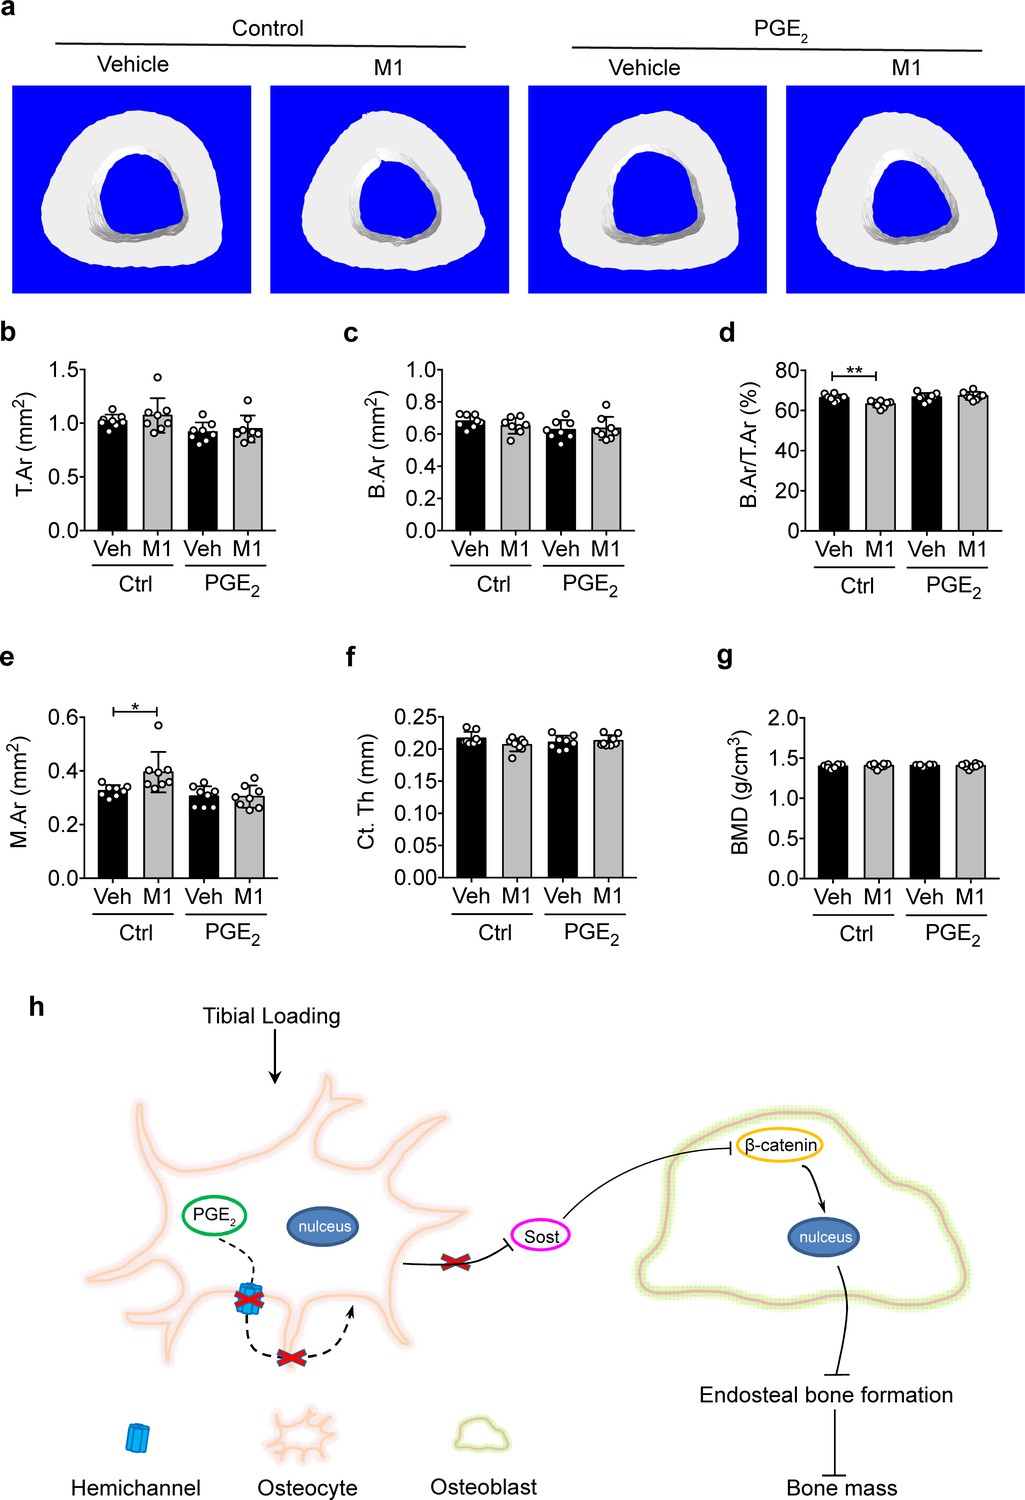
PGE2 rescues the osteogenic response to mechanical loading with the impairment of Cx43 hemichannels in cortical bone.
(a) Representative 3D models of the tibial midshaft cortical bone (50% site) in vehicle and Cx43(M1)-treated mice treated with 1 mg/kg/day PGE2 or vehicle control. (b–g) μCT was used to assess tibial midshaft cortical bone; (b) total area, (c) bone area, (d) bone area fraction, (e) bone marrow area, (f) cortical thickness, and (g) bone mineral density. n = 8/group. Data are expressed as mean ± SD. *, p < 0.05; **, p < 0.01. Statistical analysis was performed using unpaired t-test. (h) Schematic diagram illustrating the mechanistic roles of osteocytic Cx43 hemichannels in mediating anabolic responses to tibial loading. Briefly, Cx43 hemichannels mediate the release of PGE2 by mechanical loading, leading to suppression of SOST expression with enhanced β-catenin expression and osteogenesis on the endosteal surface. The inhibition of Cx43 hemichannels impedes the loading-induced PGE2 secretion and anabolic function of mechanical loading on bone tissue.
-
Figure 8—source data 1
Cortical micro-CT data of vehicle and Cx43(M1)-treated mice treated with 1 mg/kg/day PGE2 or vehicle control.
- https://cdn.elifesciences.org/articles/74365/elife-74365-fig8-data1-v1.xlsx
Figure 8—figure supplement 1
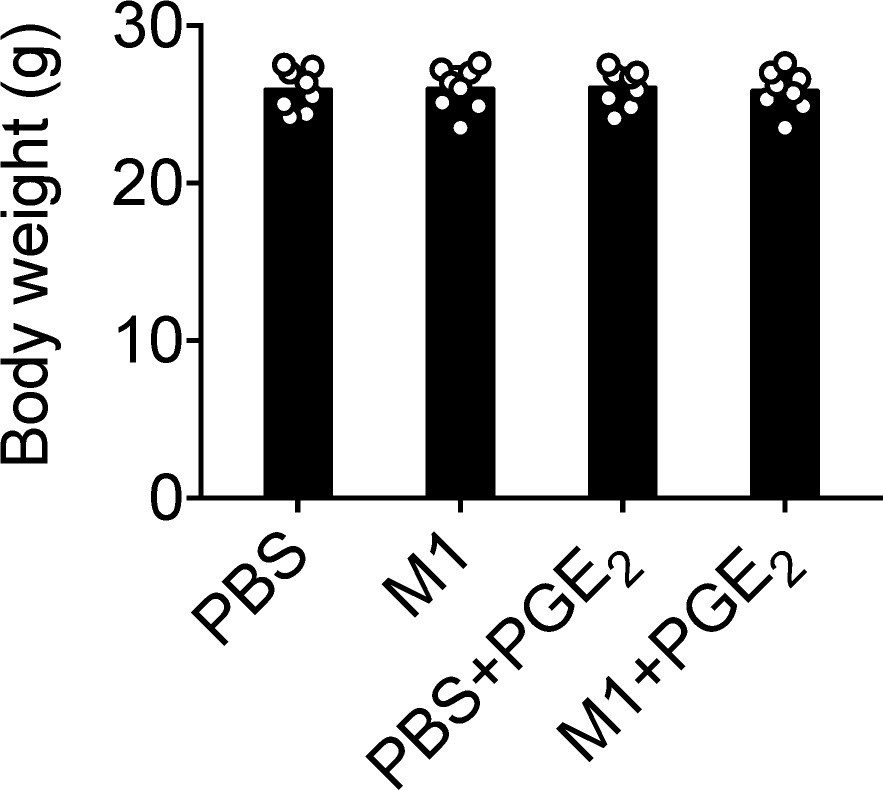
Body weights of mice of vehicle- and Cx43(M1)-treated mice treated with 1 mg/kg/day PGE2 or vehicle control.
The body weights of vehicle- and Cx43(M1)-treated mice treated with 1 mg/kg/day PGE2 or vehicle control at the beginning of mechanical loading. n = 8/group. Data are expressed as mean ± SD. Statistical analysis was performed using one-way ANOVA with Tukey test among different genotypes.
-
Figure 8—figure supplement 1—source data 1
Raw data of body weight for Figure 8—figure supplement 1a.
- https://cdn.elifesciences.org/articles/74365/elife-74365-fig8-figsupp1-data1-v1.xlsx
Figure 8—figure supplement 2
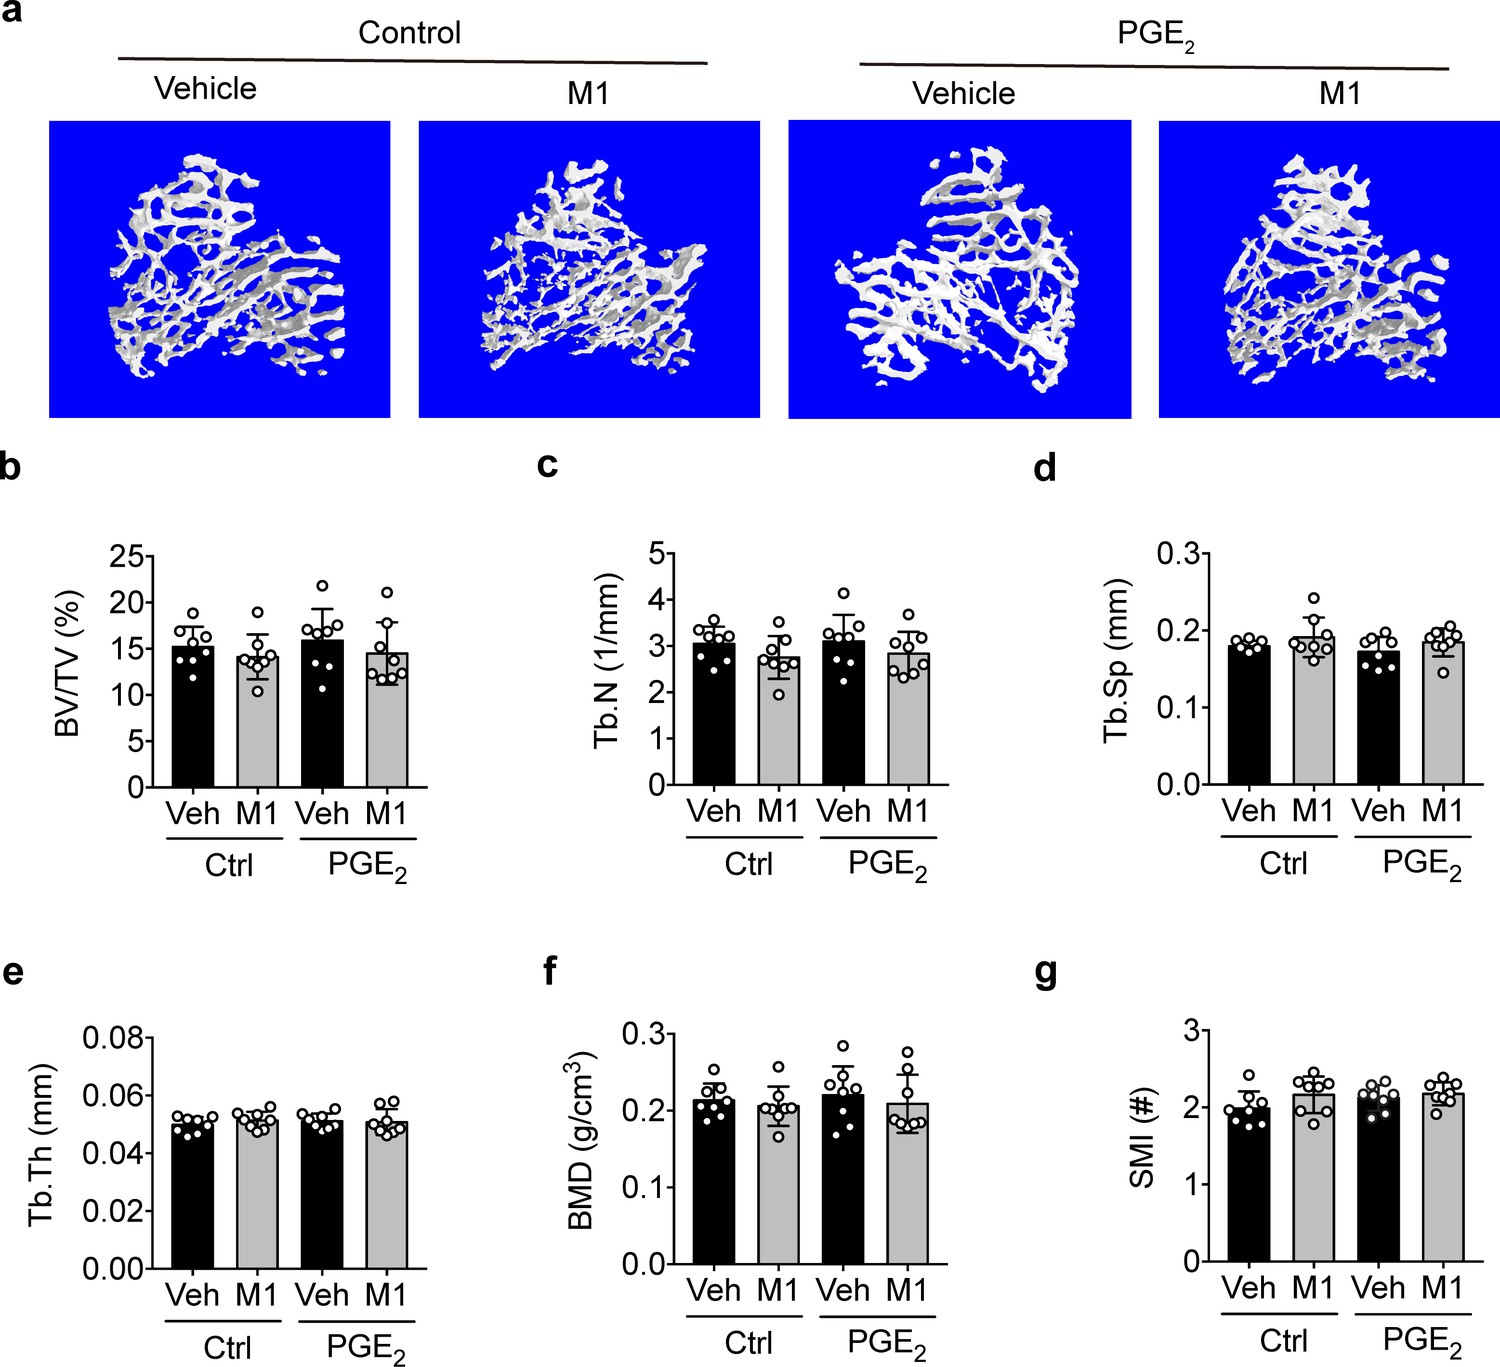
PGE2 does not exert additional trabecular osteogenic response to mechanical loading.
(a) Representative 3D models of metaphyseal trabecular bone in vehicle and Cx43(M1)-treated mice treated with 1 mg/kg/day PGE2 or vehicle control. (b–g) μCT was used to assess tibial midshaft cortical bone; (b) bone volume fraction, (c) trabecular number, (d) trabecular separation, (e) trabecular thickness, (f) bone mineral density and (g) structure model index. n = 8/group. Statistical analysis was performed using unpaired t-test.
-
Figure 8—figure supplement 2—source data 1
Trabecular micro-CT data of vehicle and Cx43(M1)-treated mice treated with 1 mg/kg/day PGE2 or vehicle control.
- https://cdn.elifesciences.org/articles/74365/elife-74365-fig8-figsupp2-data1-v1.xlsx
Additional files
-
Supplementary file 1
Sequences of the primers used for each gene used in this article.
- https://cdn.elifesciences.org/articles/74365/elife-74365-supp1-v1.docx
-
Transparent reporting form
- https://cdn.elifesciences.org/articles/74365/elife-74365-transrepform1-v1.docx
Download links
A two-part list of links to download the article, or parts of the article, in various formats.
Downloads (link to download the article as PDF)
Open citations (links to open the citations from this article in various online reference manager services)
Cite this article (links to download the citations from this article in formats compatible with various reference manager tools)
Connexin hemichannels with prostaglandin release in anabolic function of bone to mechanical loading
eLife 11:e74365.
https://doi.org/10.7554/eLife.74365


