Reducing lipid bilayer stress by monounsaturated fatty acids protects renal proximal tubules in diabetes
- Section Nephrogenetics, Institute of Human Genetics, University Hospital Heidelberg, Germany
- Institute for Computational Biomedicine, Faculty of Medicine, Heidelberg University, University Hospital Heidelberg, Germany
- European Molecular Biology Laboratorium (EMBL), Structural and Computational Biology Unit, Germany
- Institute of Anatomy, University of Zurich, Switzerland
- Genomics Core Facility, Institut Imagine-Structure Fédérative de Recherche Necker, INSERM U1163, INSERM US24/CNRS UMS3633, Paris Descartes Sorbonne Paris Cite University, France
- Molecular Medicine Partnership Unit (MMPU), European Molecular Biology Laboratory (EMBL) and Heidelberg University, Germany
Figures
Figure 1 with 2 supplements
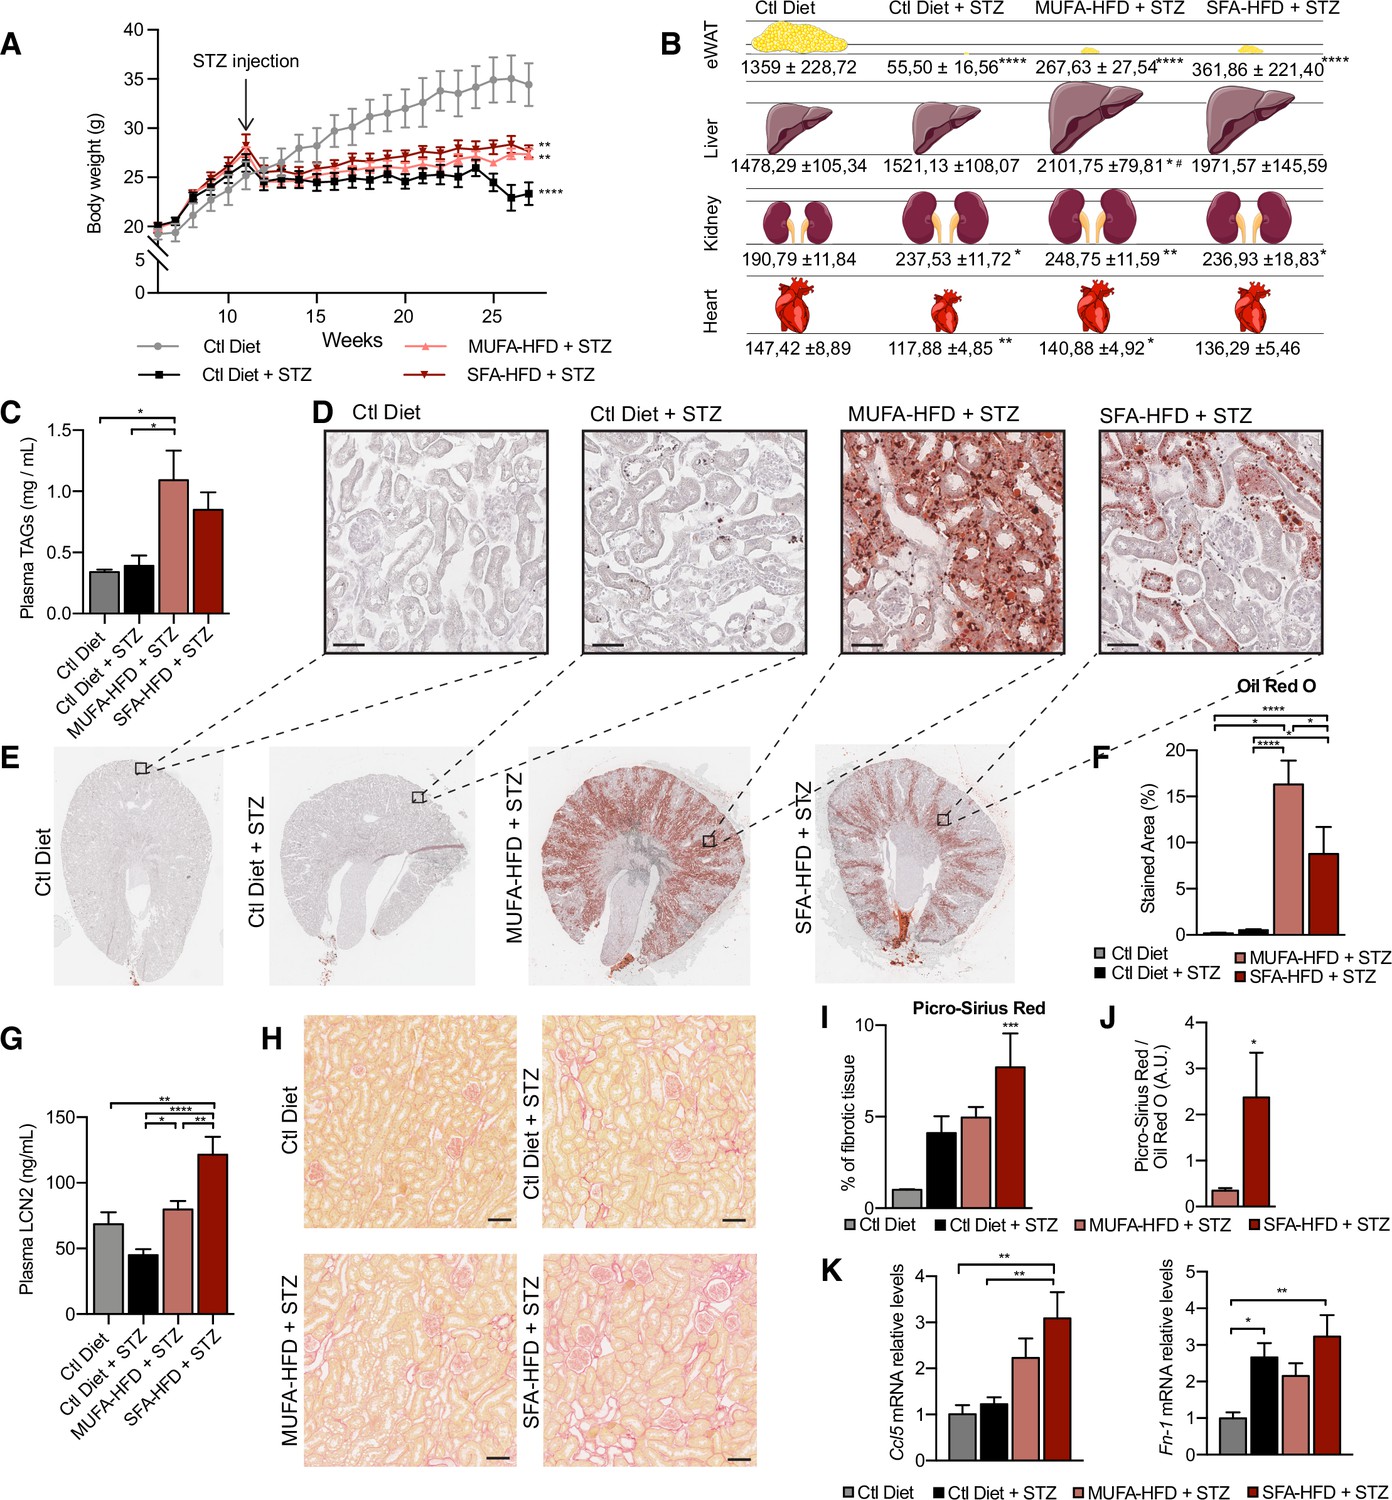
Saturated fatty acids high-fat diet (SFA-HFD) induces more tubular damage than monounsaturated fatty acids high-fat diet (MUFA-HFD) despite lower fat accumulation in mice.
(A) Mice body weight throughout the experiment. The X-axis indicates the age of mice. (B) Schematic representation of tissue weight. (C) Plasmatic triacylglycerol (TAG) levels at week 16 after streptozotocin (STZ) injection. (D–F) Representative bright-field images of whole kidney sections (E) and cortex magnification (D) stained with Oil Red O (ORO). Quantification of the stained cortex area (F). Scale bars: 50 μm. (G) Plasmatic LCN2 levels at week 12 after STZ injection. (H, I) Representative bright-field images of kidney cortex stained with Picro-Sirius Red (H) and the quantification of the fibrotic cortex area (I). Scale bars: 50 μm. (J) Fibrotic area detected by Picro-Sirius Red normalized by fat deposition measured by ORO in mouse kidney cortex. (K) Quantitative RT-PCR detection of Ccl5 and Fn-1 expression levels in mouse kidney cortex. In (A, C, G, I–K), data are presented as mean ± SEM. *p<0.05, **p<0.01, ***p<0.001, ****p<0.0001; one-way ANOVA plus Holm–Sidak’s multiple comparisons test. In (B), data are presented as mean ± standard deviation. *p<0.05, **p<0.01, ****p<0.0001 vs. Ctl; #p<0.05 vs. Ctl diet + STZ; one-way ANOVA plus Holm–Sidak’s multiple comparisons test. (A–C, F, G, I, J, K), n = 7Ctl diet, n = 8Ctl diet + STZ, n = 8 MUFA-HFD+ STZ, n = 7 SFA-HFD+ STZ.
Figure 1—figure supplement 1
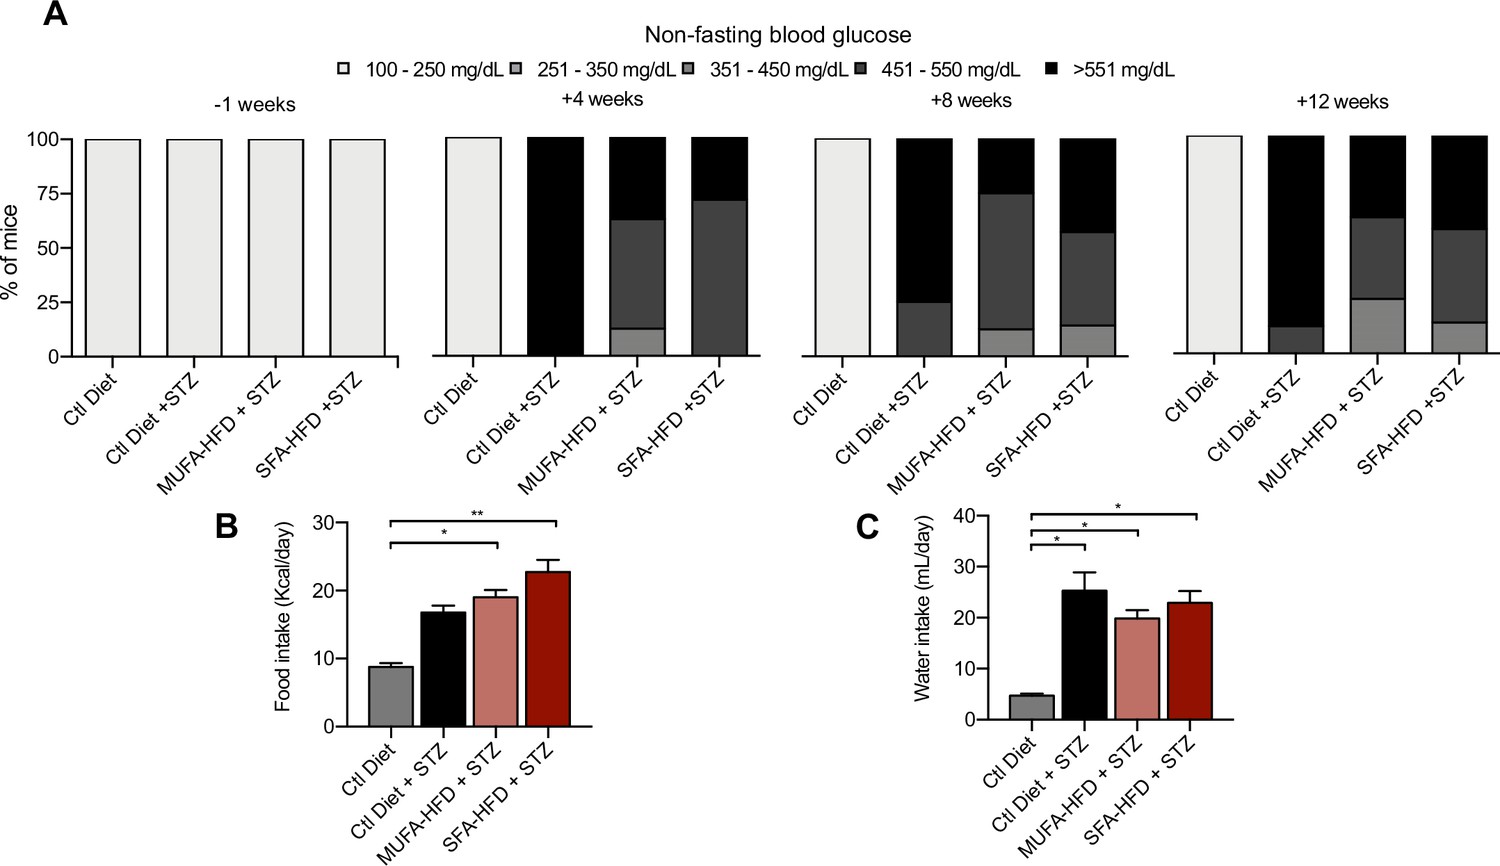
Diabetic phenotypes in streptozotocin (STZ)-injected mice.
(A) Nonfasting blood glucose levels 1 week before and 4, 8, and 12 weeks after STZ injection. (B) Daily food intake 9 weeks after STZ injection. (C) Daily water intake 9 weeks after STZ injection. In (B, C), data are presented as mean ± SEM. *p<0.05, **p<0.01; one-way ANOVA plus Holm–Sidak’s multiple comparisons test. In (A), n = 7 Ctl diet, n = 8 Ctl diet + STZ, n = 8 monounsaturated fatty acids high-fat diet (MUFA-HFD) + STZ, n = 7 saturated fatty acids high-fat diet (SFA-HFD) + STZ. In (B, C), measurements were performed on mice grouped by cages; n = 2 Ctl diet, n = 2 Ctl diet + STZ, n = 2 MUFA-HFD + STZ, n = 4 SFA-HFD + STZ.
Figure 1—figure supplement 2

Lipid droplets and KIM-1 expression in kidneys of diabetic mice.
(A) Representative bright-field images of mouse kidney cortex periodic acid-Schiff (PAS) staining. Arrows indicate lipid droplets. Scale bars: 50 μm. (B) Representative confocal fluorescence images of mouse kidney stained for DNA (blue), megalin (magenta), SGLT2 (magenta), and LD (green). Scale bars: 50 μm. (C) Quantitative RT–PCR detection of Cd36 and Fatp2 expression levels in mouse kidney cortex. (D) Representative confocal fluorescence images of mouse kidney cortex stained for KIM-1. Scale bars: 50 μm. In (C), data are presented as mean ± SEM. *p<0.05, **p<0.01; one-way ANOVA plus Holm–Sidak’s multiple comparisons test. n = 7 Ctl diet, n = 8 Ctl diet + streptozotocin (STZ), n = 8 monounsaturated fatty acids high-fat diet (MUFA-HFD) + STZ, n = 7 saturated fatty acids high-fat diet (SFA-HFD) + STZ.
Figure 2 with 3 supplements
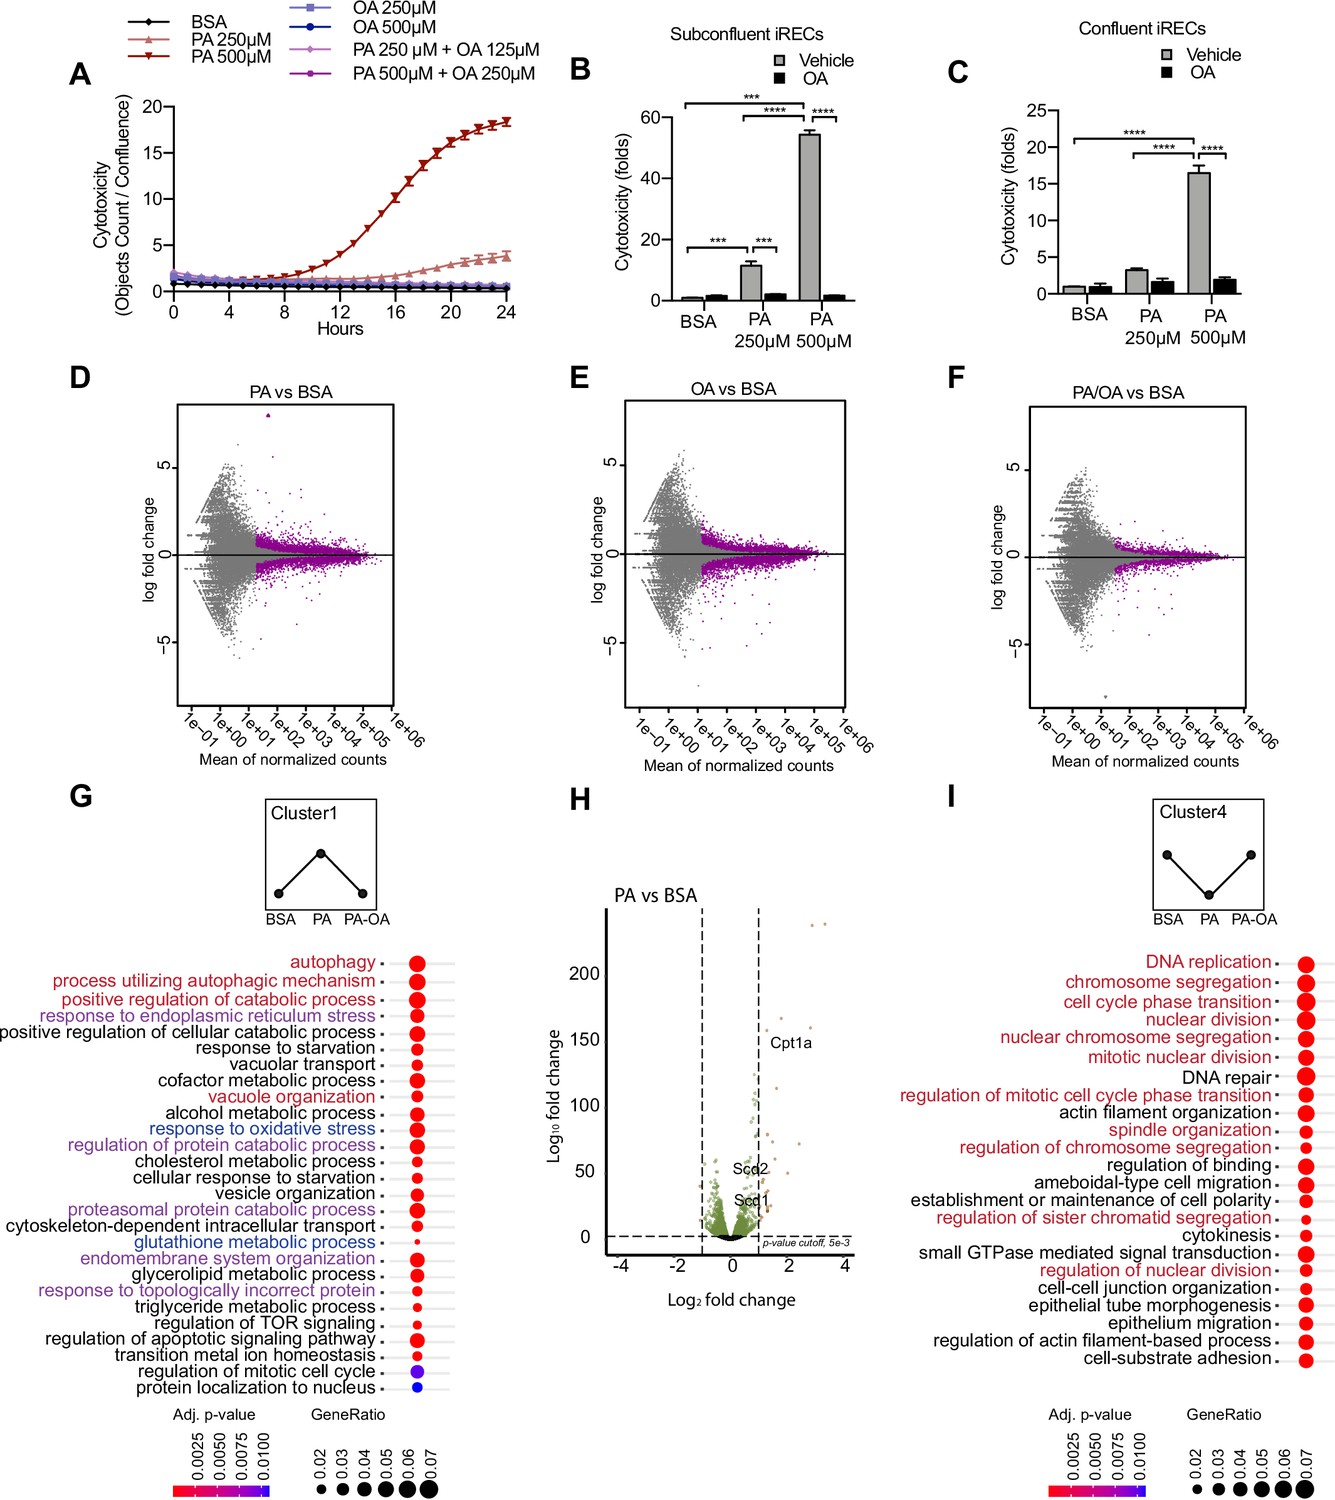
Palmitic acid (PA)-induced cytotoxicity is blocked by oleic acid (OA) in proximal tubular cells.
(A) Cytotoxicity throughout 24 hr in induced renal epithelial cells (iRECs) treated with several combinations of bovine serum albumin (BSA)-bound fatty acids. (B, C) Cytotoxicity in subconfluent (B) and confluent (C) iRECs after 24 hr treatment with BSA, OA 250 µM, PA 250 µM, PA 250 µM + OA 125 µM, PA 500 µM, and PA 500 µM + OA 250 µM. Fold representation of objects counts/confluence. (D–F) MA plots of differentially expressed genes from iRECs treated for 16 hr with BSA, PA 250 µM, OA 250 µM, and PA 250 µM + OA 125 µM. Purple dots represent statistically significant changes. (G, I) Gene Ontology for biological processes overrepresentation analysis using clusterProfiler. The 25 most significant terms were plotted for clusters 1 (G) and 4 (I). The size of the spheres corresponds to the number of genes included and the color to the adjusted p-value. (G) Biological processes related to autophagy colored in red, related to oxidative stress in blue and related to endoplasmic reticulum (ER) stress in violet. (I) Biological processes related to cell proliferation colored in red. (H) Volcano plot of PA vs. BSA differential gene expression. Colored dots represent statistically significant changes. In (A–C), data are presented as mean ± SEM. *p<0.05, **p<0.01, ***p<0.001, ****p<0.0001; two-way ANOVA and Holm–Sidak’s multiple comparisons test. (D–I) Significance was considered when adjusted p-value <0.05 (DESeq2 based on negative binomial distribution). (A–I) n = 3.
Figure 2—figure supplement 1
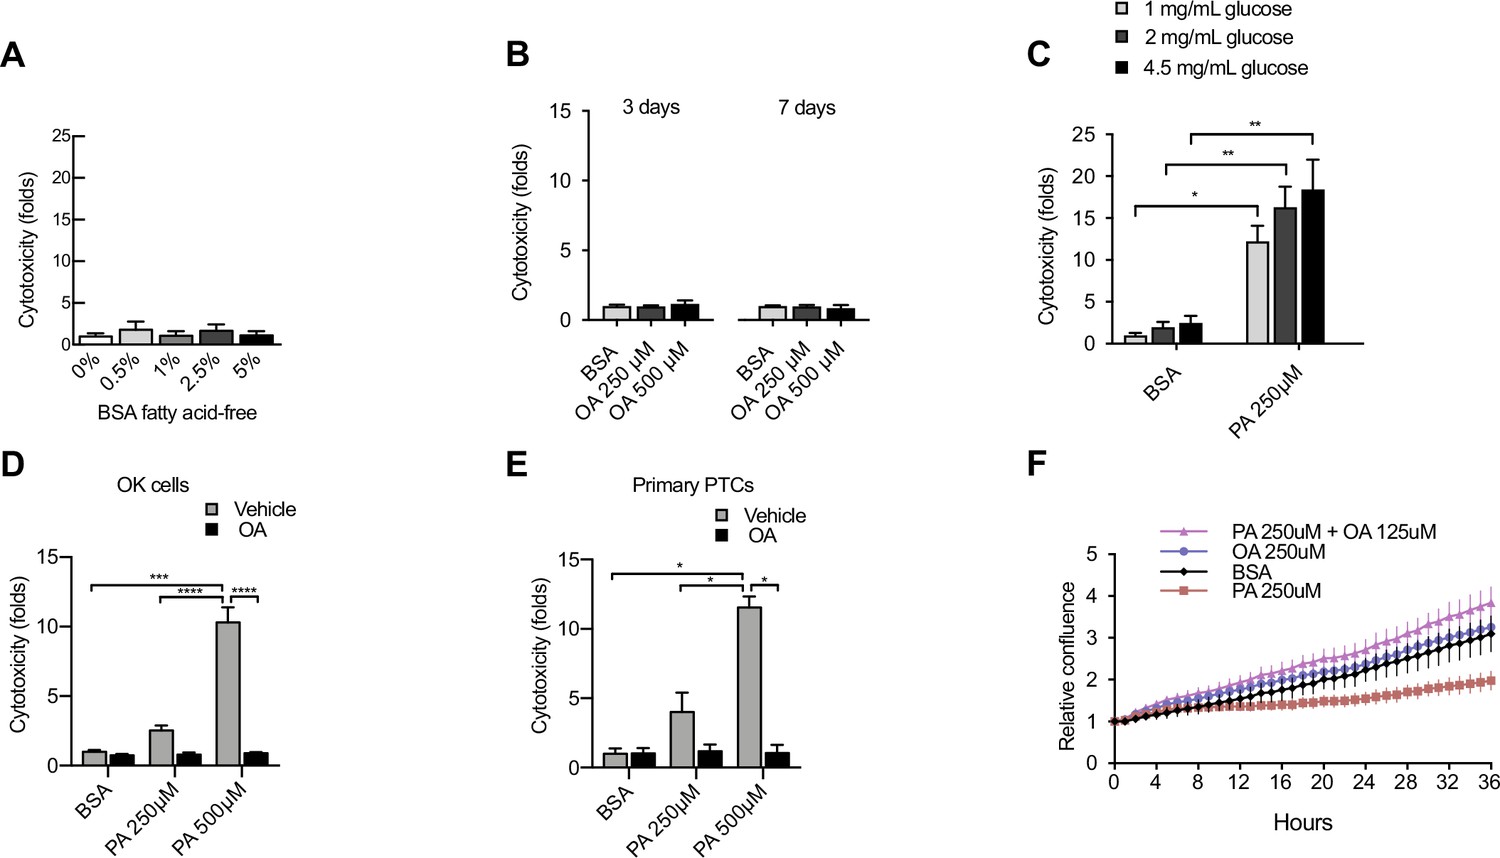
Characterization of factors contributing to lipotoxicity in iRECs and other proximal tubular cell (PTC) models.
(A) Cytotoxicity in induced renal epithelial cells (iRECs) at 24 hr treatment with increasing concentrations of fatty acid-freebovine serum albumin (BSA) . Fold representation of object counts/confluence. (B) Cytotoxicity in iRECs at 3 and 7 days treatment with oleic acid (OA). Fold representation of object counts/confluence. (C) Cytotoxicity in iRECs at 36 hr treatment with palmitic acid (PA) in media containing increasing concentrations of glucose. Fold representation of object counts/confluence. (D, E) Cytotoxicity in OK cells (D) and mouse primary proximal tubules (E) after 24 hr treatment with BSA, OA 250 µM, PA 250 µM, PA 250 µM + OA 125 µM, PA 500 µM, and PA 500 µM + OA 250 µM. Fold representation of objects counts/confluence. (F) Relative change in confluence of iRECs treated for 36 hr with BSA, PA 250 µM, OA 250 µM, and PA 250 µM + OA 125 µM. Data are presented as mean ± SEM. *p<0.05, **p<0.01, ***p<0.001, ****p<0.0001; (A, C) one-way ANOVA plus Holm–Sidak’s multiple comparisons test; (B, D, E) two-way ANOVA plus Holm–Sidak’s multiple comparisons test. (A–D, F) n = 3; (E) n = 2.
Figure 2—figure supplement 2
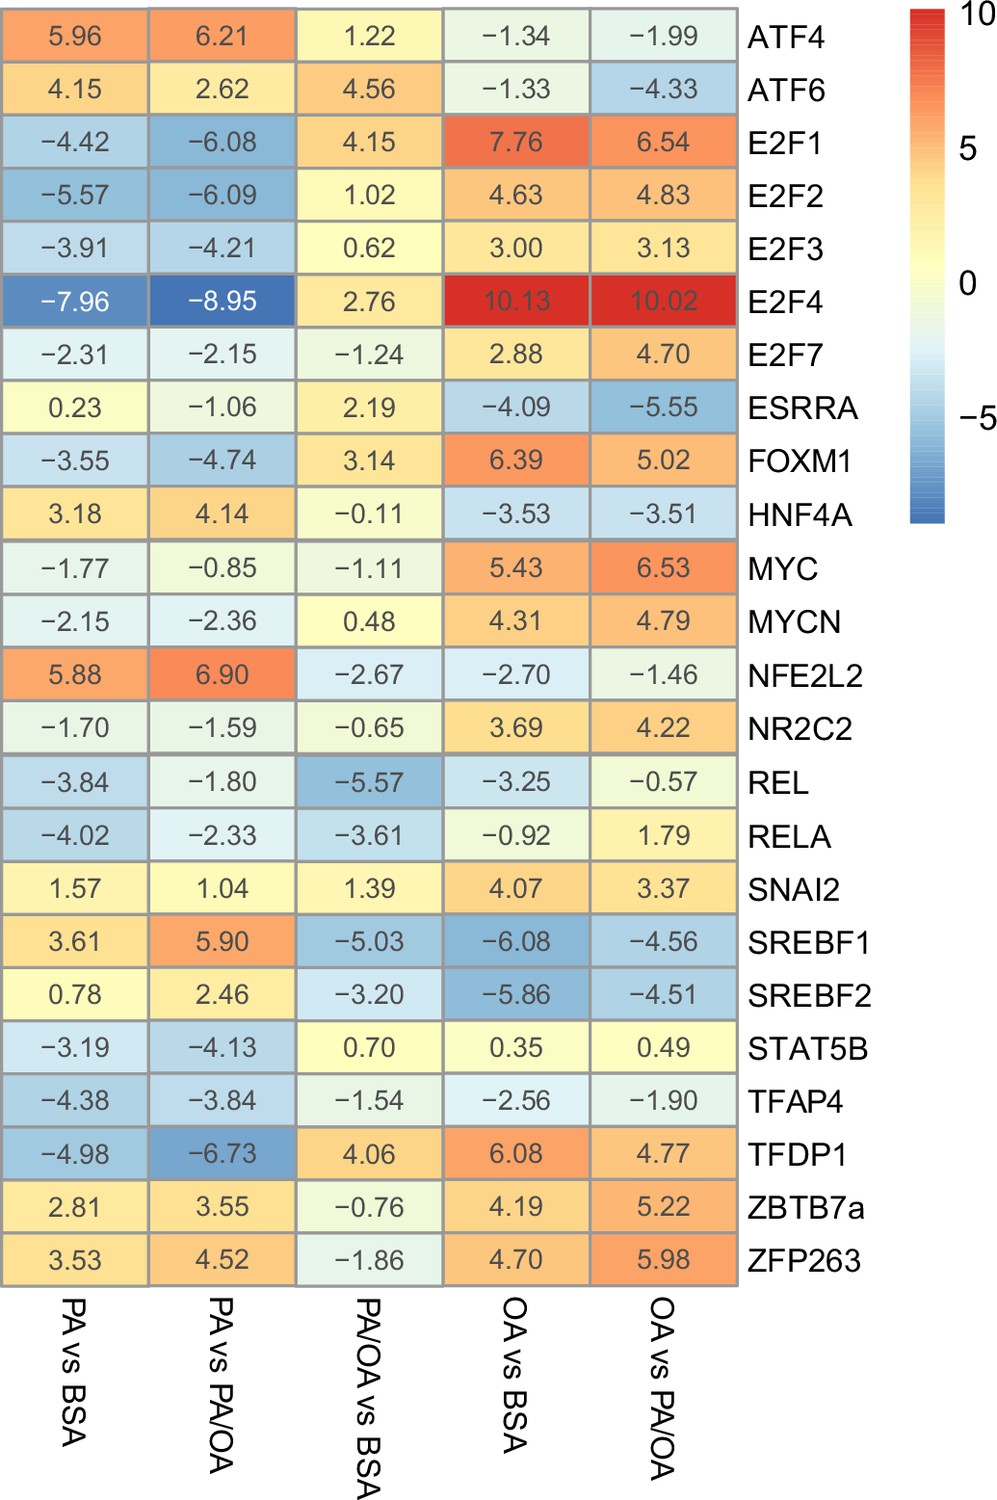
Estimated transcription factor activity in response to palmitic acid (PA), oleic acid (OA), and PA/OA.
Transcription factors (TFs) activity estimated from the transcriptome of induced renal epithelial cells (iRECs) treated for 16 hr with bovine serum albumin (BSA), PA 250 µM, OA 250 µM, and PA 250 µM + OA 125 µM; n = 3.
Figure 2—figure supplement 3
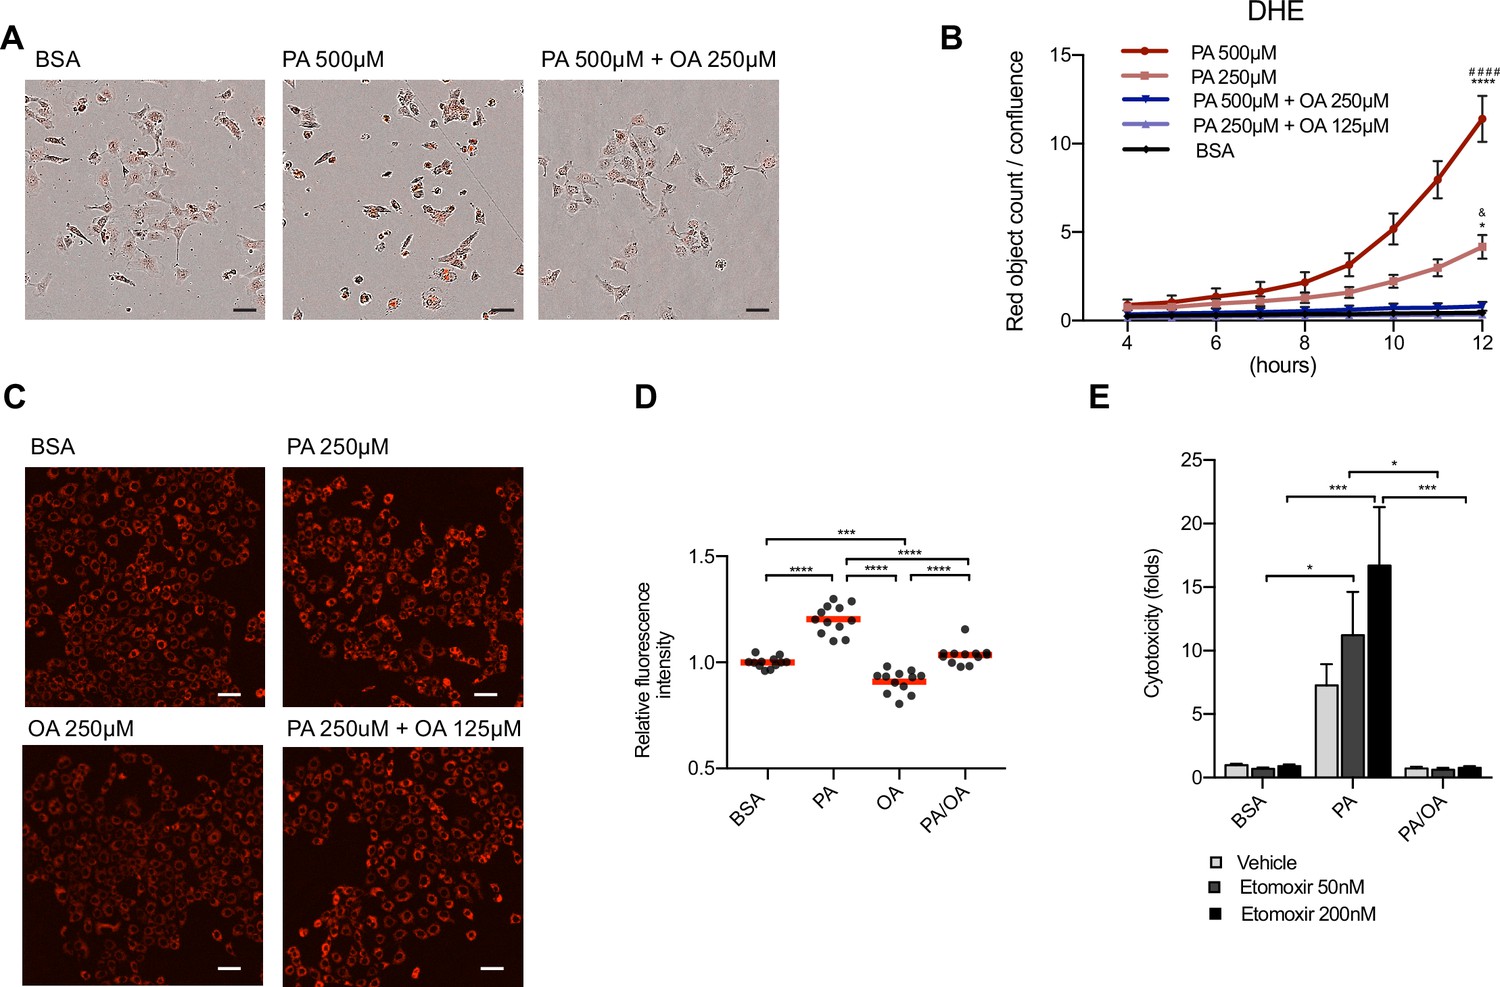
Oleic acid (OA) suppresses palmitic acid (PA)-induced oxidative stress.
(A) Representative images of reactive oxygen species (ROS) generation in induced renal epithelial cells (iRECs) visualized by the incorporation of dihydroethidium (DHE) into the nucleus at 12 hr. Images are the combination of bright-field and fluorescence. Scale bars: 50μm. (B) Quantification of ROS generation in iRECs treated with several bovine serum albumin (BSA) fatty acids combinations. Data are presented as object count per well normalized by confluence. (C, D) Representative fluorescence images (C) of iRECs incubated with tetramethylrhodamine ethyl ester (TMRE) after 16 hr treatment with BSA, PA 250 µM, OA 250 µM and PA 250 µM + OA 125 µM and its quantification (D). Scale bars: 50 μm. (E) Cytotoxicity in iRECs at 36 hr treatment with BSA, PA 250 µM, PA 250 µM + OA 125 µM with or without etomoxir. Fold representation of objects counts/confluence. In (B, E), data are presented as mean ± SEM. In (D), data are presented as mean and the value from every replicate is presented as a dot. (B) *p<0.05, ****p<0.0001 vs. BSA; ####p<0.0001 vs. PA 500 µM + OA 250 µM; &p<0.05 vs. PA 250 µM + OA 125 µM. (D) ***p<0.001, ****p<0.0001. (B, D) One-way ANOVA and Holm–Sidak’s multiple comparisons test, (E) Two-way ANOVA and Holm–Sidak’s multiple comparisons test. (B, E) n = 3. (D) Four technical replicates from three independent experiments were pooled.
Figure 3 with 1 supplement
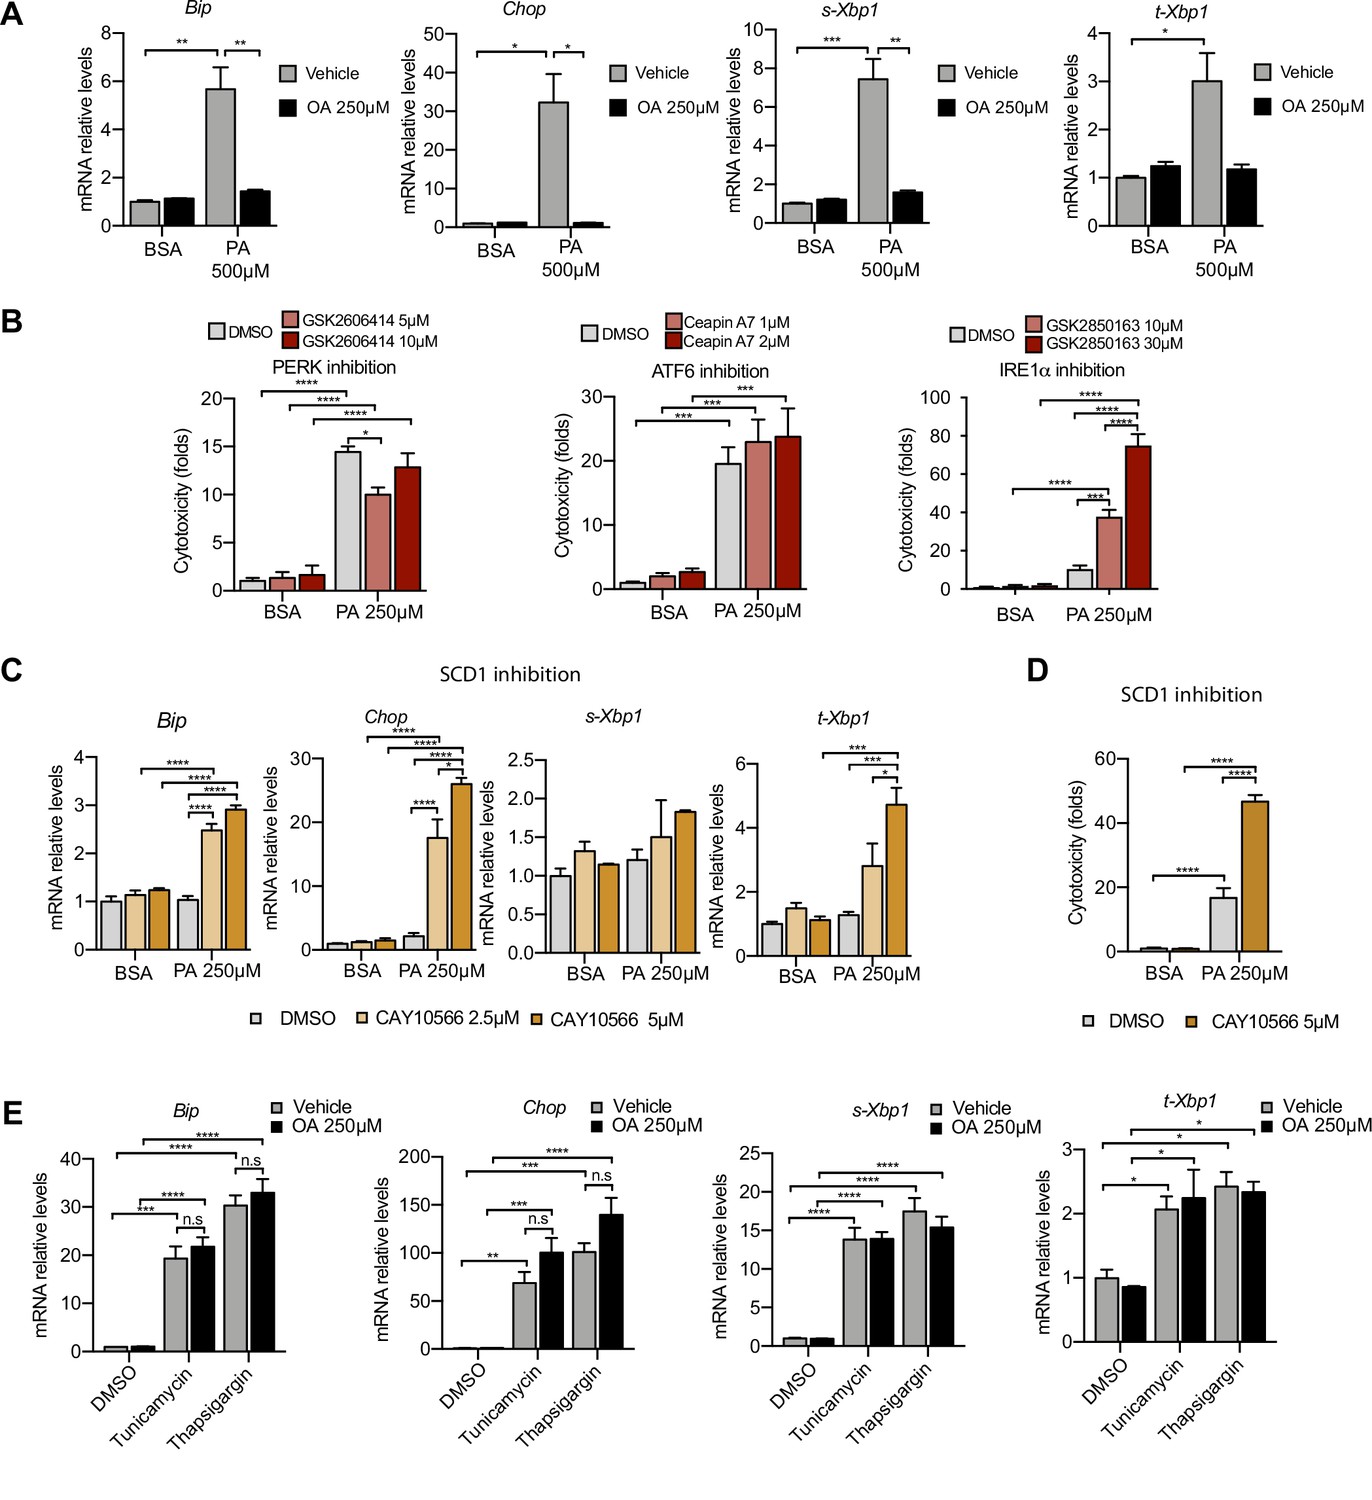
Excess of saturated fatty acids triggers the endoplasmic reticulum (ER) stress response.
(A, C, E) Quantitative RT-PCR detection of ER stress markers in induced renal epithelial cells (iRECs) treated 16 hr with several combinations of BSA-bound fatty acids (A), palmitic acid (PA) plus ER stress signaling inhibitors (B), PA plus SCD1 inhibitor (C), and tunicamycin (10 µM) and thapsigargin (1 µM) plus oleic acid (OA) (E). (B) Cytotoxicity in iRECs at 36 hr treatment with PA 250 µM plus the inhibitors of PERK, ATF6, and IRE1α. Fold representation of object counts/confluence. (D) Cytotoxicity in iRECs at 24 hr treatment with PA 250 µM plus the SCD1 inhibitor. Fold representation of object counts/confluence. Data are presented as mean ± SEM. *p<0.05, **p<0.01, ***p<0.001, ****p<0.0001, ns = nonsignificant; two-way ANOVA and Holm–Sidak’s multiple comparisons test; (D) n = 4; (A–C, E) n = 3.
Figure 3—figure supplement 1
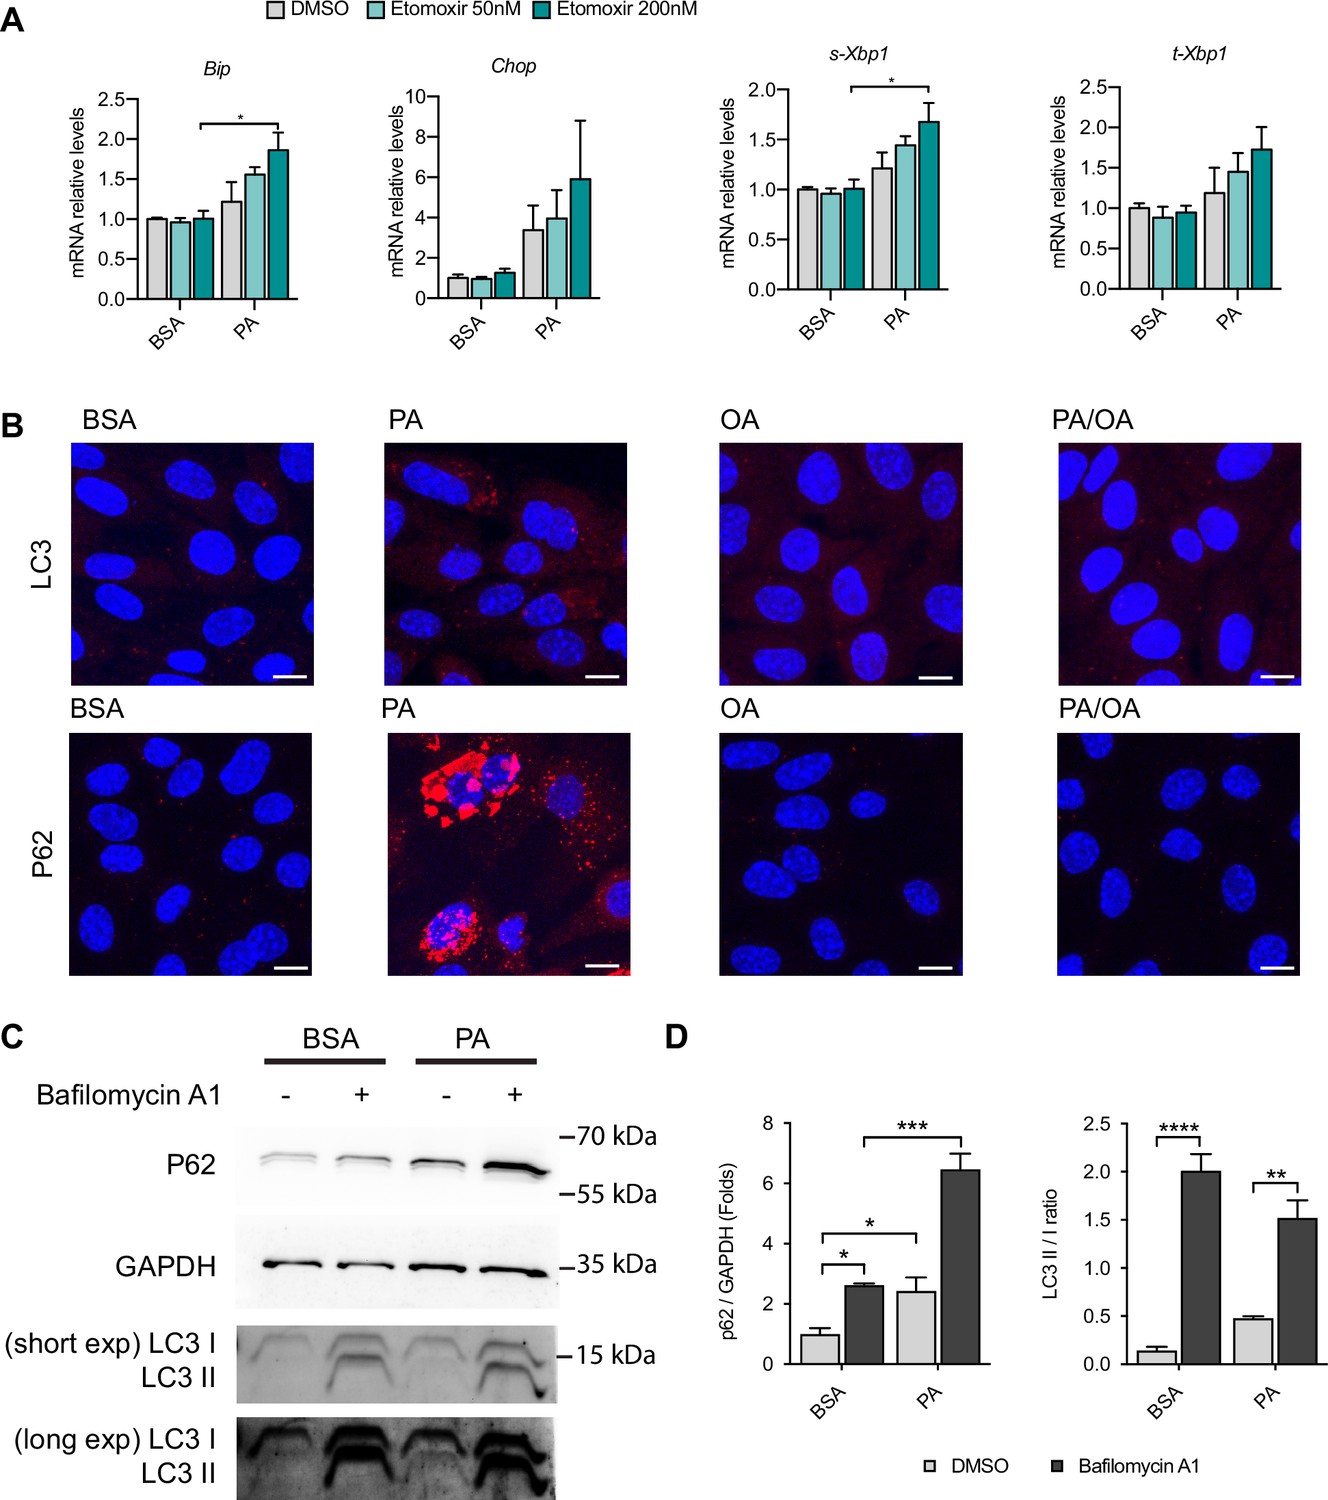
Mitochondrial fatty acid uptake and autophagy during palmitic acid (PA)-induced endoplasmic reticulum (ER) stress.
(A) Quantitative RT-PCR detection of ER stress markers in induced renal epithelial cells (iRECs) treated 16 hr with bovine serum albumin (BSA) and PA 250 µM with or without the etomoxir. (B) Representative images of LC3 and P62 immunostainings of iRECs treated for 16 hr with BSA, PA 250 µM, and PA 250 µM plus oleic acid (OA) 125 µM; n = 3. Scale bars: 10 μm. (C) Representative immunoblot of iRECs lysates obtained from cells treated 16 hr with BSA or PA 250 μM plus 5 hr with bafilomycin A1 (200 nM) or DMSO. Numbers on the right indicate the kDa of molecular weight markers. (D) Quantification of p62 protein levels and LC3 II/I ratio. In (A, D), data are presented as mean ± SEM. *p<0.05, **p<0.01, ***p<0.001; two-way ANOVA plus Holm–Sidak’s multiple comparisons test; n = 3. Unedited blots can be found in Figure 3—figure supplement 1—source data 1.
-
Figure 3—figure supplement 1—source data 1
Unedited Western blots of LC3 and p62.
- https://cdn.elifesciences.org/articles/74391/elife-74391-fig3-figsupp1-data1-v2.zip
Figure 4

Perinuclear membrane order is increased by palmitic acid (PA) treatment and decreased by oleic acid (OA).
(A) Representative C-Laurdan images of merged channels 1 and 2 (upper row), pixel classification (middle row), and generalized polarization (GP) pseudocolored images (lower row). Induced renal epithelial cells (iRECs) were treated for 16 hr with bovine serum albumin (BSA), PA 250 µM, OA 250 µM, and PA 250 µM plus OA 125 µM. Scale bars: 20 μm. (B) GP values quantification of pixels classified as perinuclear from a single representative experiment. *p<0.05, **p<0.01, ***p<0.001, ****p<0.0001, ns = nonsignificant; Wilcoxon signed-rank test; n = 3.
Figure 5 with 1 supplement
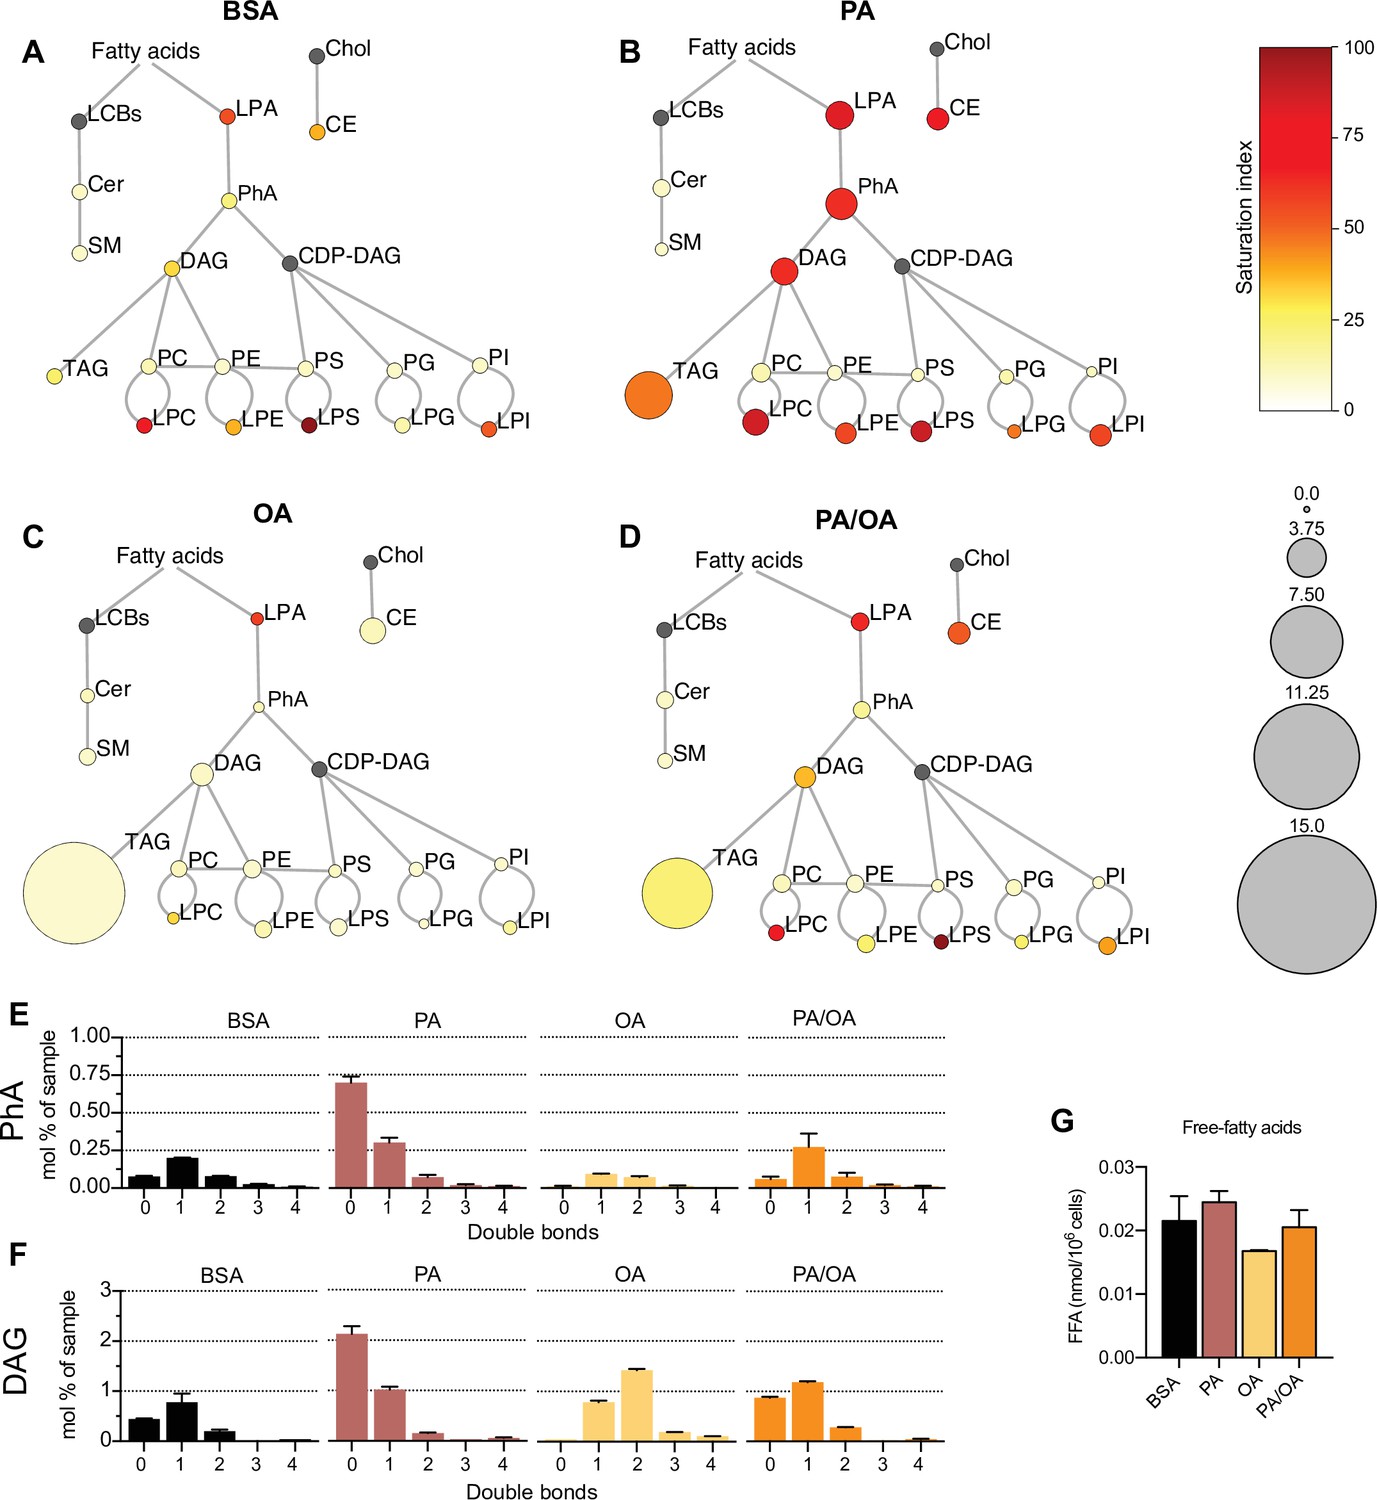
Lipidome of induced renal epithelial cells (iRECs) exposed to bovine serum albumin (BSA)-bound fatty acids.
(A–D) Lipidome of iRECs treated for 16 hr with BSA (A), palmitic acid (PA) 250 µM (B), oleic acid (OA) 250 µM (C), and PA 250 µM plus OA 125 µM (D). The scheme shows the relative levels of lipid classes presented as color-coded circles. The lipid species were designated as saturated if all of their fatty acid chains were saturated, or unsaturated if they had at least one unsaturated fatty acid chain. The percentage of saturated lipid species is shown for each class from yellow (low saturation) to red (high saturation). Lipid classes not identified are shown in gray. Cholesterol is also presented in gray because it has no fatty acid chain. The size of the circles is set to the arbitrary unit of 1 for the BSA cells. G3P: glycerol-3-phosphate; LPA: lyso-phosphatidic acids; PhA: phosphatidic acids; DAG: diacylglycerol; TAG: triacylglycerol; PC: phosphatidylcholine: PE: phosphatidylethanolamine; LPE: lyso-phosphatidylethanolamine; LPC: lyso-phosphatidylcholine; PS: phosphatidylserine; LPS: lyso-phosphatidylserine; PI: phosphatidylinositol; LPI: lyso-phosphatidylinositol; PG: phosphatidylglycerol; LPG: lyso-phosphatidylglycerol; Cer: ceramide; SM: sphingomyelin; LCB: long-chain base; CDP: cytidine diphosphate; Chol: cholesterol; CE: cholesterol esthers (n = 3). (E, F) Relative amount of PhA (E) and DAG (F) species classified by the number of double bonds in iRECs treated for 16 hr with BSA, PA 250 µM, OA 250 µM, and PA 250 µM plus OA 125 µM. Data are presented as mean ± SEM; n = 3. (G) Cytosolic-free fatty acids in iRECs treated for 16 hr with BSA, PA 250 µM, OA 250 µM, and PA 250 µM plus OA 125 µM. Data are presented as mean ± SEM; one-way ANOVA and Holm–Sidak’s multiple comparisons test; n = 3.
Figure 5—figure supplement 1
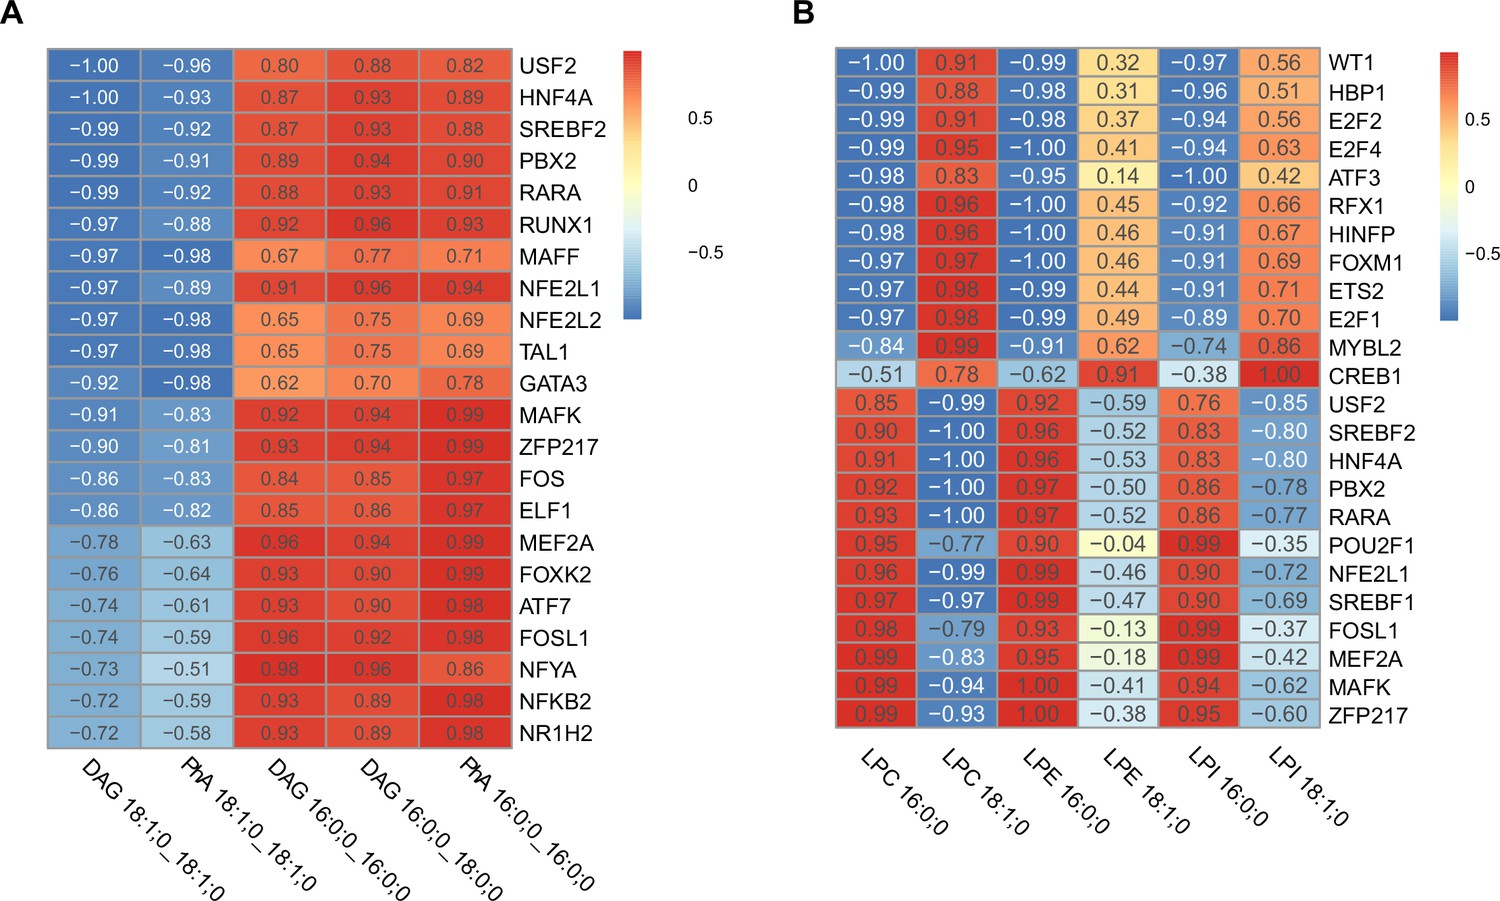
Correlation of transcription factor (TF) activity with relevant components of the endoplasmic reticulum (ER) membrane.
(A) TFs with higher correlation score respect relevant saturated (phosphatidic acids [PhA] 16:0_16:0, diacylglycerol [DAG] 16:0_16:0, DAG 16:0_18:0) and unsaturated (PhA 18:1_18:1, DAG 18:1_18:1) triacylglycerol (TAG) precursors. TFs with fragments per kilobase million (FPKM) < 1 were omitted. (B) TFs with higher correlation score respect relevant saturated (lyso-phosphatidylcholine [LPC] 16:0, lyso-phosphatidylethanolamine [LPE] 16:0, lyso-phosphatidylinositol [LPI] 16:0) and unsaturated (LPC 18:1, LPE 18:1, LPI 18:1) lysophospholipids. TFs with FPKM < 1 were omitted.
Figure 6 with 1 supplement
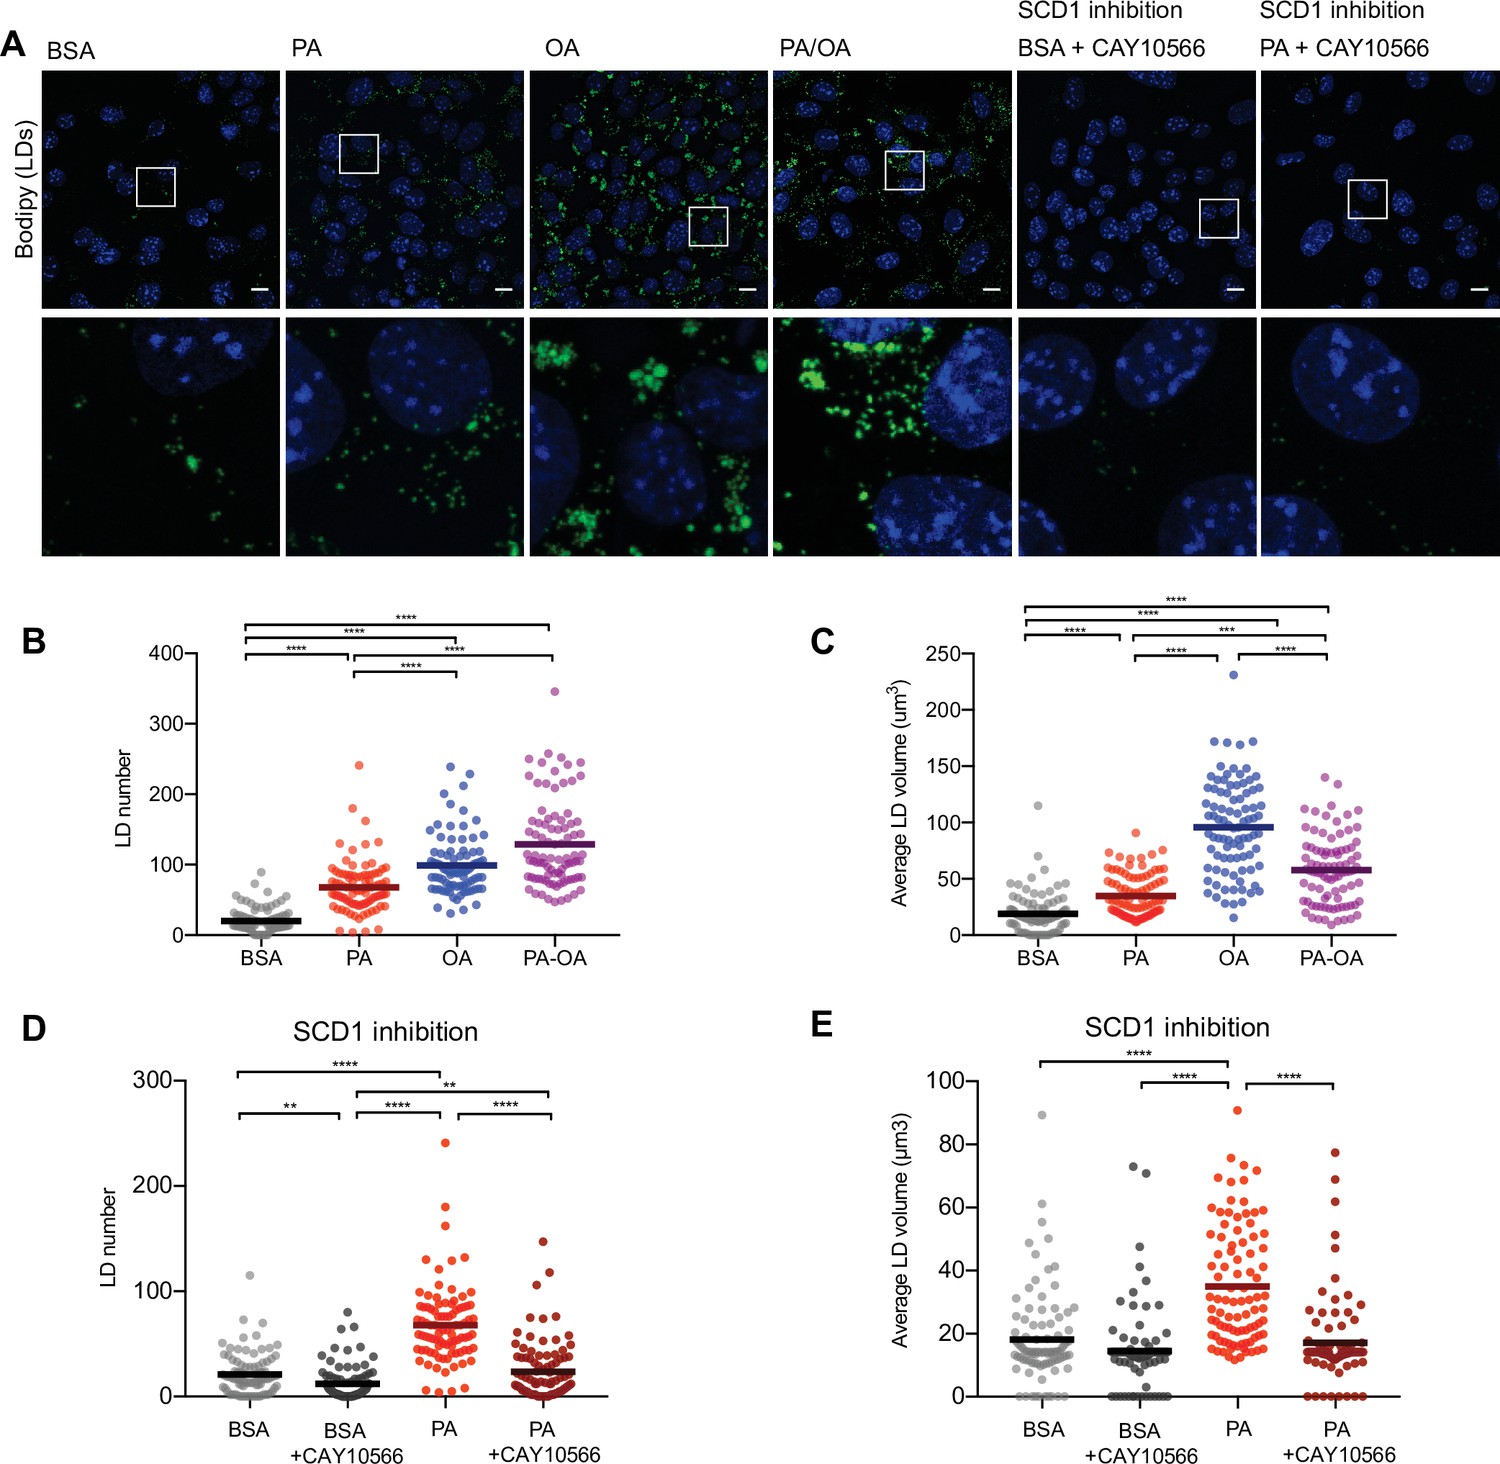
Saturated fatty acids impair the formation of lipid droplets (LDs).
(A) Representative images of LDs stained using BODIPY in induced renal epithelial cells (iRECs) treated for 16 hr with bovine serum albumin (BSA), palmitic acid (PA) 250 µM, oleic acid (OA) 250 µM, PA 250 µM plus OA 125 µM, BSA plus the SCD1 inhibitor CAY10556 (2.5 µM) and PA plus CAY10556 (2.5 µM). Scale bars: 10 μm. (B–E) Quantification of LD number (B, D) and LD average volume (C, E) in iRECs treated for 16 hr with BSA, PA 250 µM, OA 250 µM, PA 250 µM plus OA 125 µM, BSA plus the SCD1 inhibitor CAY10556 (2.5 µM) and PA plus CAY10556 (2.5 µM). Every dot represents the measurement in one single cell. Data information: in (B–E), data are presented as the mean + all values. *p<0.05, **p<0.01, ***p<0.001, ****p<0.0001; Kruskal–Wallis plus Dunn’s multiple comparisons test. (B–E) 10 cells per field from three fields were analyzed for three independent biological replicates.
Figure 6—figure supplement 1
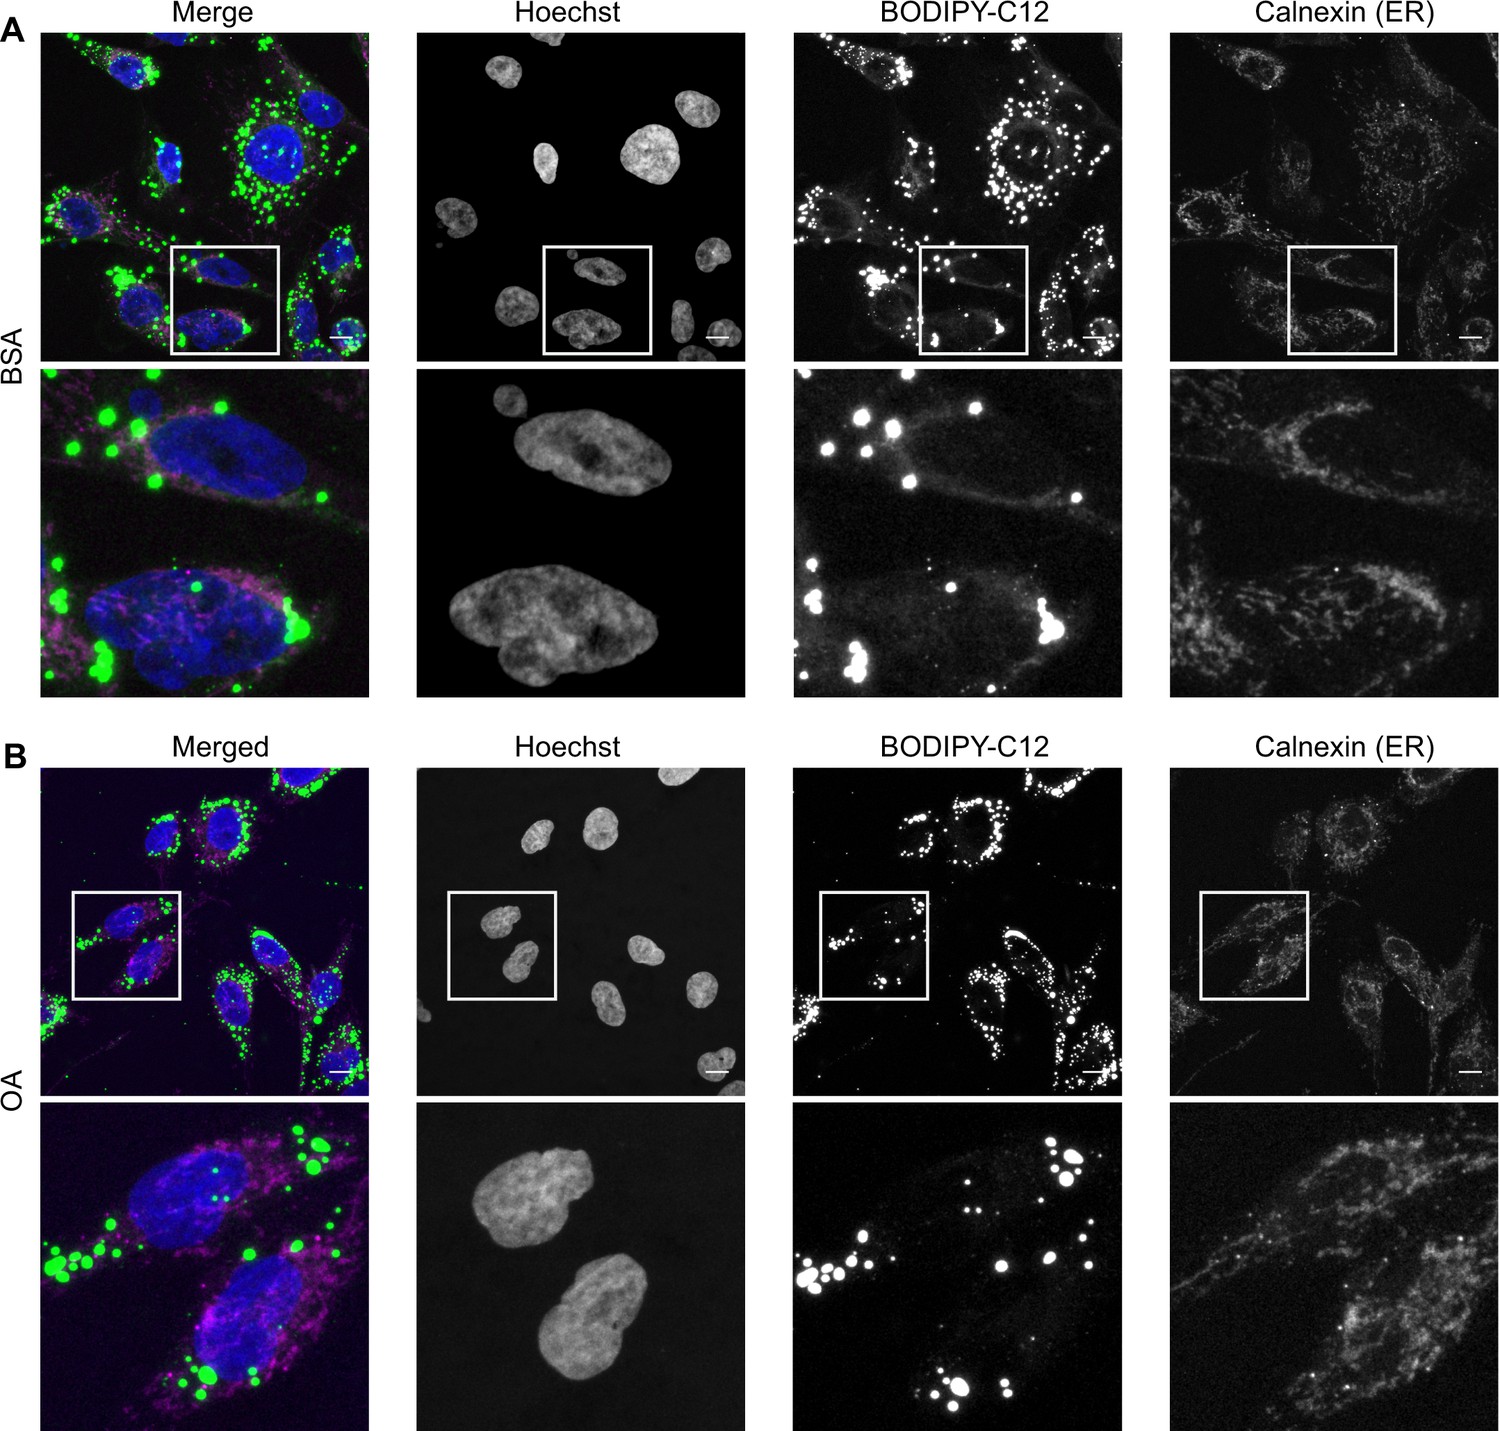
Oleic acid (OA) channels a fatty acid analog into lipid droplets.
Representative images of HK-2 cells treated for 6 hr with BODIPY-C12 together with bovine serum albumin (BSA) (A) or BSA-OA 250 µM (B) and co-stained with the endoplasmic reticulum (ER) marker calnexin; n = 3 for BODIPY C-12 staining and n = 1 for co-staining with calnexin. Scale bars: 10 μm.
Figure 7 with 2 supplements
Triacylglycerol (TAG) synthesis protects from cytotoxic effects induced by exposure to saturated fatty acids.
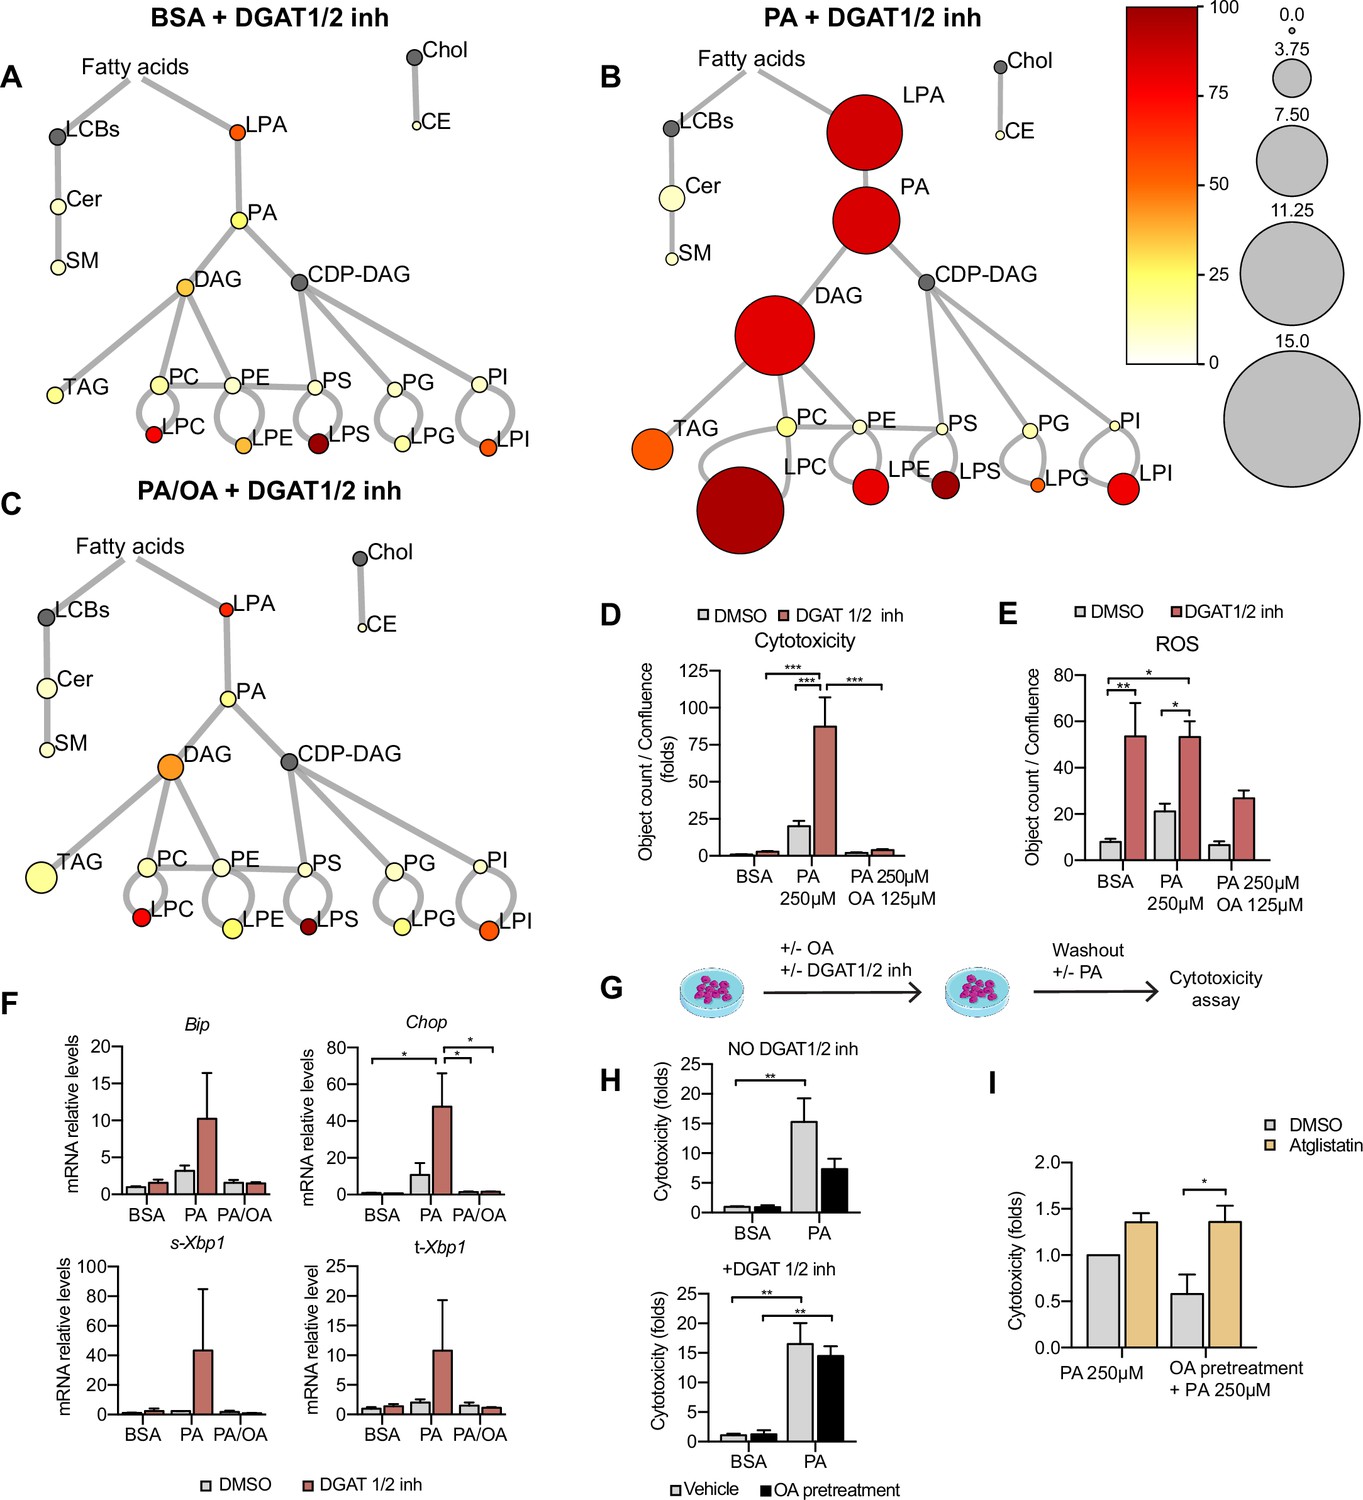
(A–C) Lipidome of induced renal epithelial cells (iRECs) treated for 16 hr with bovine serum albumin (BSA) + T863 30 µM + PF 06424439 30 µM (A), palmitic acid (PA) 250 µM + T863 30 µM + PF 06424439 30 µM (B), and PA 250 µM + oleic acid (OA) 125 µM + T863 30 µM + PF 06424439 30 µM (C). The scheme shows the relative levels of lipid classes presented as color-coded circles. The lipid species were designated as saturated if all of their fatty acid chains were saturated or unsaturated if they had at least one unsaturated fatty acid chain. The percentage of saturated lipid species is shown for each class from yellow (low saturation) to red (high saturation). Lipid classes not identified are shown in gray. Cholesterol is also presented in gray because it has no fatty acid chain. The size of the circles is set to the arbitrary unit of 1 for the BSA (Figure 5). For lipid classes abbreviations, please refer to the legend of Figure 5 (n = 3). (D) Cytotoxicity in iRECs at 36 hr treatment with BSA, PA 250 µM, and PA 250 µM plus OA 125 µM with or without the DGAT1/DGAT2 inhibitors T863/PF 06424439 (30 µM). Fold representation of object counts/confluence. (E) Quantification of reactive oxygen species (ROS) generation in iRECs treated 16 hr with BSA, PA 250 µM, and PA 250 µM plus OA 125 µM with or without the DGAT1/DGAT2 inhibitors T863/PF06424439 (30 µM). Data are presented as object count per well normalized by confluence. (F) Quantitative RT-PCR detection of endoplasmic reticulum (ER) stress markers in iRECs treated 16 hr with BSA, PA 250 µM, and PA 250 µM plus OA 125 µM with or without the DGAT1/DGAT2 inhibitors T863/PF06424439 (30 µM). (G) Schematic representation of OA pretreatment plus PA insult experiment. (H) Cytotoxicity in iRECs at 36 hr after PA 250 µM treatment. Cells were pretreated for 16 hr with OA 500 µM or BSA with or without DGAT1/DGAT2 inhibitors T863/PF06424439 (30 µM). Fold representation of object counts/confluence. (I) Cytotoxicity in iRECs at 36 hr after PA 250 µM treatment with or without atglistatin (25 µM). Cells were pretreated for 16 hr with OA 500 µM or BSA. Fold representation of object counts/confluence. In (D–F, H, I), data are presented as mean ± SEM. *p<0.05, **p<0.01, ***p<0.001, ****p<0.0001; two-way ANOVA and Holm–Sidak’s multiple comparisons test. (A–D, F, H, I) n = 3. (E) n = 4.
Figure 7—figure supplement 1
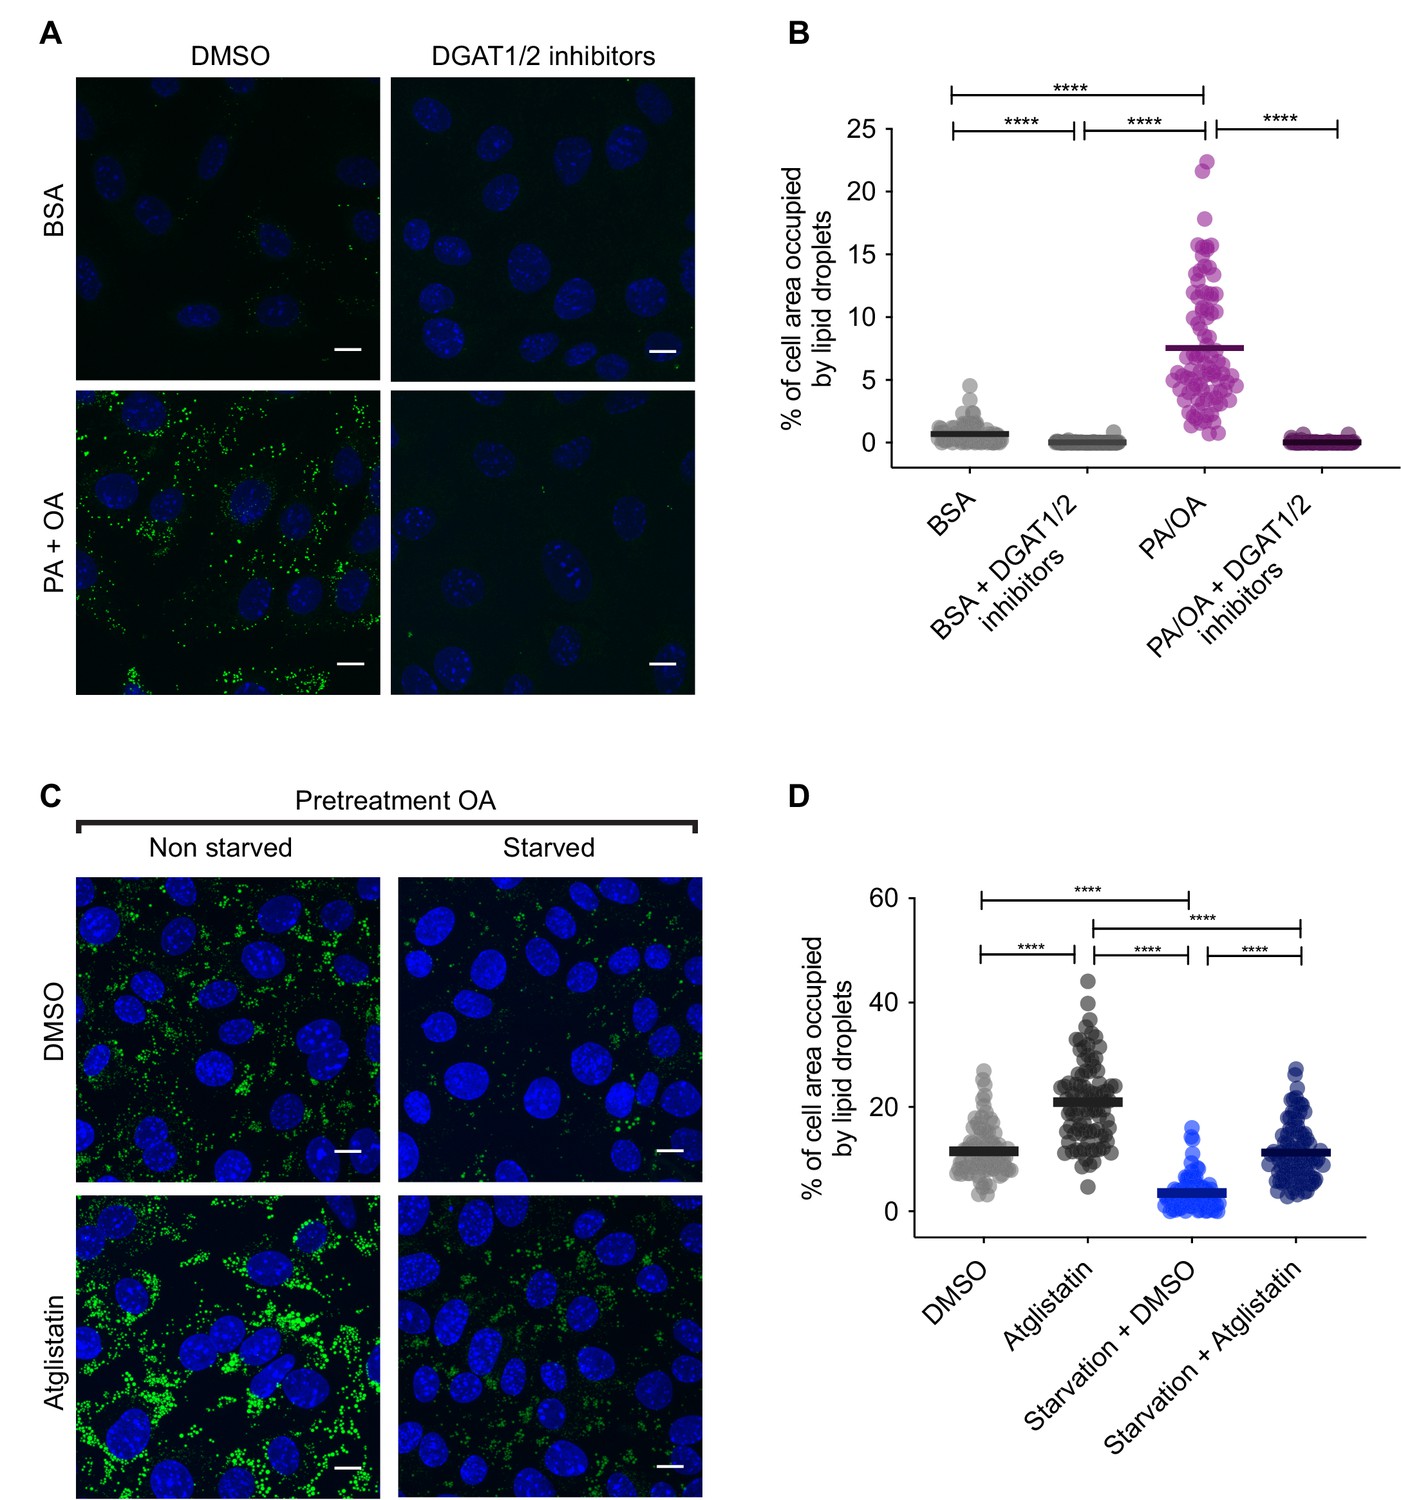
Pharmacological inhibition of lipid droplet (LD) biogenesis and degradation.
(A, B) Representative images (A) and quantification (B) of LDs stained using BODIPY in induced renal epithelial cells (iRECs) treated for 16 hr with palmitic acid (PA) 250 µM + oleic acid (OA) 125 µM with or without the DGAT1/DGAT2 inhibitors T863/PF 06424439 (30 µM). Scale bars: 10 μm. (C, D) Representative images (C) and quantification (D) of LDs stained using BODIPY in iRECs cultured for 16 hr in starvation medium (1% FBS) and complete medium (10% FBS + OA 500 µM) with or without atglistatin (25 µM). Cells were pretreated for 16 hr with OA 500 µM. In (B, D), data are presented as the mean + all values. *p<0.05, **p<0.01, ***p<0.001, ****p<0.0001; Kruskal–Wallis plus Dunn’s multiple comparisons test. (B, D) 10 cells per field from three fields were analyzed for three independent biological replicates. Every dot represents the measurement in one single cell.
Figure 7—figure supplement 2
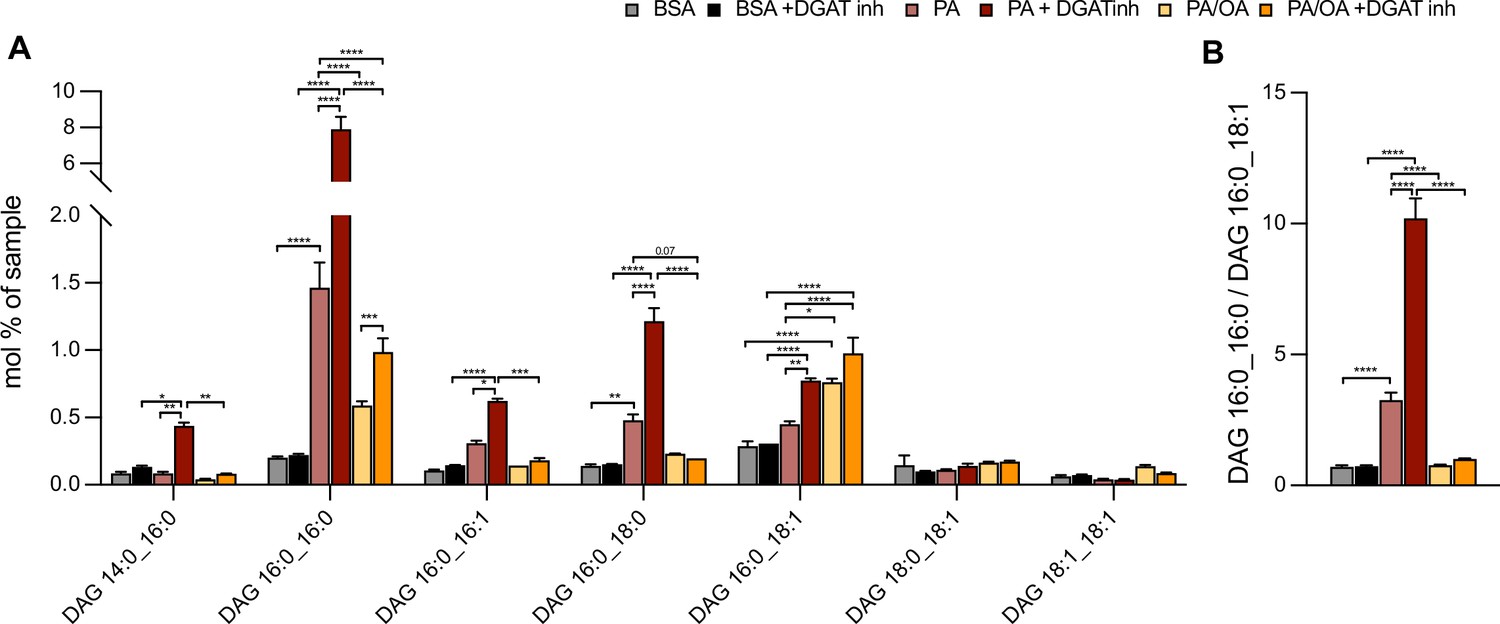
Oleic acid (OA) rescues palmitic acid (PA)-induced increase of diacylglycerol (DAG) saturation independently of triacylglycerol (TAG) synthesis.
(A) Main DAG subspecies in induced renal epithelial cells (iRECs) treated with bovine serum albumin (BSA), PA 250 µM, and PA 250 µM plus OA 125 µM with or without the DGAT1/DGAT2 inhibitors T863/PF 06424439 (30 µM). (B) Ratio of DAG that have incorporated two PA molecules (DAG 16:0_16:0) vs. DAG that have incorporated one PA molecule and one OA molecule (DAG 16:0_18:1). In (A, B), data are presented as mean ± SEM. *p<0.05, **p<0.01, ***p<0.001; (A) two-way ANOVA plus Holm–Sidak’s multiple comparisons test; n = 3. (B) one-way ANOVA plus Holm–Sidak’s multiple comparisons test; n = 3.
Figure 8 with 2 supplements
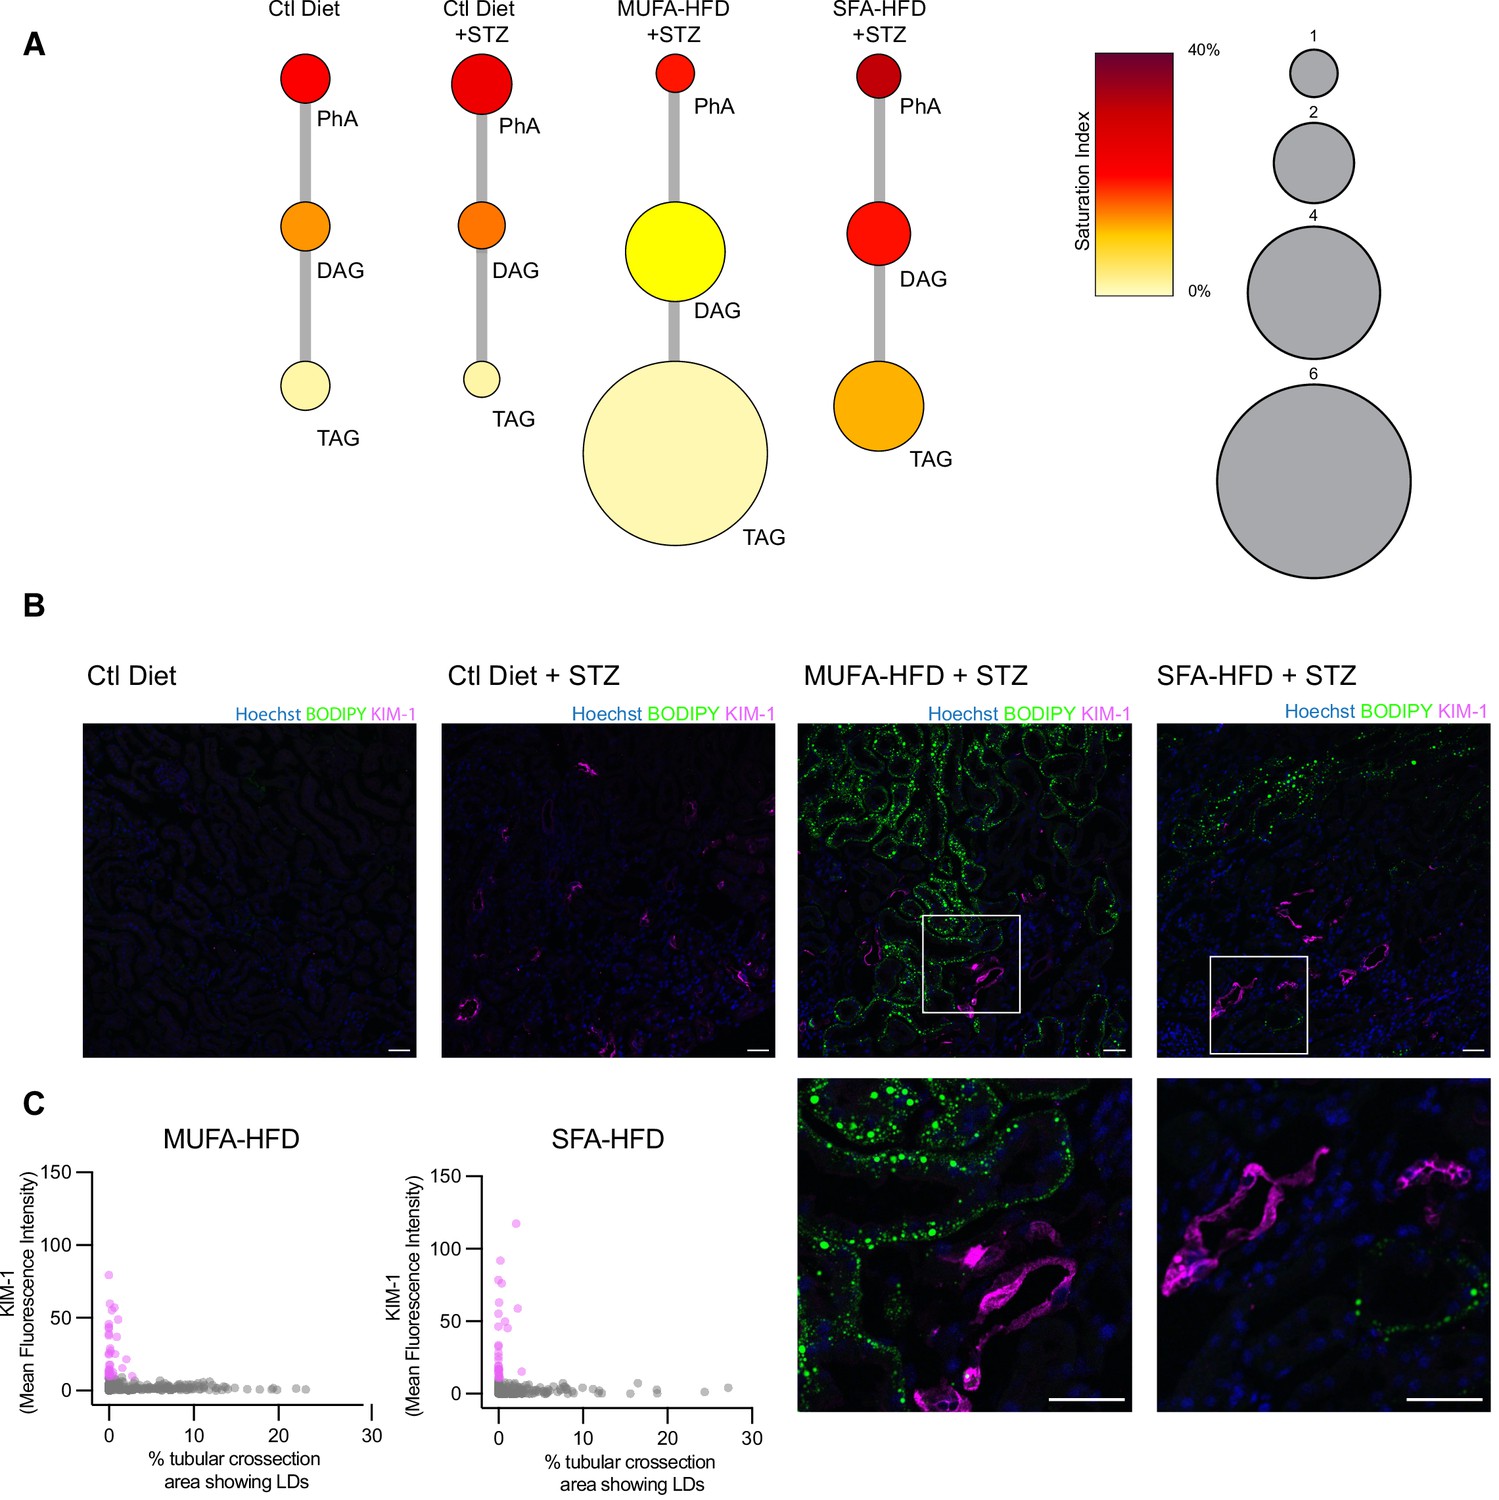
Triacylglycerol (TAG) synthesis protects from cytotoxic effects induced by exposure to saturated fatty acids in mouse kidney.
(A) Relative levels of lipid classes involved in the synthesis of TAGs in the kidney cortex of mice. Lipid species were designated as saturated if both of their acyl chains were saturated or unsaturated if they had at least one unsaturated acyl chain. The size of the circles is set to the arbitrary unit of 1 for the control group. PhA: phosphatidic acid; DAG: diacylglycerol; TAG: triacylglycerol. n = 3. (B, C) Representative confocal fluorescence images (B) and quantification (C) of mouse kidney stained for KIM-1 and lipid droplets. Scale bars: 50 μm. (C) Each dot represents one tubular cross section. All megalin-positive tubules from three images from two mice were analyzed for each condition. Dots are colored magenta when KIM-1 mean intensity was bigger than 10.
Figure 8—figure supplement 1
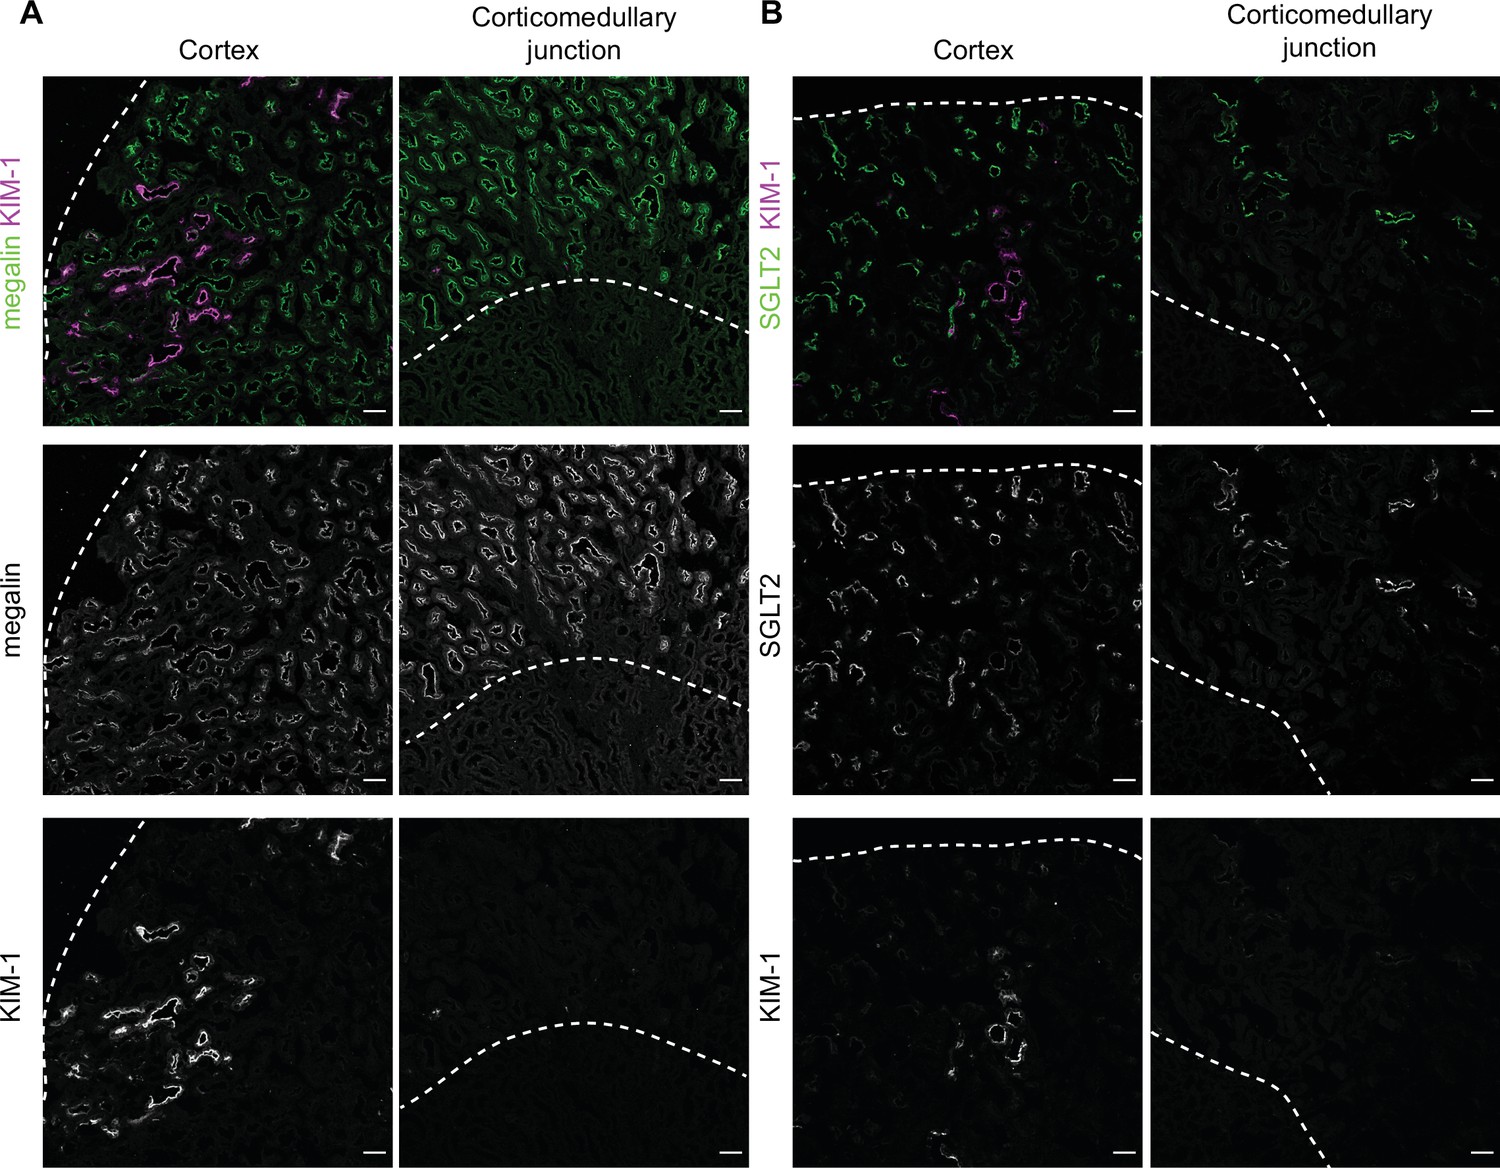
KIM-1 colocalizes with SGLT2 and megalin in the cortex of diabetic mice.
(A,B) Representative confocal fluorescence images of saturated fatty acids high-fat diet plus streptozotocin (SFA-HFD + STZ) mice kidney stained for KIM-1 and megalin (A) or SGLT2 (B). Dashed lines show the edge of the cortex or the corticomedullary junction. Scale bars: 50 μm.
Figure 8—figure supplement 2
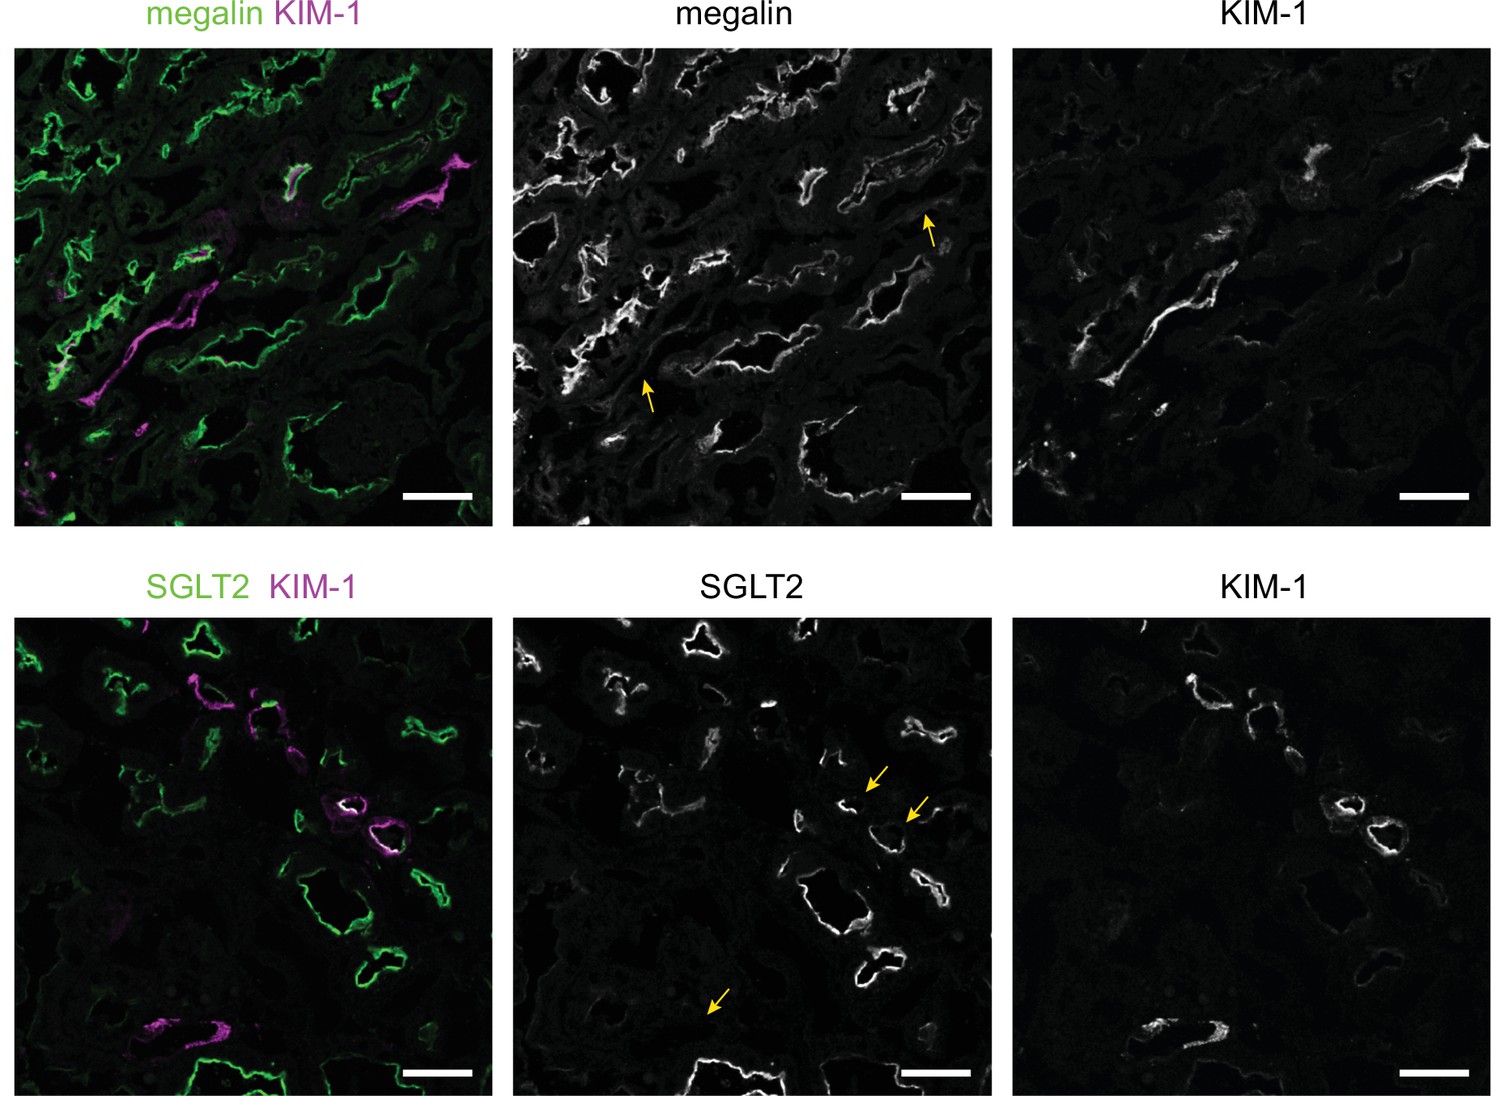
KIM-1 does not colocalize with SGLT2 and megalin in a subset of tubules in the cortex of diabetic mice.
Representative confocal fluorescence images of saturated fatty acids high-fat diet plus streptozotocin (SFA - HFD + STZ) mice kidneys stained for KIM-1 and SGLT2 or megalin. Arrows indicate tubules with partial or total loss of the tubular segment markers. Scale bars: 50 μm.
Author response image 1
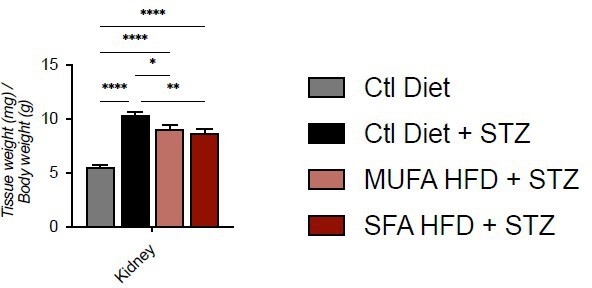
Tissue weight normalized for body weight.
Data are presented as mean ± SEM. *p<0.05, **p<0.01, ****p<0.0001; One-way ANOVA plus Holm-Sidak’s multiple comparisons test. n=7 Ctl diet, n=8 Ctl Diet + STZ, n=8 MUFA-HFD + STZ, n=7 SFA-HFD + STZ.
Author response image 2
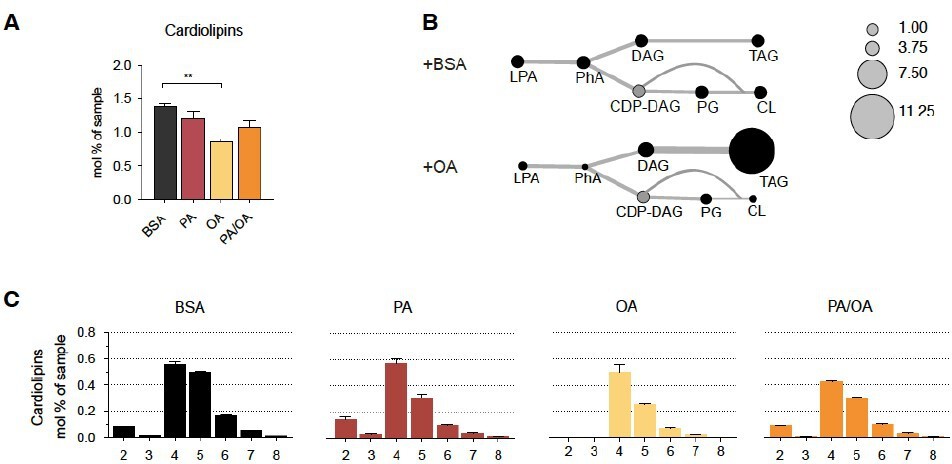
Cardiolipin profile of iRECs treated with PA, OA and PA/OA (A) Cardiolipin levels in iRECs treated for 16h with BSA, PA 250µM, OA 250µM and PA 250µM plus OA 125µM.
Data are presented as mean ± SEM; **p<0.01; One-way ANOVA and Holm-Sidak’s multiple comparisons test; n=3. (B) Relative levels of lipid classes involved in the synthesis of TAGs and cardiolipins in iRECs treated for 16h with BSA and OA 250µM. The size of the circles is set to the arbitrary unit of 1 for the BSA cells. Lipid classes not identified are shown in grey. LPA: lyso-phosphatidic acids; PhA: phosphatidic acids; DAG: diacylglycerol; TAG: triacylglycerol; PG: phosphatidylglycerol; CDP: cytidine diphosphate. (n=3) (C) Relative amount of Cardiolipin species classified by the number of double bonds in iRECs treated for 16h with BSA, PA 250µM, OA 250µM and PA 250µM plus OA 125µM. Data are presented as mean ± SEM ; n=3.
Tables
Key resources table
| Reagent type (species) or resource | Designation | Source or reference | Identifiers | Additional information |
|---|---|---|---|---|
| Commercial assay or kit | Free fatty acid quantification Kit | Sigma-Aldrich | #MAK044 | |
| Commercial assay or kit | Triglyceride determination kit | Sigma-Aldrich | #MAK266 | |
| Commercial assay or kit | Mouse NGAL (Lipocalin-2) ELISA Kit | BioLegend | #443,707 | |
| Chemical compound, drug | T863 | MedChemExpress | HY-32219 | (30 μM) |
| Chemical compound, drug | PF 06424439 | Bio-Techne | #6348/5 | (30 μM) |
| Chemical compound, drug | Etomoxir | Calbiochem | #236,020 | (50 nM; 200 nM) |
| Chemical compound, drug | Bafilomycin A1 | VWR | #J61835.MX | (200 nM) |
| Chemical compound, drug | CAY10566 | MedChemExpress | #HY-15823 | (2.5 μM; 5 μM) |
| Chemical compound, drug | Atglistatin | Sigma-Aldrich | SML1075 | (25 μM) |
| Chemical compound, drug | GSK2606414 | MedChemExpress | HY-18072 | (5 μM; 10 μM) |
| Chemical compound, drug | GSK2850163 | Sigma-Aldrich | #1,684 | (10 μM; 30 μM) |
| Chemical compound, drug | Ceapin-A7 | Sigma-Aldrich | #SML2330 | (1 μM; 2 μM) |
| Chemical compound, drug | Tunicamycin | Sigma-Aldrich | #5045700001 | (10 μM) |
| Chemical compound, drug | Thapsigargin | Sigma-Aldrich | #586,005 | (1 μM) |
| Chemical compound, drug | BODIPY 493/503 | Thermo Fisher Scientific | #D3922 | (2.5 μg/mL) |
| Chemical compound, drug | C1-BODIPY 500/510C12 | Thermo Fisher Scientific | #D3823 | (2 μM) |
| Chemical compound, drug | C-Laurdan | Dr. B.R. Cho, Korea University, South Korea | PMID:23311388 | (10 μg/mL) |
| Chemical compound, drug | IncuCyte Cytotox Red Reagent | EssenBio | #4632 | (1:2000) |
| Chemical compound, drug | TMRE | Thermo Fisher Scientific | #T669 | (50 nM) |
| Chemical compound, drug | DHE | Thermo Fisher Scientific | #D23107 | 10 μM |
| Chemical compound, drug | Streptozotocin; STZ | Sigma-Aldrich | #S0130 | (50 mg/kg) |
| Antibody | Anti-p62 (rabbit, polyclonal) | Cell Signaling | #5114 | WB (1:1000) |
| Antibody | Anti-LC3 (rabbit, polyclonal) | MBL | #PM036 | WB (1:1000) |
| Antibody | Anti-GAPDH (rabbit, polyclonal) | Abcam | #ab9485 | WB (1:1000) |
| Antibody | G anti-KIM-1 (goat, polyclonal) | R&D Systems | #AF1817 | IHC (1:100) |
| Antibody | Anti-SGLT2 (rabbit, polyclonal) | Abcam | #ab85626 | IHC (1:200) |
| Antibody | Anti-p62 (guinea pig, polyclonal) | Progen | #GP62-C | IF (1:1000) |
| Antibody | Anti-megalin (rabbit, polyclonal) | Prof. Michigami, Osaka Women’s and Children’s Hospital, Osaka, Japan | PMID:15976002 | IHC (1:1000) |
| Cell line (Mus musculus) | iRECs | Prof. Soeren S. Lienkamp. Institute of Anatomy, University of Zurich, Zurich, Switzerland | PMID:27820600 | |
| Cell line (Homo sapiens) | HK-2 | ATCC | CRL-2190 | |
| Cell line (Didelphis marsupialis virginiana) | OK | ATCC | CRL-1840 | |
| Sequence-based reagent | 18S Fw | This paper | qPCR primers | 5′-CGGCTACCACATCCAAGGAA-3′ |
| Sequence-based reagent | 18S Rv | This paper | qPCR primers | 5′-GCTGGAATTACCGCGGCT-3′ |
| Sequence-based reagent | Actb Fw | This paper | qPCR primers | 5′GCTCTGGCTCCTAGCACCAT-3′ |
| Sequence-based reagent | Actb Rv | This paper | qPCR primers | 5′-GCCACCGATCCACACAGAGT-3′ |
| Sequence-based reagent | Bip Fw | This paper | qPCR primers | 5′-TTCAGCCAATTATCAGCAAACTCT-3′ |
| Sequence-based reagent | Bip Rv | This paper | qPCR primers | 5′-TTTTCTGATGTATCCTCTTCACCAGT-3′ |
| Sequence-based reagent | Cd36 Fw | This paper | qPCR primers | 5′-GATGACGTGGCAAAGAACAG-3′ |
| Sequence-based reagent | Cd36 Rv | This paper | qPCR primers | 5′-TCCTCGGGGTCCTGAGTTAT-3′ |
| Sequence-based reagent | Chop Fw | This paper | qPCR primers | 5′-CCACCACACCTGAAAGCAGAA-3′ |
| Sequence-based reagent | Chop Rv | This paper | qPCR primers | 5′-AGGTGAAAGGCAGGGACTCA-3′ |
| Sequence-based reagent | Ccl5 Fw | This paper | qPCR primers | 5′-CCCTCACCATCATCCTCACT-3′ |
| Sequence-based reagent | Ccl5 Rv | This paper | qPCR primers | 5′-TCCTTCGAGTGACAAACACG-3′ |
| Sequence-based reagent | Fn1 Fw | This paper | qPCR primers | 5′-TTAAGCTCACATGCCAGTGC-3′ |
| Sequence-based reagent | Fn1 Rv | This paper | qPCR primers | 5′-TTAAGCTCACATGCCAGTGC-3′ |
| Sequence-based reagent | Slc27a2 Fw | This paper | qPCR primers | Fw 5′-ACACACCGCAGAAACCAAATGACC-3′ |
| Sequence-based reagent | Slc27a2 Rv | This paper | qPCR primers | 5′-TGCCTTCAGTGGATGCGTAGAACT-3′ |
| Sequence-based reagent | s-Xbp1 Fw | This paper | qPCR primers | 5′-CTGAGTCCGAATCAGGTGCAG-3′ |
| Sequence-based reagent | s-Xbp1 Rv | This paper | qPCR primers | 5′-GTCCATGGGAAGATGTTCTGG-3′ |
| Sequence-based reagent | t-Xbp1 Fw | This paper | qPCR primers | 5′-TGGCCGGGTCTGCTGAGTCCG-3′ |
| Sequence-based reagent | t-Xbp1 Rv | This paper | qPCR primers | 5′-GTCCATGGGAAGATGTTCTGG-3′ |
Appendix 1—table 1
Nutrient composition of mouse diets.
| CTL DIET | MUFA-HFD | SFA-HFD | |
|---|---|---|---|
| Macronutrients | |||
| Carbohydrates (kcal%) | 58 | 35 | 35 |
| Protein (kcal%) | 24 | 20 | 20 |
| Fat (kcal%) | 18 | 45 | 45 |
| Energy density (kcal/g) | 3.1 | 4.52 | 4.52 |
| Source of fat | |||
| Soybean Oil (kcal%) | 18 | 2.2 | 2.2 |
| Olive Oil (kcal%) | 0 | 42.8 | 0 |
| Butter, Anhydrous (kcal%) | 0 | 0 | 42.8 |
| Saturated | 15.5 | 14.3 | 62.6 |
| Monounsaturated | 23.9 | 69.5 | 30.7 |
| Polyunsaturated | 60.6 | 15.9 | 6.8 |
| Typical fatty acids composition (%) | Soybean Oil | Olive Oil | Butter, Anhydrous |
| C4, Butyric | 0 | 0 | 3.2 |
| C6, Caproic | 0 | 0 | 1.9 |
| C8 Caprylic | 0 | 0 | 1.1 |
| C10, Capric | 0 | 0 | 2.5 |
| C12, Lauric | 0 | 0 | 2.8 |
| C14, Myristic | 0.1 | 0 | 10 |
| C14:1, Myristoleic | 0 | 0 | 1.5 |
| C16, Palmitic | 10.4 | 11.5 | 26.2 |
| C16:1, Palmitoleic | 0.1 | 1.2 | 2.3 |
| C18, Stearic | 3.9 | 2.3 | 12.1 |
| C18:1, Oleic | 23 | 70.5 | 25.1 |
| C18:2, Linoleic | 51.8 | 13.0 | 2.3 |
| C18:3, Linolenic | 7.4 | 0.6 | 0 |
| C20, Arachidic | 0.4 | 0.4 | 1 |
| C20:1 | 0 | 0.2 | 0 |
| C22, Behenic | 0.3 | 0 | 0 |
| C24, Lignoceric | 0.2 | 0 | 0 |
Appendix 1—table 2
Spot urine parameters.
| Ctl Diet | Ctl Diet +STZ | MUFA-HFD+STZ | SFA-HFD+STZ | |
|---|---|---|---|---|
| UACR (μg/mg) | 28.71±8.30 | 64.81±38.28 | 177±59.10 **** # | 97.41±21.76* |
| Glucose / Creatinine (mg/mg) | 0.8599±0.34 | 2734±1360*** | 1433±859.90* | 1435±821.10* |
-
Urine albumin-to-creatinine ratio (UACR) and Urine glucose-to-creatinine ratio at 14 weeks after STZ injection. Data are presented as mean ± StDev. *p<0.05, ****p<0.0001 vs Ctl Diet; #p<0.05 vs Ctl Diet + STZ (Kruskal-Wallis plus Dunn’s multiple comparisons test). n=7 Ctl diet, n=8 Ctl Diet + STZ, n=8 MUFA-HFD + STZ, n=7 SFA-HFD + STZ.
Additional files
Download links
A two-part list of links to download the article, or parts of the article, in various formats.
Downloads (link to download the article as PDF)
Open citations (links to open the citations from this article in various online reference manager services)
Cite this article (links to download the citations from this article in formats compatible with various reference manager tools)
Reducing lipid bilayer stress by monounsaturated fatty acids protects renal proximal tubules in diabetes
eLife 11:e74391.
https://doi.org/10.7554/eLife.74391


