Humans perseverate on punishment avoidance goals in multigoal reinforcement learning
- The Hebrew University of Jerusalem, Israel
- Max Planck UCL Centre for Computational Psychiatry and Ageing Research, University College London, United Kingdom
- Wellcome Centre for Human Neuroimaging, University College London, United Kingdom
- Division of Psychiatry, University College London, United Kingdom
Figures
Figure 1
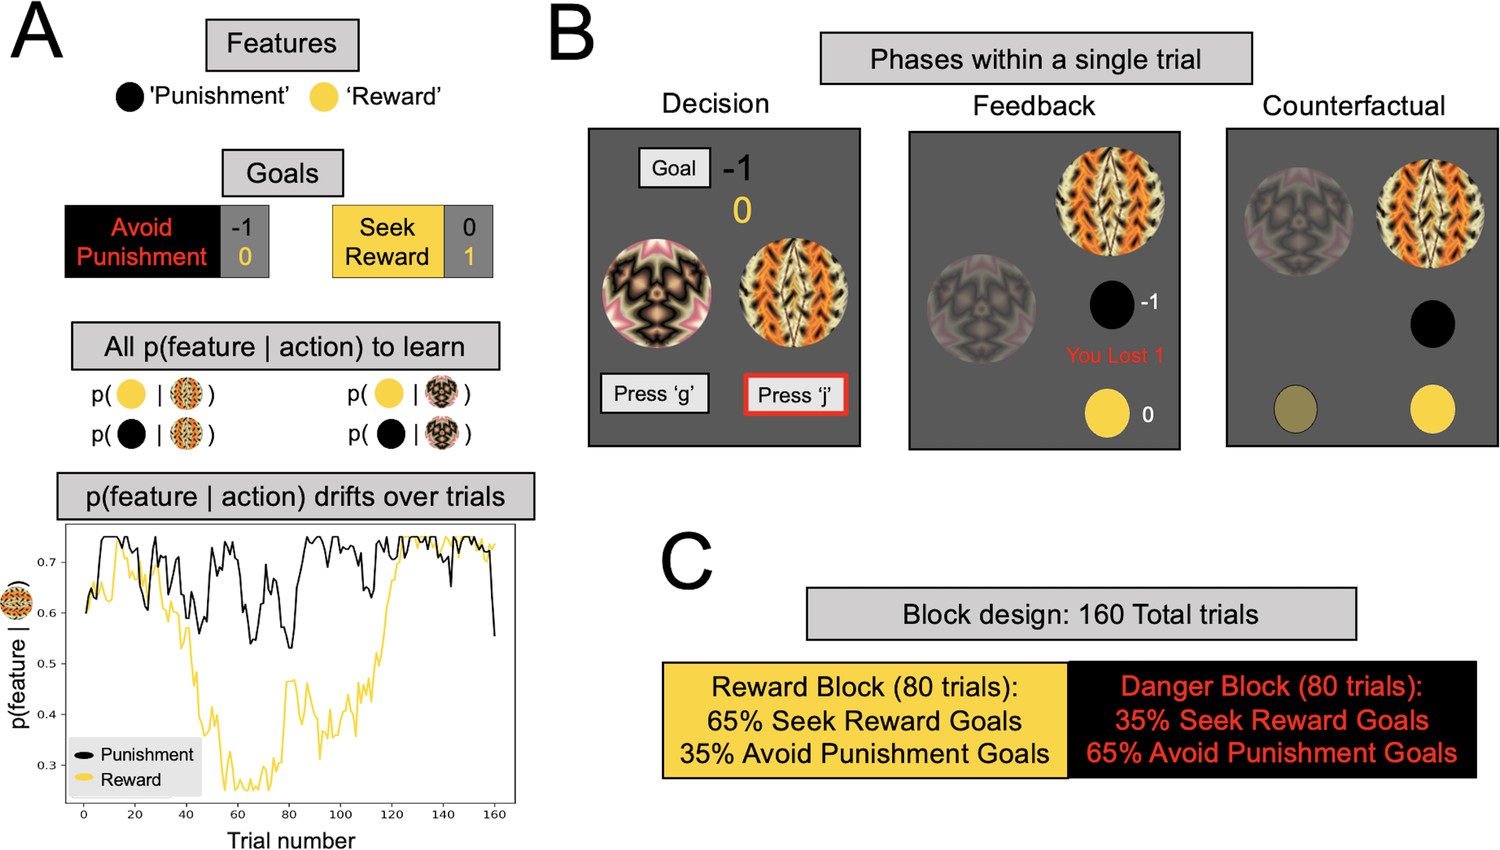
Multigoal pursuit task.
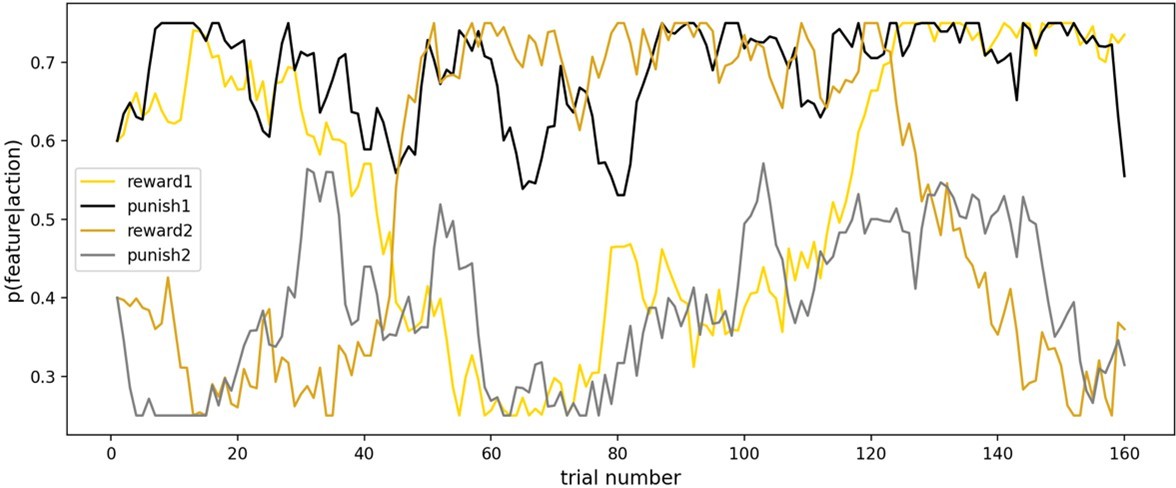
(A) Key task components. Participants were instructed to learn the likelihood of observing two features (gold and black circles) after taking each of two actions (pressing ‘g’ or ‘j’ on the keyboard), and integrate this knowledge with instructed trial-specific goals denoting the present reward or punishment value of each feature. There were two possible goals: in one participants were instructed to seek the reward feature (reward feature = +1 point, punishment feature = 0) and in the other to avoid the punishment feature (reward feature = 0, punishment feature = −1 point). Thus, if the goal was to seek reward, participants should have selected the action most likely to lead to the reward feature (gold circle), irrespective of whether the action lead to the punishment feature (as the value of the latter is 0). Critically, whether each of the two features was present was determined independently, that is, for each action there were four different possible outcome configurations (both features present/reward feature only/punishment feature only/both features absent). To pursue goals, participants had to learn via experience four probabilities (left panel, all p(feature|action)) comprising the likelihood of observing each feature following each action (i.e., they were never instructed about these probabilities). Continued learning was required because the true probabilities of observing features for different actions drifted across trials according to semi-independent random walks (bottom left). Although participants were instructed with a more neutral narrative (see Methods), here we refer to the gold circle as the reward feature and the black circle as the punishment feature. However, the gold circle was rewarding only for reward seeking goal trials (and of no value during punishment avoidance goal trials), whereas the black circle was punishing only during punishment avoidance goal trials (and of no value during reward seeking goal trials). In the actual task implementation, the color for the reward and punishment features, and the random walks each feature took, were counterbalanced across participants. (B) Phases of a single trial. First, participants were shown both fractals and the current goal, and asked to select an action (‘Decision’). After they took an action (here, clicking ‘j’, denoted by the red outline), participants were shown feedback, which comprised the feature outcomes, the present reward value of each feature, and the total points gained (possible total points were: (1) ‘You lost 1’, (2) 0, or (3) ‘You won 1’). Finally, participants were shown the feature outcomes they would have seen had they chosen the other action (‘Counterfactual’), which could be any of four possible feature combinations. (C) Goal abundance manipulation. A totality of 160 trials were divided into two equal length blocks, constituting reward- and punishment-rich contexts. In a reward-rich context, reward seeking trials outnumbered punishment avoidance trials, and the converse was true in a punishment-rich context. Note, both the sequence and order of blocks were counterbalanced across goal types to ensure neither factor could account for prioritizing a specific goal.
Figure 2 with 3 supplements
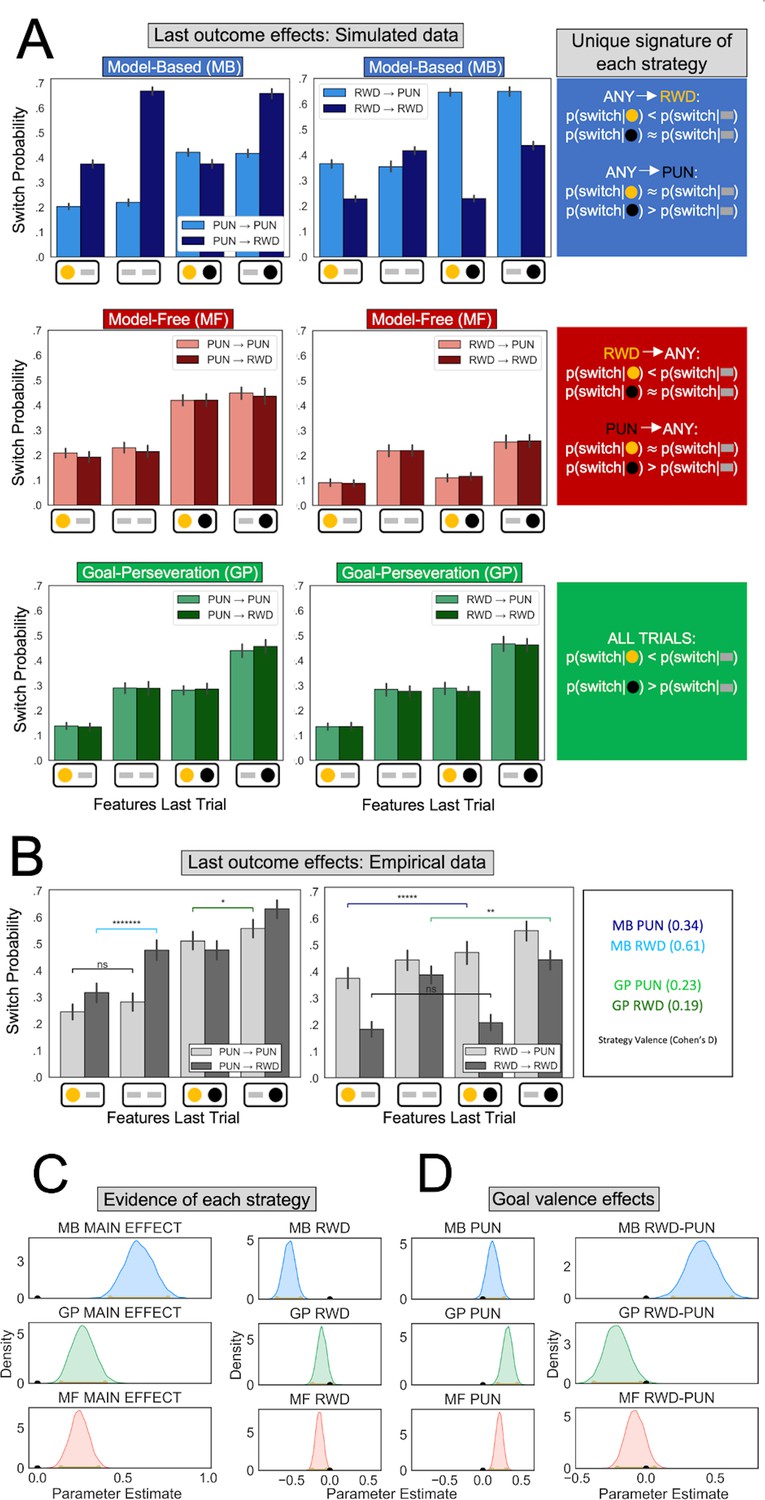
Behavioral signatures of computational strategies in simulated and real data.
(A) Last outcome effects in simulated data. Each row comprises data generated by simulating one of the candidate computational strategies used to enact decisions in the present task (see Methods for parameters used). Each plot depicts the proportion of times the simulated agent takes a different action than that taken on the last trial (‘switch probability’), as a function of features experienced on the last trial for the chosen action (gold/black circles; a gray bar indicates the feature was absent), the previous goal (left vs. right plots), and the current goal (light vs. dark bars). (B) Last outcome effects in empirical data. Real participants’ switch probabilities as a function of last trial’s feature outcomes, and current and previous goals. For illustration, we overlay repeated measures t-tests of specific MB (difference between blue and black bars) and GP (green bars) predictions, broken down by goal valence. A more thorough analysis of strategies used by participants is shown in panel C. *p < 0.05, **p < 0.01, *****p < 10−5, *******p < 10−7 . (C) Empirical evidence for each strategy. Posterior distributions derived from fitting a Bayesian linear mixed-effects logistic regression evince main effects for MB (blue), GP (green), and MF (red) strategies. Evidence reflects MB and MF were leveraged for punishment avoidance and reward seeking goals whereas GP was leveraged for punishment avoidance goals, with only trending evidence it was used for reward seeking. (D) Effect of goal valence on strategy utilization. We estimated goal valence effects by examining the posterior distribution of differences between the parameters in panel C and found evidence indicating model-based utilization was greater for reward seeking, whereas goal-perseveration utilization was greater for punishment avoidance.
Figure 2—figure supplement 1
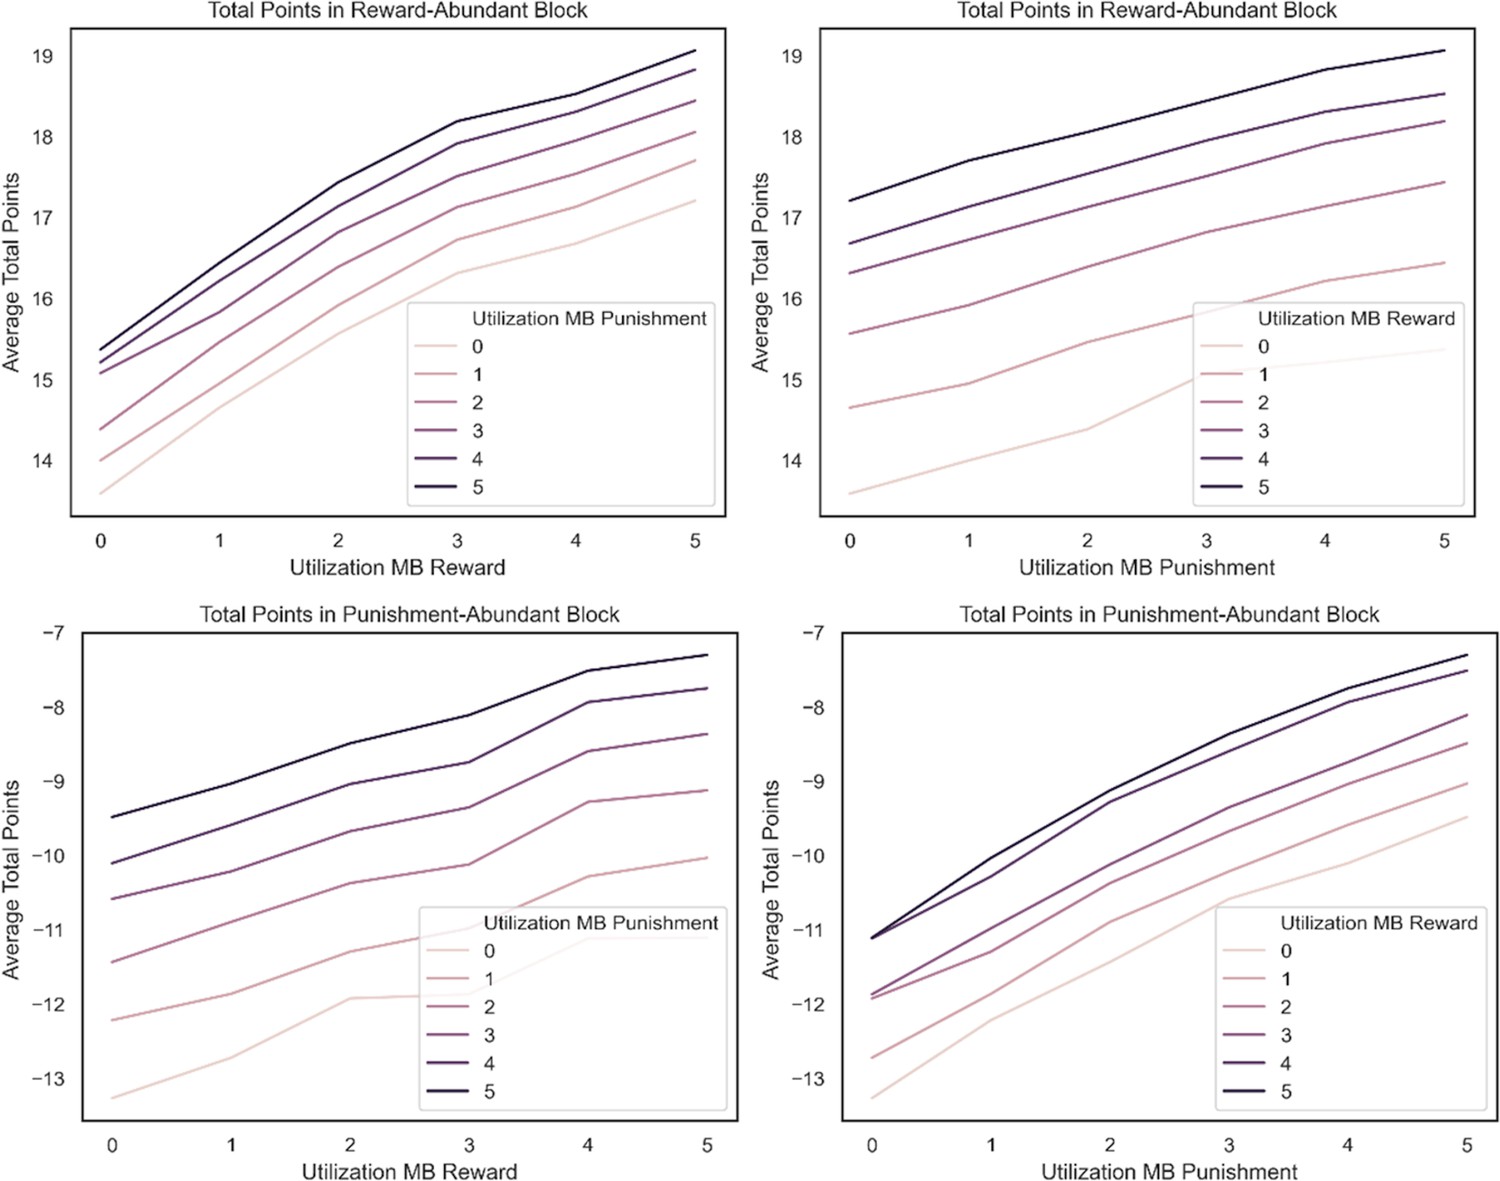
Resource rational simulations.
We simulated the average increase in total points per unit increase in utilizing a model-based strategy for reward pursuit and punishment avoidance in either of the two task blocks. In the top row, we compare this unit increase in total points in the reward-rich task block and show that the slope (average total points per unit increase in utilization) is greater for reward (left) than for punishment (right). The opposite is true in the punishment-rich task block (bottom row). There, the slope is greater for punishment (right) than for reward (left). Note, in each subplot, the color of the line denotes the utilization strength for the goal not plotted on the x-axis. Each of these lines was generated by averaging over total points won over 2000 plays of the task for agents with a learning rate of 0.2 for chosen and unchosen actions that are purely model based.
Figure 2—figure supplement 2
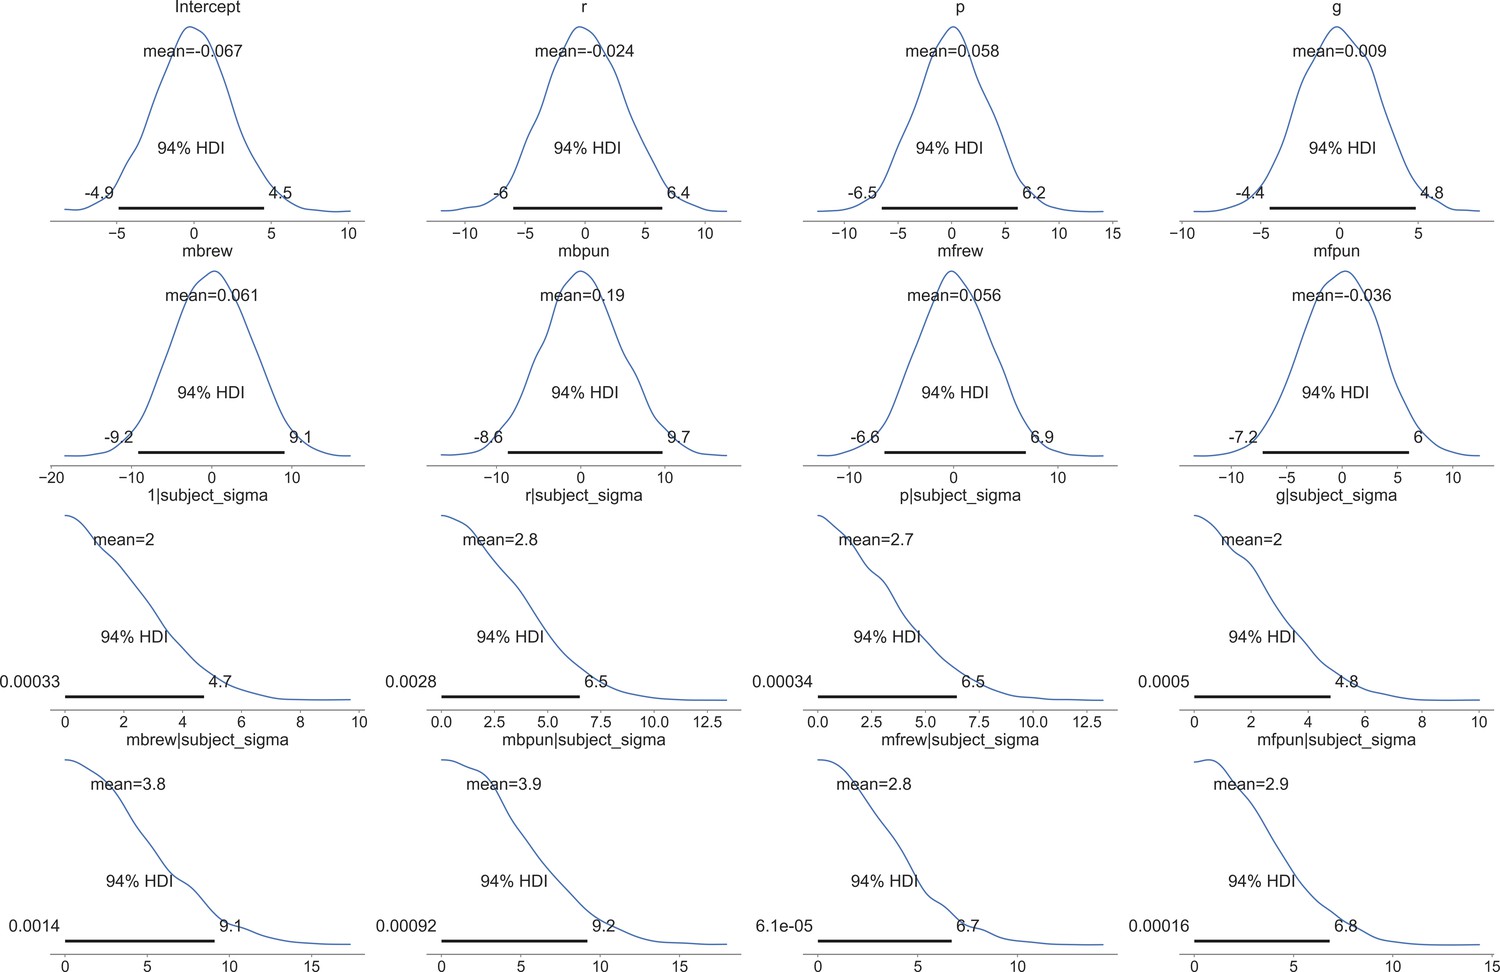
Priors for group-level means and variances in our mixed-effects modeling for empirical data.
For each group-level effect, a wide prior for both the mean (top two rows) and variance (bottom two rows) hyperparameters were derived automatically as a function of partial correlations between each independent and dependent variable.
Figure 2—figure supplement 3
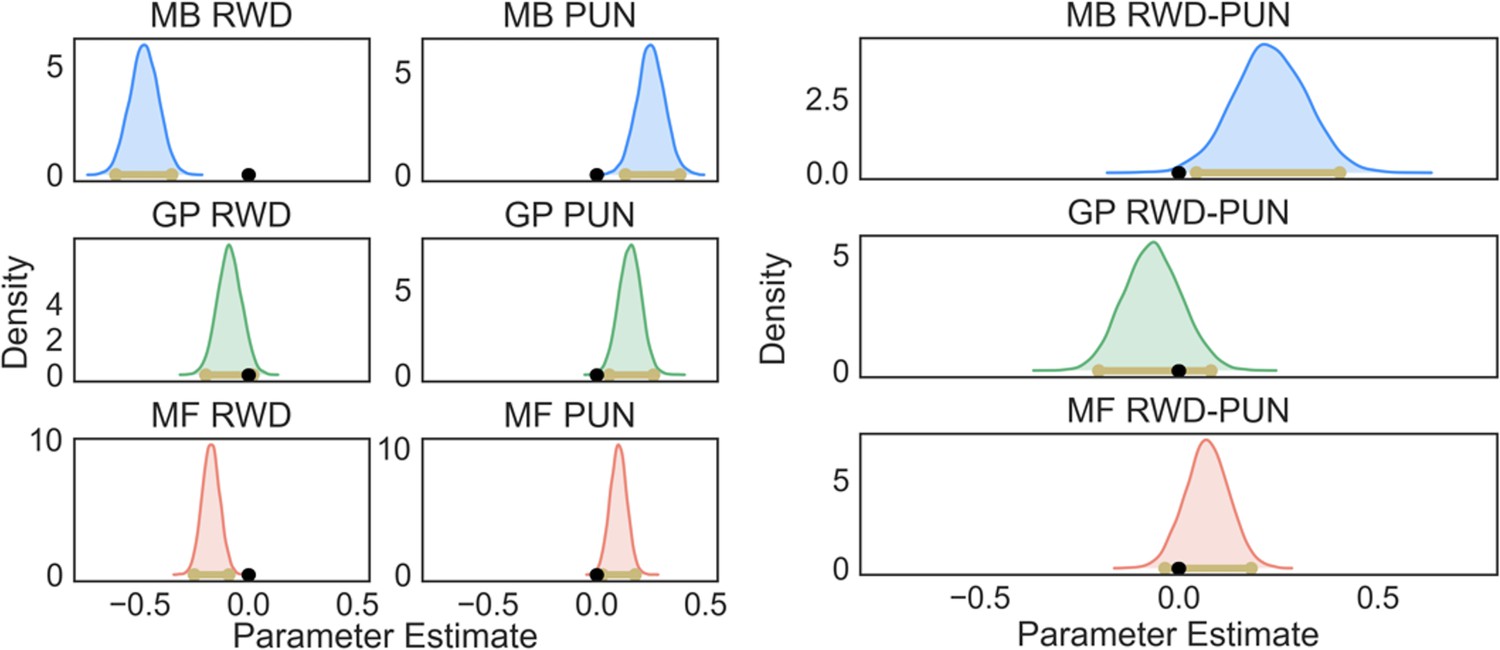
Postpredictive check.
We conducted a postpredictive check by creating synthetic data from the best-fitting parameters in our winning model (using medians for skewed distributions and means for nonskewed distributions). We then fit the same Bayesian mixed-effects logistic regression we report in the main text to these synthetic data. Doing so resulted in all but one of the effects we found in the empirical being recapitulated in the synthetic data. As was true in the empirical data, MB RWD (mode = −0.48, confidence interval [CI] = [−0.61,−0.35]), MB PUN (mode = 0.25, CI = [0.13,0.38]), GP PUN (mode = 0.16, CI = [0.06,0.26]), MF RWD (mode = −0.17, CI = [−0.25,−0.09]), and MF PUN (mode = 0.10, CI = [0.02,0.18]) effects were detected, whereas GP RWD (mode = −0.09, CI = [−0.20,0.02, pd = 0.94]) was not. Moreover, as was true in the empirical data, MB RWD was greater than MB PUN (mode = 0.21, CI = [0.04,0.40]) and MF RWD and PUN were not significantly different from each other (mode = 0.07, CI = [−0.03,0.18]). Unlike the empirical data, GP PUN only trended in the direction of being greater than GP RWD (mode = −0.06, CI = [−0.20,0.08], pd = 0.81).
Figure 3
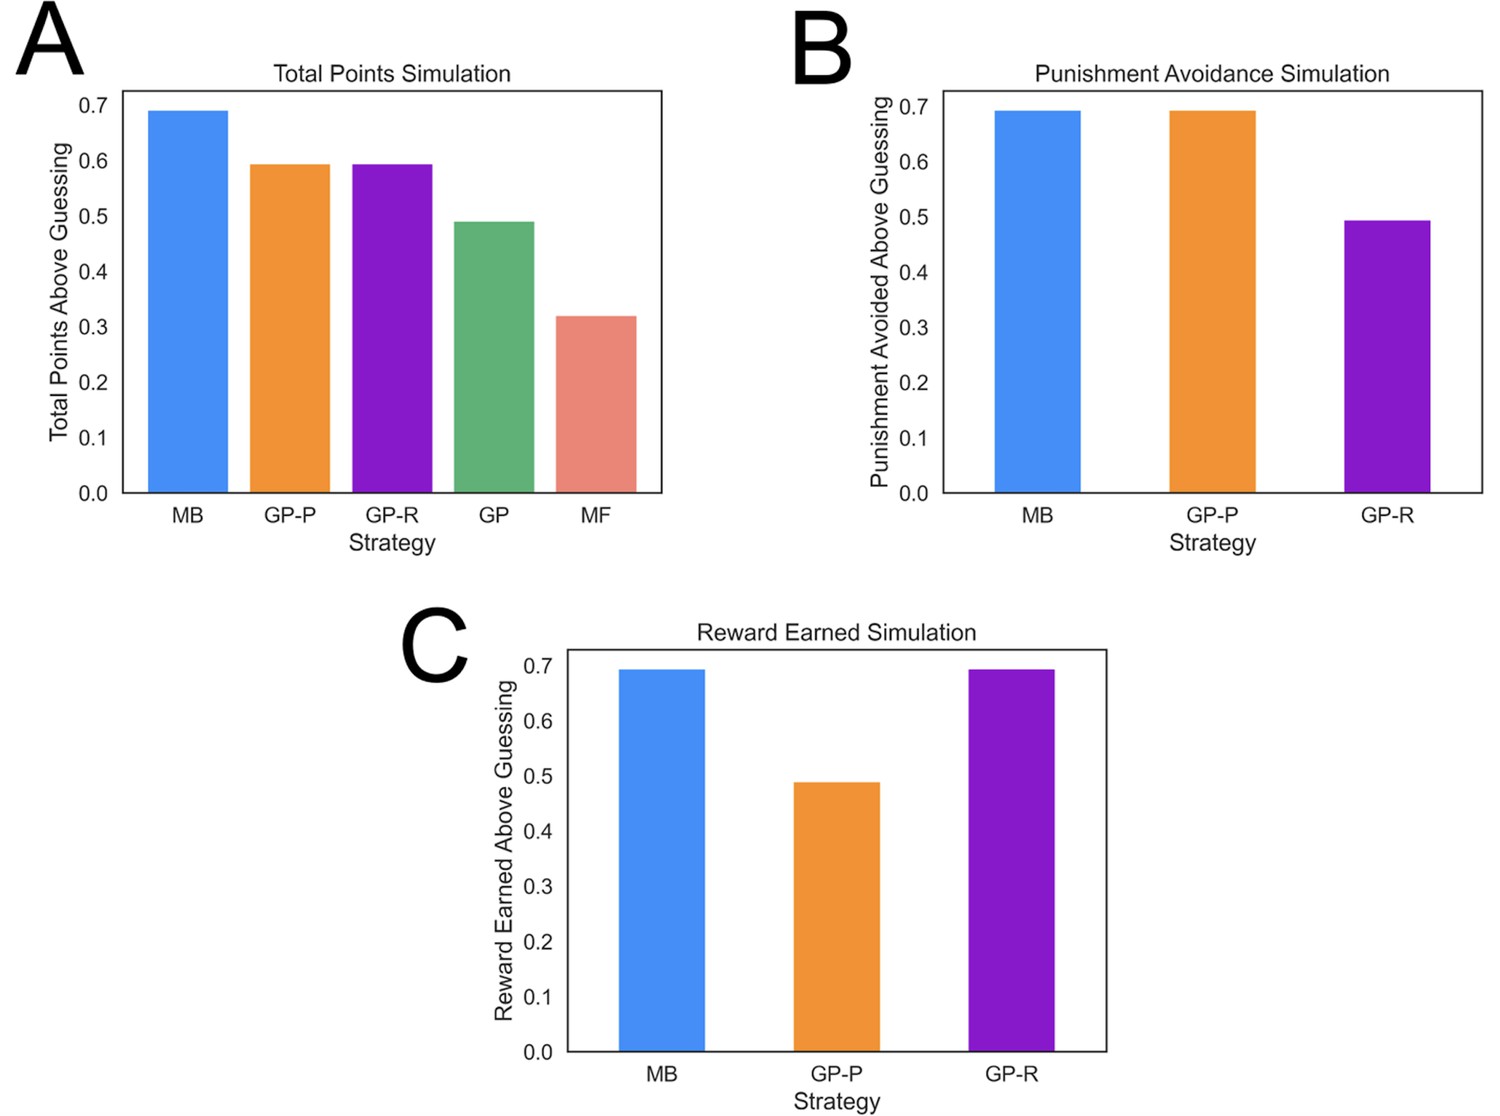
Task performance of distinct strategies.
(A) Average total points gained by computational strategies. Punishment, reward, and total points (i.e., reward minus punishment) were averaged over 2000 simulations for each strategy. Strategies included model based (MB), model free (MF), and three versions of a goal perseveration (GP reward seeking with MB punishment avoidance [GP-R], GP punishment avoidance with MB reward seeking [GP-P], and GP for both reward and punishment goals [GP]). Details of parameters and models for each agent simulated are detailed in Methods. Each agent played the task 2000 times. Measures are range normalized such that 0 corresponds to performance of an agent that purely guesses and one corresponds to performance of the best-performing agent. (B) Punishment avoided by computational strategies. Here, the plot tallies successful attempts by agents to avoid punishment. The results illustrate that a hybrid agent that employs the goal-perseveration punishment avoidance strategy, and utilizes model-based control for reward seeking, avoids punishment as successfully as a fully model-based agent. (C) Reward earned by computational strategies. Here, the plot tallies successful attempts by agents to seek reward. This highlights that a hybrid agent that employs the goal-perseveration punishment avoidance strategy gains less reward than a model-based agent.
Figure 4 with 4 supplements
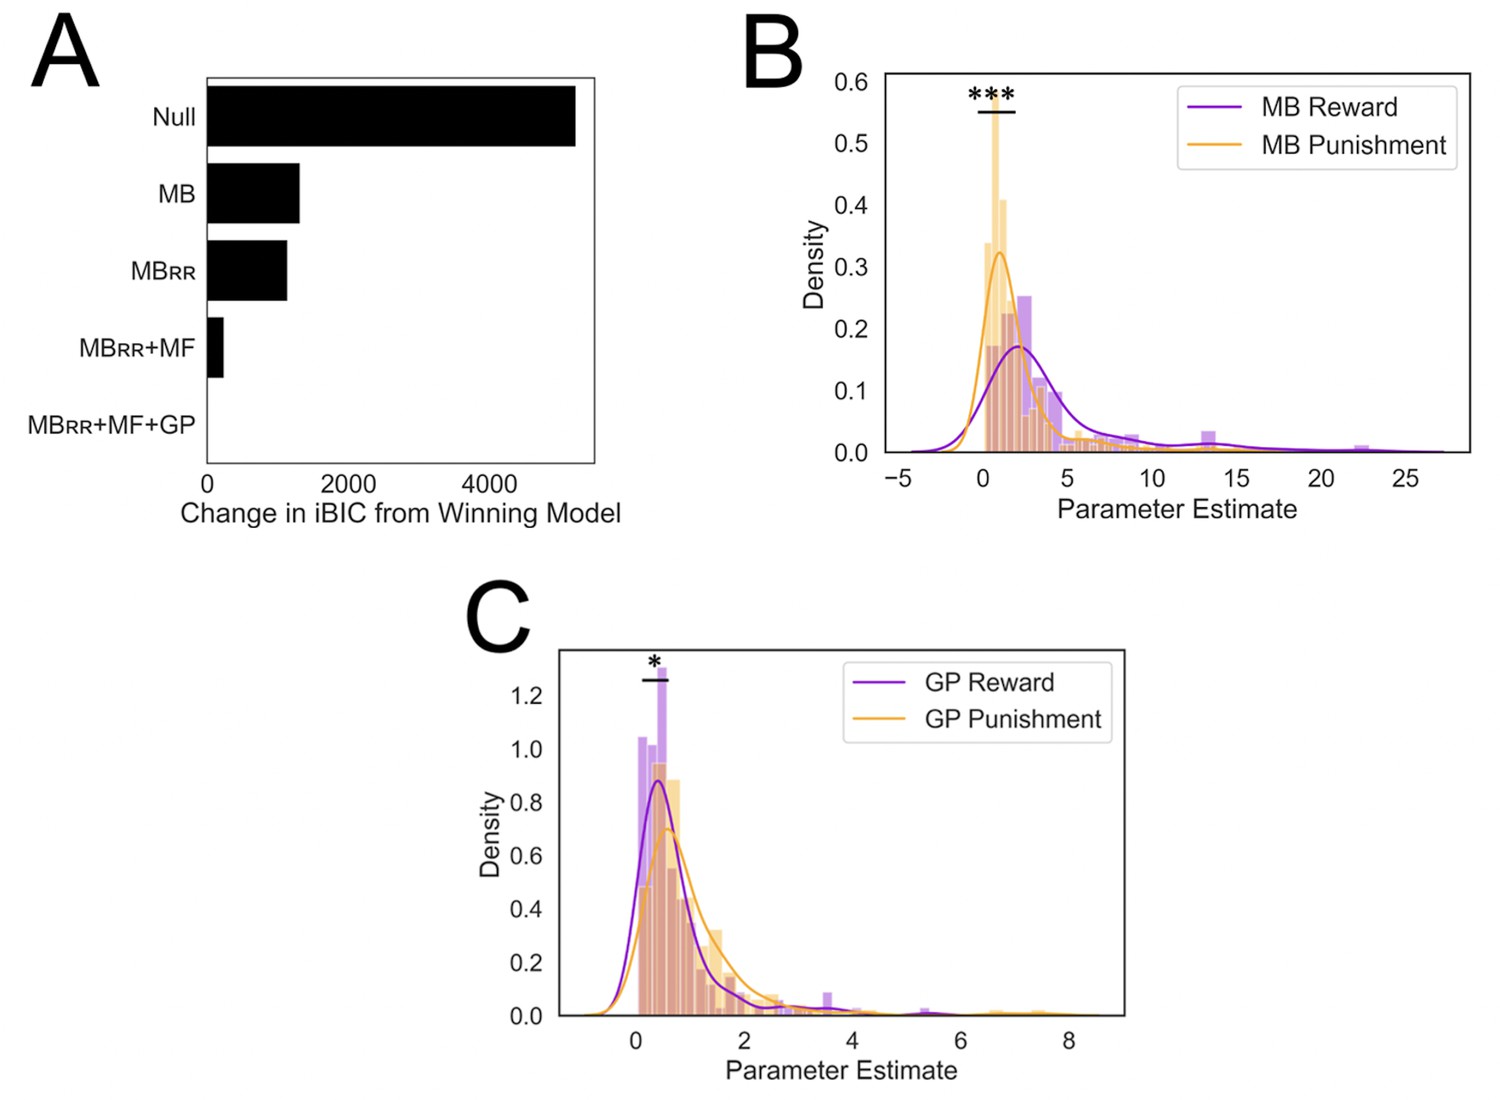
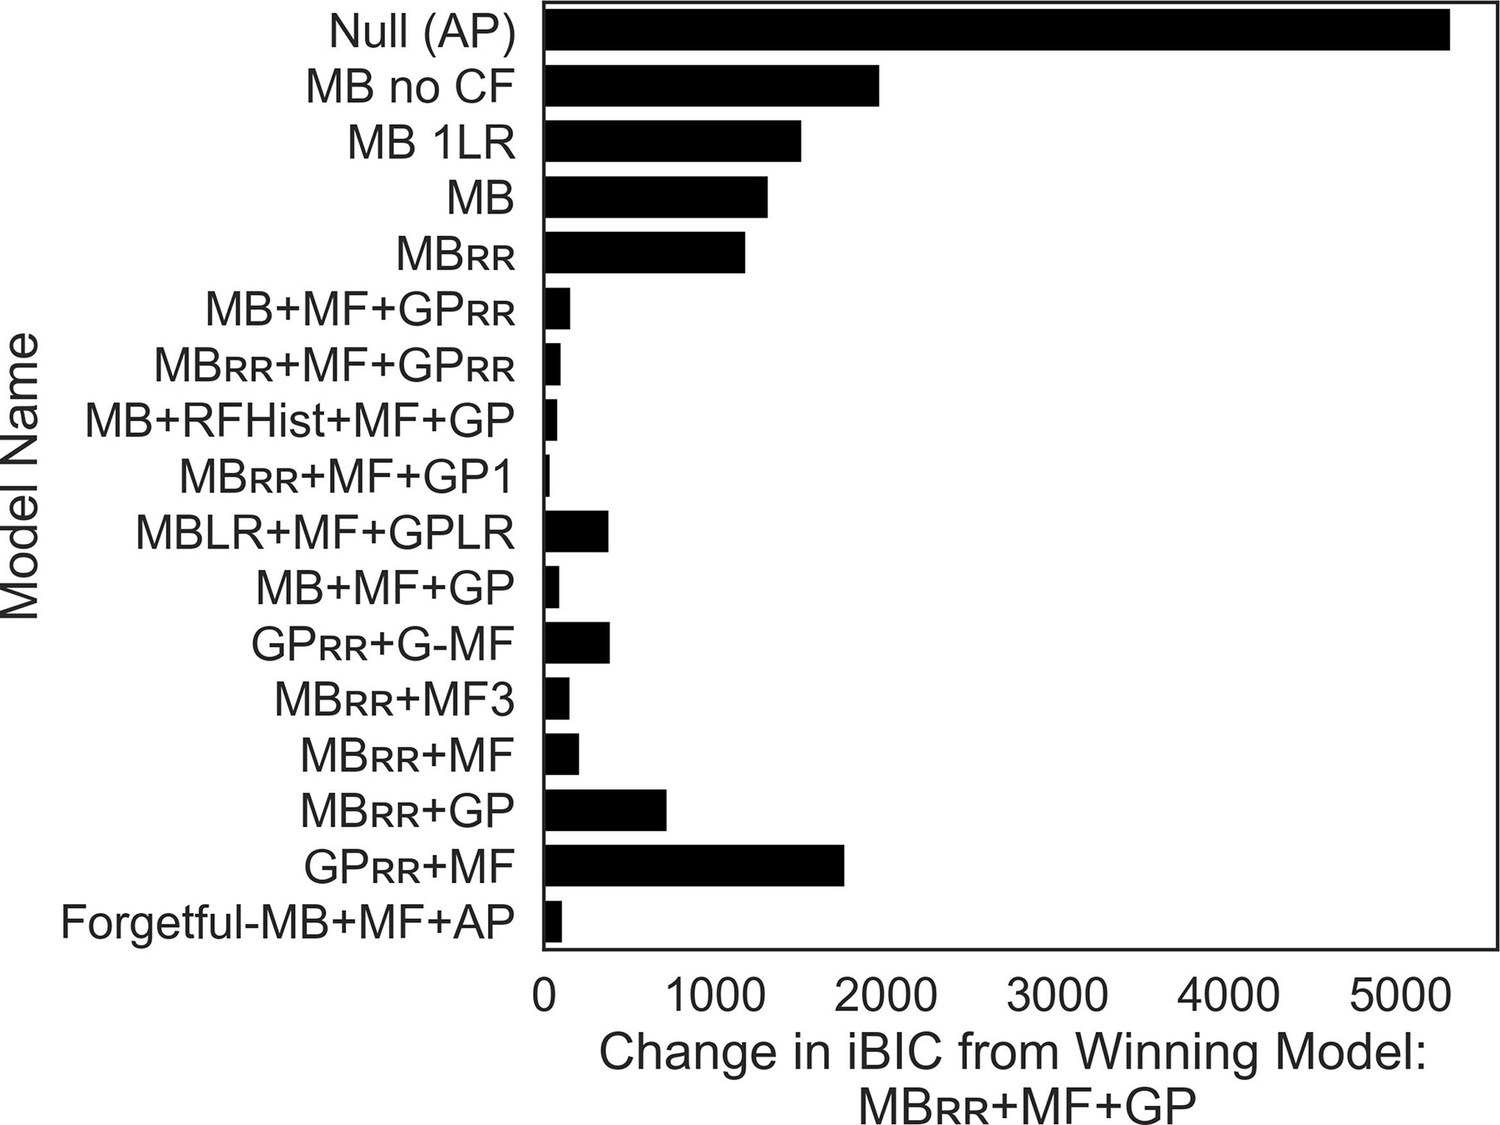
Results from computational modeling.
*p < 0.05, ***p < 0.001. (A) Stepwise model comparison. The plot compares all models to the winning model ‘MBRR+ GP + MF’. (B) Model-based utilization is greater for reward seeking than for punishment avoidance. Here and in panel C, distributions are compared in terms of their medians due to a heavy positive skew. (C) Goal-perseveration utilization is greater for punishment avoidance than for reward seeking. Panels B and C show the distributions of utilization weights that best fitted each individual participant’s choices.
Figure 4—figure supplement 1
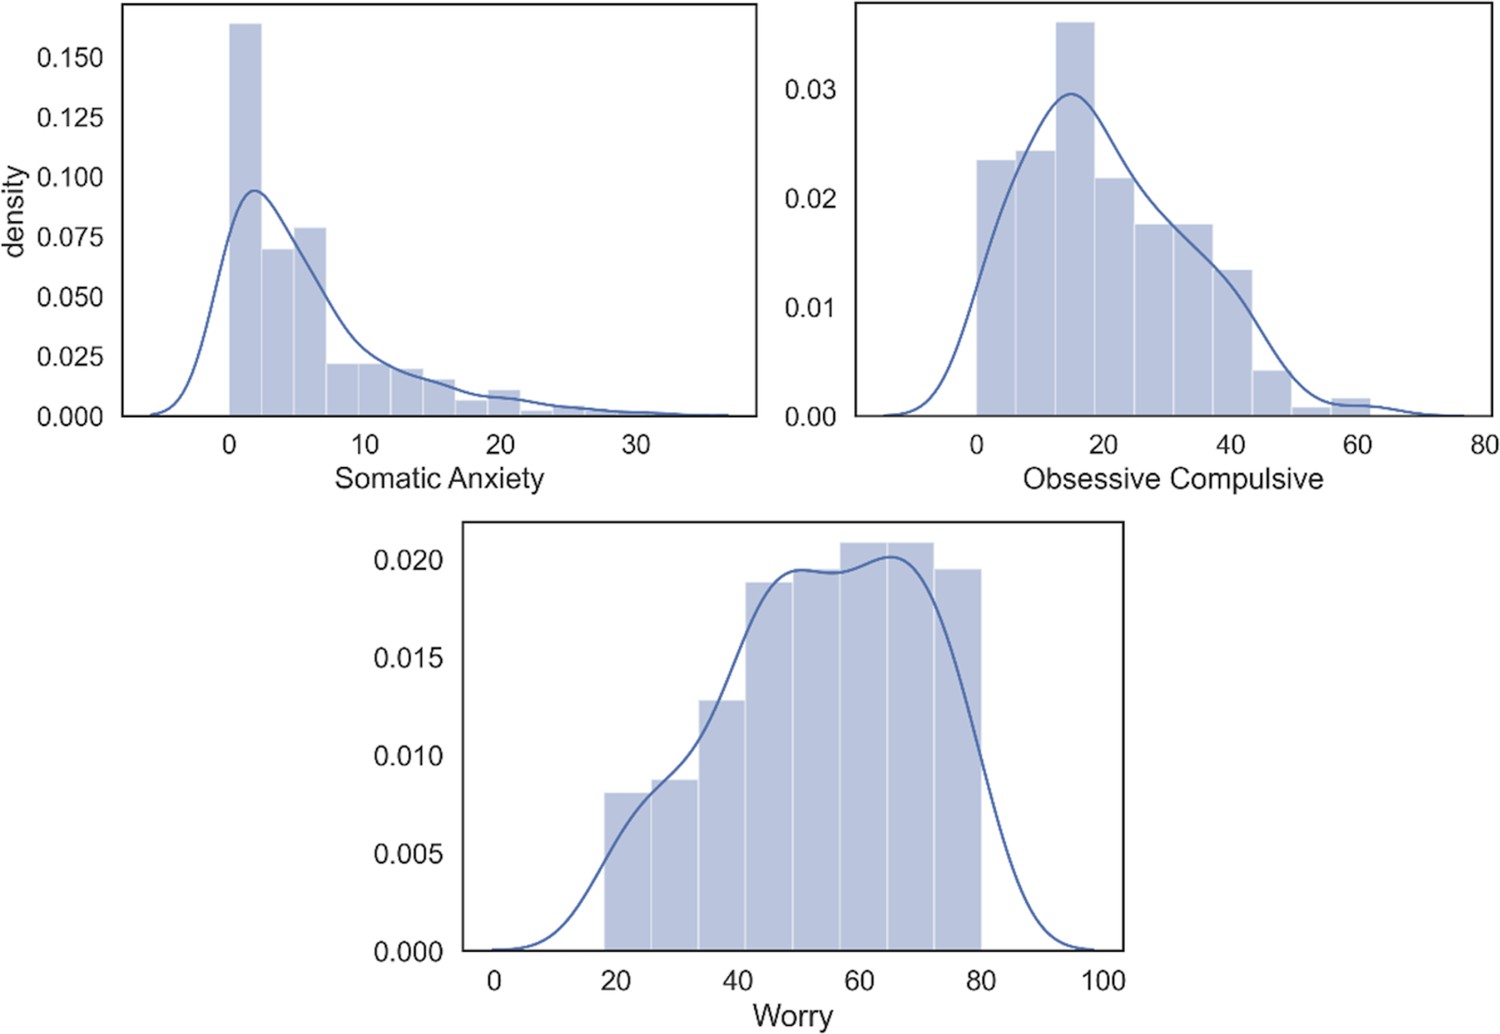
Plots of symptom distributions and noting cutoff for clinical symptoms and percent of clinical symptoms.
Worry and Obsessive Compulsive (OC) measures comprised 36% and 41.2% of respondents endorsing symptoms that are great enough to be considered mild presentations these forms of psychopathology. By contrast, somatic anxiety only comprised 4.7% of respondents endorsing clinically relevant symptoms. Note, we conducted tests to see whether subjects removed from the study due to not misunderstanding the task were significantly different in terms of these measures of psychopathology and none approached significance (lowest p value = 0.33).
Figure 4—figure supplement 2
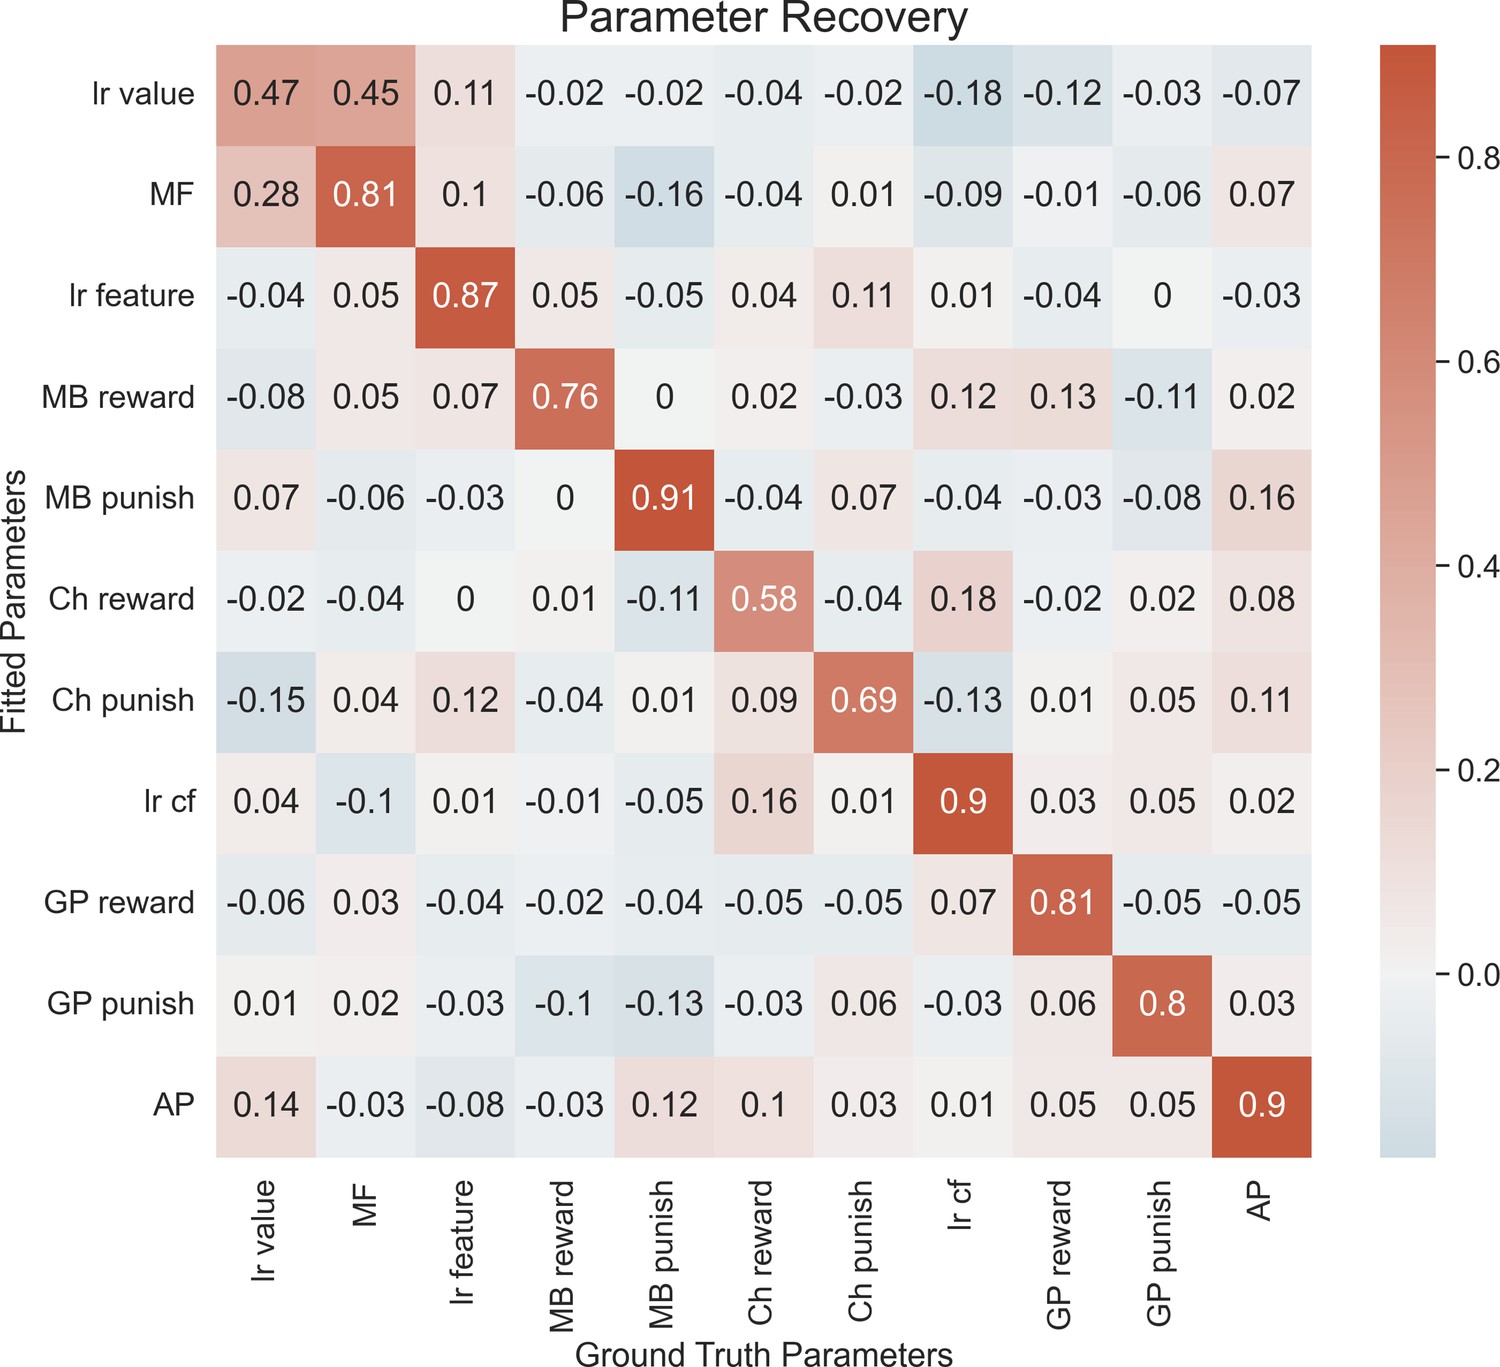
Parameter recovery.
Each entry in the correlation matrix represents the Pearson correlation between the ground-truth parameter values (sampled from the group-level distributions that were fitted to our empirical data) used to simulate 192 synthetic agents and the parameter values fitted to the synthetic data using our hierarchical model-fitting procedure. On-diagonal entries denote parameter recovery estimates, and off-diagonal entries quantify undesirable tradeoff between model parameters. The following are the group priors we generated the data comprising the best-fit group hyperparameters: MF ~ gamma(1.11, 0.55), LR value ~ beta(0.82, 0.50), MB Reward ~ gamma(0.60, 6.73), MB Punish ~ gamma(0.45, 4.23), LR features ~ beta(0.32, 1.33), Ch Punish ~ normal(−0.15, 1.02), Ch Reward ~ normal(0.50, 1.11), LR cf ~ beta(0.19, 1.24), GP Reward ~ gamma(0.43, 1.69), GP Punish ~ gamma(0.60, 1.43), AP ~ normal(0.11, 0.54). MF = model-free system, MB = model-based system, GP = goal-perseveration system, Ch = change in utilization as a function of task block, LR = learning rate, CF = counterfactual, AP = action perseveration. Model recoverability. We generated synthetic data using the priors posted below for 192 subjects using either the winning model or the second-best model (‘MBRR+ MF + GP1’). We then fit these data using the model-fitting procedure described in the main text. The model that generated the data was recovered 10/10 times. For second-best model, all priors were the same except that a single GP utilization weight was used with the following prior: GP Reward ~ gamma(0.53, 1.55).
Figure 4—figure supplement 3
Alternative model descriptions and full model comparison.
As explained in text, our null model started with just action perseveration (AP; tendency to stay with last action taken), which was included as a process in all subsequent models. Next, we established key components of the model-based (MB) system that were not explained in the main text. First, we found an MB system that only learns from chosen feedback, and disregards counterfactual feedback (‘MB no CF’) fit the data far worse than a model including counterfactual feedback (‘MB 1 LR’). Subsequently, we showed that an MB agent that learns from counterfactual feedback at a different learning rate (‘MB’) outperforms an agent that enforces the learning rate be equal across factual and counterfactual feedback (‘MB 1 LR’).After arriving at the winning model in the stepwise fashion described in Results in the main text, we tested a variet of other models by remodeling certain processes within each system. We first instantiated the resource-rational learning as described in the main text either just within the the goal-perseveration system (‘MB + MF + GPRR ’) or in both the GP and MB systems (‘MBRR + MF + GPRR). We then sought to determine if the resource rational shift in MB resources was a function of the most recently experienced goals (which could vary within task block; ‘MB + RFHist + MF + GP’). To do so, the agent computed a running prediction of the upcoming goal, which was updated by a goal prediction error, defined by the disparity between the goal outcome (1 if reward pursuit, −1 if punishment avoidance) and the predicted goal quantity ( ), and a goal learning rate, δ:
This goal prediction was then used to modulate model-based utilization weights on a trial-by-trial basis. Unique reward pursuit and punishment avoidance weights defined the direction and magnitude that the goal prediction quantity modulated model-based utilization weights:
If goals were modulated according to goal abundance (as predicted), should take on a negative value, as this would result in the model-based utilization weight decreasing for reward pursuit and increasing for punishment avoidance when an agent’s recent goal history involves more punishment avoidance trials. By the same logic, was predicted to take on a positive value. Next, we sought to determine if differences in goal valence were better explained by differences in learning (via two separate learning rates) relative to our original implementation where goal valence differences were encoded in utilization weights ( and ). Doing so, we had to exclude the resource rational component because the fitted learning rates greatly exceeded 1 and extended far into the negative range (i.e., <0), which rendered the parameter uninterpretable. As such we compared two models: (1) in which there were separate learning rates for reward and punishment features, a single utilization weight for MB and a single utilization weight for the GP (‘MBLR + MF + GPLR’; Bayesian information criterion [BIC] = 33,098.176) versus (2) a single learning rate for reward and punishment features and, and separate utilization weights for reward pursuit and punishment avoidance in both the MB and GP systems, as was true of the winning model (‘MB + MF + GP’; BIC = 32,810.86). This system also included action perseveration and model-free control in line with the winning model. Doing so demonstrated that, as was true in the winning model, goal pursuit differences encoded in utilization weights as opposed to learning rates explained the data better. Note, it was not possible to fit separate learning rates and utilization weights across each goal within the MB and GP systems as they would be unrecoverable due to trading off. Subsequently, we tested a model in which action values for each goal were learned in a model-free way. That is, instead of two action values in the original model-free system, there were four action values, two for each goal (‘GPRR + G-MF’). Updates to action values for a given goal occurred only when that goal was instructed on the current trial. Similarly, decision-making was only influenced by the two action values relevant to the instructed goal. Like the winning model, action values for each goal had their own utilization weights ( and ) that shifted across task block in the same way as the winning model with change parameters. The model additionally encoded action perseveration.We next sought to model the MF system in such a way that encoded a GP-like signature; namely, that the experience of punishment features always was a punishment (−1 points), and the experience of a reward feature was always rewarding (+1 points), irrespective of the instructed goal (‘MBRR + MF3’). Thus, each trial, there were three action values in the MF system: (1) as originally implemented, (2) as predicting whether one’s action leads to reward features, and (3) whether one’s action leads to punishing features. These three action values were intergrade with action values from the MB system and AP to determine choices. Next, we sought to verify that the order in which we included controllers did not affect modeling results. To do so, we excluded from the winning model just the MF system (‘MBRR + GP’), just the GP system (‘MBRR + MF’), and just the MB system (‘GPRR + MF). All were inferior to the winning model. Finally, we tested an alternative model where GP behavior may derive from an MB strategy that occasionally forgets the reward function (Forgetful-MB + MthF + AP), allowing this forgetting to occur at different rates during reward and punishment goals. This model-based agent includes two additional parameters, fR and fp, which govern the probability of forgetting the presented reward function on reward pursuit trials and punishment avoidance trials, respectively. Thus, on each trial, the model replaces the instructed goal with the opposite goal (e.g., if the actual goal was [−1, 0], the participant used [0,1]) with some fixed probability (either fR or fp, depending on the trial type). We again found that this model fit worse than the winning model, confirming that a model where the model-based controller forgets the current reward with different rates on reward and punishment trials does not account for our results supporting GP as well.
Figure 4—figure supplement 4
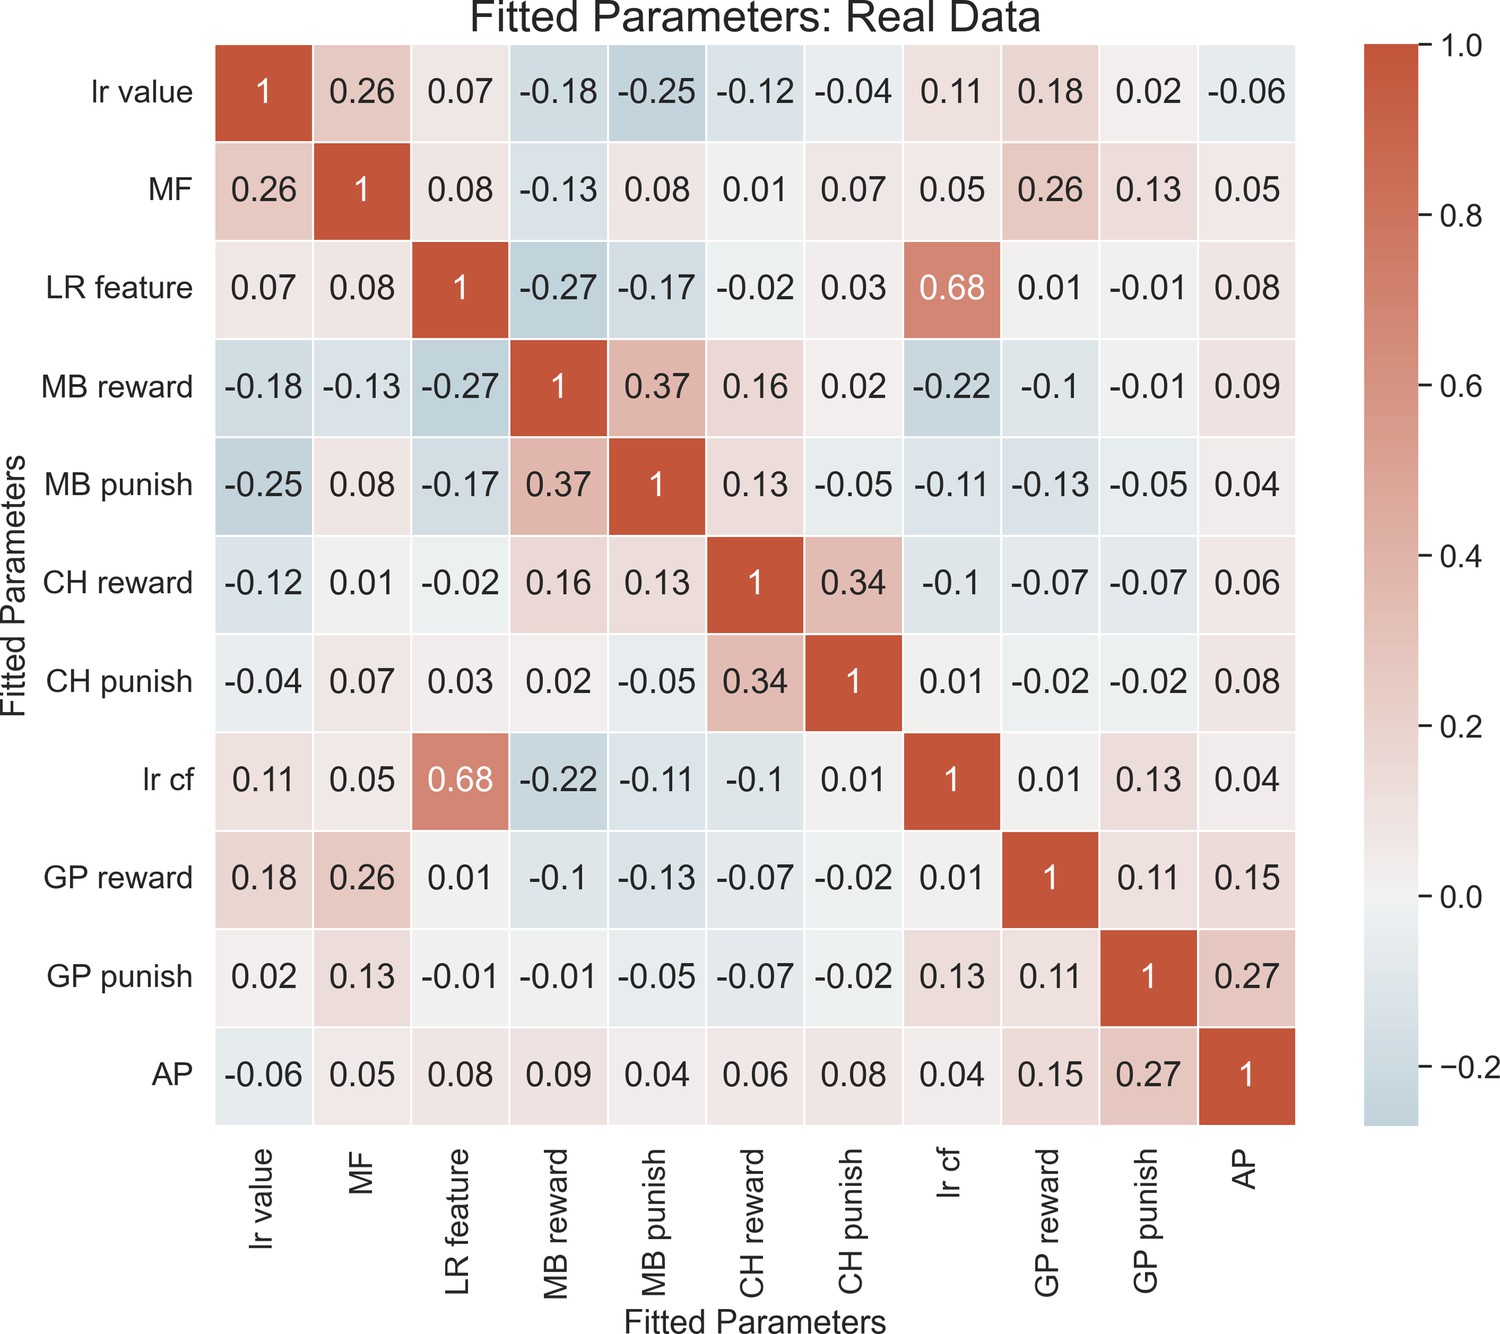
Correlations between fitted parameters.
Figure 5

Exploratory relationships between threat-related psychopathology and goal-directed control for punishment avoidance.
Each row reflects a different regression model, where the score for each psychopathology measure in the left column is the dependent variable, and inverse temperature parameters reflecting model-based (‘MB Punish’) and goal-perseveration (‘GP Punish’) punishment avoidance are the regressors. Each effect is presented in the following format: β (standard error), p value. (A) Bivariate relationships without control covariates. (B) Regression coefficients when controlling for co-occurring levels of psychopathology as well as for general valence-independent levels of utilization of MB (inverse temperature and learning rate) and non-MB (AP, MF, and GP inverse temperatures) strategies. In all tables, p values are uncorrected for multiple comparisons.
Figure 6
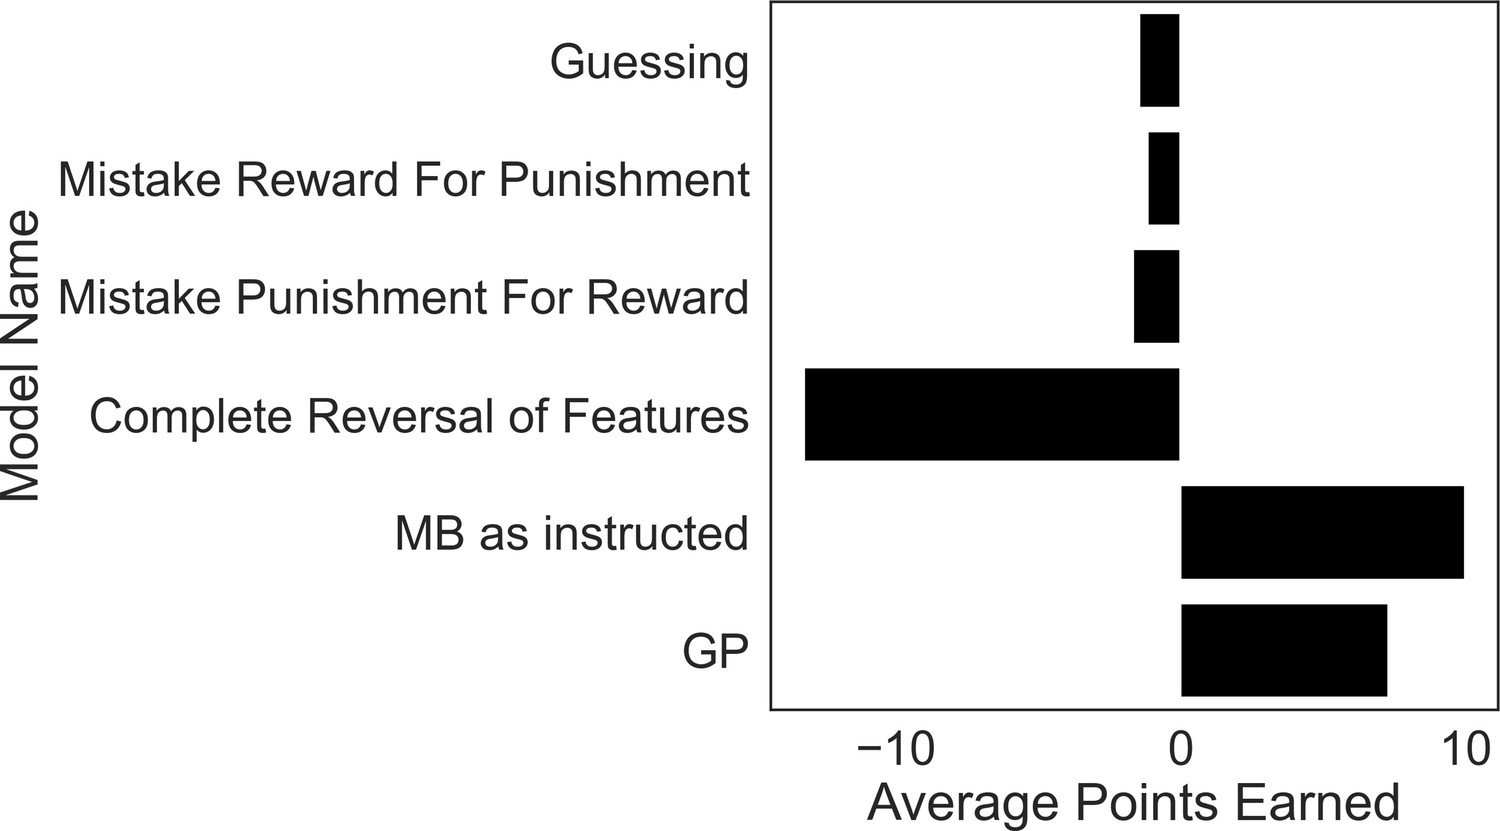
Excluded participants’ strategies perform similar to or worse than purely guessing.
To motivate our exclusion criteria, we simulated task performance by agents that falsify these criteria and calculated their average winnings over 5000 simulations each. The guessing agent chooses according to a coin flip. The models instantiating strategies used by excluded subjects comprise those that treat reward features as punishment features (‘Mistake Reward for Punishment’), treat punishment features as if they were reward features (‘Mistake Punishment for Reward’) or incorrectly reverse the treatment of feature types (‘Complete Reversal of Features’). Each model performed as poorly, or significantly worse, than a model that purely guesses, demonstrating a fundamental failure in these strategies for the present task. By contrast, a GP-only agent (‘GP’) that ignores goal-switching instructions does significantly better than a guessing model, and only a little worse than a pure model-based agent (‘MB as instructed’).
Author response image 1

A comparison of GP-MB correlations for empirical data (left) and for data simulated using forgetful-MB agents (right).
Author response image 2
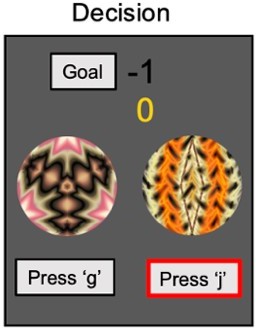
A depiction of what participants saw on the screen for the entire decision period in our multigoal reinforcement learning task.
Author response image 3
Random walks from task version 1.
Here, the reward feature took a more volatile walk, whereas the punishment feature had greater irreducible uncertainty. In task version 2 (given to the other half of participants) the feature:random walk mapping was flipped.
Additional files
-
Supplementary file 1
Results of fitting two separate hierarchical Bayesian logistic regression models to empirical data from each version of the task.
- https://cdn.elifesciences.org/articles/74402/elife-74402-supp1-v3.docx
-
Transparent reporting form
- https://cdn.elifesciences.org/articles/74402/elife-74402-transrepform1-v3.docx
Download links
A two-part list of links to download the article, or parts of the article, in various formats.
Downloads (link to download the article as PDF)
Open citations (links to open the citations from this article in various online reference manager services)
Cite this article (links to download the citations from this article in formats compatible with various reference manager tools)
Humans perseverate on punishment avoidance goals in multigoal reinforcement learning
eLife 11:e74402.
https://doi.org/10.7554/eLife.74402


