Distinct dendritic Ca2+ spike forms produce opposing input-output transformations in rat CA3 pyramidal cells
- Laboratory of Neuronal Signaling, Institute of Experimental Medicine, Hungary
- János Szentágothai School of Neurosciences, Semmelweis University, Hungary
Figures
Figure 1 with 1 supplement
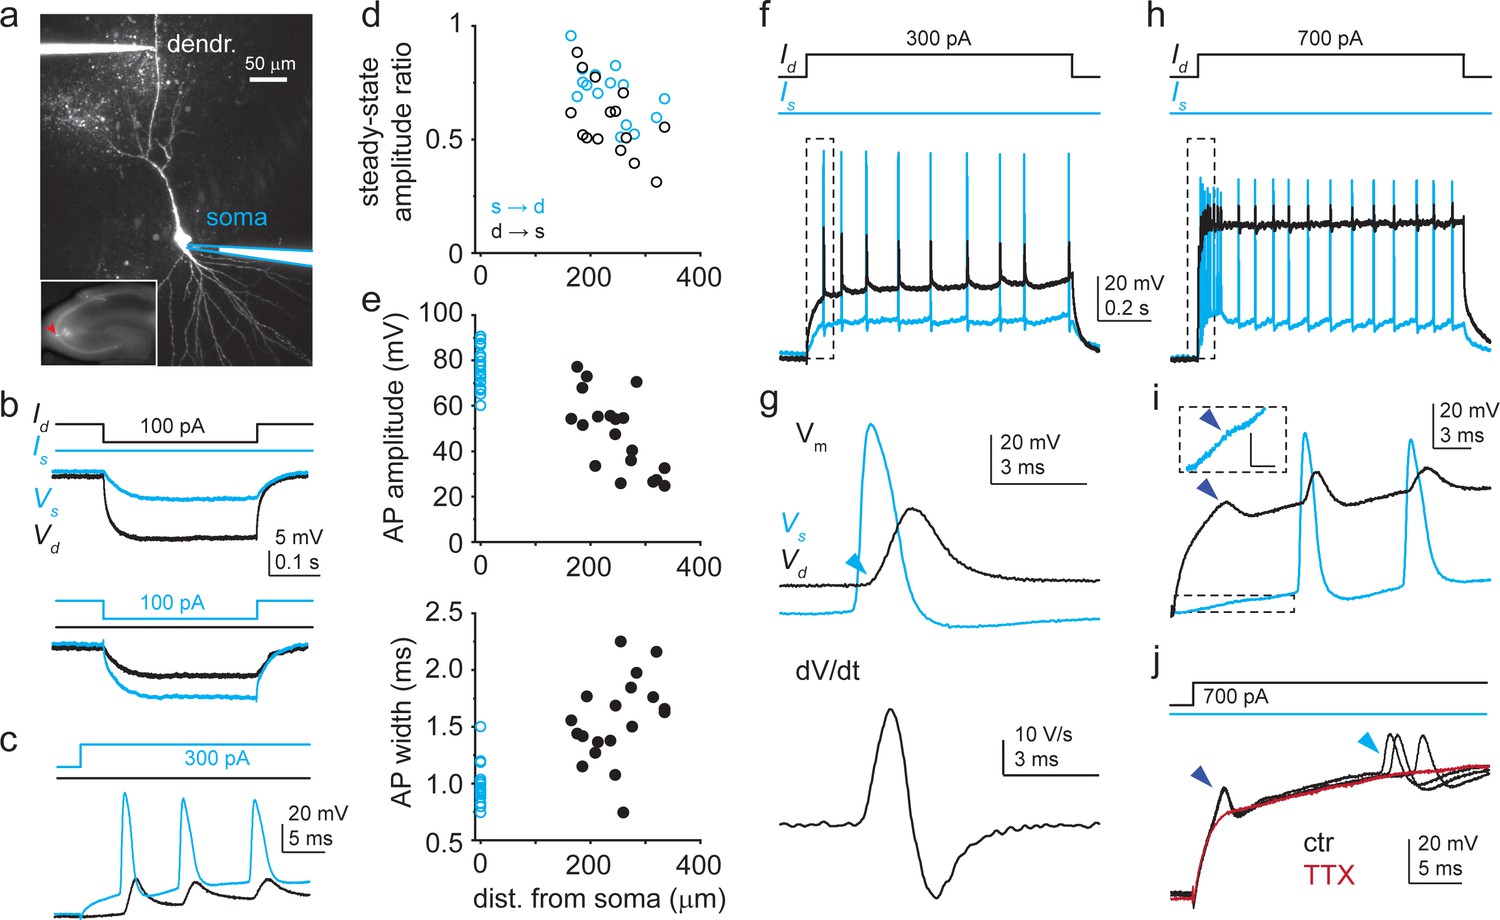
Dendritic Na+ spikes in dual recordings of soma and dendrite of CA3 pyramidal cells (CA3PCs).
(a) Two-photon (2P) collapsed z-stack image of a dually recorded CA3PC (dendritic pipette distance: 255 μm). Somatic pipette outlined in blue. Inset: soma (red arrowhead) located in CA3. (b) Somatic (blue) and dendritic (black) voltage responses (Vs and Vd) to negative step Iinj into the dendrite (top) and the soma (bottom). Iinj protocols shown on the top. (c) Positive Iinj at the soma evokes action potentials (APs) (blue) that backpropagate to the dendrite (black). (d) Voltage transfer between soma and dendrite (n = 15 experiments). (e) Dendritic distance dependence of amplitude and width at half amplitude of the first backpropagating action potential (bAP) evoked by somatic Iinj (n = 19 experiments). (f) Voltage responses at the dendrite (black) and at the soma (blue) to a 1-s-long 300 pA dendritic Iinj in the cell shown in (a). (g) First regenerative event in (f) (box) is a bAP. Top: voltage; bottom: corresponding dendritic dV/dt. Note the sudden start of the bAP (‘kink,’ indicated by light blue arrowhead). (h) Dendritic and somatic voltage responses to 1-s-long 700 pA dendritic Iinj in the cell shown in (a). (i) Initial part of the voltage response in (h) (box) enlarged. A short-latency regenerative dendritic event (dark blue arrowhead) precedes bAPs. Attenuated somatic response is shown enlarged in a dashed box. Scale bar in box: 5 mV, 3 ms. Similar events were observed in three other CA3PCs. (j) Short-latency dendritic spikes and APs (black traces; three repetitions) are eliminated by 1 μM TTX (dark red).
-
Figure 1—source data 1
Dendritic Na+ spikes in dual recordings of soma and dendrite of CA3 pyramidal cells (CA3PCs).
- https://cdn.elifesciences.org/articles/74493/elife-74493-fig1-data1-v1.xlsx
Figure 1—figure supplement 1
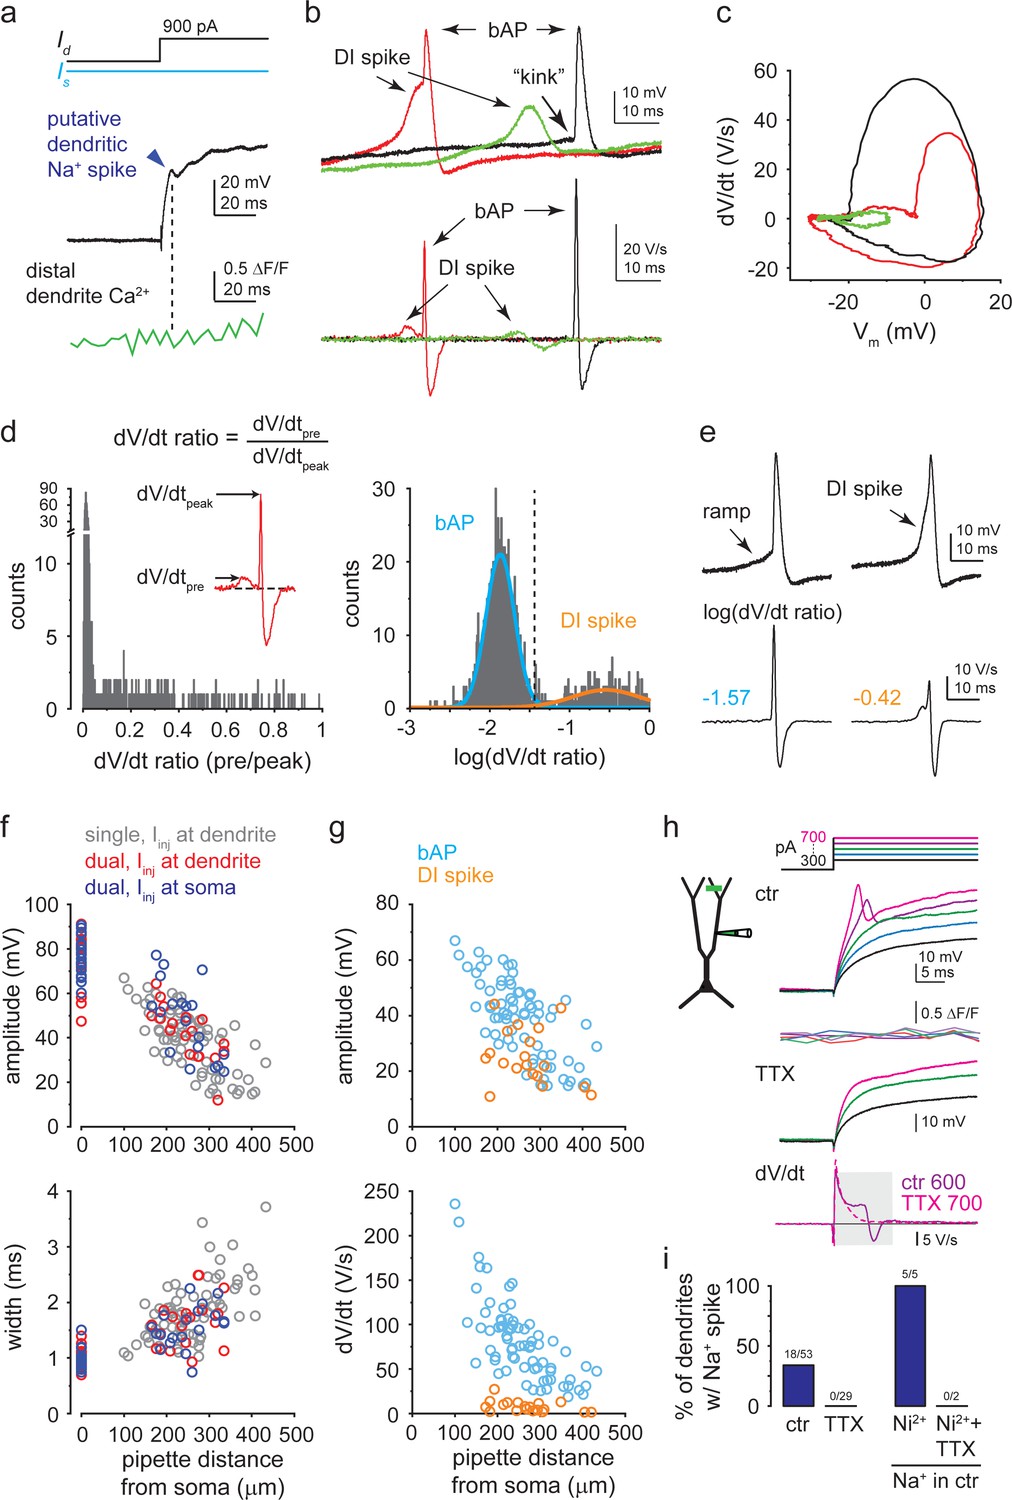
Characteristics of different regenerative dendritic events.
(a) Representative trace from a dual recording, showing the lack of distal dendritic Ca2+ signal associated with a putative dendritic Na+ spike (dark blue arrow). (b) Voltage and corresponding dV/dt traces (all recorded from the same CA3PC dendrite), showing a simple backpropagating action potential (bAP) (black trace), an isolated dendritically initiated (DI) Ca2+ spike (green trace), and a DI Ca2+ spike evoking a bAP (red trace). (c) Phase plot of the traces shown in (b). Note that the rise of the DI Ca2+ spike is slower and more gradual than that of the bAP. (d) Left: histogram of the dV/dt ratio (defined for each regenerative event as the ratio of the maximum dV/dt value in the 1.5–9 ms time window preceding the peak, to the peak dV/dt). The histogram contains 1206 regenerative events recorded in 16 CA3PCs (between 48 and 116 events in each cell) expressing both DI spikes and bAPs. Right: after logarithmic transformation of the dV/dt ratio, the histogram can be well fitted by a combination of two Gaussian distributions that belong to simple bAPs (blue) and DI spikes (orange, pooled with or without evoked bAP). Events with log(dV/dt ratio) > –1.44 (dashed line; a threshold corresponding to the mean + 2 s.d. of the bAP peak), are considered to be DI spikes. Categorization by this simple criterion well matched with subjective categorization of events by visual inspection (<0.2% mismatch of events that were confidently categorized to either group by human eye). False positives were due to random fast Vm fluctuations in the time window preceding the bAP, whereas false negatives were caused by unusually slow rise kinetics of DI spikes in some cases. (e) In ~2% of events, a bAP was preceded by a slow but steady ramp, resembling a starting slow dendritic Ca2+ spike. If the dV/dt ratio of these events remained <0.035, they were not considered as DI spikes. (f) Distance dependence of the amplitude (top) and width (bottom) of bAPs. bAPs were initiated by Iinj either at the soma (red: dual recordings) or at the dendrite (blue: dual recordings; gray: dendrite-only recordings in an extended dataset). (g) Comparison of amplitude (top) and dV/dt (bottom) of bAPs and DI spikes (dendrite-only recordings). (h) Dendritic Na+ spike in a representative dendrite-only recording. Increasing Iinj steps (protocol on top) produce fast short-latency spikes that are not accompanied by distal dendritic Ca2+ signals and that are eliminated by 1 μM TTX. Na+ spikes were identified by their clear peak followed by decreasing voltage (negative dV/dt) within the first 10 ms (bottom, averaged traces). (i) Left: percent of dendrites expressing local Na+ spikes to 600–800 pA Iinj under control conditions and after addition of TTX. Right: Na+ spikes were retained after application of 200 μM Ni2+ (n = 5 dendrites with Na+ spike in ctr), but were eliminated by subsequent application of TTX (n = 2).
-
Figure 1—figure supplement 1—source data 1
Characteristics of different regenerative dendritic events.
- https://cdn.elifesciences.org/articles/74493/elife-74493-fig1-figsupp1-data1-v1.xlsx
Figure 2

Diverse dendritic Ca2+ spike forms in soma-dendrite dual recordings from CA3 pyramidal cells (CA3PCs).
(a) Schematic of experiments. Green line indicates typical Ca2+ imaging site distal from the dendritic patch. (b) Representative recording of a slow afterdepolarization (ADP). Dendritic (black) and somatic (blue) voltage response pair to dendritic Iinj (top), and corresponding distal dendritic Ca2+ signal (middle). Dashed box on top indicates the event that is enlarged on the bottom. Note the prolonged sustained ADP building a slow depolarization that is larger in the dendrite. Open arrowhead denotes kink of the initiating backpropagating action potential (bAP). (c) Representative recording of a fast ADP. (d) Event in dashed box in (c) is shown enlarged. Top: dendritic (black) and somatic (blue) voltage pair. Middle: somatic trace magnified. Bottom: corresponding dV/dt traces (action potentials [APs] truncated). Open arrowhead denotes ‘kink’; purple arrowhead points to the fast ADP. (e–g) Representative recordings of dendritically initiated (DI) spikes, either isolated in the dendrite (e, f) or evoking a consecutive AP (g, h). Panels as in (c, d). Open arrowhead denotes AP with ‘kink’; orange arrowheads indicate DI spikes. Traces in (b, c, e, g) are from different cells. Note the different time scales of various spike forms. (i) Ca2+ spike amplitudes in dendrite (open circle) and soma (blue circle) in individual recordings. See Materials and methods for details. (j) Calculated attenuation (Amplddr/Amplsoma) in individual recordings. (k) Propensity of different Ca2+ spike forms (in total n = 21 dendrites with dual recordings).
-
Figure 2—source data 1
Diverse dendritic Ca2+ spike forms in soma-dendrite dual recordings from CA3 pyramidal cells (CA3PCs).
- https://cdn.elifesciences.org/articles/74493/elife-74493-fig2-data1-v1.xlsx
Figure 3 with 3 supplements
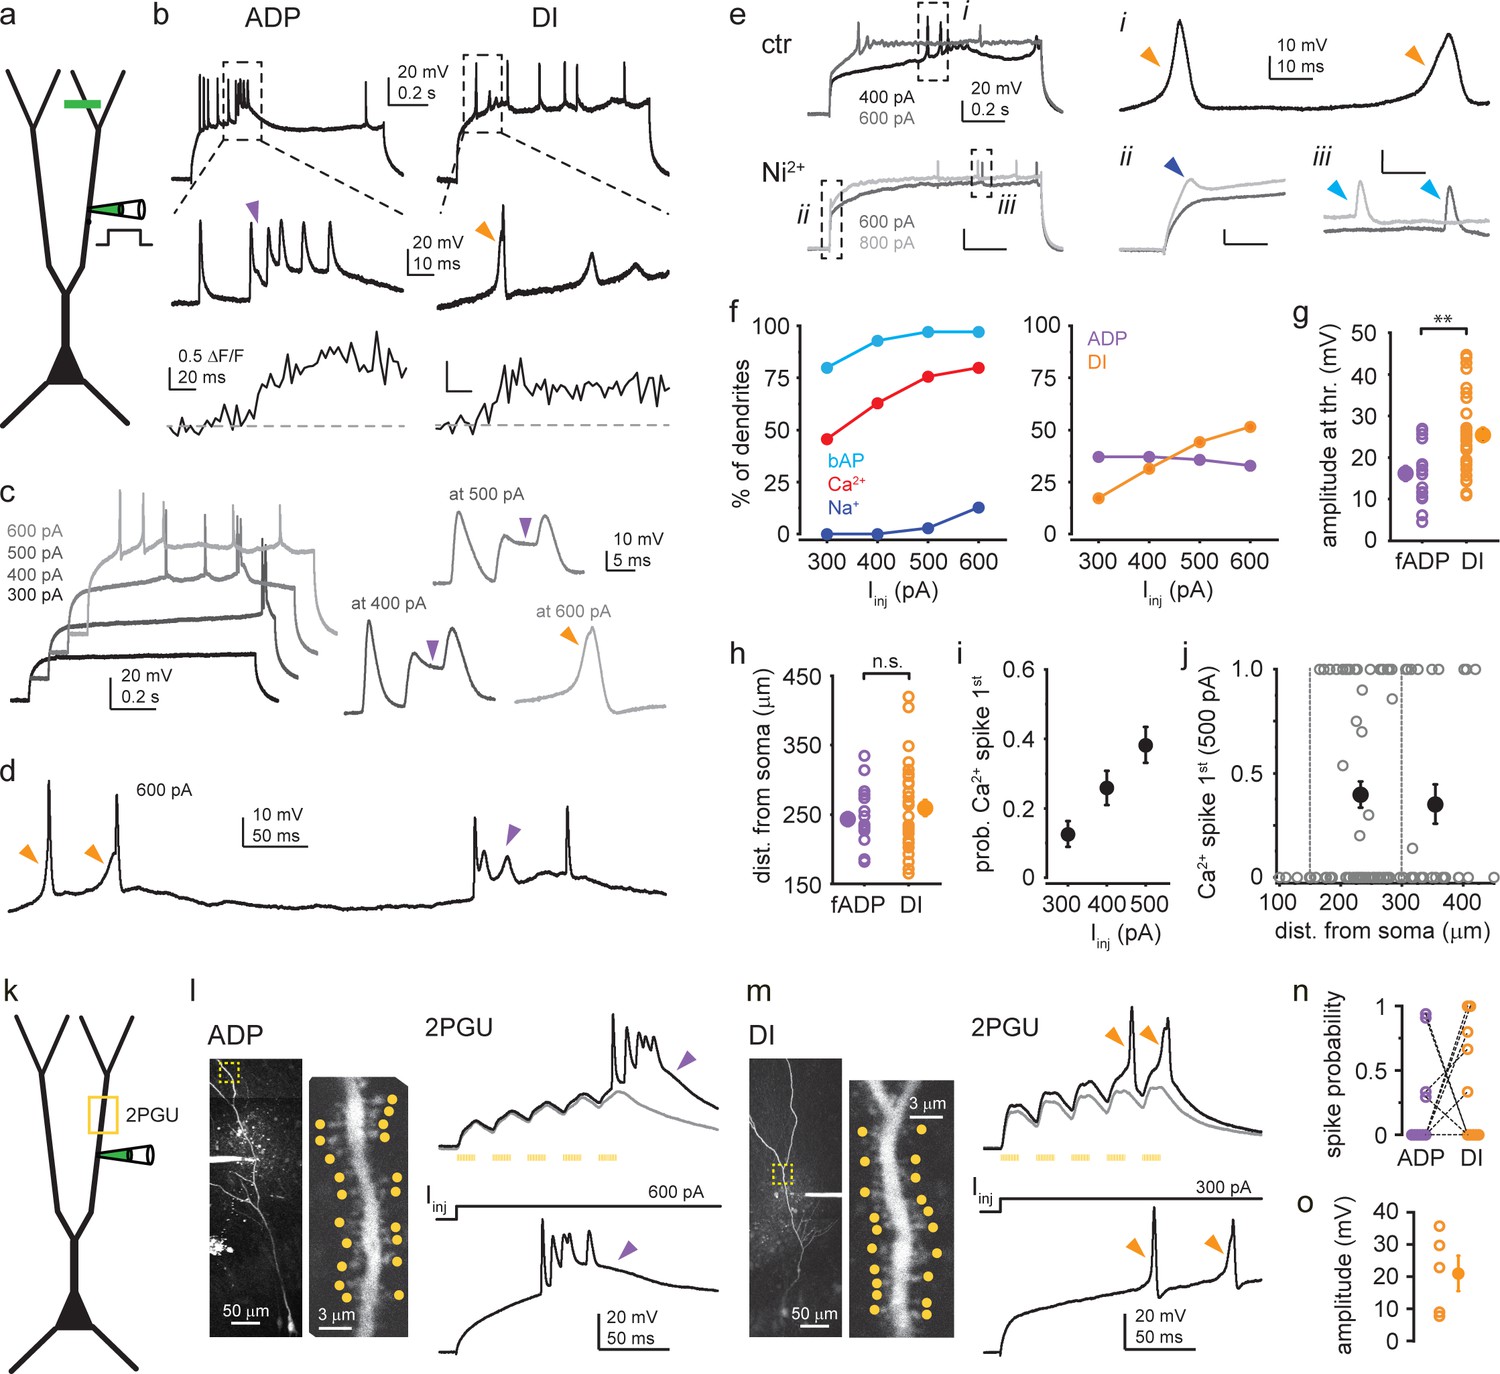
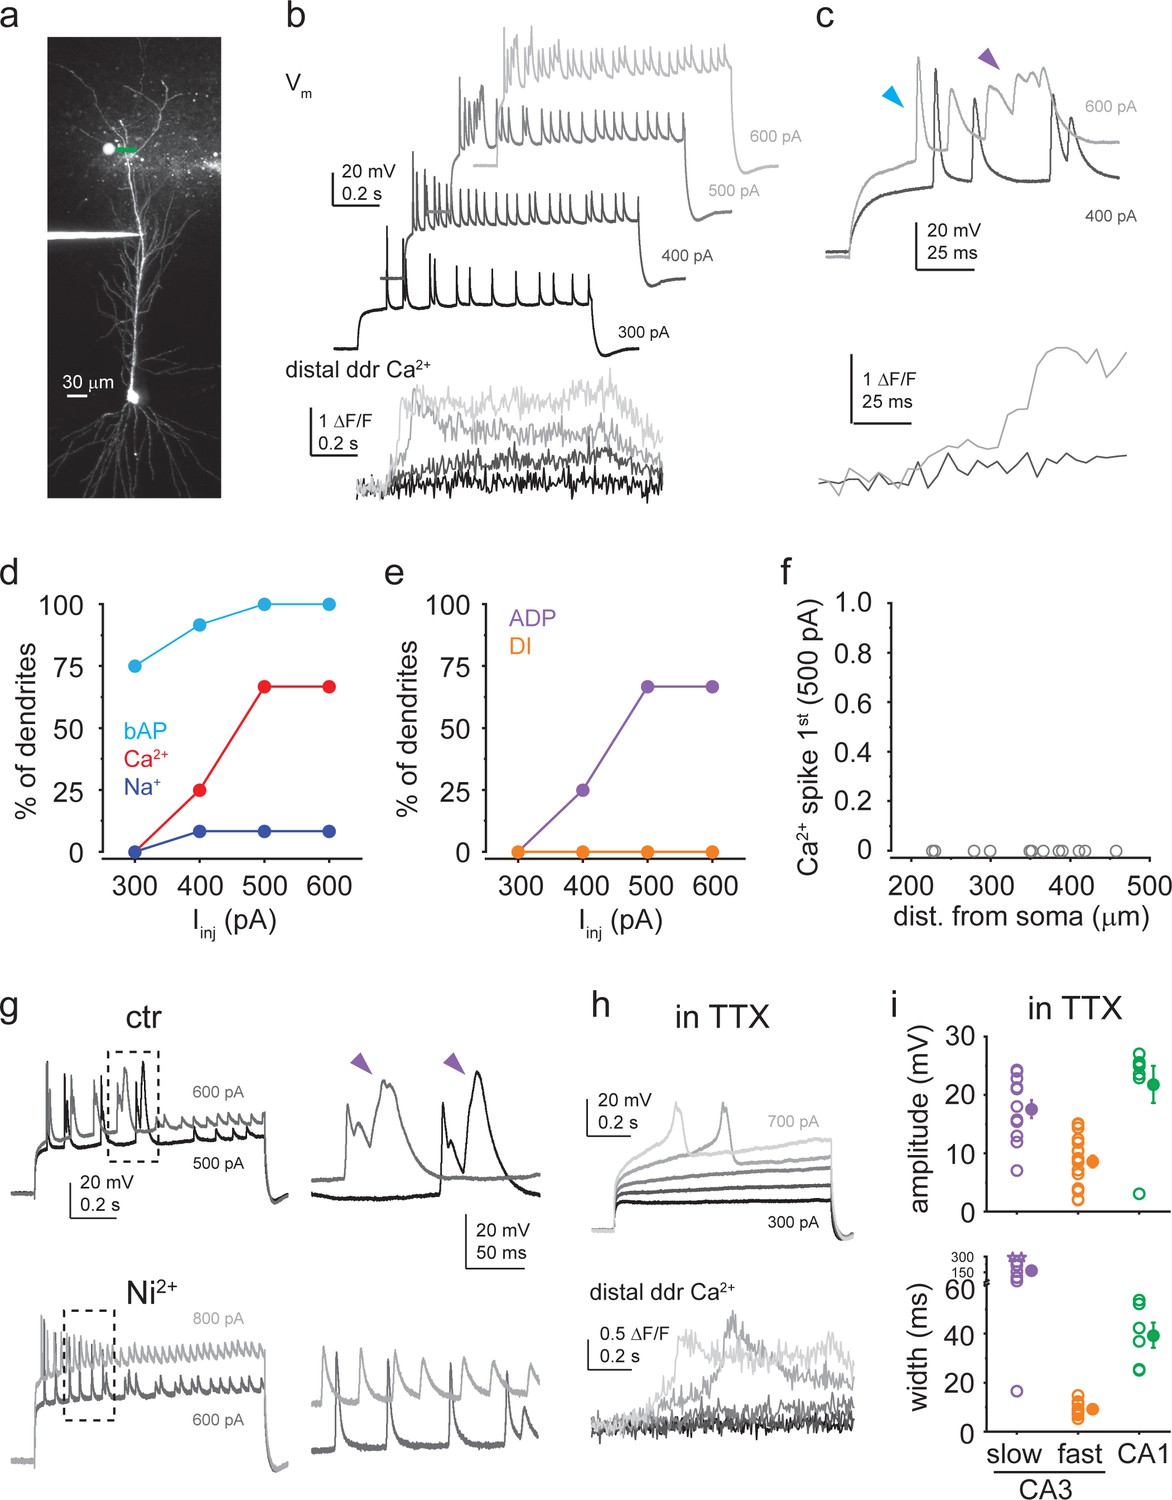
Characterization of dendritic Ca2+ spike types.
(a) Schematic of dendrite-only experiments. (b) Representative dendritic voltage and Ca2+ recording of afterdepolarization (ADP) (left) and dendritically initiated (DI) spike (right) from two different cells. (c) Example responses of a dendrite to increasing Iinj. Right: Ca2+ spikes expressed on different traces magnified. Purple arrowheads: ADP; orange arrowhead: DI spike. (d) Single trace in response to 600 pA Iinj, containing heterogeneous Ca2+ spike forms. (e) Representative traces under control conditions (top, two different Iinj) and after bath application of 200 μM Ni2+ (bottom). Dashed boxes are enlarged on the right to show DI spikes (i, orange arrowhead), dendritic Na+ spike (ii, dark blue arrowhead), and backpropagating action potentials (bAPs) (iii, light blue arrowhead). Note that Na+ spikes were resistant to Ni2+ (see also Figure 1—figure supplement 1i). (f–j) Summary of Ca2+ spike properties (dendrite-only and dual recordings pooled). (f) Left: percent of dendrites expressing bAPs, Ca2+ spikes (ADPs and DI spikes included), and Na+ spikes to 300–600 pA Iinj (n = 70 dendrites). Right: percent of dendrites expressing different types of Ca2+ spikes (ADPs and DI Ca2+ spikes) to 300–600 pA Iinj (n = 70 dendrites). (g) Amplitude of fast ADPs and DI spikes at threshold Iinj. Open circles: mean amplitude in individual dendrites; filled symbol: mean ± SEM of experiments. (h) Dendritic distance of pipette from the soma in the experiments in (g). (i) Mean probability (range: 0–1) that Ca2+ spike was the first regenerative event evoked by 300, 400, or 500 pA Iinj (n = 70, 75, 82 dendrites). (j) Probability (range: 0–1) that Ca2+ spike was the first regenerative event evoked by 500 pA Iinj as a function of pipette distance from soma. Additional proximal recordings are also shown. Open gray circles: individual dendrites; filled black symbols: mean ± SEM of measurements in 151–300 μm (n = 56) and 301–450 μm (n = 26) distance range from soma. (k) Schematic of 2P glutamate uncaging (2PGU) experiments. (l) Left: z-stack of a CA3PC, and single scan of the dendritic segment (marked by yellow dashed box) indicating the 20 synapses stimulated by 2PGU (yellow dots). Right, top: example responses to 2PGU (20 spines stimulated quasi-synchronously 5× at 40 Hz). Gray: subthreshold; black: suprathreshold response. Bottom: same dendrite responding to Iinj via the pipette. (m) Same as (l) for a dendrite with DI spike. Note the similarities in spike types by 2PGU and Iinj in (l–m). (n) Relative probability of evoking ADPs and DI spikes in dendrites (number of traces displaying the respective d-spike divided by the total number of suprathreshold traces). Dashed lines connect data from the same dendrites. (o) Amplitude of DI spikes evoked by 2PGU.
-
Figure 3—source data 1
Characterization of dendritic Ca2+ spike types.
- https://cdn.elifesciences.org/articles/74493/elife-74493-fig3-data1-v1.xlsx
Figure 3—figure supplement 1
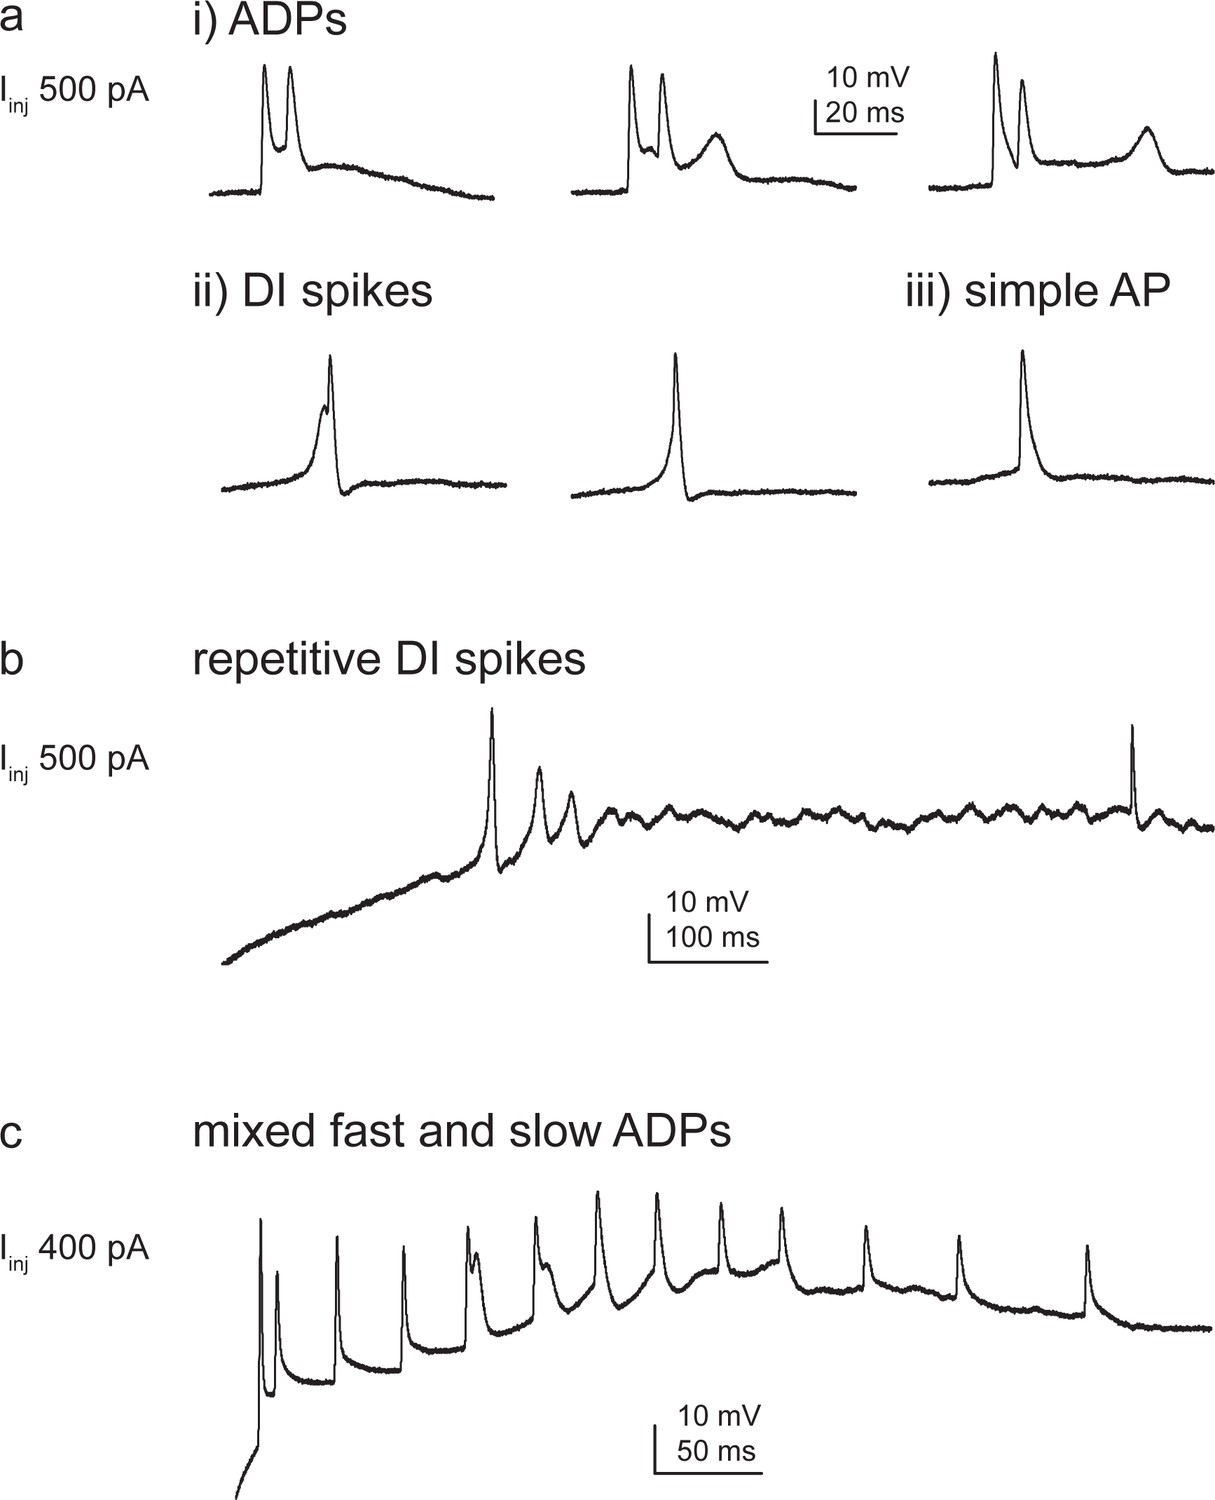
Variability of Ca2+ spike phenotypes across and within CA3 pyramidal cells (CA3PCs).
(a–c) Additional examples of CA3PCs expressing variable forms of dendritic Ca2+ spikes. (a) A dendrite expressing both (i) afterdepolarizations (ADPs) with slow and fast kinetics, as well as (ii) dendritically initiated (DI) spikes. A simple action potential (AP) is also shown (iii). All responses were evoked with 500 pA Iinj. (b) Some cells fired repetitive DI spikes with progressively smaller amplitude and slower kinetics, eventually resulting in a continuous ‘noisy’ steady state. (c) Another dendrite where both fast ADPs and a slowly developing depolarization were induced by Iinj.
Figure 3—figure supplement 2
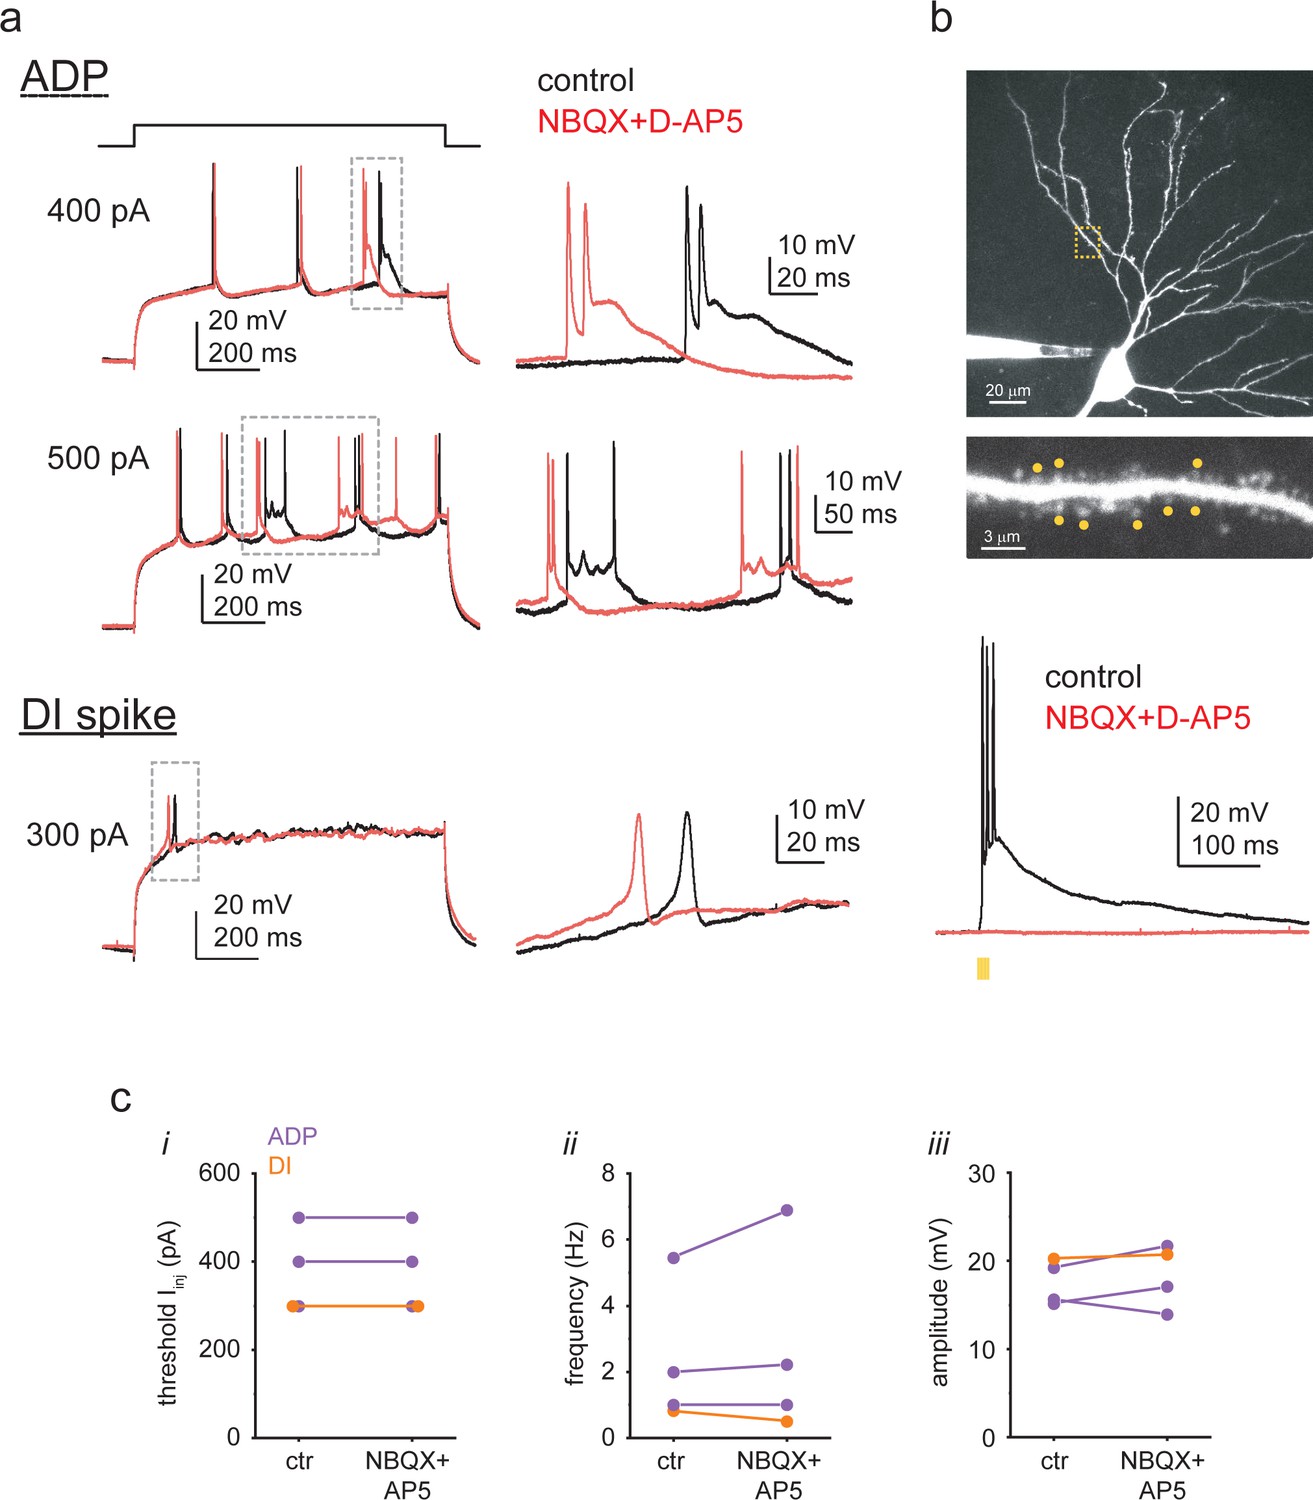
Dendritic Ca2+ spike properties do not depend on excitatory synaptic activity.
(a) Representative voltage responses to Iinj in a CA3PC dendrite with afterdepolarization (ADP) (top) and another CA3PC dendrite with dendritically initiated (DI) spike (bottom) under control conditions (black) and after bath application of 10 μM NBQX and 50 μM D-AP5 (red; same Iinj levels). Dashed boxes are shown at a larger scale on the right. (b) The receptor blockers eliminated 2P glutamate uncaging (2PGU)-evoked responses as a positive control. Top: z-stack of a somatically recorded CA3PC, and basal dendritic segment (from yellow dashed box) showing the eight spines stimulated by 2PGU (yellow dots). Bottom: quasi-synchronous uncaging (0.3 ms uncaging, 0.1 ms galvo movement between spines) at the eight spines evoked large depolarization under control conditions (black) but no response after bath application of 10 μM NBQX and 50 μM D-AP5 (red; same laser power). (c) Summary of the effect of NBXQ + D-AP5 on (i) the threshold Iinj level evoking Ca2+ spikes, and (ii) spike frequency and (iii) spike amplitude at threshold Iinj.
-
Figure 3—figure supplement 2—source data 1
Dendritic Ca2+ spike properties do not depend on excitatory synaptic activity.
- https://cdn.elifesciences.org/articles/74493/elife-74493-fig3-figsupp2-data1-v1.xlsx
Figure 3—figure supplement 3
Dendritic Ca2+ spikes in CA1 pyramidal cells (CA1PCs) are afterdepolarization (ADP) type.
(a) Two-photon (2P) stack of a CA1PC loaded with OGB-1 and Alexa 594 via a dendritic patch pipette. (b) Dendritic Vm (upper) and distal dendritic Ca2+ (lower) traces measured in the cell shown in (a) in response to 1-s-long step Iinj (300–600 pA as indicated). (c) First parts of the responses to the 400 pA and 600 pA steps are shown enlarged. Note the prolonged depolarization associated with dendritic Ca2+ signal upon ADP-like Ca2+ spike activation. Arrowheads indicate the first backpropagating action potential (bAP) (blue) and the ADP-type Ca2+ spike (purple). (d–f) Summary data from n = 12 dendrites. (d) Percent of dendrites exhibiting bAP (light blue), dendritic Ca2+ spike (red), and dendritic Na+ spike (dark blue). (e) Percent of dendrites with ADP-type (purple) and dendritically initiated (DI) (orange) Ca2+ spikes. (f) Probability of Ca2+ spikes being the first regenerative event evoked by 500 pA Iinj steps. No DI Ca2+ spikes were detected. (g) Left: Vm responses to two Iinj steps under control conditions (upper) and after bath application of 200 μM Ni2+ (lower), Right: enlarged regions in the boxes on the left panel. Note that the ADP-type Ca2+ spikes (indicated by purple arrows) observed in the control solution were inhibited by Ni2+ (n = 3 experiments). (h) Ca2+ spikes measured in 1 μM TTX in the bath. Iinj was increased in 100 pA steps from 300 to 700 pA. Note the dendritic Ca2+ signals associated with the Ca2+ spikes. (i) Comparison of dendritic Ca2+ spike amplitude and width (as measured in TTX) in CA1PCs (green, n = 7/6 for amplitude/width) versus slow (purple, n = 12) and fast (orange, n = 18/13 for amplitude/width) Ca2+ spikes in CA3PCs. Width was measured on spikes with >5 mV amplitude. Note that CA1PC Ca2+ spikes have similar amplitude but intermediate duration between fast and slow CA3PC spikes. Data in (a–c, g, h) are from three different cells.
-
Figure 3—figure supplement 3—source data 1
Dendritic Ca2+ spikes in CA1 pyramidal cell (CA1PCs) are afterdepolarization (ADP) type.
- https://cdn.elifesciences.org/articles/74493/elife-74493-fig3-figsupp3-data1-v1.xlsx
Figure 4
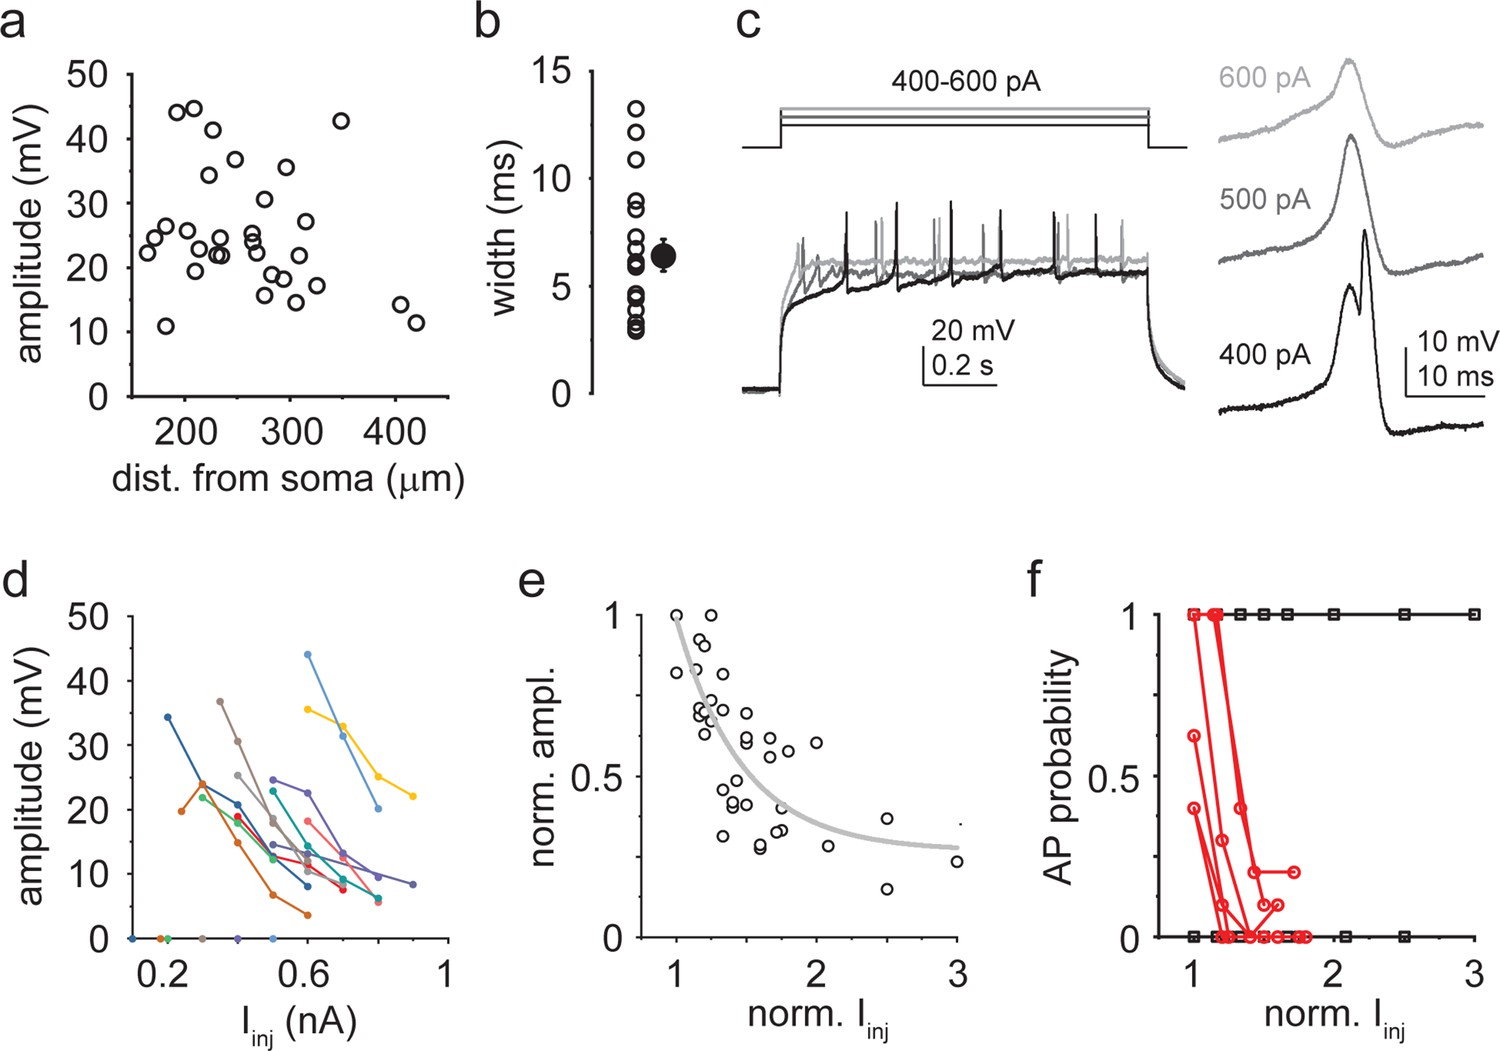
Properties of dendritically initiated (DI) Ca2+ spikes.
(a) Spike amplitude as a function of pipette distance from soma (circles: individual dendrites, n = 30). (b) Width at half amplitude of DI spikes. Open circles: individual dendrites; filled symbol: mean ± SEM (n = 18). (c) Representative responses of a dendrite to 400–600 pA Iinj. Right: first regenerative events enlarged. (d) Iinj˗amplitude response curves in 12 dendrites with DI spikes. (e) Normalized Iinj˗amplitude relationship established from the data in (d). Gray line: exponential decay function. (f) Probability of action potential (AP) firing directly elicited by DI spikes at various Iinj levels. In 6 out of 12 dendrites, larger Iinj evoked DI spikes with progressively lower AP probability (red). In the other six dendrites, AP probability remained 0 or 1.
-
Figure 4—source data 1
Properties of DI Ca2+ spikes.
- https://cdn.elifesciences.org/articles/74493/elife-74493-fig4-data1-v1.xlsx
Figure 5 with 1 supplement
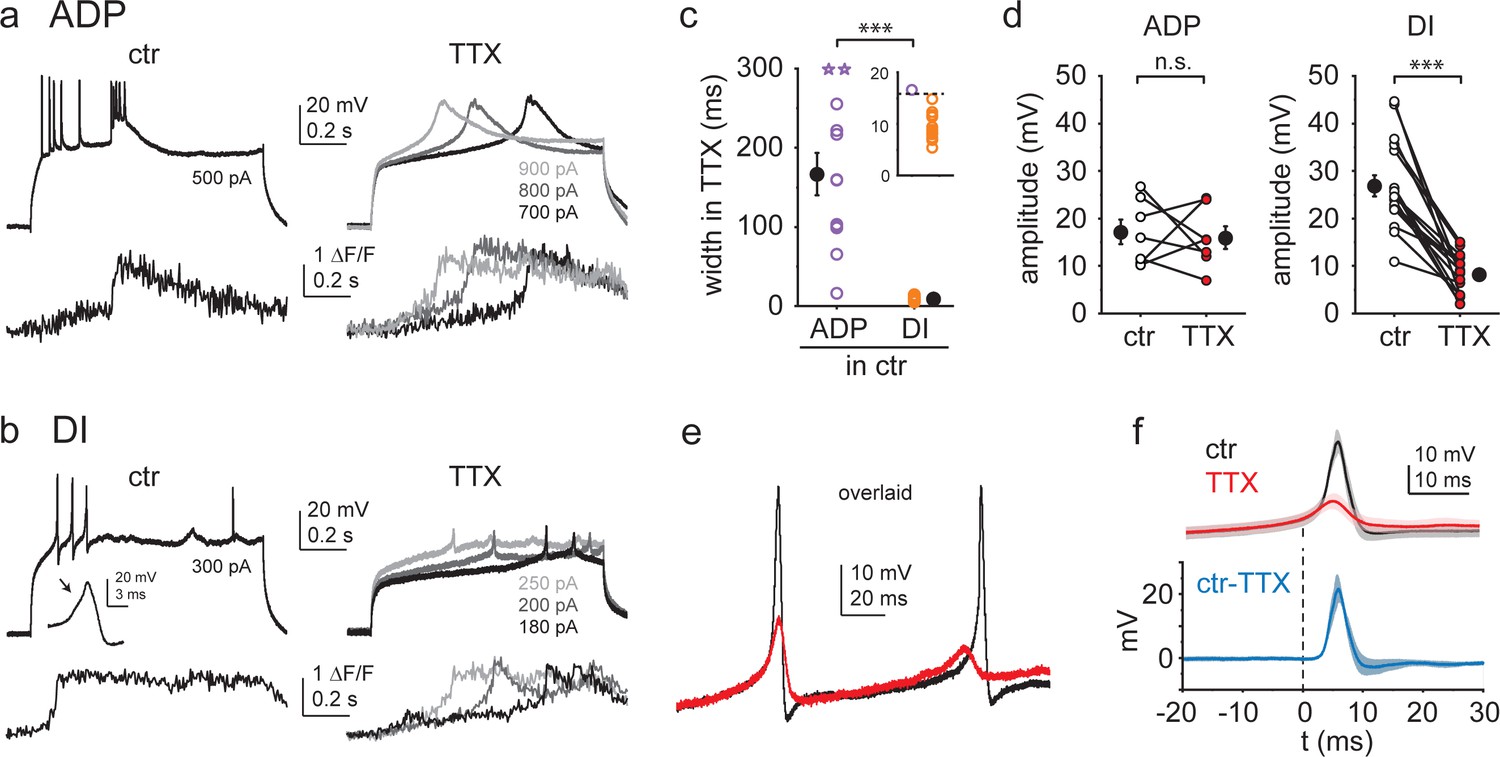
Ca2+ spikes with different kinetics are mediated by different ionic mechanisms.
(a, b) Representative experiments showing the effect of 1 μM TTX on afterdepolarizations (ADPs) (a) and dendritically initiated (DI) spikes (b). Vm (top) and distal dendrite Ca2+ signals (bottom) under control conditions (left) and after application of TTX at various Iinj levels. (c) Width of TTX-resistant Ca2+ spikes in cells with ADP only (purple, n = 12) and cells expressing DI spikes (orange, n = 13). Open circles: individual dendrites (open stars: dendrites where width was maximized as 300 ms because Vm did not return to half amplitude within the duration of the Iinj step); filled black symbols: mean ± SEM. Inset shows the 0–20 ms width range magnified. (d) Comparison of spike amplitude before and after TTX application in dendrites with ADPs only (left, n = 7) and dendrites with DI spikes (right, n = 17). (e) Overlaid voltage traces from a dendrite in control (black) and after TTX application (red). (f) Summary of the impact of TTX on DI spike kinetics. Top: Vm traces before (black, ctr) and after (red) TTX application (mean ± SEM of six experiments), aligned to 1 V/s. Bottom: result of the subtraction of ctr and TTX traces. The fast TTX-sensitive component follows the initial slow depolarization.
-
Figure 5—source data 1
Ca2+ spikes with different kinetics are mediated by different ionic mechanisms.
- https://cdn.elifesciences.org/articles/74493/elife-74493-fig5-data1-v1.xlsx
Figure 5—figure supplement 1
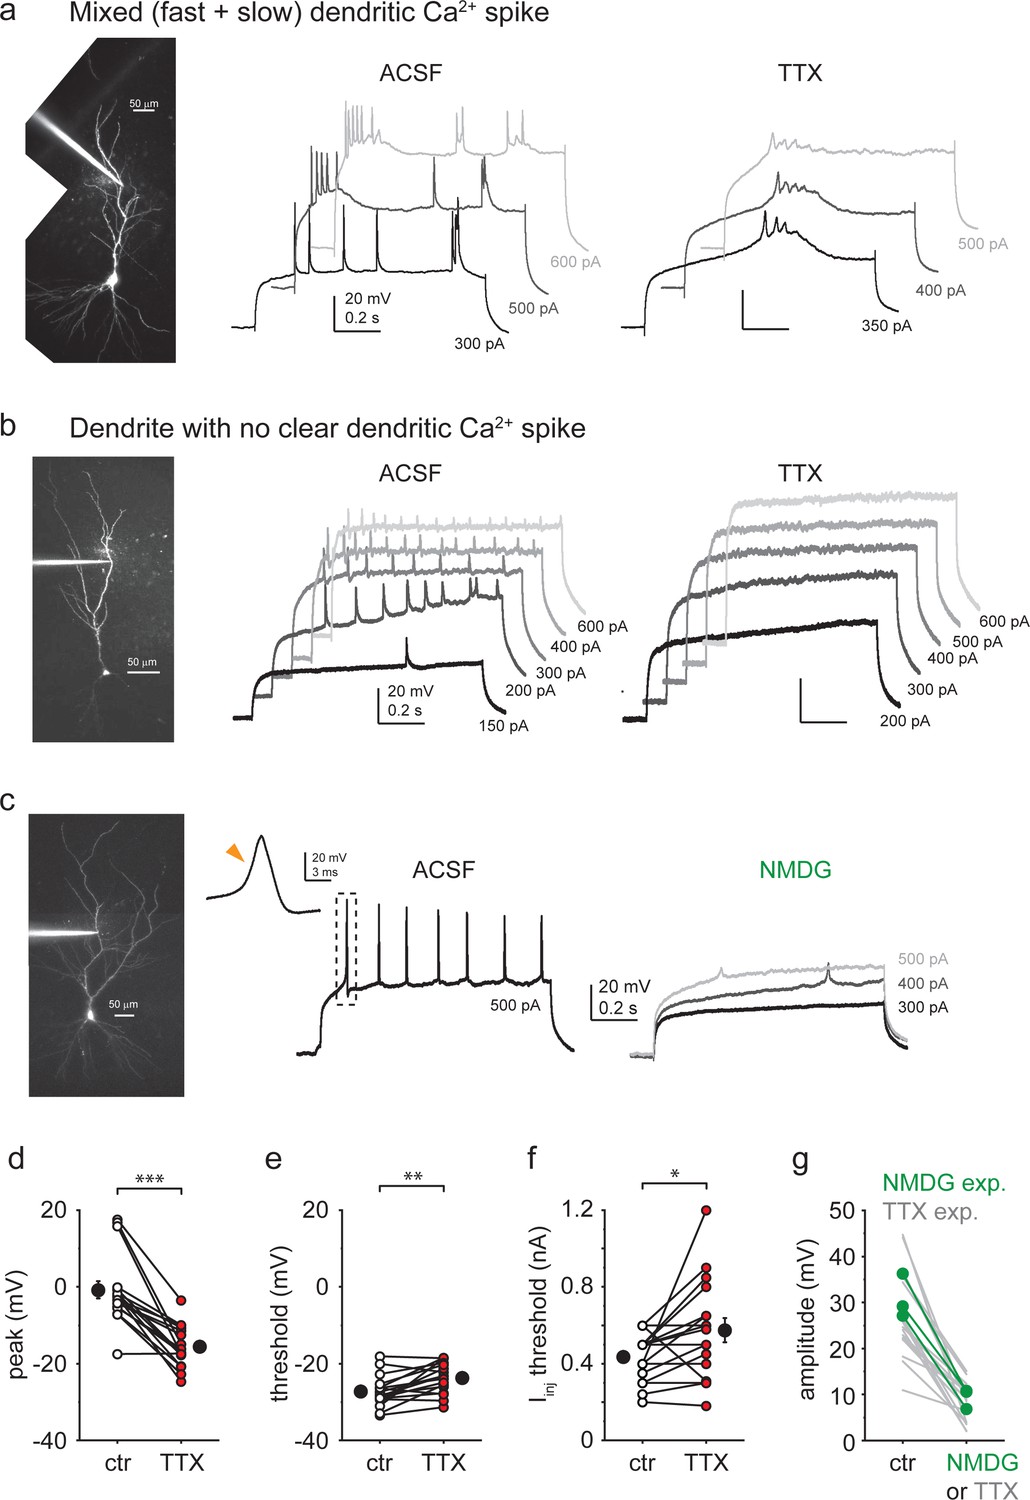
Additional properties of dendritic Ca2+ spikes.
(a) Example recording of a CA3PC dendrite with mixed types of Ca2+ spikes in TTX. (b) Example recording of a CA3PC dendrite with no clear Ca2+ spike. (c) Example recording of a CA3PC dendrite with dendritically initiated (DI) spike in ACSF and after partial replacement of Na+ with NMDG+. (d–f) Effect of TTX on peak (d; mean difference ~15 mV, n = 17), voltage threshold (e; mean difference ~3.5 mV, n = 17), and Iinj threshold (f, mean difference: ~ 140 pA, n = 17) of DI fast spikes. (g) Summary of the impact of NMDG+ on DI spike amplitude (n = 3). Note that the effect is similar to that of TTX (data from Figure 5d).
-
Figure 5—figure supplement 1—source data 1
Additional properties of dendritic Ca2+ spikes.
- https://cdn.elifesciences.org/articles/74493/elife-74493-fig5-figsupp1-data1-v1.xlsx
Figure 6
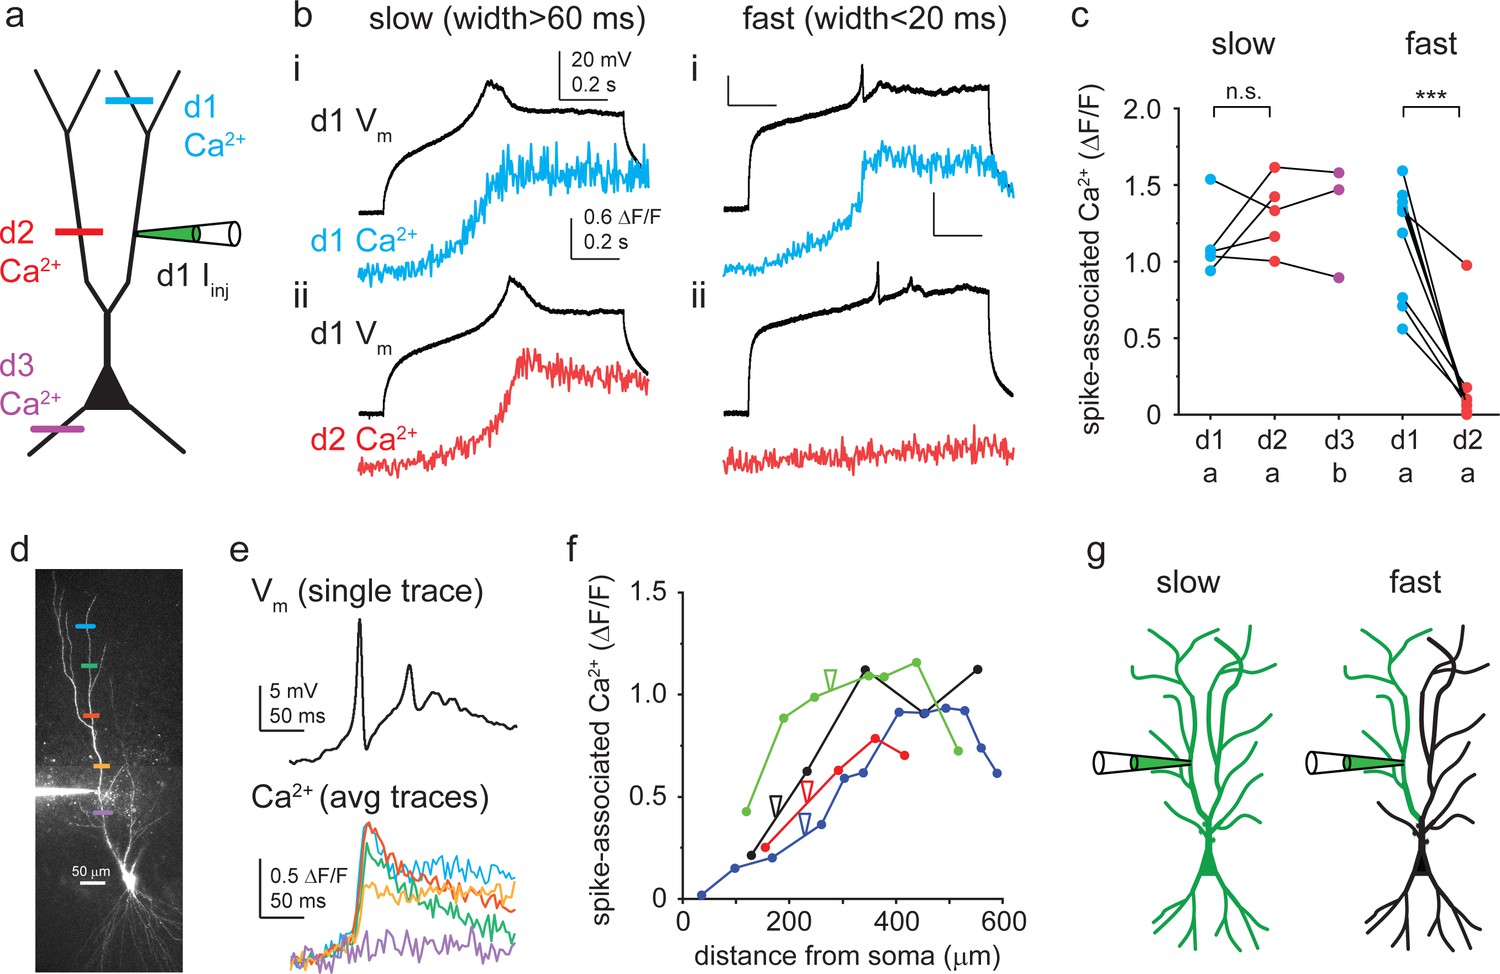
Propagation of different Ca2+ spike types.
(a) Schematic of experimental strategy. Dendritic Ca2+ signals were measured as a proxy to assess Ca2+ spike propagation in different regions of the arbor. (b) Representative TTX-resistant slow (left) and fast (right) Ca2+ spikes. Spike-evoked Ca2+ signals (OGB-1) measured in the patched (i) and in a different (ii) apical dendritic subtree. (c) Summary of spike-evoked Ca2+ signal amplitudes at different dendritic tree parts. Note that large spike-evoked Ca2+ signals likely saturate OGB-1. (d) Two-photon (2P) stack of a CA3PC, with Ca2+ measurement sites indicated by colored lines. (e) Fast Ca2+ spike-evoked Ca2+ signals (measured with OGB-6F) at the locations indicated in panel (d). Ca2+ signals were aligned to spike onset (one voltage trace shown on top). (f) Distance dependence of fast Ca2+ spike-associated Ca2+ signals in four experiments. Note the drop of Ca2+ signals from the pipette towards the soma. (g) Concept of compartmentalization rules. Slow Ca2+ spikes are global events, whereas fast Ca2+ spikes are restricted to apical dendritic subtrees.
-
Figure 6—source data 1
Propagation of different Ca2+ spike types.
- https://cdn.elifesciences.org/articles/74493/elife-74493-fig6-data1-v1.xlsx
Figure 7
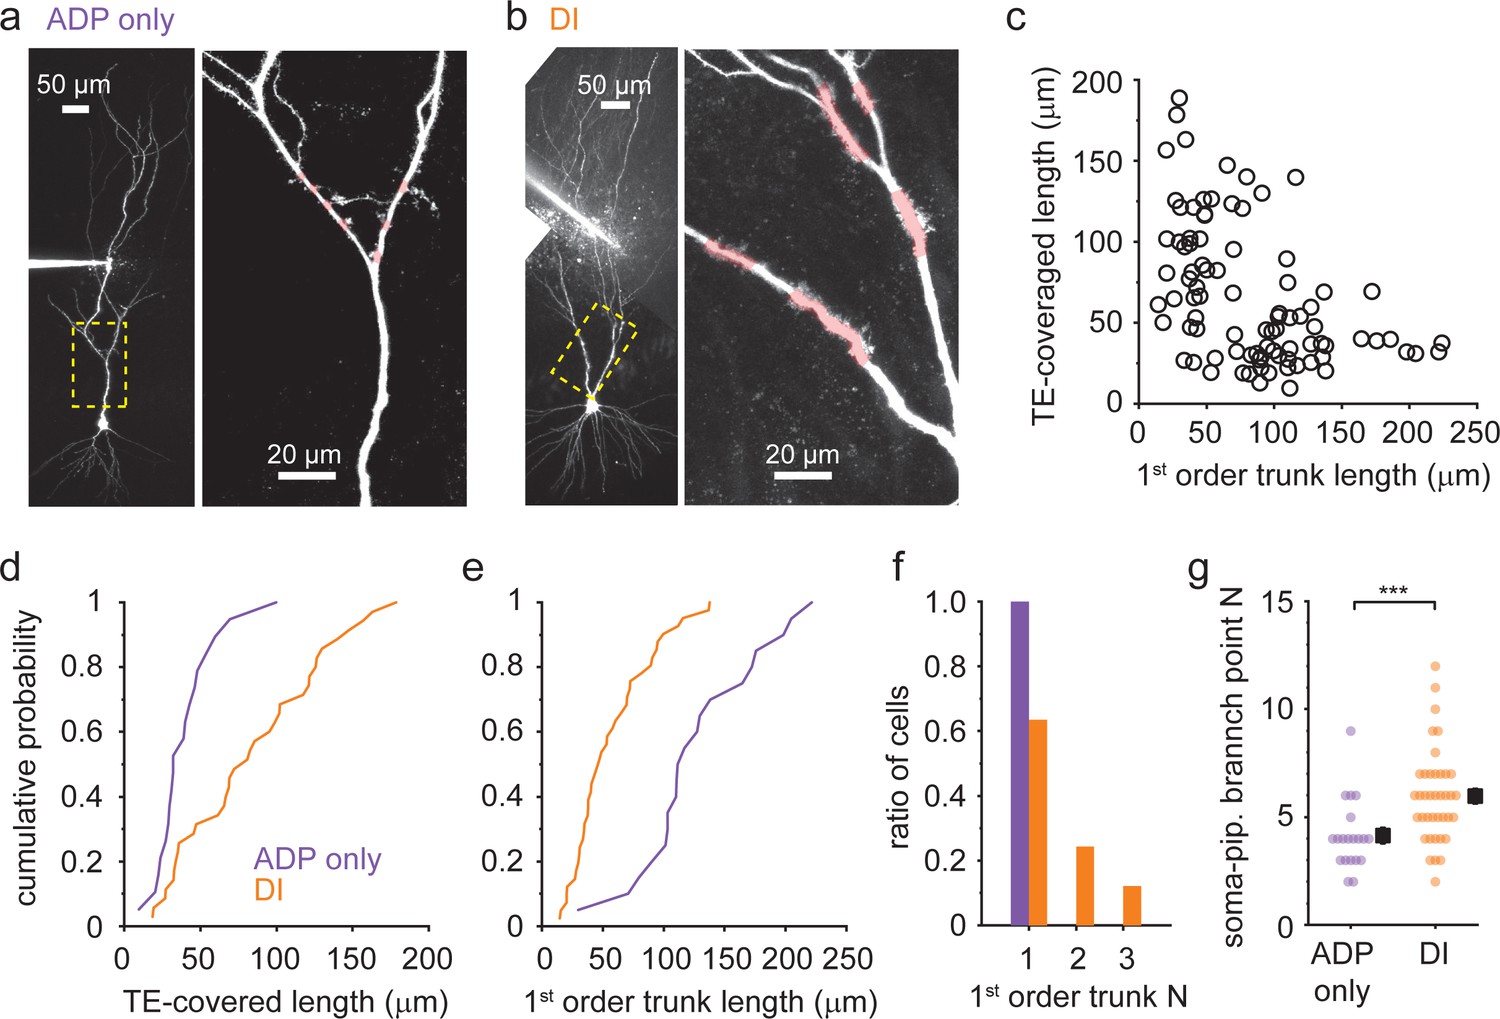
Dendritic Ca2+ spike phenotype correlates with morphological traits (a, b).
Representative two-photon (2P) stack of two CA3 pyramidal cells (CA3PCs) with afterdepolarization (ADP)-only (a) or dendritically initiated (DI) (b) Ca2+ spike phenotypes (with ≤600 or 700 pA Iinj). Yellow dashed boxes are enlarged on the right panels. Trunk segments with thorny excrescences (TEs) are indicated by pink shading. (c) Relationship between first-order apical trunk length and total TE-covered dendrite length among CA3PCs (n = 89). For cells with multiple primary trunks, the mean trunk length is shown. (d, e) Cumulative probabilities of total TE-covered dendrite length (d, n = 19 ADP-only, n = 35 DI) and first-order apical trunk length (e, n = 20 ADP-only, n = 41 DI) for cells with dendritically recorded ADP-only and DI Ca2+ spike types. (f) Number of first-order apical trunks for the two electrophysiological groups (n = 20 ADP-only, n = 41 DI). (g) Number of branch points between the patch pipette and the soma in the two electrophysiological groups.
-
Figure 7—source data 1
Dendritic Ca2+ spike phenotype correlates with morphological traits.
- https://cdn.elifesciences.org/articles/74493/elife-74493-fig7-data1-v1.xlsx
Figure 8 with 1 supplement
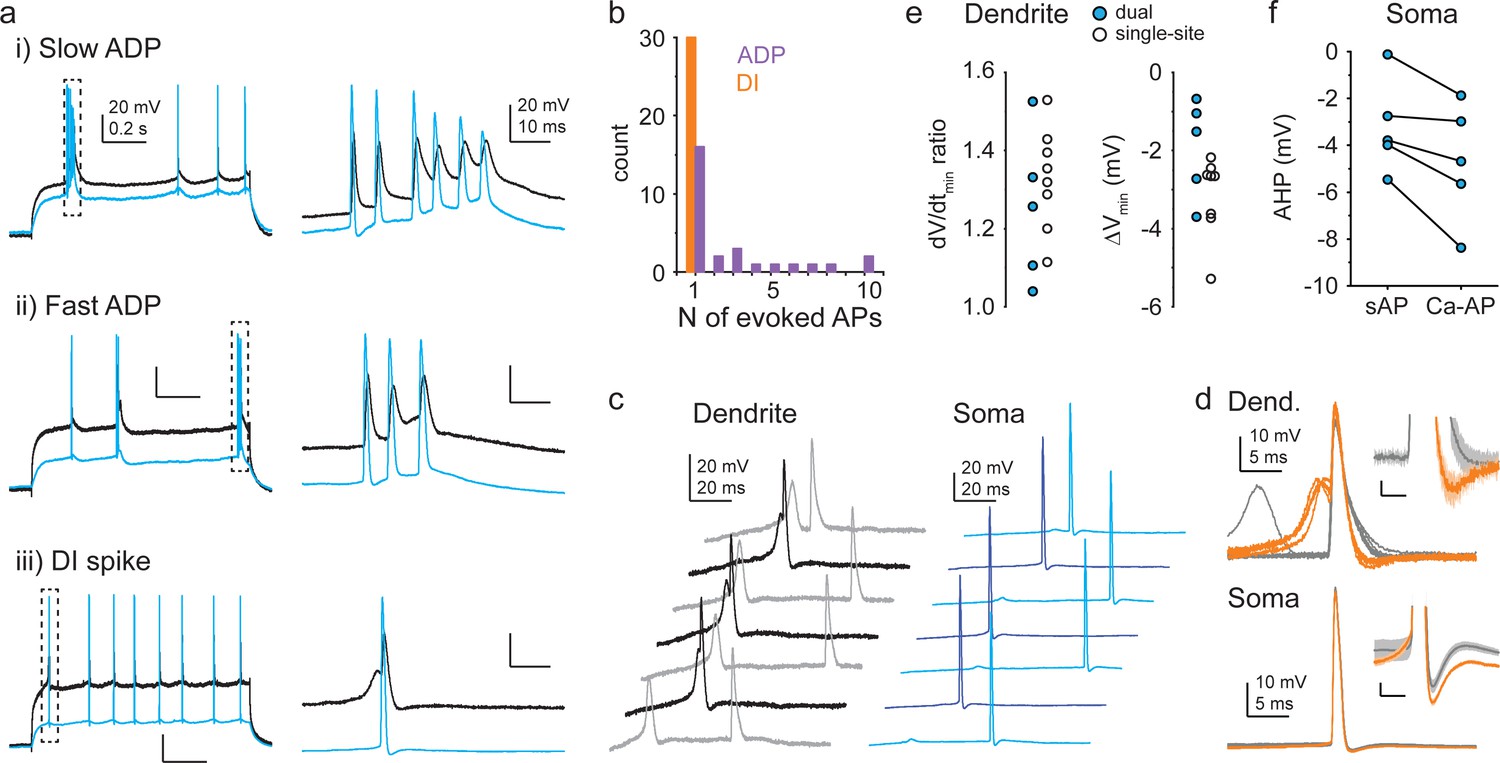
Opposing impact of different Ca2+ spike types on somatic output.
(a) Example of action potential (AP) output evoked by slow afterdepolarization (ADP) (top), fast ADP (middle), and dendritically initiated (DI) spike (bottom) in dual recordings (three different cells). (b) Median number of APs evoked at threshold Iinj by ADPs and DI spikes in individual cells. Note that n = 1 AP evoked by an ADP results in a burst of two APs together with the AP initiating the ADP. Only cells with at least three Ca2+ spike events evoking APs were included in the analysis. (c) Example traces from a dual recording. Darker colors indicate traces with Ca-APs. (d) Ca-APs (orange) and s-APs (gray) aligned to peak from the experiment shown in (c). Insets show afterhyperpolarizations (AHPs) enlarged; scale bars: 1 mV, 3 ms. (e) Ratio of repolarization rate (dV/dtmin, left) and difference in minimum Vm within 12 ms after peak (right) of Ca-APs and s-APs measured in dendrites. Blue-filled circles: dual recordings; open circles: dendrite-only recordings. (f) Somatic AHP amplitude following Ca-APs and s-APs in dual recordings.
-
Figure 8—source data 1
Opposing impact of different Ca2+ spike types on somatic output.
- https://cdn.elifesciences.org/articles/74493/elife-74493-fig8-data1-v1.xlsx
Figure 8—figure supplement 1
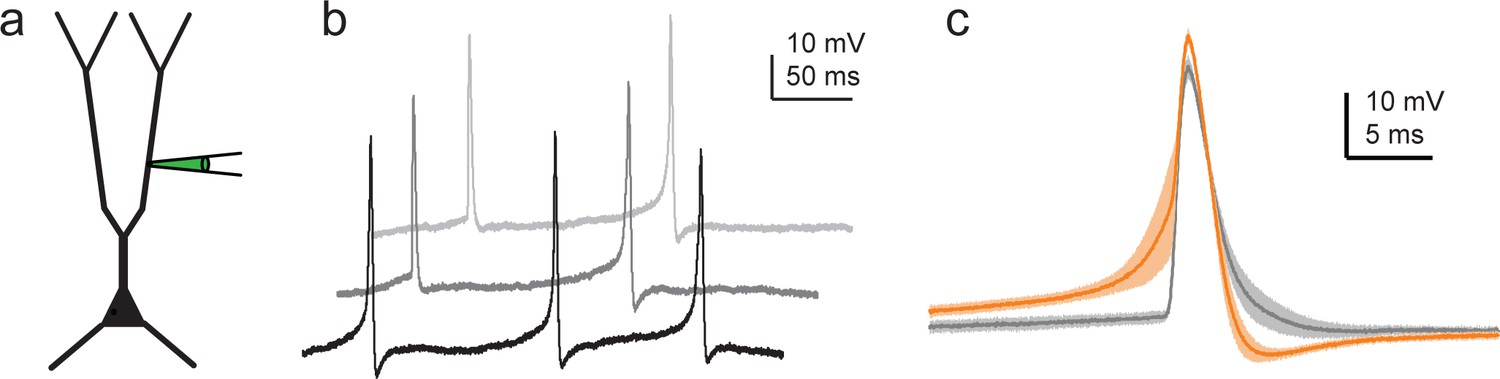
Effect of dendritically initiated (DI) spikes on action potential (AP) output in single-site dendritic recordings.
(a) Experiment schematic. (b) Three individual trace segments during 200 pA Iinj steps recorded in a representative CA3 pyramidal cell (CA3PC) dendrite, showing s-APs and Ca-APs. (c) Ca-APs (orange, mean ± SEM of n = 15 events) and s-APs (gray, mean ± SEM of n = 10 events) aligned to peak from the experiment shown in (b).
Additional files
Download links
A two-part list of links to download the article, or parts of the article, in various formats.
Downloads (link to download the article as PDF)
Open citations (links to open the citations from this article in various online reference manager services)
Cite this article (links to download the citations from this article in formats compatible with various reference manager tools)
Distinct dendritic Ca2+ spike forms produce opposing input-output transformations in rat CA3 pyramidal cells
eLife 10:e74493.
https://doi.org/10.7554/eLife.74493


