Nanchangmycin regulates FYN, PTK2, and MAPK1/3 to control the fibrotic activity of human hepatic stellate cells
- Division of Gastroenterology, Massachusetts General Hospital, United States
- Harvard Medical School, United States
- Harvard T.H. Chan School of Public Health, United States
- Boehringer Ingelheim Pharma GmbH & Co, Germany
- Harvard Stem Cell Institute, United States
Figures
Figure 1 with 2 supplements
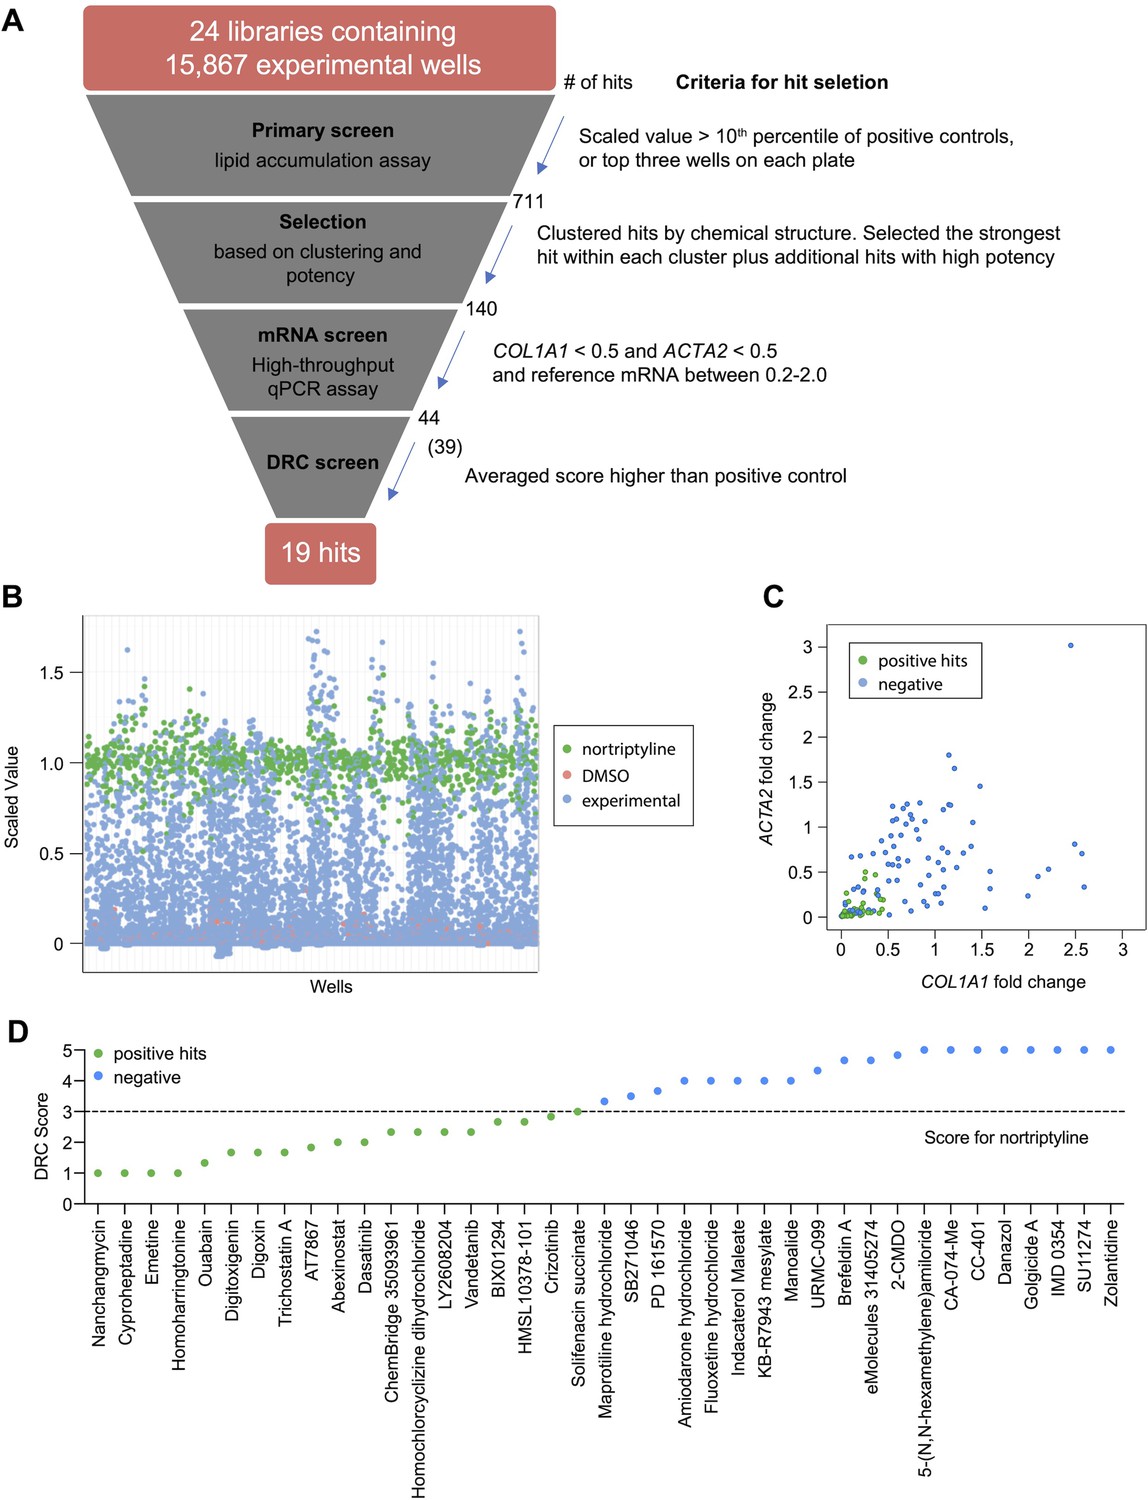
High-throughput small molecule screen in primary human HSCs.
(A) Overview of the small molecule screen. The number of candidate compounds (# of hits) is indicated at each step. The number in parenthesis represents the number of compounds tested in the final dose response curve (DRC) analysis due to availability. (B) Results of the primary lipid accumulation screen. Each dot indicates the mean scaled value of two replicates for each condition at 48 hr. Red dots represent negative control wells (DMSO), green dots represent positive control wells (nortriptyline, 27 µM), and blue dots represent experimental wells. (C) Results of the secondary mRNA screen. Each dot indicates the mean fold change of ACTA2 and COL1A1 after treatment with compounds (normalized to DMSO controls). PSMB2 was used as the reference gene (n=4). Green dots represent positive hits (<0.5), and blue dots represent non-hits (negative). (D) Dose-response curves were plotted for 39 compounds and were scored by three researchers independently. The mean score for each compound was plotted. The dotted line indicates the score of the positive control nortriptyline. Green dots represent positive hits, and blue dots represent non-hits (negative). This figure has two supplements.
Figure 1—figure supplement 1
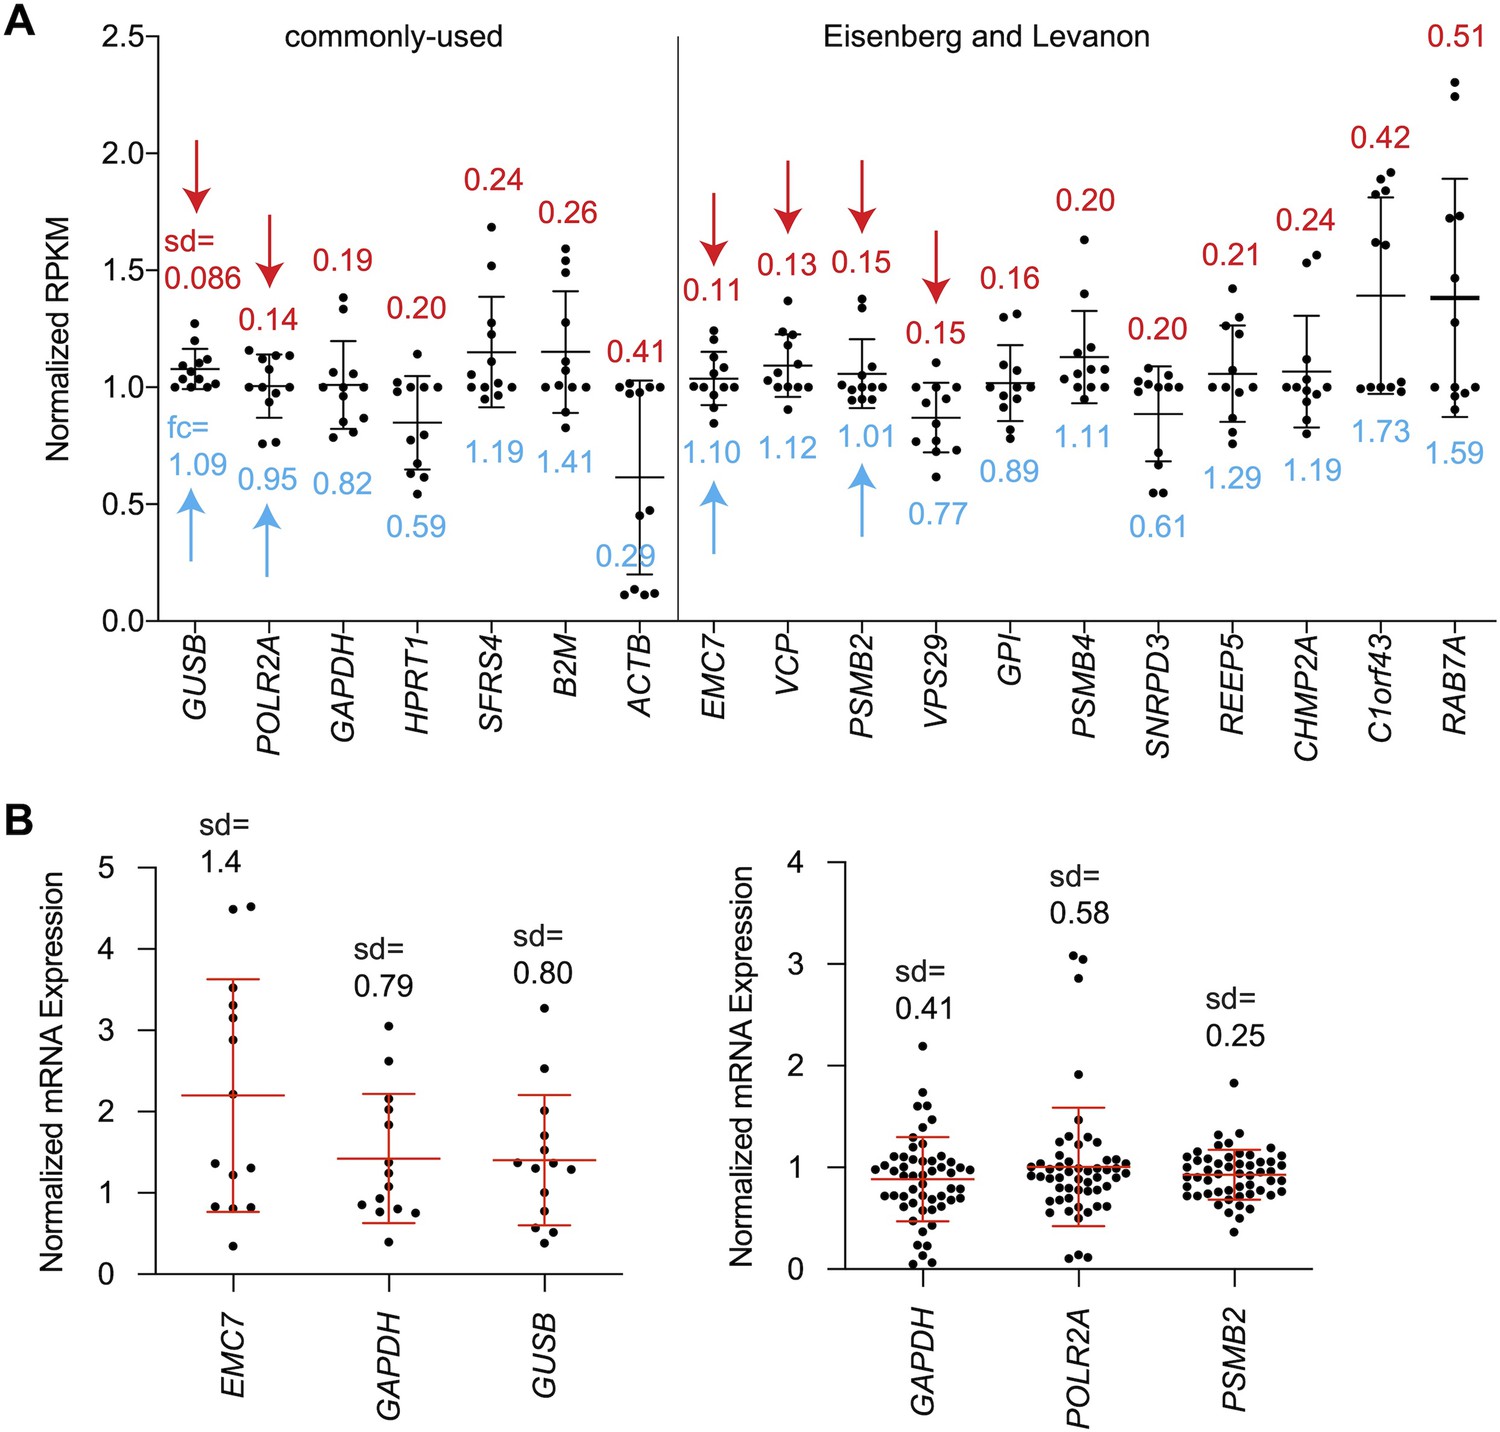
Selection of PSMB2 as the reference mRNA for the qPCR-based secondary screening assay.
(A) Expression of house-keeping genes in HSCs was plotted by RPKM as previously quantified (Chen et al., 2017). Three pairs of samples were used in this analysis: ceramide treatment vs control, nortriptyline treatment vs control, nortriptyline treatment vs control in TGF-β treated HSCs (Chen et al., 2017). Each dot represents the result from one sample, and bars represent mean ± standard deviation (sd). The value of sd is indicated above each mRNA. The fold change (fc) of EMC7, VCP, PSMB2, and VPS29 in inactivated HSCs (ceramide or nortriptyline-treated) compared to corresponding control groups is indicated below the dots. Two groups of reference mRNAs were analyzed – commonly used ones (left) and genes that are expressed uniformly across tissues (Eisenberg and Levanon, 2013). Red arrows indicate samples with sd of 0.15 or less. Blue arrows highlight the reference mRNAs with fold change of no more than 10% in inactivated HSCs and were selected for further analysis. GAPDH, which is used routinely as a reference control was also included. (B) Quantification of expression of EMC7, GAPDH, GUSB, POLR2A, and PSMB2 from HSC cDNA samples (left: n=14, right: n=53) that were reverse transcribed from equal amounts of total input RNA. All samples were normalized to the mean value of its own control group before they were combined for each of the reference mRNAs. Each dot represents the result from one sample, and bars represent mean ± standard deviation (sd) of all the tested samples. The value of sd is indicated above each mRNA.
Figure 1—figure supplement 2
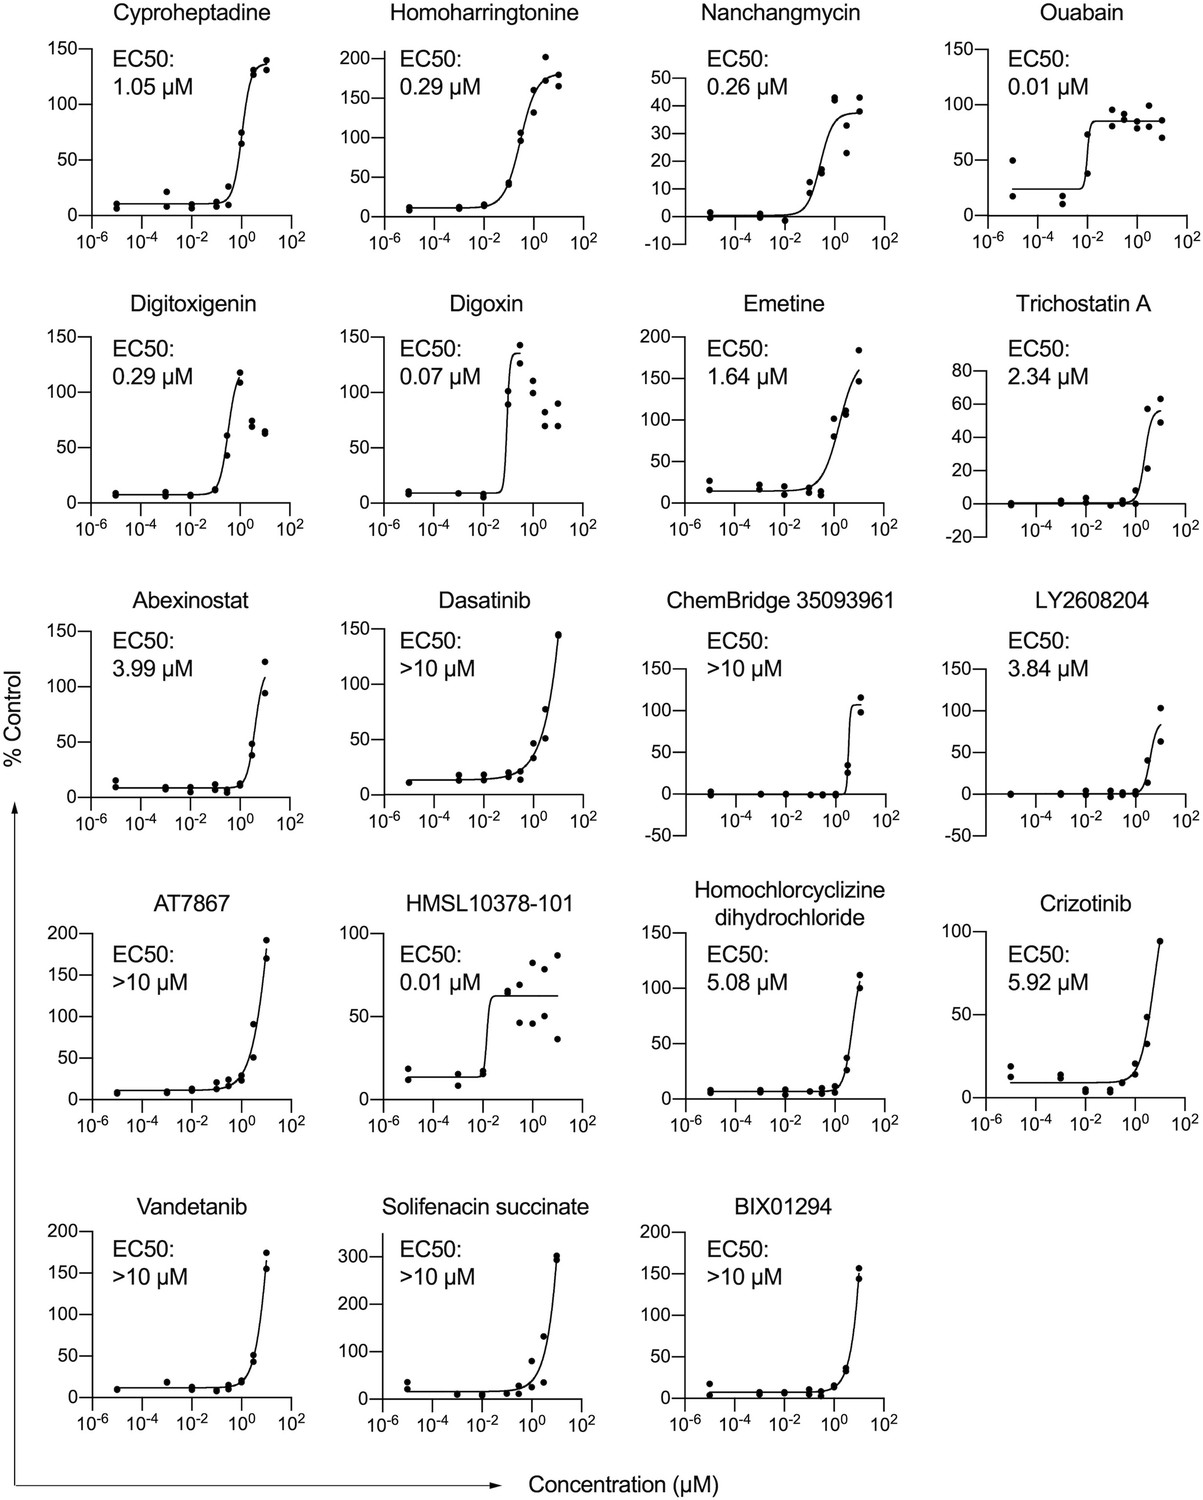
Nineteen compounds were identified to induce lipid accumulation in HSCs.
HSCs from human donor 2 were treated with compounds at indicated concentrations. Each dot represents one well (n=2 technical replicates per concentration). Curves were generated by fitting the data into a sigmoidal equation. For digitoxigenin and digoxin, the highest two or three concentrations respectively were not used for fitting the curves due to the toxicity at these concentrations. If a compound was tested more than one time, only one representative curve is shown here, while the average score from all curves was used for ranking the compounds. Results from each individual experiment and data from all replicates are in Supplementary file 6.
Figure 2 with 2 supplements
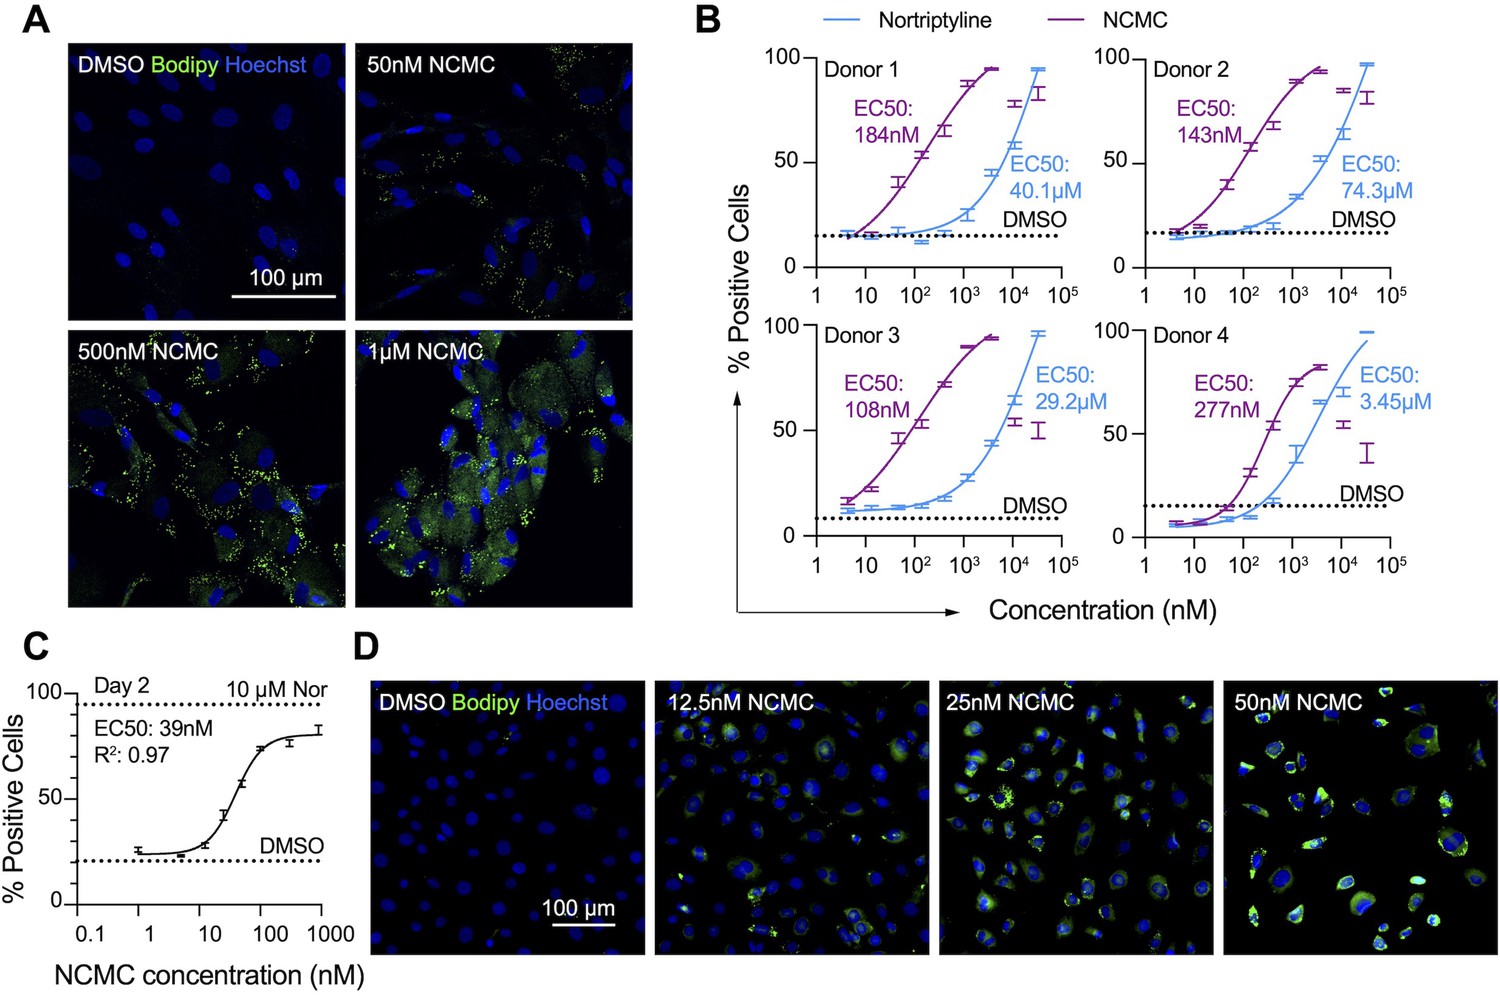
NCMC induces lipid accumulation in HSCs.
(A) Representative microscopic images of HSCs treated with DMSO and NCMC for 48 hr. Cells were stained with Bodipy to identify lipid droplets (green) and Hoechst to define nuclei (blue). Scale bar represents 100 µm. (B) Dose response curves for NCMC (purple) and nortriptyline (blue) in HSCs isolated from four different human donors at 48 hr. Dotted line represents the mean percentage of Bodipy-positive cells in DMSO control wells. Error bars represent mean ± SEM (n=12). One experiment was performed independently for each of four donor lines. Curves were generated by fitting the data to a sigmoidal model. The data from the highest two concentrations of NCMC treatment (11 and 33 µM) were not used for fitting due to higher toxicity at these concentrations, as indicated by cell number (Figure 2—figure supplement 1). (C) Dose response curve for NCMC treatment in murine primary HSCs at 48 hr. Dotted lines represent the averaged percentage of Bodipy-positive cells in DMSO-negative control wells (lower) and nortriptyline-positive control wells (10 µM, upper). Error bars represent mean ± SEM (n=6). Data are representative of three independent experiments. (D) Representative images of murine HSCs treated with DMSO and NCMC for 48 hr and stained with Bodipy to identify lipid droplets (green) and Hoechst to define nuclei (blue). Scale bar represents 100 µm. This figure has two supplements.
Figure 2—figure supplement 1
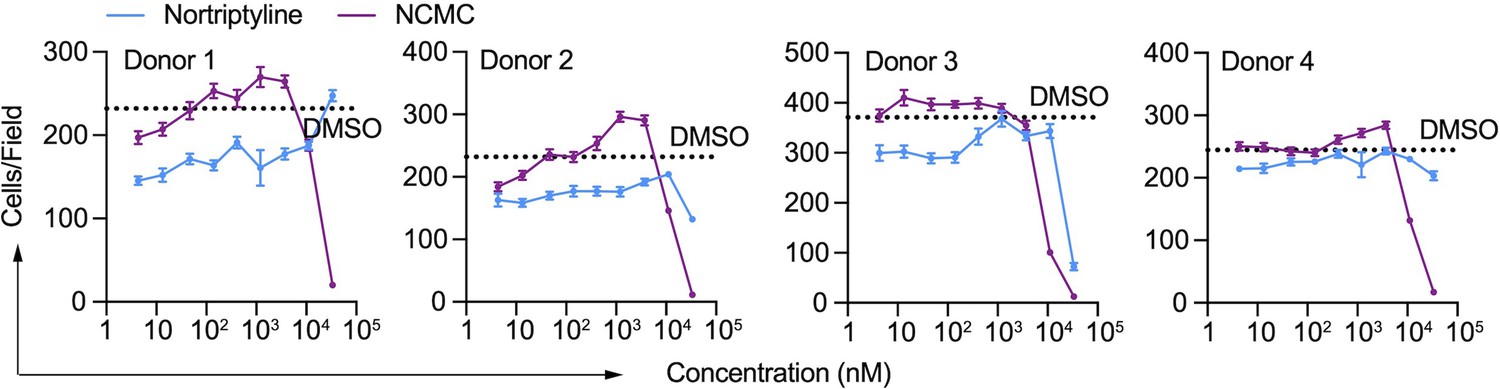
Effect of NCMC on cell number.
Effects of NCMC (purple) and nortriptyline (blue) on cell numbers in HSCs isolated from four different human donors at 48 hr. Dotted line represents the mean number of cells per microscopic field in DMSO control wells. Error bars represent mean ± SEM (n=12). One experiment was performed independently in each of the four donors.
Figure 2—figure supplement 2
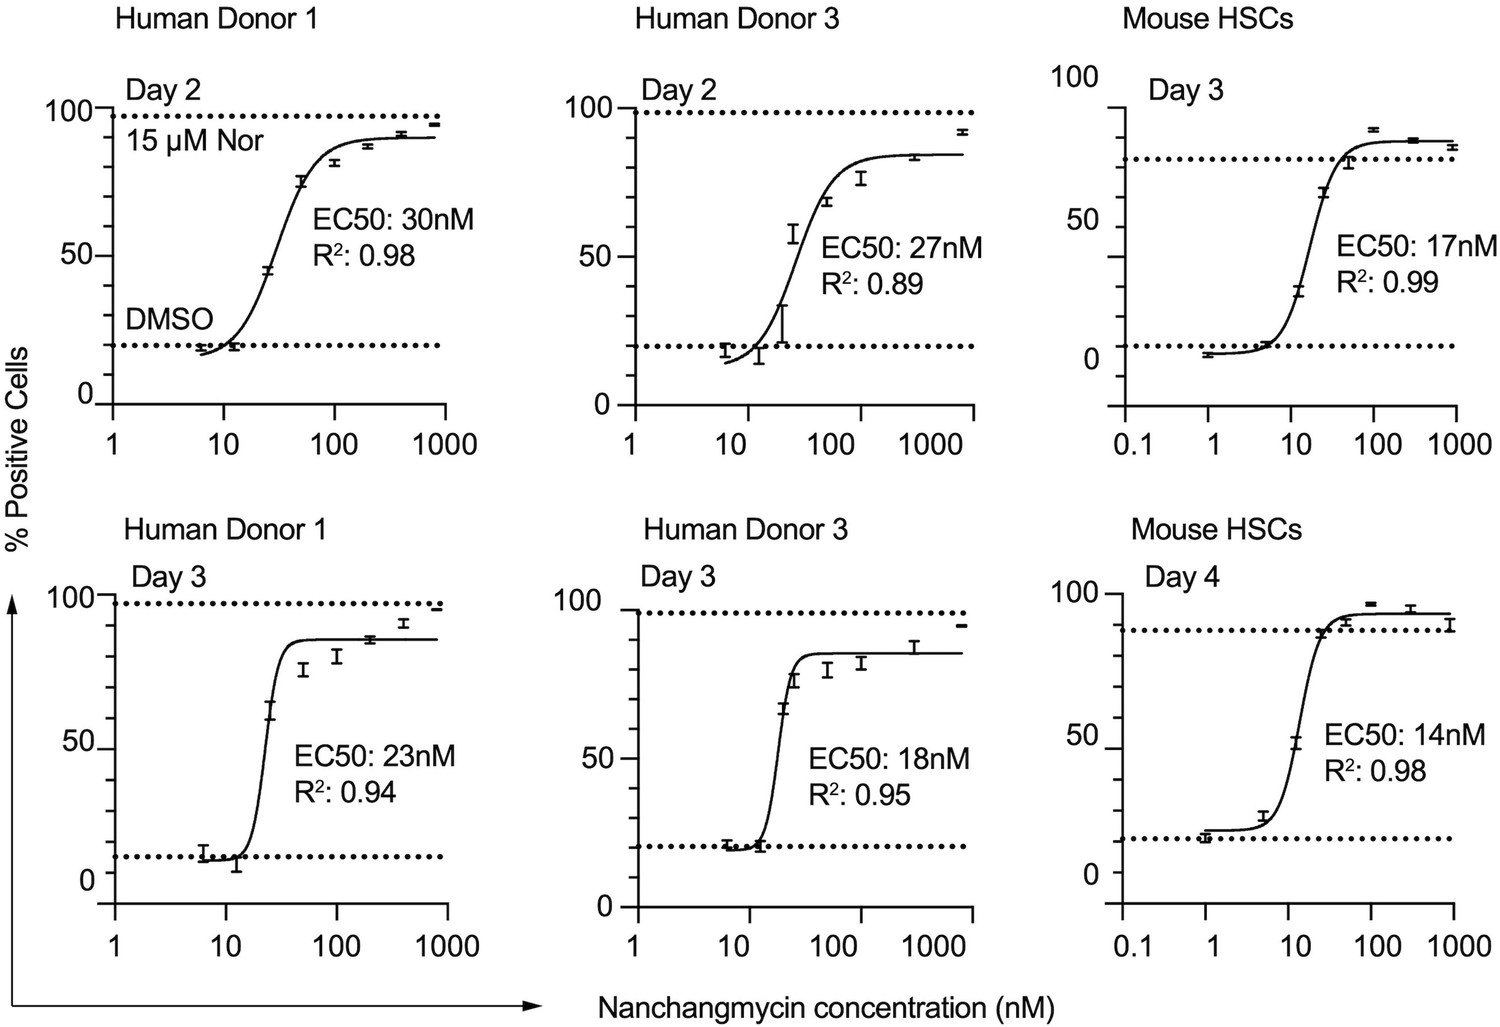
Dose response curves of NCMC treatment at different time points in HSCs.
HSCs isolated from human donor 1 (left two panels), human donor 3 (middle two panels) and mouse (right two panels) were used. Dotted line represents the mean percentage of Bodipy-positive cells in DMSO negative control wells (lower) or nortriptyline positive control wells (upper). Error bars represent mean ± SEM (n=6). EC50 and R2 are shown. At least one experiment was performed independently for each donor line.
Figure 3 with 4 supplements
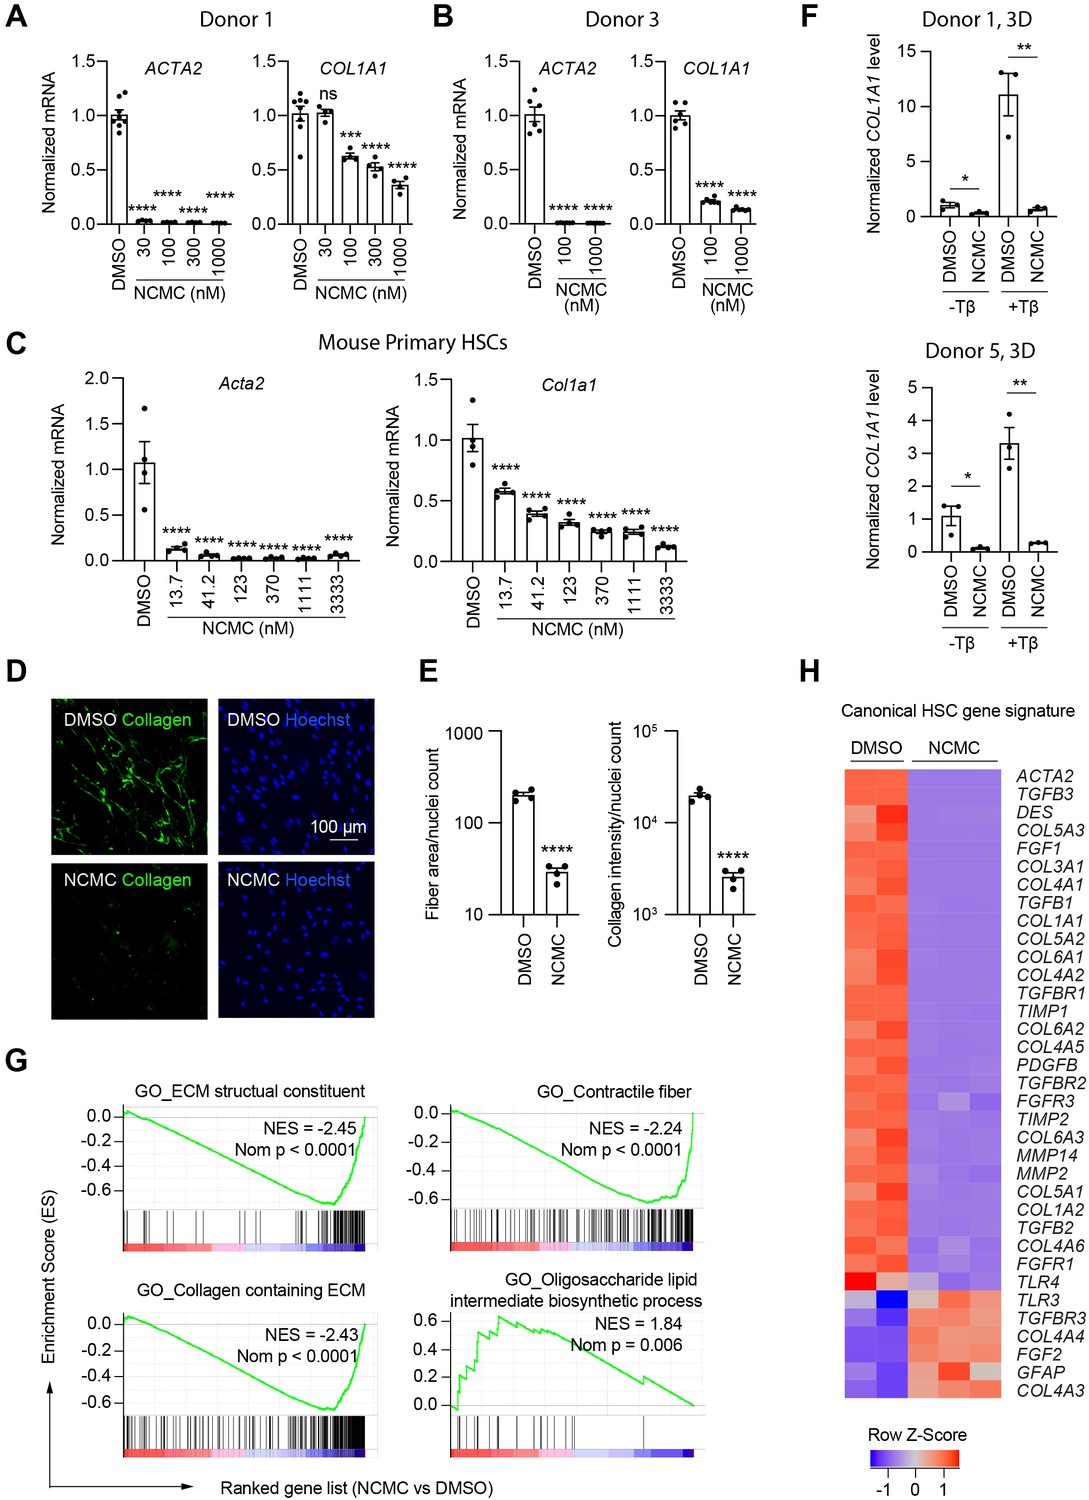
NCMC inhibits expression of fibrotic genes in HSCs.
(A-B) Effect of 48 hr NCMC treatment on ACTA2 and COL1A1 in HSCs from human donors 1 (A) and 3 (B). Error bars represent mean ± SEM (n=3). Data are representative of three independent experiments. ns indicates not significant, *** indicates p<0.001, and **** indicates p<0.0001 (one-way ANOVA test). (C) Effect of 48 hr NCMC treatment on Acta2 and Col1a1 in primary mouse HSCs. Error bars represent mean ± SEM (n=4). Data are representative of three independent experiments. **** indicates p<0.0001 (one-way ANOVA test). (D–E) Effect of 48 hr NCMC treatment (1 µM) on collagen deposition in ECM. (D): representative images. Scale bar represents 100 µm. Collagen protein is indicated in green and nuclei for the same field are indicated in blue. (E): quantified results. Error bars represent mean ± SEM (n=4). Data are representative of three independent experiments. **** indicates p<0.0001 (Student’s t-test). (F) qPCR analysis of COL1A1 in HSC-hepatocyte spheroids treated with NCMC with and without TGF-β (Tβ). Error bars represent mean ± SEM (n=3). One experiment was performed independently for each donor shown. * indicates p<0.05 (Student’s t-test) and ** indicates p<0.01 (Student’s t-test). Analysis was performed on day 3 (3D). (G–H) RNA sequencing analysis of HSCs (donor 1) treated with DMSO or 1 µM NCMC for 48 hr. (G) Representative gene sets from the gene set enrichment analysis (GSEA). NES refers to normalized enrichment score. Nom P refers to Nominal P value. Vertical black lines refer to affected genes in the indicated signatures. Red color indicates positive correlation, and blue color indicates negative correlation. (H): Heatmap showing RNA-seq expression for the canonical HSC gene signature (Zhang et al., 2016). All genes from the signature that are expressed in HSCs (with a minimum of five reads) were shown regardless of their expression patterns. Z-score values are also provided in Supplementary file 8. This figure has three supplements.
Figure 3—figure supplement 1
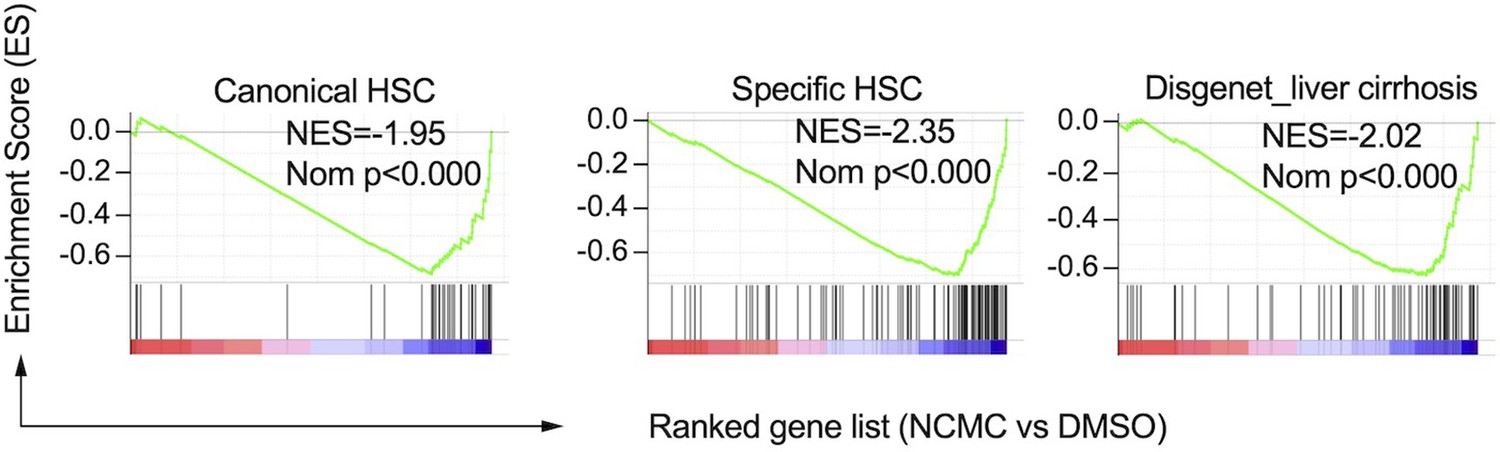
Gene set enrichment analysis results of HSC (Zhang et al., 2016) and cirrhosis (Piñero et al., 2020) gene signatures.
NES refers to Normalized Enrichment Score. Nom P refers to Nominal P value. Vertical black lines refer to the gene hits in the indicated signatures. Red color indicates positively correlated, and blue color indicates negatively correlated.
Figure 3—figure supplement 2
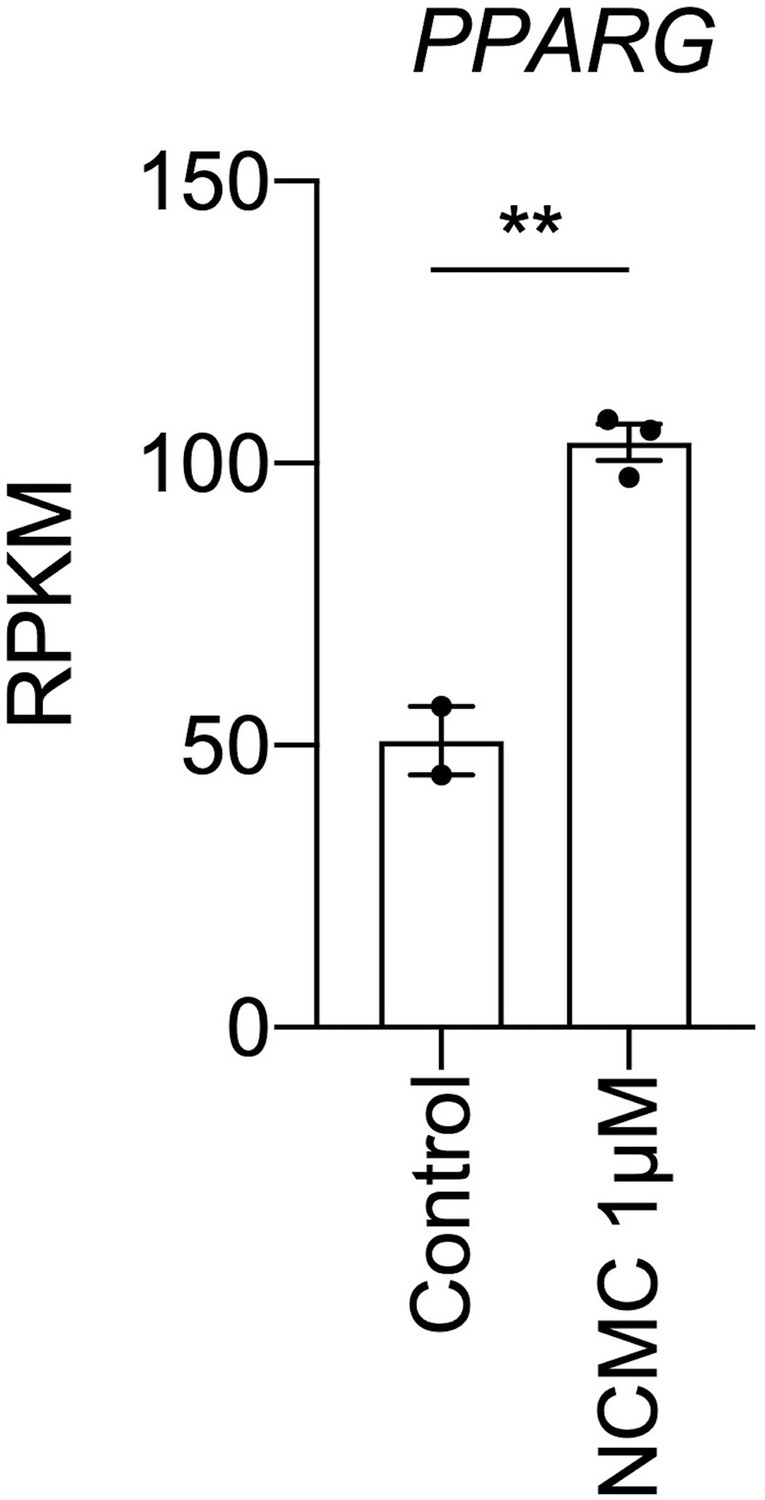
NCMC treatment increases PPARG mRNA level.
RPKM of PPARG in control (DMSO treated) and NCMC treated cells as measured by RNA sequencing was plotted. The full list of significantly differentially expressed genes from the RNA sequencing analysis is provided as Supplementary file 9. ** indicates p<0.01 (Student’s t-test).
Figure 3—figure supplement 3
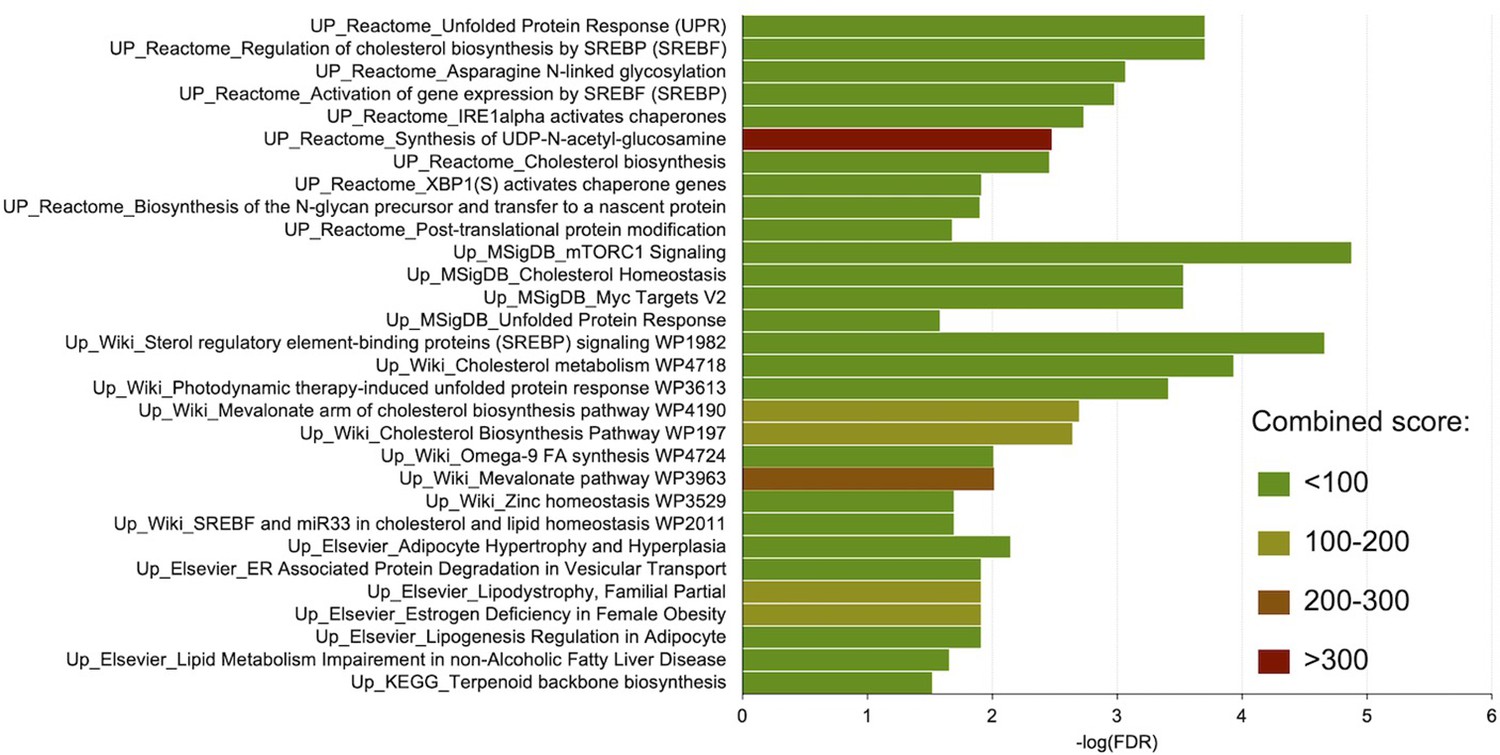
Pathway analyses of genes significantly upregulated in response to NCMC.
The genes whose expressions were significantly (FDR <0.05) up-regulated (>2 fold increase) by NCMC treatment were analyzed for pathway enrichment in five databases, including Reactome 2016, MSigDB Hallmark 2020, WikiPathway 2021 Human, Elsevier Pathway Collection, and KEGG 2021 Human. The color of the bars indicates the range of the pathway’s combined score calculated by the enrichment analysis tool Enrichr (Chen et al., 2013; Kuleshov et al., 2016; Xie et al., 2021).
Figure 3—figure supplement 4
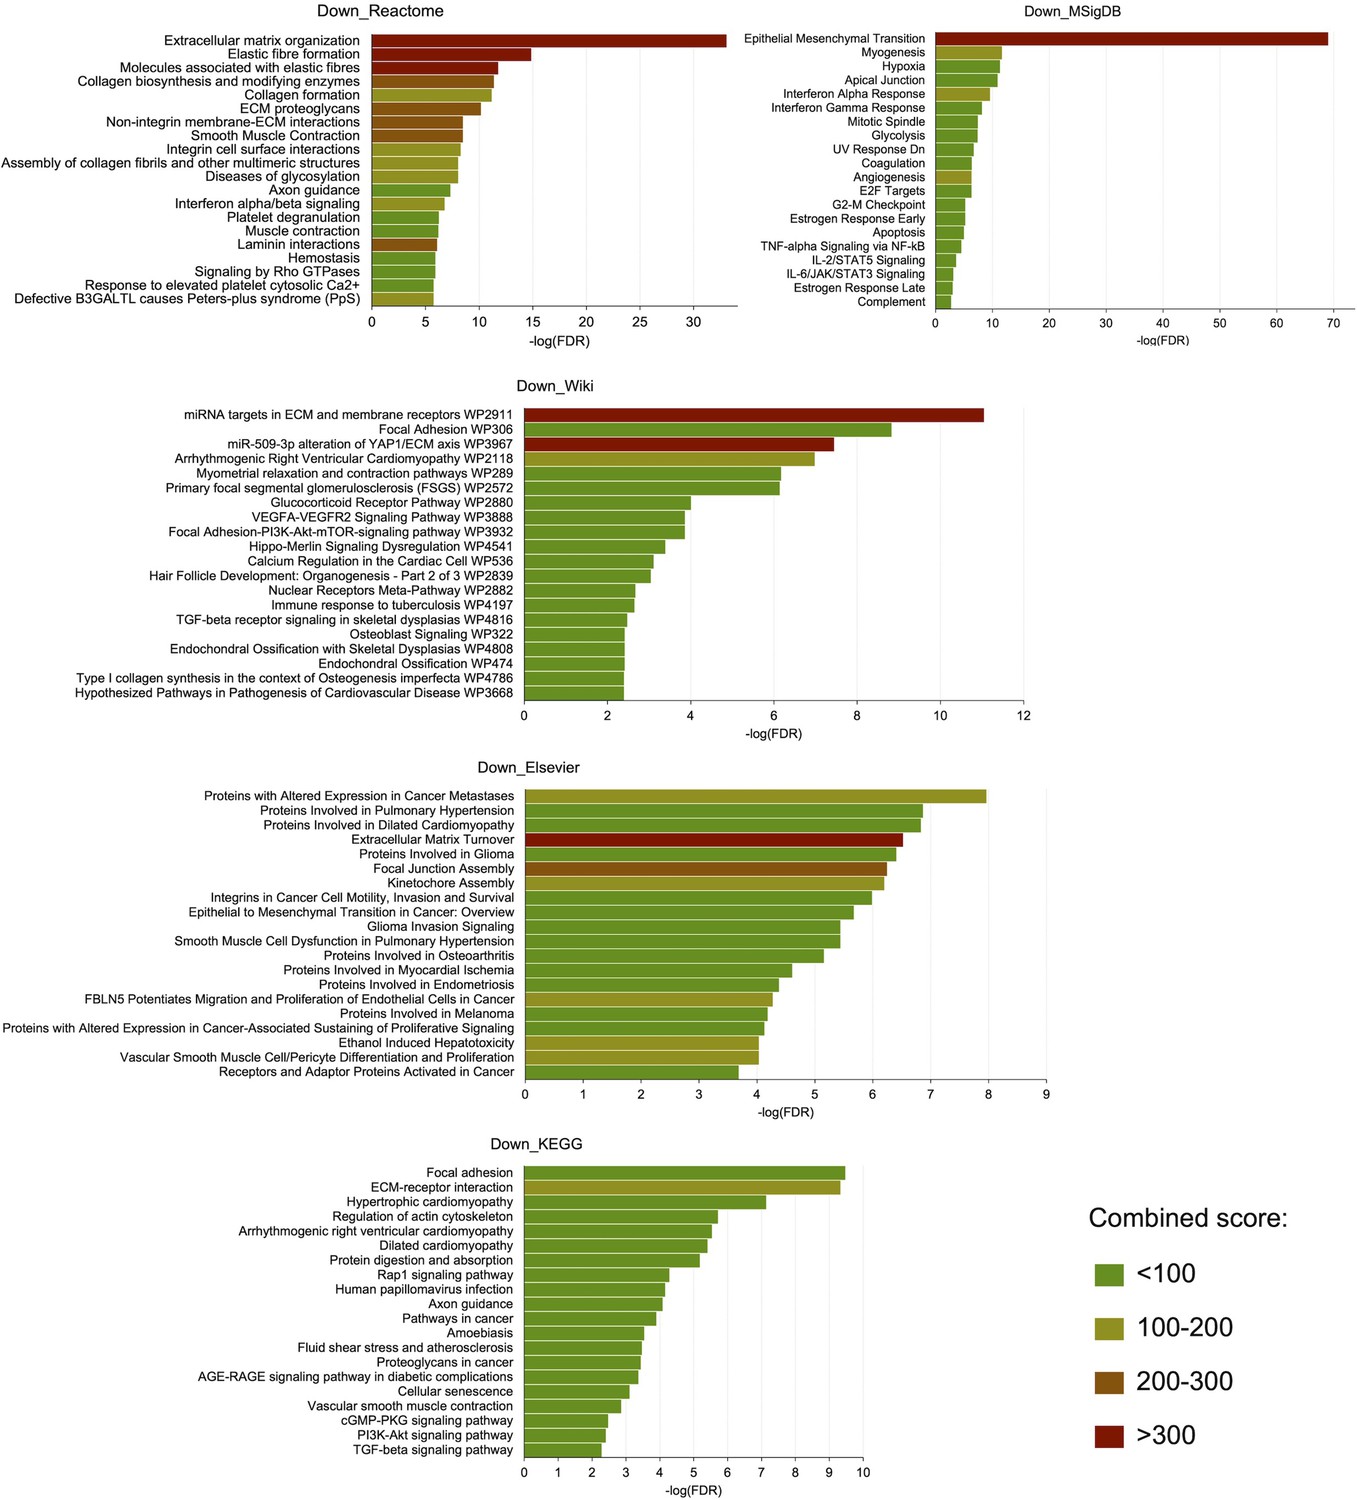
Pathway analyses of genes significantly downregulated in response to NCMC.
The genes whose expressions were significantly (FDR <0.05) down-regulated (>2 fold decrease) by NCMC treatment were analyzed for pathway enrichment in five databases, including Reactome 2016, MSigDB Hallmark 2020, WikiPathway 2021 Human, Elsevier Pathway Collection, and KEGG 2021 Human. The color of the bars indicates the range of the pathway’s combined score calculated by the enrichment analysis tool Enrichr (Chen et al., 2013; Kuleshov et al., 2016; Xie et al., 2021).
Figure 4 with 2 supplements
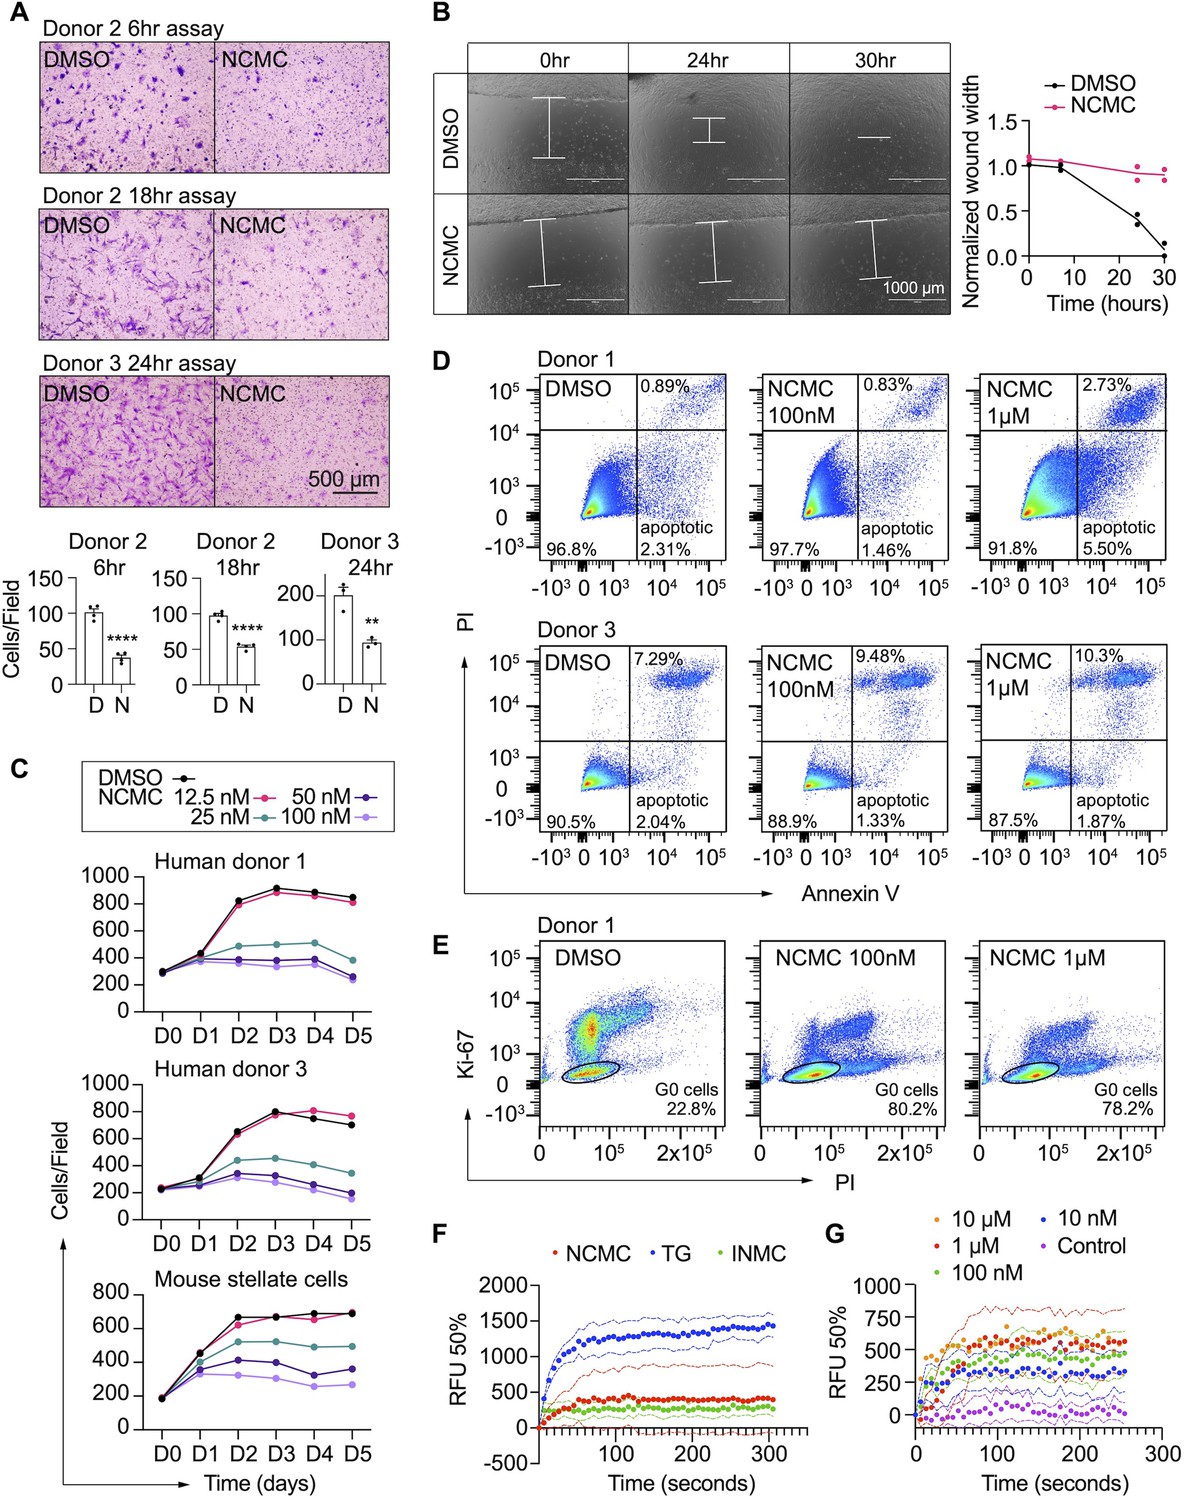
NCMC inhibits HSC migration and proliferation and increases cytosolic calcium concentration.
(A) Transwell migration assay results of HSCs treated with DMSO or 1 µM NCMC for 48 hr. Top: representative images. Scale bar represents 500 µm. Bottom: quantification of migrated cells (n=3 for each experiment). ** indicates p<0.01, and **** indicates p<0.0001 (Student’s t-test). (B) Wound healing assay results of HSCs treated with DMSO or NCMC. HSCs were seeded in complete medium, and immediately after generating the wound field, DMSO and 1 µM NCMC were added. The closure of the wound field was monitored for up to 30 hr as indicated. Left: representative images. White bars highlight the width of the wound field. Scale bar represents 1000 µm. Right: quantification of wound width. (n=2). Data are representative of three independent experiments. (C) Cell count for HSCs treated with DMSO or NCMC over the indicated time in days. Top: human HSCs from donor 1. Middle: human HSCs from donor 3. Bottom: mouse HSCs. Error bars represent mean ± SEM (n=6) but are too small to be visualized. One experiment was performed independently for each HSC line shown. (D) Flow cytometry analysis of Annexin V and propidium iodide (PI) stained HSCs from human donor 1 (top) and 3 (bottom) treated with DMSO or NCMC for 48 hr. Plots are representative of two independent experiments. (E) Flow cytometry analysis of Ki-67 and PI stained HSCs from human donor 1 treated with DMSO or NCMC for 24 hr. Plots are representative of two independent experiments. (F) Measurement of cytosolic calcium level using fluo-4 NW. HSCs from donor 3 were pre-loaded with fluo-4 NW and fluorescent intensity was read immediately after adding compounds (NCMC: nanchangmycin [red], TG: thapsigargin [blue], INMC: ionomycin [green]). The plot demonstrates results from three independent experiments. Solid dots represent mean, and dotted lines represent SEM (n=3). RFU: Relative fluorescence unit. (G) Measurement of cytosolic calcium level after adding NCMC at indicated concentrations in HSCs from donor 3 (magenta: control (no compound, no DMSO), blue: 10 nM, green: 100 nM, red 1 µM, orange: 10 µM). The plot demonstrates results from one experiment for 10 µM and five independent experiments for the other concentrations. Solid dots represent mean, and dotted lines represent SEM (n=3). This figure has two supplements.
Figure 4—figure supplement 1
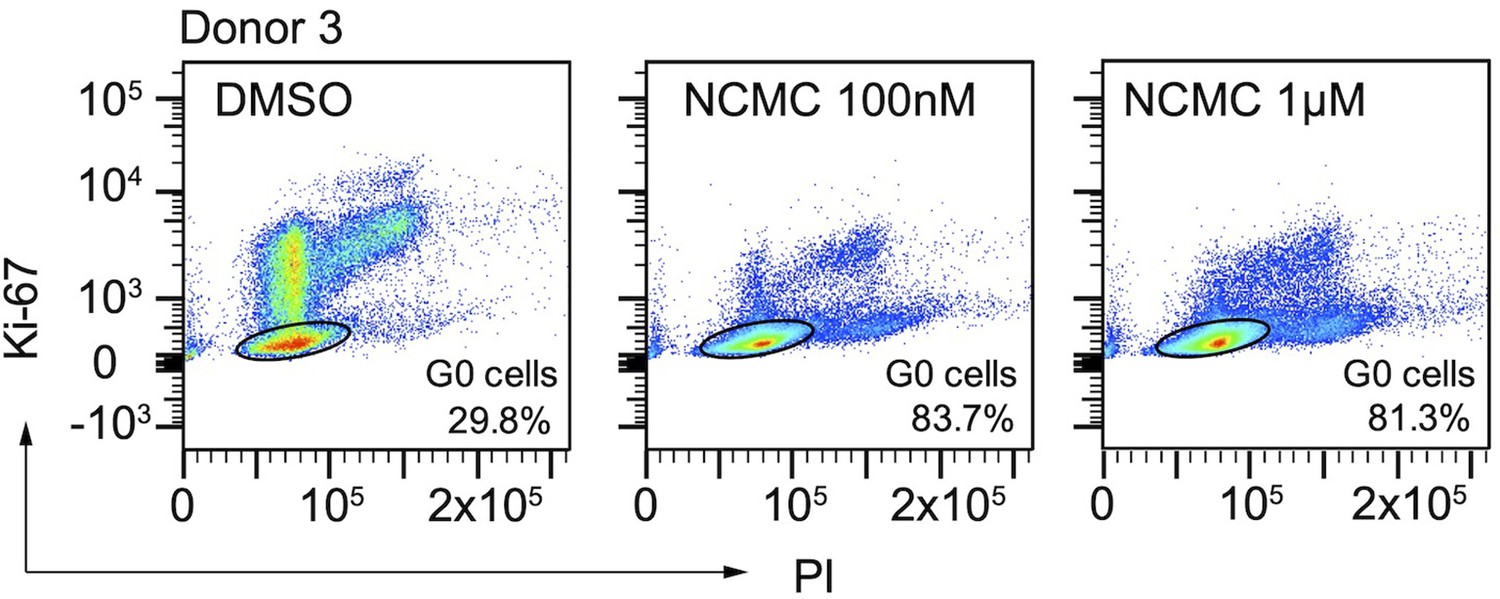
Flow cytometry analysis of Ki-67 and PI stained HSCs.
HSCs from human donor 3 were treated with DMSO or nanchangmycin (NCMC) for 24 hr prior to flow cytometry analysis with Ki-67 and PI. Plots are representative of two independent experiments.
Figure 4—figure supplement 2
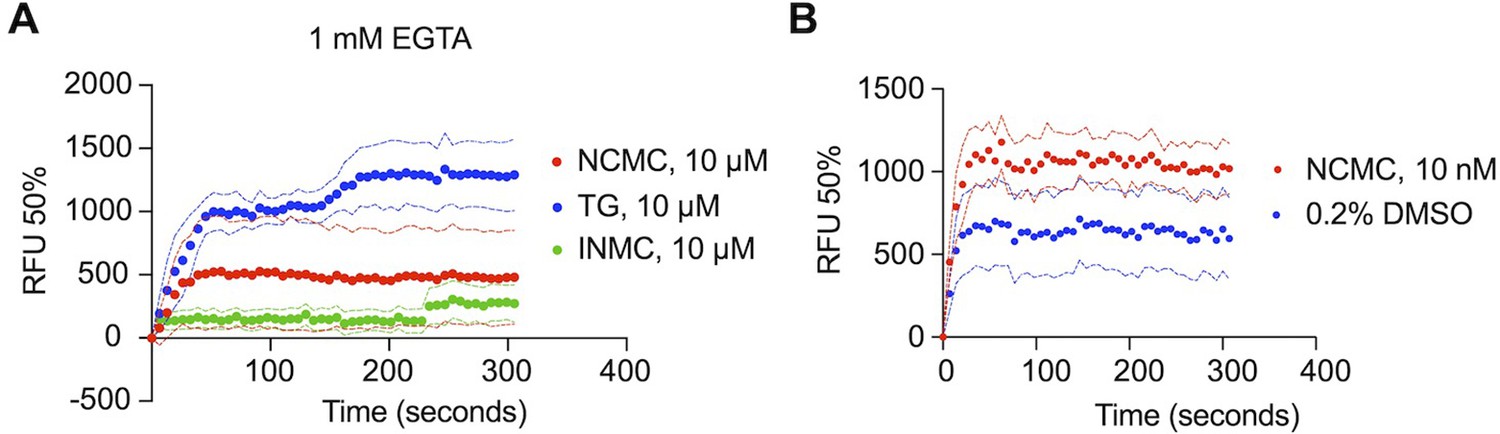
Measurement of cytosolic calcium level using fluo-4 NW.
(A) HSCs from donor 3 were pre-loaded with fluo-4 NW and fluorescent intensity was read immediately after adding compounds in the presence of 1 mM EGTA (NCMC: nanchangmycin [red], TG: thapsigargin [blue], INMC: ionomycin [green]). The plot demonstrates results from three independent experiments. Solid dots represent mean, and dotted lines represent SEM (n=3). RFU: Relative fluorescence unit. (B) HSCs from donor 3 were pre-loaded with fluo-4 NW and fluorescent intensity was read immediately after adding 0.2% DMSO or 10 nM NCMC dissolved in DMSO (without EGTA). The plot demonstrates results from three independent experiments. Solid dots represent mean, and dotted lines represent SEM (n=8 for DMSO, n=4 for NCMC). DMSO at 0.2% was selected as a negative control, as this was the highest concentration of DMSO to which HSCs were exposed, as a solvent. NCMC, TG, and INMC were all dissolved in DMSO.
Figure 5 with 1 supplement

Multiple kinases mediate the effect of NCMC on COL1A1 expression.
(A) Kinase array analysis of HSCs treated with DMSO or 1 µM NCMC for 1 or 18 hr. Blue bars indicate mean fold change (n=2) in phosphorylation at specified sites in NCMC-treated cells compared to DMSO-treated cells at 1 hr (light blue) or 18 hr (dark blue). Red triangles indicate the mean RPKM of each corresponding kinase mRNA based on RNA sequencing of HSCs (Chen et al., 2017). The three dotted lines represent 20% increase/decrease or no change in phosphorylation. Kinases highlighted in red were chosen for further investigation. (B) The expression of each candidate kinase gene was depleted using pooled siRNAs, and after 72 hr, COL1A1 level was determined by qRT-PCR in HSCs isolated from human donor 1 (top), 3 (middle), or 4 (bottom). A non-targeting siRNA is used as a control (NTC). Error bars represent mean ± SEM (n≥4, as indicated by the number of dots). ns indicates not significant (p>0.05), * indicates p<0.05, ** indicates p<0.01, *** indicates p<0.001, and **** indicates p<0.0001 (one-way ANOVA test). (C) Knockdown efficiency of each siRNA pool in HSCs from human donor 1. Error bars represent mean ± SEM (n≥4). ns indicates not significant (p>0.05), * indicates p<0.05, ** indicates p<0.01, *** indicates p<0.001, and **** indicates p<0.0001 (Student’s t-test performed for FYN, HSPB1, and PTK2 depletion, and one-way ANOVA test performed for MAPK1, MAPK3, STAT5A, and STAT5B depletion). One experiment was performed independently for each HSC line shown. This figure has one supplement.
Figure 5—figure supplement 1
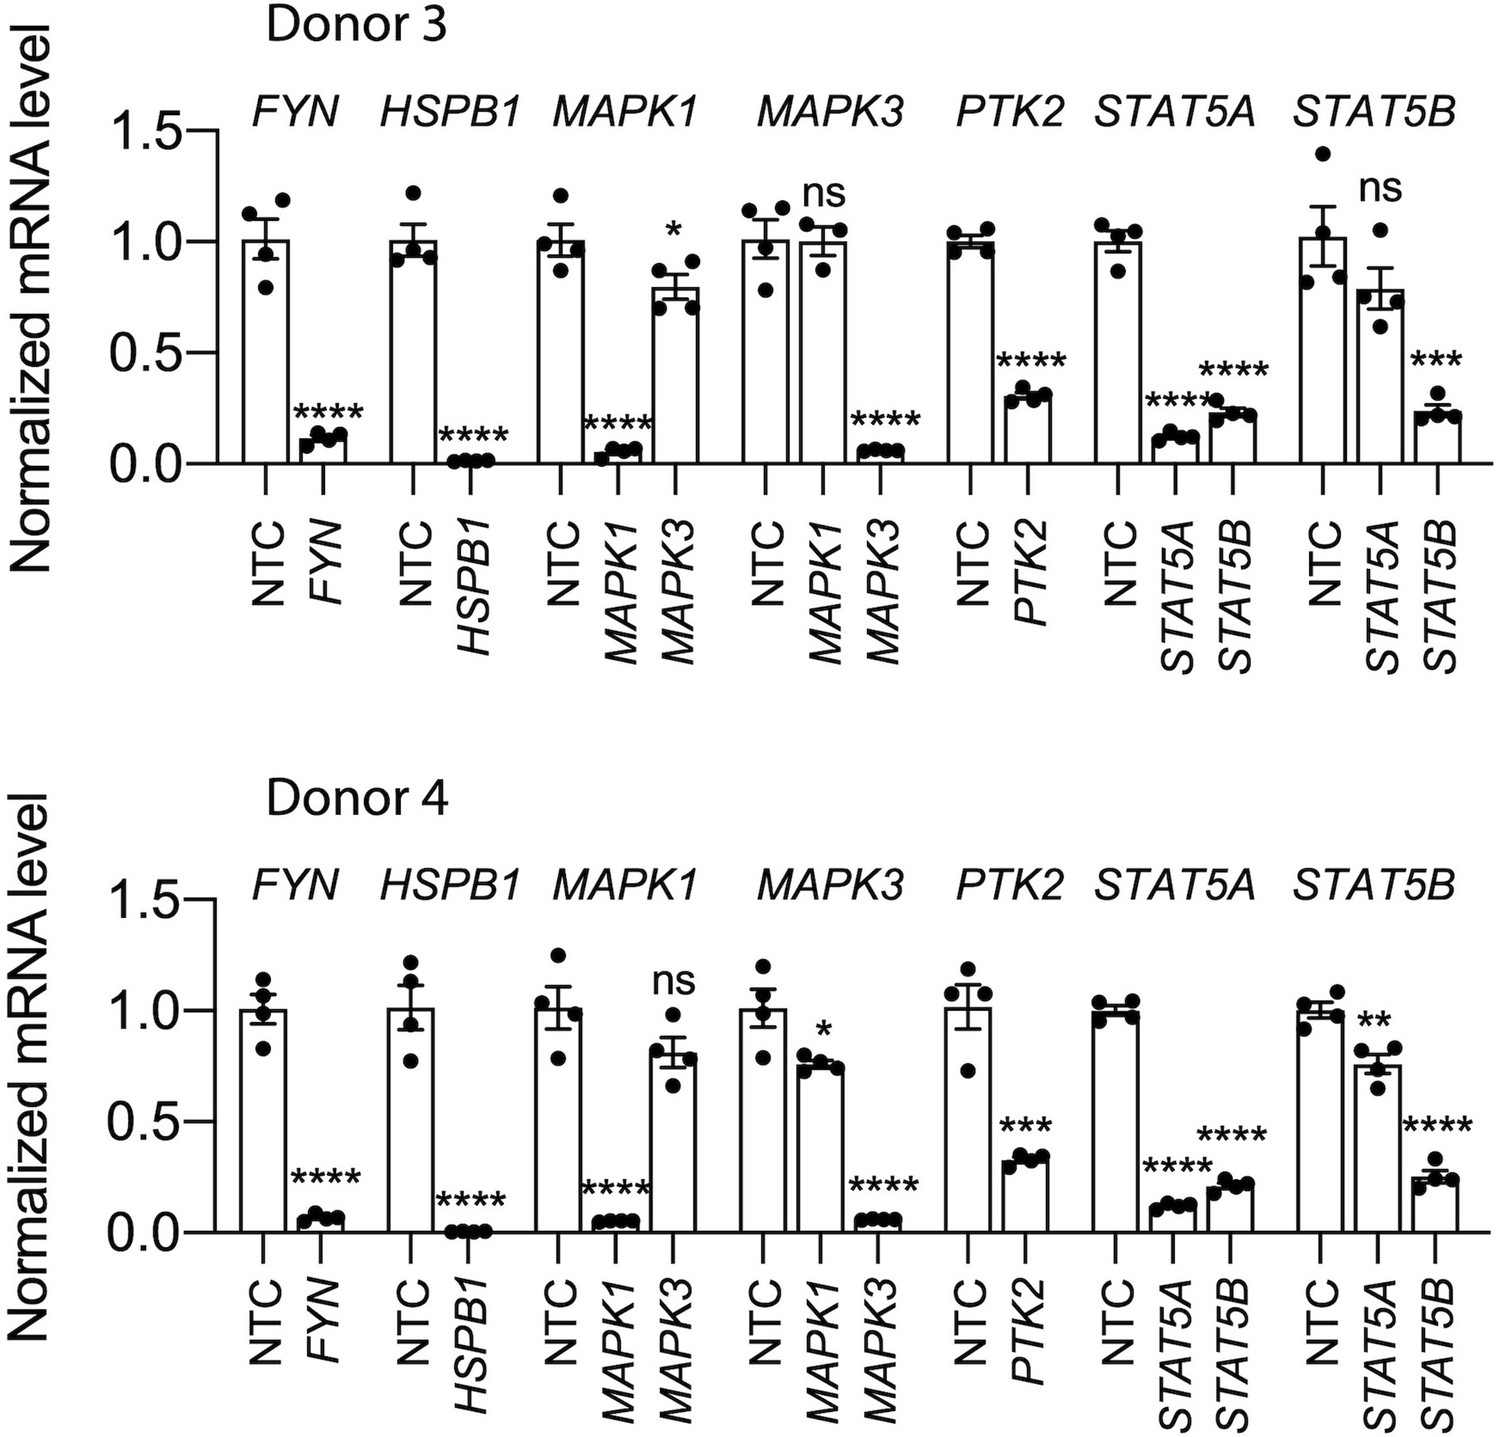
Knockdown efficiency of each siRNA pool in HSCs from human donor #3 (top) and donor #4 (bottom) compared to a non-targeting siRNA control (NTC).
Error bars represent mean ± SEM (n=4). One experiment was performed independently for each donor shown. ns indicates not significant (p>0.05), * indicates p<0.05, ** indicates p<0.01, *** indicates p<0.001, and **** indicates p<0.0001 (one-way ANOVA test).
Figure 6 with 4 supplements
FYN/MAPK pathway regulates collagen expression.
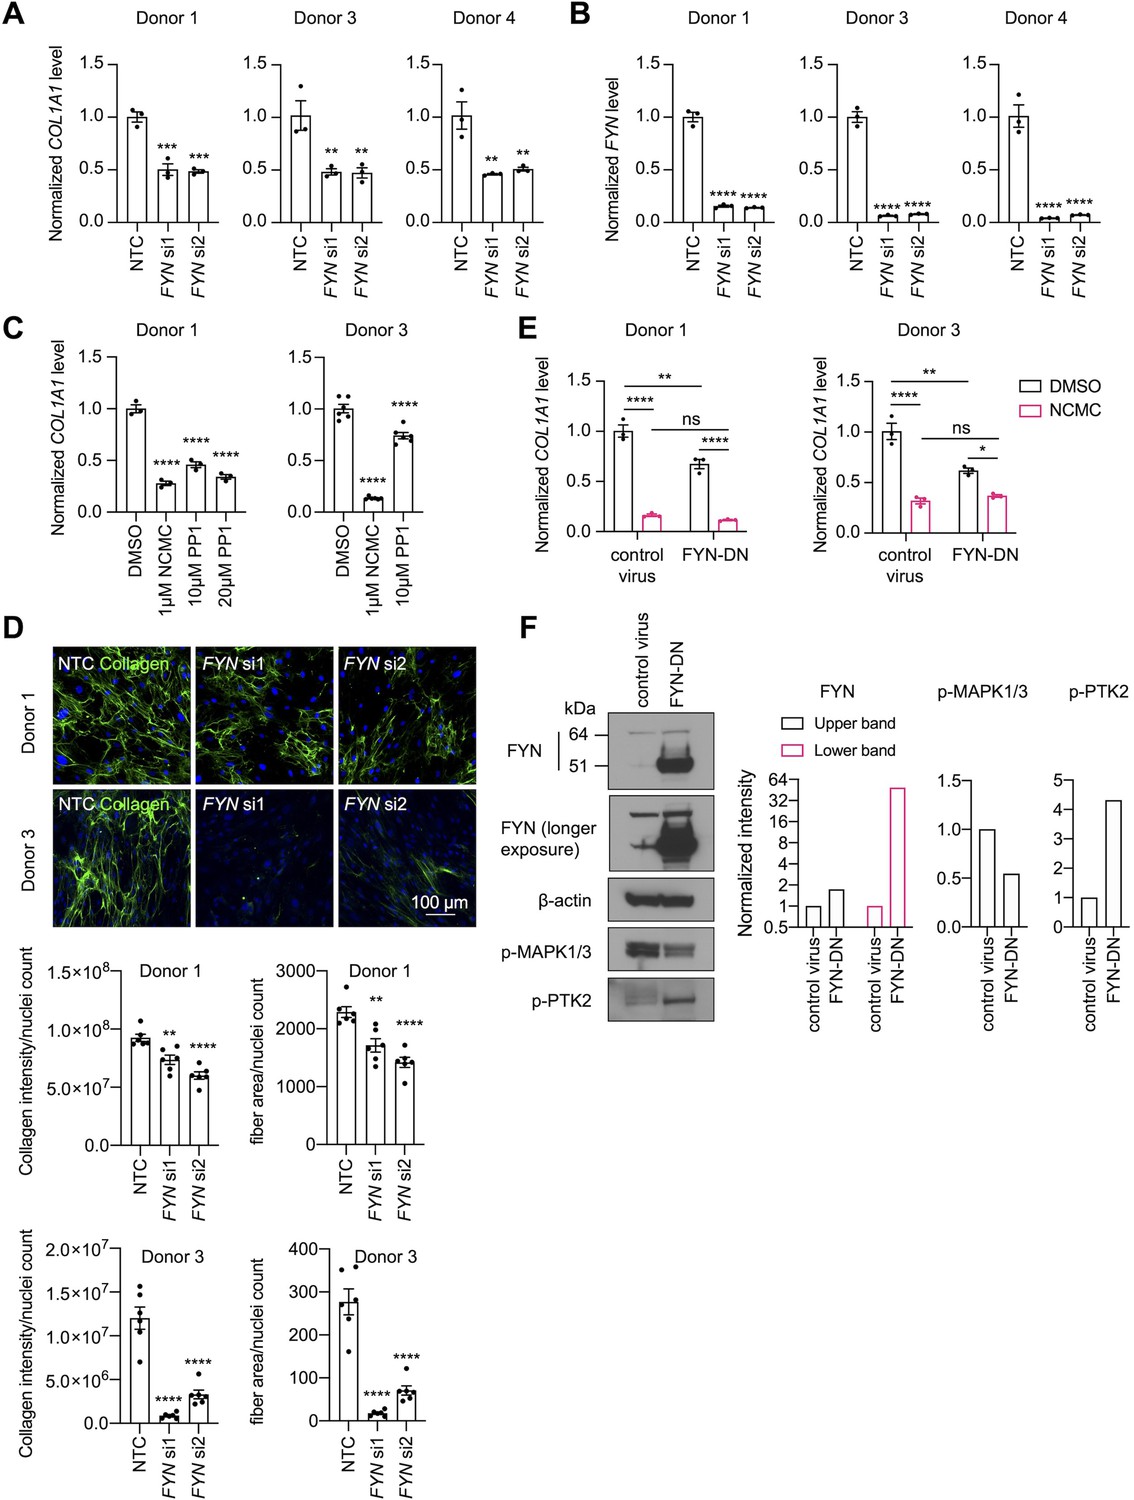
(A-B) FYN was depleted in HSCs with two siRNAs (si1 and si2). The expression levels of COL1A1 (A) and FYN (B) were analyzed by qPCR after 72 hr in comparison to a non-targeting control siRNA (NTC). Error bars represent mean ± SEM (n=3). At least one experiment was performed independently for each of three donor lines. ** indicates p<0.01, *** indicates p<0.001, and **** indicates p<0.0001 (one-way ANOVA test). (C) HSCs were treated with NCMC or 1-Naphthyl PP1 (PP1) for 48 hr. COL1A1 level was analyzed by qPCR. Error bars represent mean ± SEM (n=3 for donor 1, and n=6 for donor 3). Data are representative of three independent experiments for donor 1 and experiment for donor 3. **** indicates p<0.0001 (one-way ANOVA test). (D) Effect of FYN-depletion on collagen deposition in ECM. Top: representative images. Scale bar represents 100 µm. Bottom: quantified results. Error bars represent mean ± SEM (n=6). Data are representative of two independent experiments. ** indicates p<0.01, and **** indicates p<0.0001 (one-way ANOVA test). (E) HSCs transduced with control virus or virus containing the cDNA encoding dominant negative mutant FYN (FYN-DN) were treated with DMSO or 100 nM NCMC for 48 hr. Expression of COL1A1 was quantified by qPCR. Error bars represent mean ± SEM (n=3). Data are representative of three independent experiments. ns indicates not significant (p>0.05), * indicates p<0.05, ** indicates p<0.01, and **** indicates p<0.0001 (two-way ANOVA test). (F) Phospho-MAPK and phospho-PTK2 levels were determined by western blot in control HSCs and HSCs overexpressing DN-FYN. Left: representative Western blot results. Right: quantified results. Representative of two independent experiments. This figure has four supplements.
Figure 6—figure supplement 1
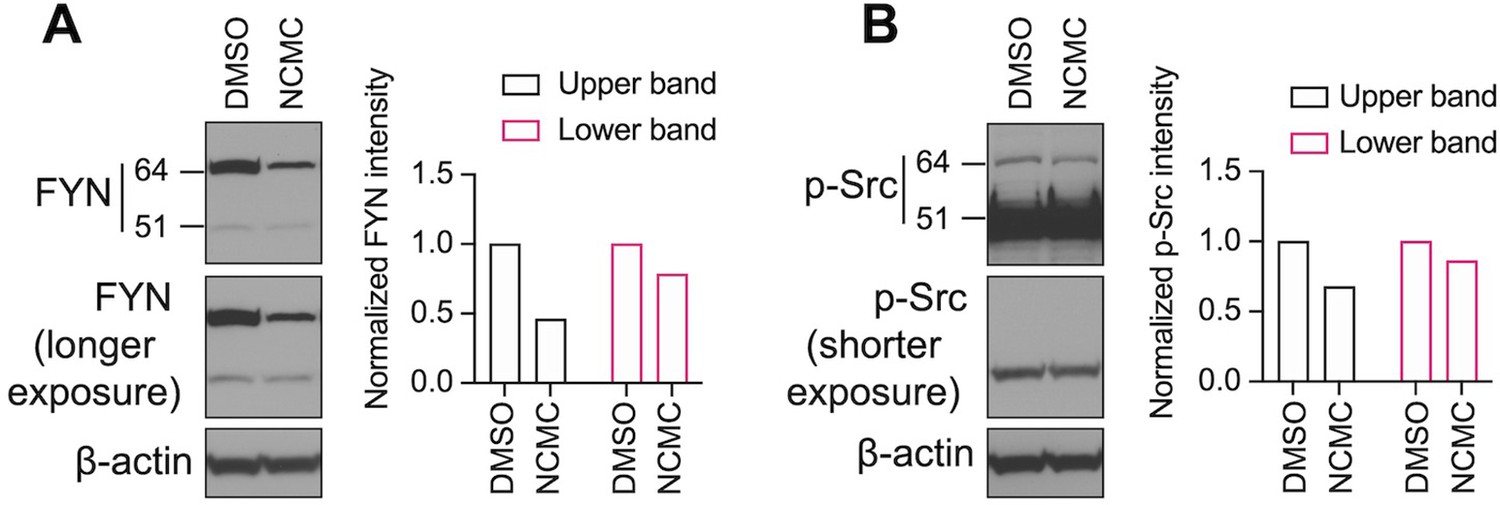
Western blot of HSCs treated with 1 µM NCMC for 18 hr.
The same samples were loaded for A and B on the same gel. The membrane was cut and incubated with FYN and p-Src family antibodies separately. Bands were detected for FYN at 64 kiloDaltons (kD) (Upper band) and 51 kD (Lower band). Two different exposure times are shown for FYN in (A) and p-Src (B) to evaluate both bands. β-actin is used as a loading control. (Data are representative of three independent experiments).
Figure 6—figure supplement 2
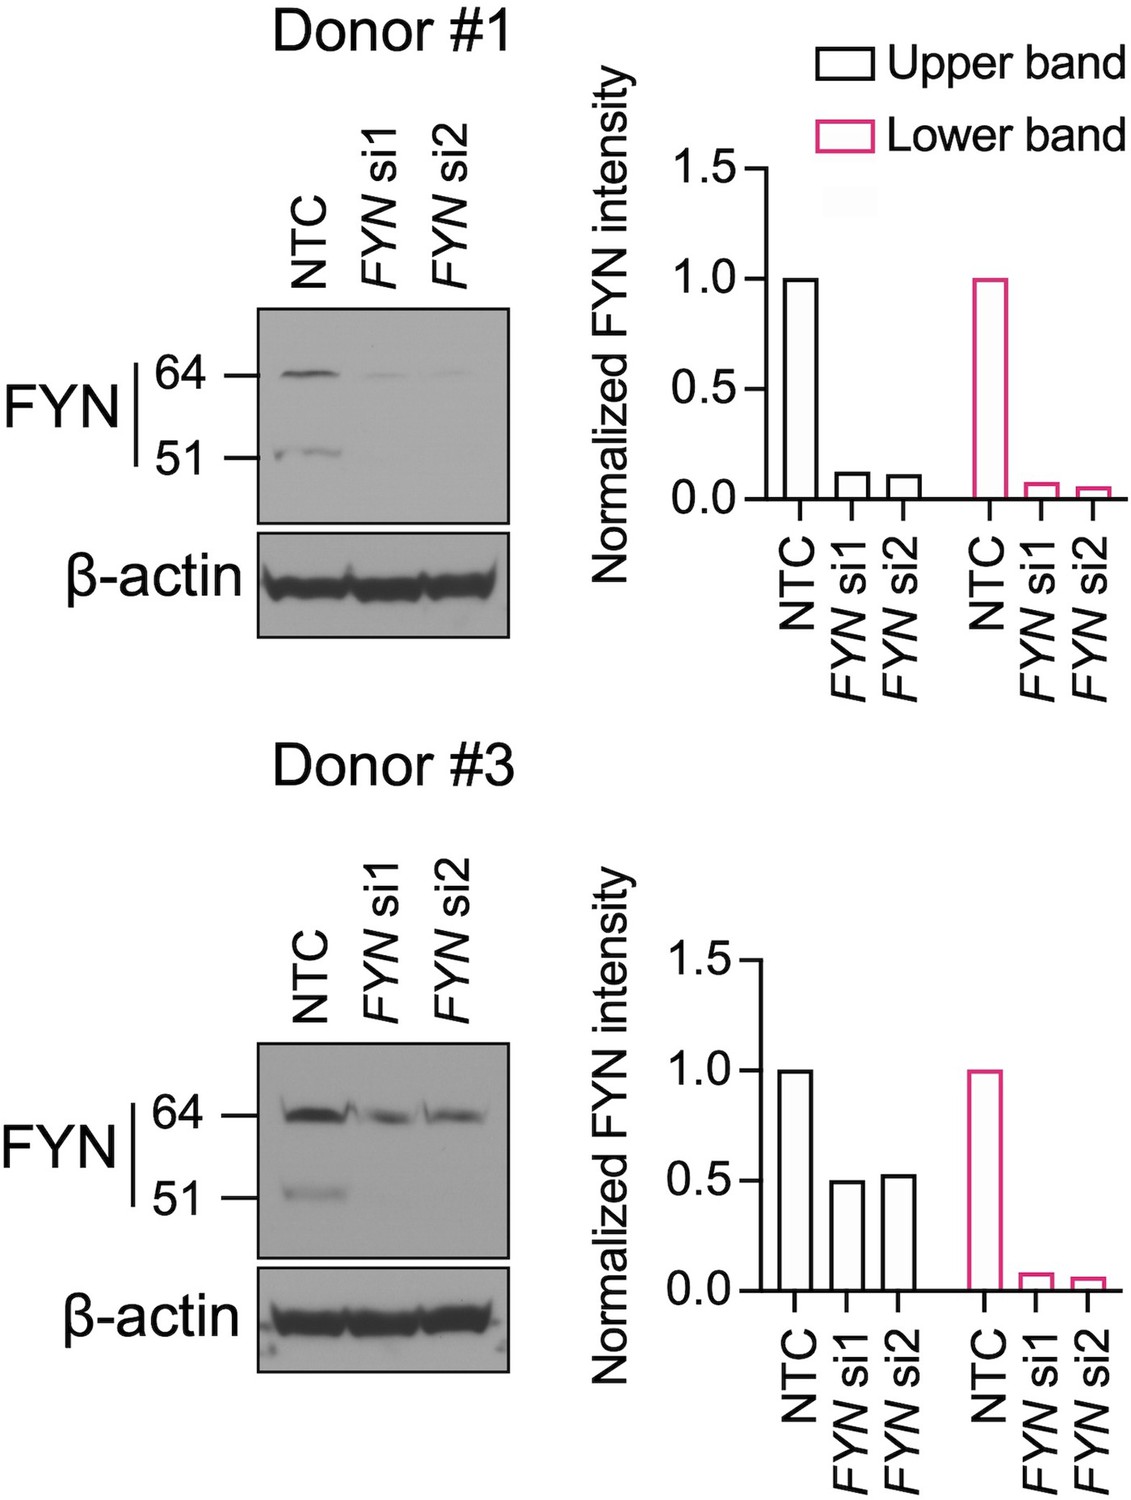
Western blot for FYN.
HSCs were transfected with siRNAs targeting FYN (si1 and si2) and a non-targeting siRNA control (NTC). Western blot was performed on day 3 (representative of two independent experiments).
Figure 6—figure supplement 3
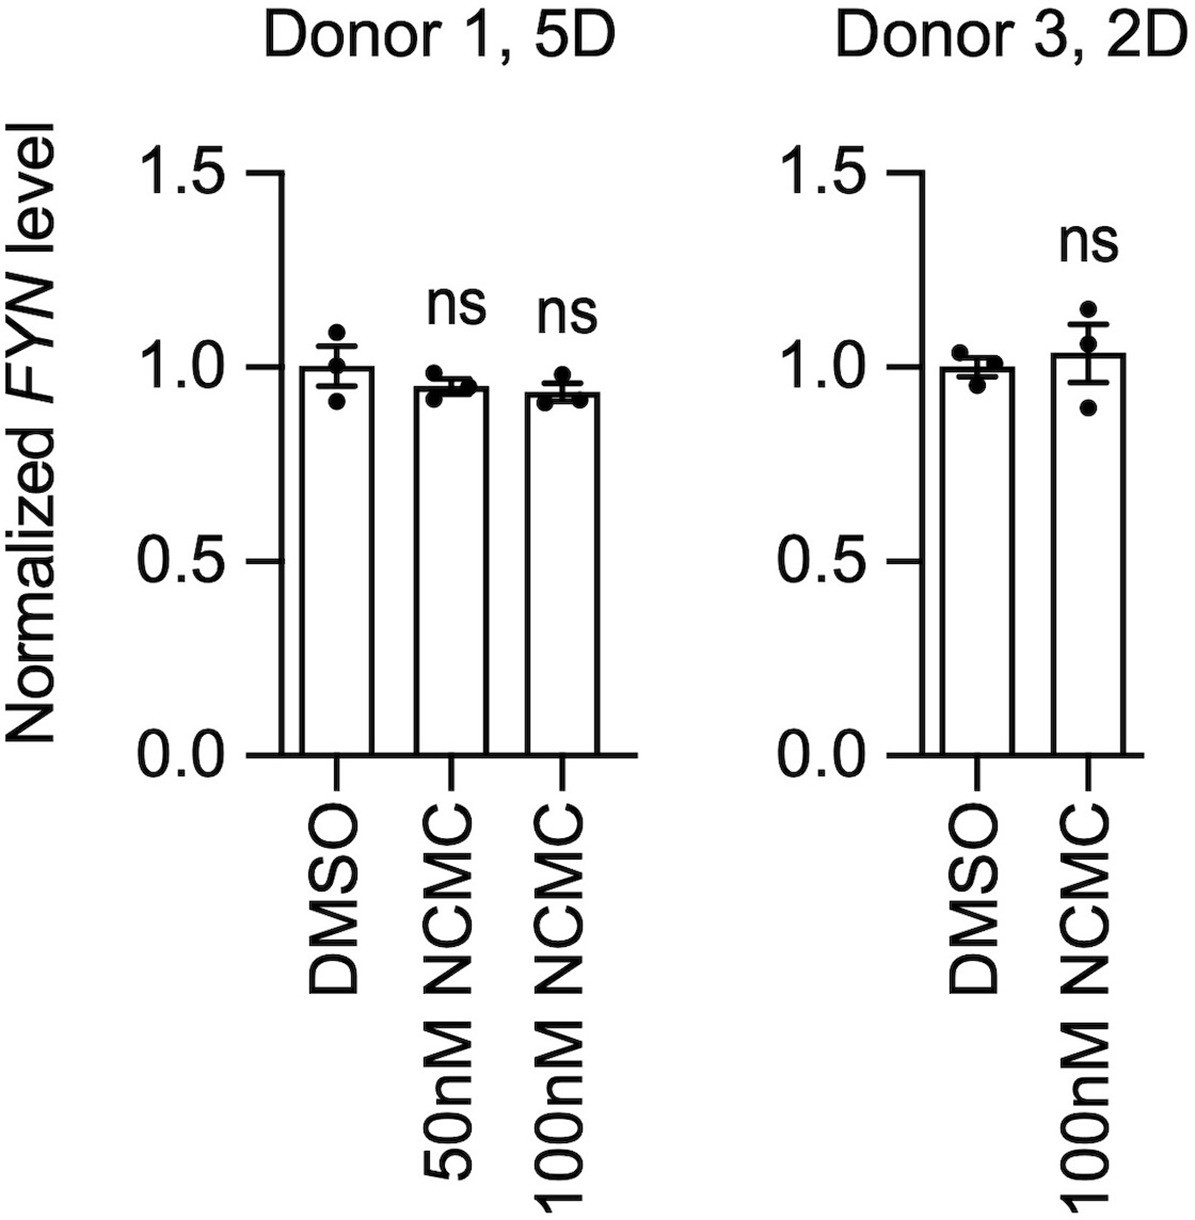
FYN mRNA level was not affected by NCMC treatment.
HSCs were treated with NCMC for indicated number of days (D). FYN level was analyzed by qPCR. Error bars represent mean ± SEM (n=3). Data are representative of two independent experiments. ns indicates not significant (p>0.05) by one-way ANOVA for donor 1 and Student’s t-test for donor 3. Data are representative of two independent experiments for each of the two donor lines.
Figure 6—figure supplement 4
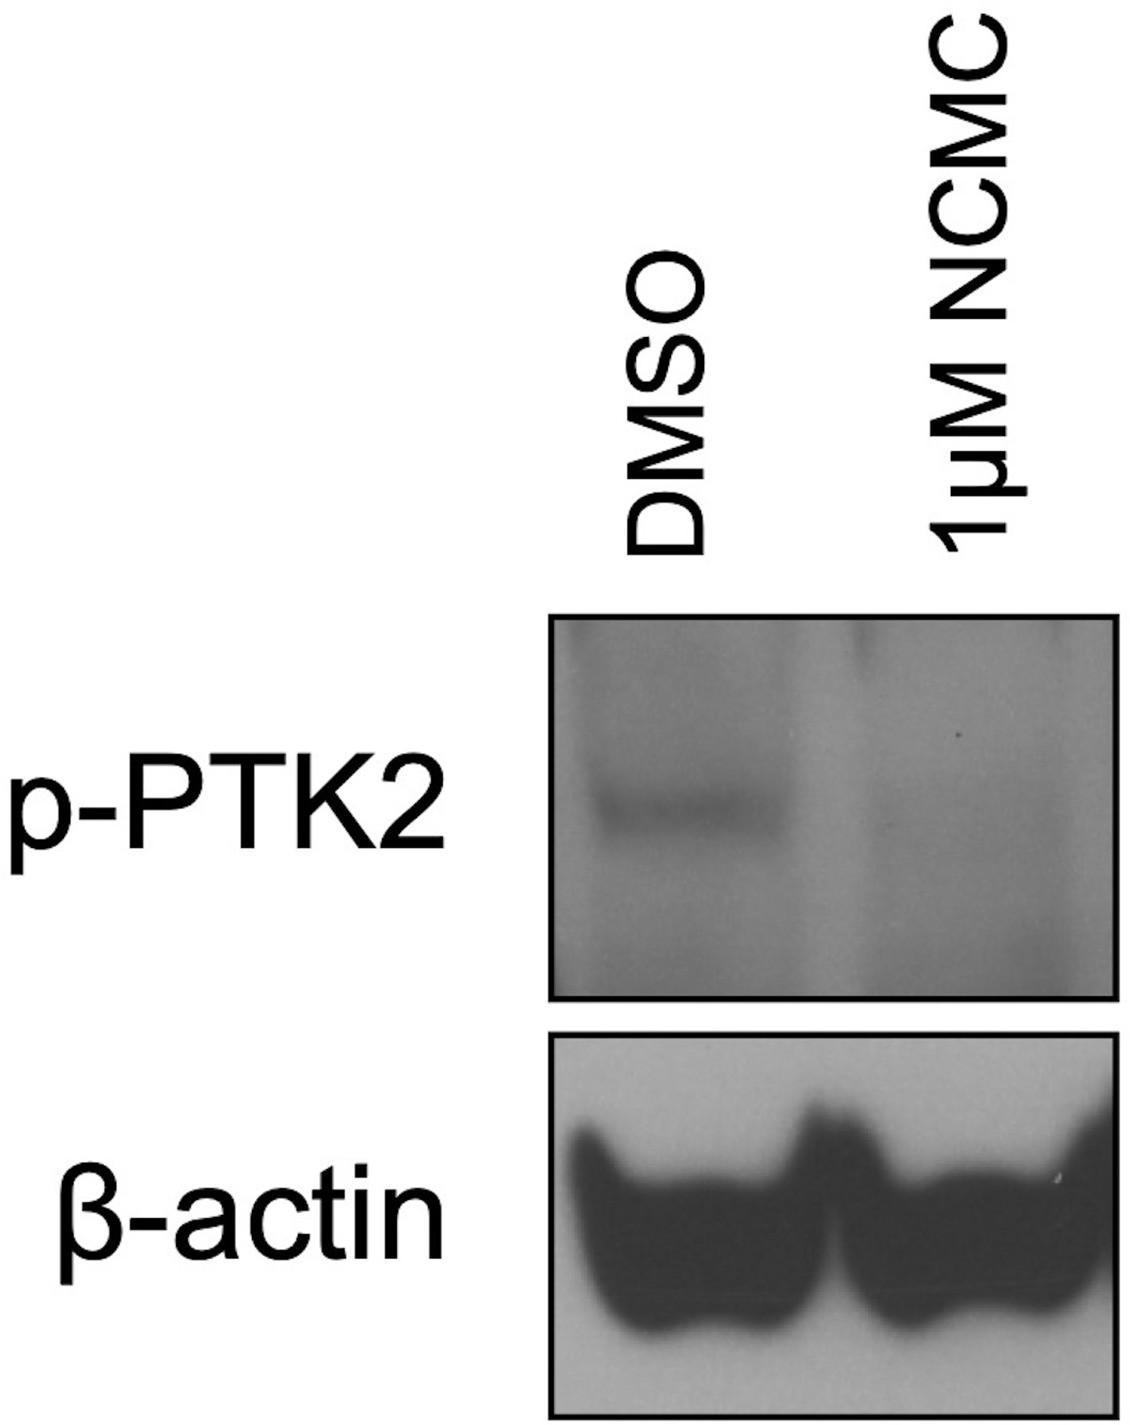
NCMC decreases PTK2 phosphorylation.
Western blot of HSCs treated with DMSO control or 1 µM NCMC for 18 hr. β-actin is used as a loading control (representative of three independent experiments).
Figure 7
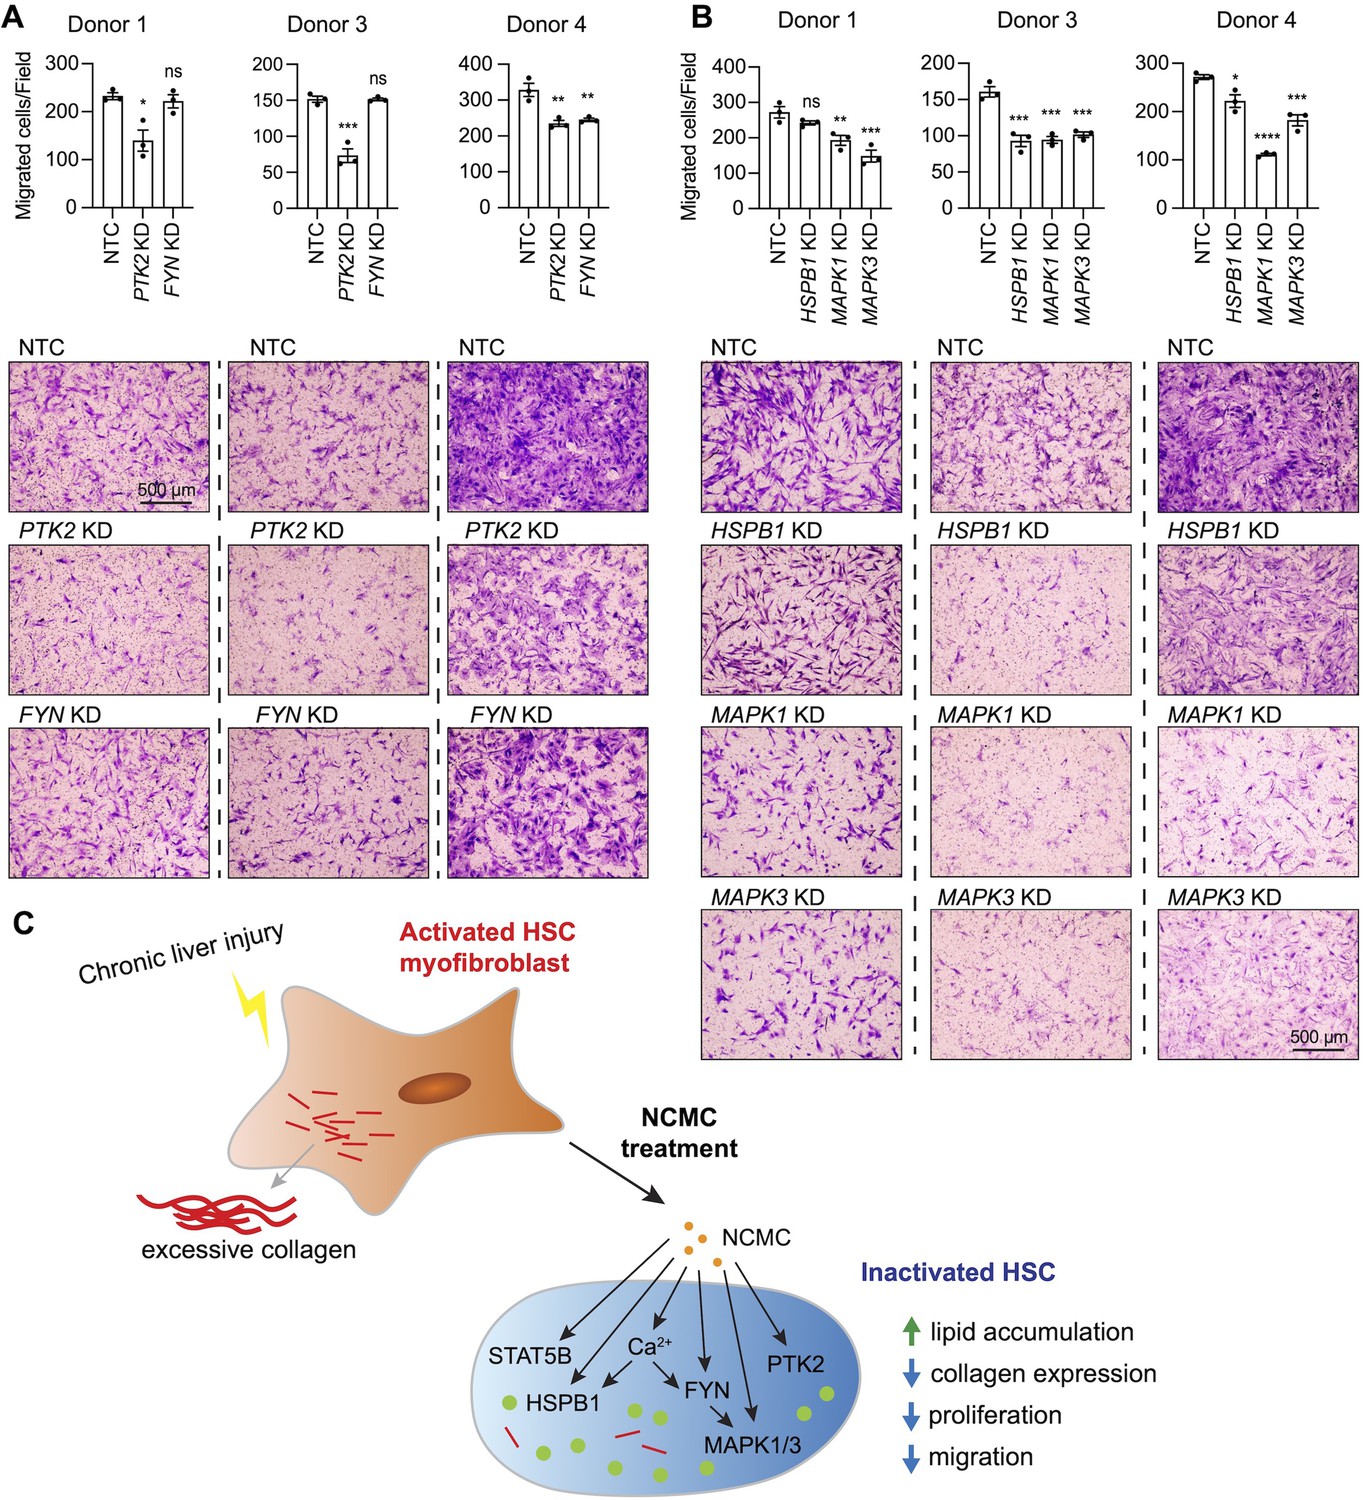
MAPK and PTK2 regulate HSC migration.
(A-B) Kinases were depleted in HSCs with pooled siRNAs. NTC indicates non-targeting siRNA control. KD indicates the gene transcript that is knocked down. After 72 hr, cells were seeded for transwell migration assay. Migration was assayed at 24 hr for HSCs from donor 1 and 4, and 6 hr for HSCs from donor 3. Top: quantified results. Error bars represent mean ± SEM (n=3). Results are shown for three donor lines. ns indicates not significant (p>0.05), * indicates p<0.05, ** indicates p<0.01, *** indicates p<0.001, and **** indicates p<0.0001 (one-way ANOVA test). Bottom: representative images. Scale bar represents 500 µm. At least one experiment was performed independently for each of three donor lines. (C) Schematic summarizing the signaling pathways triggered by NCMC treatment and the effect on HSC activity. Red lines represent collagen, orange spots represent NCMC, and green spots represent lipid droplets. This figure has one supplement.
Tables
Table 1
Candidates from small molecule screening.
| Compound Name | DRC Score | Known function |
|---|---|---|
| Cyproheptadine * | 1.0 | Serotonin antagonist and antihistamine |
| Emetine * | 1.0 | Anti-protozoal, inhibitor of Zika and Ebola viruses |
| Homoharringtonine * | 1.0 | Translation elongation inhibitor |
| Nanchangmycin * | 1.0 | Polyether ionophore antibiotic, inhibitor of Zika virus |
| Ouabain * | 1.3 | Na/K-ATPase inhibitor |
| Digitoxigenin * | 1.7 | Na/K-ATPase inhibitor |
| Digoxin * | 1.7 | Na/K-ATPase inhibitor |
| Trichostatin A * | 1.7 | Histone deacetylase inhibitor |
| AT7867, HMSL10154-101-1 | 1.8 | Multi-kinase inhibitor |
| PCI-24781 (Abexinostat) * | 2.0 | Histone deacetylase inhibitor |
| Dasatinib | 2.0 | Multi-kinase inhibitor |
| ChemBridge 35093961 | 2.3 | IKK inhibitor |
| Homochlorcyclizine dihydrochloride | 2.3 | Antihistamine |
| LY2608204 | 2.3 | Glucokinase activator |
| Vandetanib | 2.3 | Multi-kinase inhibitor |
| BIX01294 (hydrochloride hydrate) | 2.7 | G9a histone methyltransferase inhibitor |
| HMSL10378-101 | 2.7 | Predicted to target GSK3B at 1 nM (ChEMBL) |
| Crizotinib | 2.8 | Multi-kinase inhibitor |
| Solifenacin succinate | 3.0 | Muscarinic receptor antagonist |
-
*
Compounds with an EC50 less than 5 μM.
Table 2
Pharmacokinetics of NCMC in vivo.
Plasma and tissue concentrations of NCMC were measured at the indicated time points after once daily intraperitoneal injection of 1.0 mg/kg NCMC to male C57/B6N mice (n=4) for 4 days.
| Day | Time[h] | Tissue | N | mean[nmol/L] | SD[nmol/L] | CV[%] |
|---|---|---|---|---|---|---|
| 1 | 4 | Plasma | 4 | 109.7 | 23.19 | 21.1 |
| 1 | 24 | Plasma | 4 | 38.25 | 3.18 | 8.3 |
| 2 | 24 | Plasma | 4 | 32.15 | 3.99 | 12.4 |
| 4 | 2 | Plasma | 4 | 69.43 | 2.92 | 4.2 |
| 4 | 4 | Plasma | 4 | 66.70 | 13.77 | 20.6 |
| 4 | 8 | Plasma | 4 | 80.13 | 13.55 | 16.9 |
| 4 | 12 | Plasma | 4 | 67.58 | 12.54 | 18.6 |
| 4 | 24 | Plasma | 4 | 35.25 | 8.97 | 25.4 |
| 4 | 24 | Muscle | 4 | NOP | na | na |
| 4 | 24 | Liver | 4 | NOP | na | na |
| 4 | 24 | Fat | 4 | 375.3 | 145.2 | 38.7 |
-
N: number of mice, SD: standard deviation, CV: coefficient of variance, NOP: no peak, na: not applicable
Key resources table
| Reagent type (species) or resource | Designation | Source or reference | Identifiers | Additional information |
|---|---|---|---|---|
| Gene (Homo sapiens) | FYN (dominant negative mutant with Y213A mutation) | Amplified from the Addgene plasmid pRK5 DN-Fyn | Addgene plasmid pRK5 DN-Fyn (#16033) | |
| Cell line (Homo sapiens) | HEK-293 | ATCC | CRL-1573 | |
| Biological sample (Homo sapiens) | Primary human hepatic stellate cells (donor 1) | Isolated from human nonparenchymal liver cells (NPCs) purchased from Lonza (cat# HUCNP) | Lonza ID: 4105 | Age: 45; Gender: Male; Race: Caucasian |
| Biological sample (Homo sapiens) | Primary human hepatic stellate cells (donor 2) | Isolated from human nonparenchymal liver cells (NPCs) purchased from Lonza (cat# HUCNP) | Lonza ID: 4270 | Age: 35; Gender: Male; Race: Caucasian |
| Biological sample (Homo sapiens) | Primary human hepatic stellate cells (donor 3) | Lonza (cat# HUCLS) | Lonza ID: 180761 | Age: 57; Gender: Female; Race: Caucasian |
| Biological sample (Homo sapiens) | Primary human hepatic stellate cells (donor 4) | Lonza (cat# HUCLS) | Lonza ID: 182821 | Age: 24; Gender: Female; Race: African American |
| Biological sample (Homo sapiens) | Primary human hepatic stellate cells (donor 5) | Isolated from human nonparenchymal liver cells (NPCs) purchased from Lonza (cat# HUCNP) | Lonza ID: 4258 | Age: 51; Gender: Male; Race: African American |
| Antibody | Anti-collagen type I (Mouse monoclonal) | Sigma | C2456 | (1:1000) |
| Antibody | Anti-FYN (Rabbit polyclonal) | Cell Signaling Technology | #4023 | (1:1000) |
| Antibody | Anti-phospho-Src family (Rabbit monoclonal) | Cell Signaling Technology | #6943 | (1:1000) |
| Antibody | Anti-phospho-p44/42 MAPK (Rabbit monoclonal) | Cell Signaling Technology | #4370 | (1:1000) |
| Antibody | HRP-β-Actin antibody (Mouse monoclonal) | Santa Cruz Biotechnology | sc-47778 HRP | (1:5000) |
| Antibody | goat anti-rabbit IgG secondary antibody (Goat polyclonal) | Invitrogen | #32460 | (1:3000) |
| Antibody | donkey anti-mouse Alexa Fluor 488 secondary antibody (Donkey polyclonal) | Invitrogen | A-21202 | (1:500) |
| Recombinant DNA reagent | pLJM1-eGFP (plasmid) | Addgene | plasmid# 19319 | |
| Recombinant DNA reagent | pRK5 DN-Fyn | Addgene | plasmid# 16033 | |
| Recombinant DNA reagent | pLJM1-DN-FYN (plasmid) | This paper | This is a plasmid generated by this study for the expression of dominant negative (Y213A) FYN in HSCs using lentivirus system. Refer to the Materials and Methods section for more information. | |
| Sequence-based reagent | FYN-forward primer | This paper | PCR primer | This is the forward PCR primer for cloning human FYN gene. The sequence is 5’-CAT GCTAGC GCCACC ATGGGCTGTGTGCAATGTAAGG-3’. Refer to the Materials and Methods section for more information. |
| Sequence-based reagent | FYN-reverse primer | This paper | PCR primer | This is the reverse PCR primer for cloning human FYN gene. The sequence is 5’-AGC GAATTC TTACAGGTTTTCACCAGGTTGGTAC-3’. Refer to the Materials and Methods section for more information. |
| Sequence-based reagent | siRNA: non-targeting control | Horizon Discovery | D-001210–05 | siGENOME |
| Sequence-based reagent | Pooled siRNAs: FYN | Horizon Discovery | MQ-003140–04 | siGENOME SMARTpool |
| Sequence-based reagent | Pooled siRNAs: HSPB1/HSP27 | Horizon Discovery | M-005269–01 | siGENOME SMARTpool |
| Sequence-based reagent | Pooled siRNAs: MAPK3/ERK1 | Horizon Discovery | M-003592–03 | siGENOME SMARTpool |
| Sequence-based reagent | Pooled siRNAs: MAPK1/ERK2 | Horizon Discovery | M-003555–04 | siGENOME SMARTpool |
| Sequence-based reagent | Pooled siRNAs: PTK2/FAK | Horizon Discovery | M-003164–02 | siGENOME SMARTpool |
| Sequence-based reagent | Pooled siRNAs: STAT5A | Horizon Discovery | M-005169–02 | siGENOME SMARTpool |
| Sequence-based reagent | Pooled siRNAs: STAT5B | Horizon Discovery | M-010539–02 | siGENOME SMARTpool |
| Sequence-based reagent | siRNA#1: FYN | Horizon Discovery | D-003140–10 | siGENOME |
| Sequence-based reagent | siRNA#2: FYN | Horizon Discovery | D-003140–24 | siGENOME |
| Commercial assay or kit | TaqMan Real-time PCR Assay: Human ACTA2 | ThermoFisher Scientific | Hs00426835_g1 | |
| Commercial assay or kit | TaqMan Real-time PCR Assay: Human COL1A1 | ThermoFisher Scientific | Hs00164004_m1 | |
| Commercial assay or kit | TaqMan Real-time PCR Assay: Human FYN | ThermoFisher Scientific | Hs00176628_m1 | |
| Commercial assay or kit | TaqMan Real-time PCR Assay: Human HSPB1/HSP27 | ThermoFisher Scientific | Hs00356629_g1 | |
| Commercial assay or kit | TaqMan Real-time PCR Assay: Human MAPK1/ERK2 | ThermoFisher Scientific | Hs01046830_m1 | |
| Commercial assay or kit | TaqMan Real-time PCR Assay: Human MAPK3/ERK1 | ThermoFisher Scientific | Hs00385075_m1 | |
| Commercial assay or kit | TaqMan Real-time PCR Assay: Human PSMB2 | ThermoFisher Scientific | Hs01002946_m1 | |
| Commercial assay or kit | TaqMan Real-time PCR Assay: Human PTK2/FAK | ThermoFisher Scientific | Hs01056457_m1 | |
| Commercial assay or kit | TaqMan Real-time PCR Assay: Human STAT5A | ThermoFisher Scientific | Hs00559643_m1 | |
| Commercial assay or kit | TaqMan Real-time PCR Assay: Human STAT5B | ThermoFisher Scientific | Hs00560026_m1 | |
| Commercial assay or kit | TaqMan Real-time PCR Assay: Mouse Acta2 | ThermoFisher Scientific | Mm00725412_s1 | |
| Commercial assay or kit | TaqMan Real-time PCR Assay: Mouse Col1a1 | ThermoFisher Scientific | Mm00801666_g1 | |
| Commercial assay or kit | TaqMan Real-time PCR Assay: Mouse Psmb2 | ThermoFisher Scientific | Mm00449477_m1 | |
| Commercial assay or kit | Proteome Profiler Human Phospho-Kinase Array Kit | R&D Systems | ARY003B | |
| Chemical compound, drug | Nanchangmycin (NCMC) | Selleck Chemicals | S1450 | Used for the initial confirmation of dose response curves in multiple HSC lines |
| Chemical compound, drug | Nanchangmycin (NCMC) | Adooq | A10621 | Used for all other follow-up experiments |
| Chemical compound, drug | 1-Naphthyl PP1 | Tocris | #3603 | |
| Chemical compound, drug | Thapsigargin | Sigma-Aldrich | T9033 | |
| Chemical compound, drug | Ionomycin | Biogems | #5608212 | |
| Software, algorithm | BIOVIA Pipeline Pilot | Dassault Systèmes | ||
| Software, algorithm | GSEA | UC San Diego and Broad Institute | http://www.gsea-msigdb.org/gsea/index.jsp | |
| Software, algorithm | FastQC | Babraham Bioinformatics | v 0.11.8 | |
| Software, algorithm | RSEM | https://github.com/deweylab/RSEM; Dewey Lab, 2020 | v 1.3.1 | |
| Software, algorithm | Enrichr | https://maayanlab.cloud/Enrichr/ |
Additional files
-
Supplementary file 1
Small molecule Compound Libraries.
This table lists some basic information of the compound libraries screened in this study, including number of compounds, ICCB-L plate numbers, number of concentrations tested for each compound, and total number of experimental wells.
- https://cdn.elifesciences.org/articles/74513/elife-74513-supp1-v1.xlsx
-
Supplementary file 2
Primary Screen Results.
This table contains the full results of the primary screen, including compound annotation information (columns A-G), stock concentration in the library (column H), and primary screen results (columns I-R).
- https://cdn.elifesciences.org/articles/74513/elife-74513-supp2-v1.xlsx
-
Supplementary file 3
711 Hits from Primary Screen.
This table contains the primary screen results of the 711 hits identified from the primary screen. This table was generated by filtering Supplementary file 2 based on the last column.
- https://cdn.elifesciences.org/articles/74513/elife-74513-supp3-v1.xlsx
-
Supplementary file 4
Clustering of Primary Screen Candidates.
This table contains the clustering results of the 711 hits identified from the primary screen. Compound structure used for structure-based clustering (column A), clustering information (columns B-E), compound annotations (columns F-P), primary screen results from this study (columns Q-Y), positive counts and total screen counts of a compound in previous screens conducted at ICCB-L (columns Z-AA), clustering and PAINS analyses results (columns AB-AD).
- https://cdn.elifesciences.org/articles/74513/elife-74513-supp4-v1.xlsx
-
Supplementary file 5
Secondary Screen Results.
This table lists the results of the secondary mRNA screen. Data were normalized to DMSO control. “FC” indicates “fold change”.
- https://cdn.elifesciences.org/articles/74513/elife-74513-supp5-v1.xlsx
-
Supplementary file 6
DRC Screen Results.
This table lists the results of the drug response curve (DRC) screen. Column A annotates the experimental wells, positive control and the five compounds that were not available for testing at the time of screen. Columns C-N contain the scores each researcher gave for each experiment.
- https://cdn.elifesciences.org/articles/74513/elife-74513-supp6-v1.xlsx
-
Supplementary file 7
GSEA of Ontology Gene Sets.
This table contains the full results of the gene enrichment analysis (GSEA) of ontology gene sets regardless if a pathway is statistically significant or not. The interpretation of the scores can be found on GSEA website (https://www.gsea-msigdb.org/gsea/index.jsp).
- https://cdn.elifesciences.org/articles/74513/elife-74513-supp7-v1.xlsx
-
Supplementary file 8
HSC and Liver Cirrhosis Gene Signatures.
This table lists the zScore of the genes analyzed for each signature.
- https://cdn.elifesciences.org/articles/74513/elife-74513-supp8-v1.xlsx
-
Supplementary file 9
Significantly differentially expressed genes in NCMC-treated cells.
This table contains the 1904 mRNAs up-regulated (increase fold change >2, FDR <0.05) and the 2620 mRNAs down-regulated (decrease fold change >2, FDR <0.05) by NCMC treatment.
- https://cdn.elifesciences.org/articles/74513/elife-74513-supp9-v1.xlsx
-
Supplementary file 10
Pathway enrichment analysis of NCMC-regulating genes.
This table contains the Enrichr pathway analysis results of the up- and down-regulated genes by NCMC in five databases.
- https://cdn.elifesciences.org/articles/74513/elife-74513-supp10-v1.xlsx
-
MDAR checklist
- https://cdn.elifesciences.org/articles/74513/elife-74513-mdarchecklist1-v1.docx
Download links
A two-part list of links to download the article, or parts of the article, in various formats.
Downloads (link to download the article as PDF)
Open citations (links to open the citations from this article in various online reference manager services)
Cite this article (links to download the citations from this article in formats compatible with various reference manager tools)
Nanchangmycin regulates FYN, PTK2, and MAPK1/3 to control the fibrotic activity of human hepatic stellate cells
eLife 11:e74513.
https://doi.org/10.7554/eLife.74513


