Activation of transient receptor potential vanilloid 4 is involved in pressure overload-induced cardiac hypertrophy
- Department of Cardiology, Xuzhou Central Hospital, China
- Xuzhou Institute of Cardiovascular Disease, Xuzhou Central Hospital, China
- Department of Cardiology, Union Hospital, Tongji Medical College, Huazhong University of Science and Technology, China
- Department of Cardiology, Xiamen Key Laboratory of Cardiac Electrophysiology, Xiamen Institute of Cardiovascular Diseases, The First Affiliated Hospital of Xiamen University, School of Medicine, Xiamen University, China
Figures
Figure 1
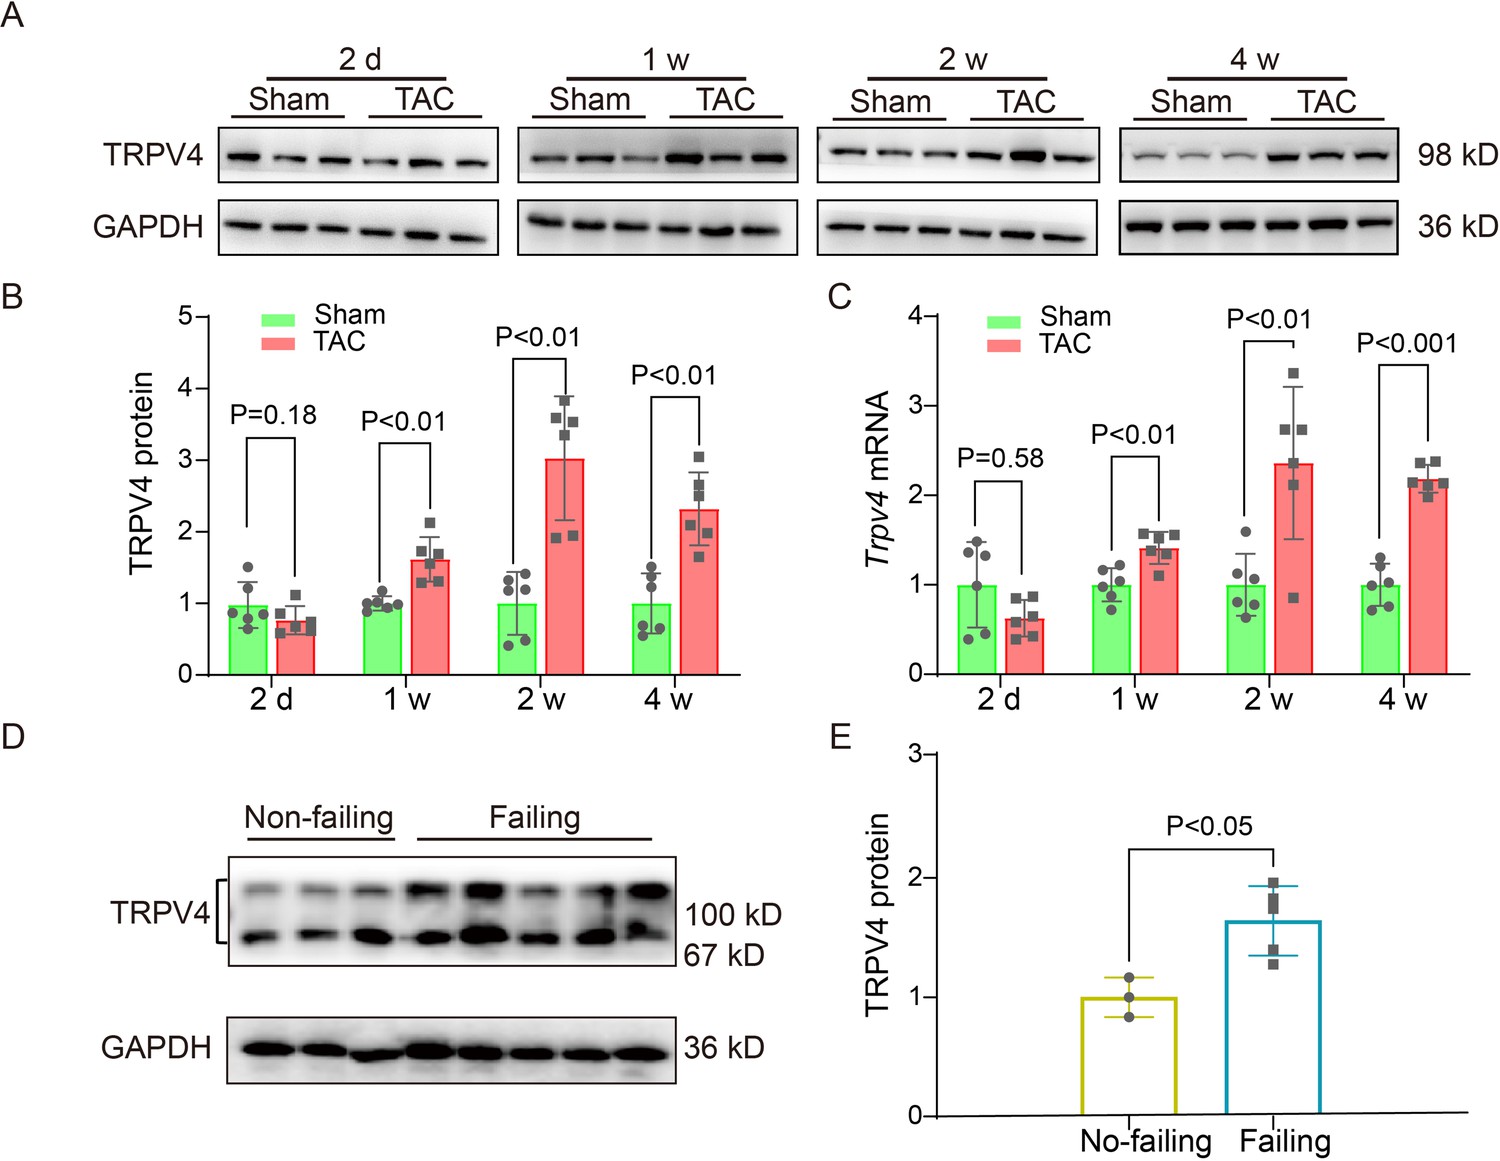
TRPV4 expression is upregulated in pathological cardiac hypertrophy.
Representative immunoblot image (A) and statistics (B) of TRPV4 protein level in the LV from sham or TAC mice at indicated time points after the operation (n=6 per group). All results represent mean ± SD, an unpaired two-tailed Student’s t-test. (C) Statistical data of Trpv4 mRNA level in the LV from sham or TAC mice at indicated time points after the operation (n=6 per group). All results represent mean ± SD, an unpaired two-tailed Student’s t-test. Representative immunoblot image (D) and statistical data (E) of TRPV4 protein level in human non-failing hearts (n=3) and failing hearts (n=5). All results represent mean ± SD, an unpaired two-tailed Student’s t-test. LV, left ventricle; TAC, transverse aortic constriction.
-
Figure 1—source data 1
Source data file (Excel) for Figure 1B.
- https://cdn.elifesciences.org/articles/74519/elife-74519-fig1-data1-v1.xlsx
-
Figure 1—source data 2
Source data file (Excel) for Figure 1C.
- https://cdn.elifesciences.org/articles/74519/elife-74519-fig1-data2-v1.xlsx
-
Figure 1—source data 3
Source data file (Excel) for Figure 1E.
- https://cdn.elifesciences.org/articles/74519/elife-74519-fig1-data3-v1.xlsx
Figure 2
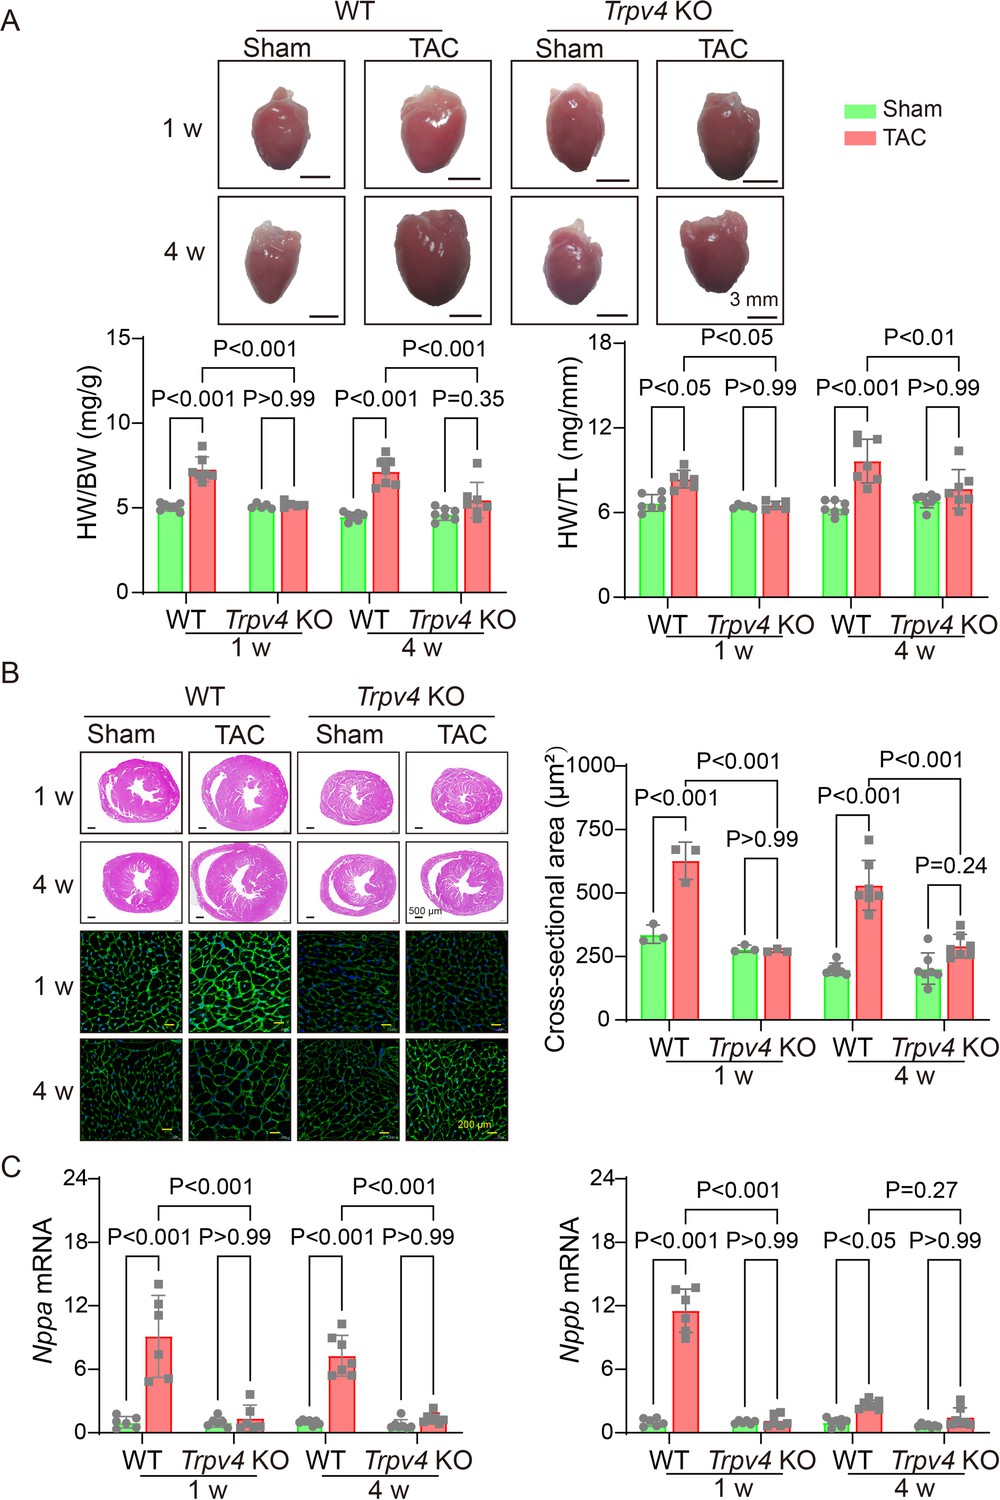
TRPV4 deficiency attenuates pressure overload-induced cardiac hypertrophy.
(A) Representative images of the heart and statistical results for the ratios of HW/BW and HW/TL of WT and Trpv4 KO mice 1 or 4 weeks after sham or TAC operation (n=7 per group in WT mice, n=5 per group at 1 week in TRPV4−/− mice, n=7 per group at 4 weeks in Trpv4 KO mice) (B) Hematoxylin & eosin staining, wheat germ agglutinin staining, and cross-section area in WT and Trpv4 KO mice 1 or 4 weeks after sham or TAC operation (n=3 per group at 1 week, n=7 per group at 4 weeks). (C) Statistics of hypertrophy-related genes ANP (Nppa) (E) and BNP (Nppb) (F) mRNA levels in mouse hearts from WT or Trpv4 KO 1 or 4 weeks after sham or TAC operation (n=6 per group at 1 week, n=7 per group at 4 weeks). All results represent mean ± SD, a two-way ANOVA followed by the Bonferroni test. BW, body weight; HW, heart weight; TAC, transverse aortic constriction; TL, tibial length; WT, wild-type.
-
Figure 2—source data 1
Source data file (Excel) for Figure 2A, B and C.
- https://cdn.elifesciences.org/articles/74519/elife-74519-fig2-data1-v1.xlsx
Figure 3

TRPV4 deficiency improves cardiac function and attenuates cardiac fibrosis induced by pressure overload.
Representative images of M-mode echocardiography of WT and Trpv4 KO mice 4 weeks after sham or TAC operation (A). Statistics of EF (B), FS (C), LV mass (D), and LVIDs (E) in mice 4 weeks after sham or TAC operation (n=6 per group). Representative images (F) and statistics (G) of Masson’s trichrome-stained hearts from mice 4 weeks after sham or TAC operation. The statistics were from the panoramic scanning pictures (n=4 per group). Statistics of fibrosis-related genes collagenase-1 (Col1a1) (H), collagenase-3 (Col1a1) (I), and galectin-3 (LGALS3) (J) mRNA levels in mouse hearts 4 weeks after sham or TAC operation (n=7 per group). All results represent mean ± SD, a two-way ANOVA followed by the Bonferroni test. EF, ejection fraction; FS, fractional shortening; LV, left ventricle; TAC, transverse aortic constriction.
-
Figure 3—source data 1
Source data file (Excel) for Figure 3B, C, D, E, G, H, I.
- https://cdn.elifesciences.org/articles/74519/elife-74519-fig3-data1-v1.xlsx
Figure 4
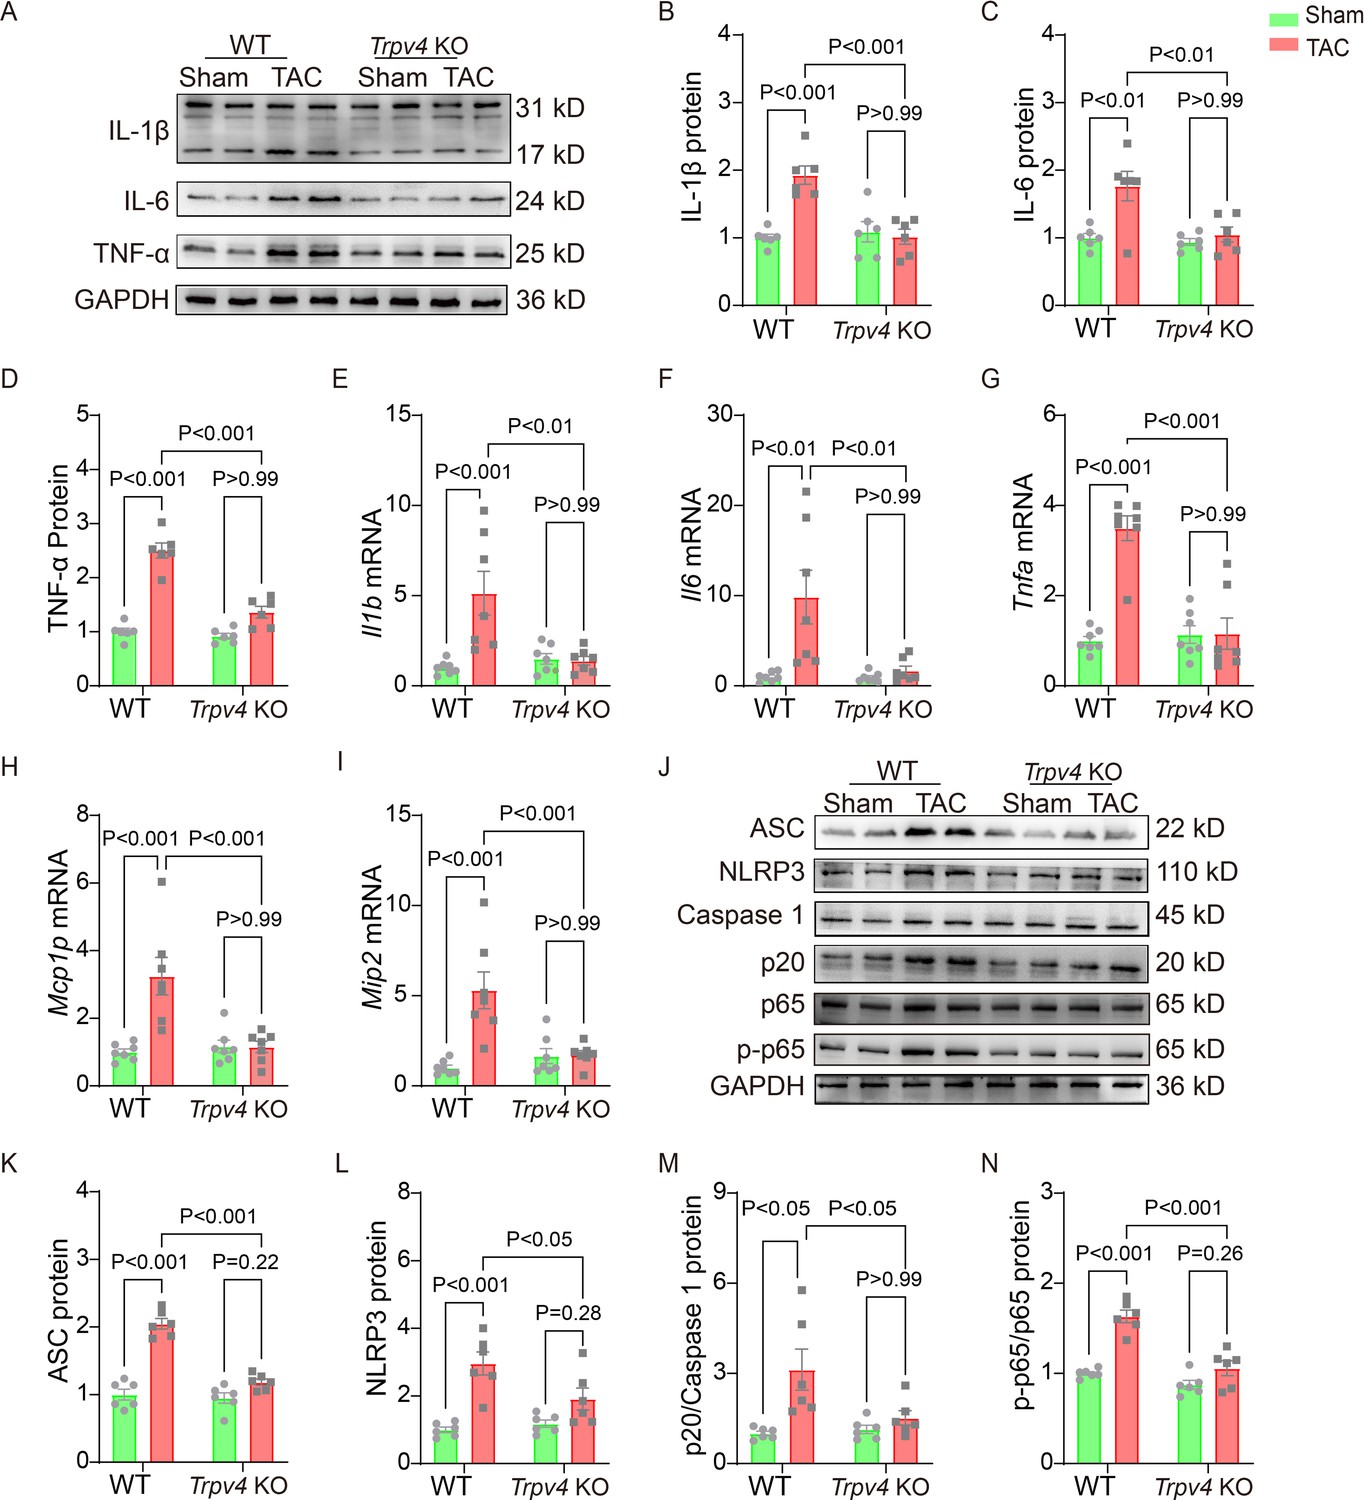
TRPV4 deficiency attenuates cardiac fibrosis induced by pressure overload.
Representative immunoblot image (A) and statistics of IL-1β (B), IL-6 (C), and TNF-α (D) protein levels in WT and Trpv4 KO mice 4 weeks after sham or TAC operation (n=6 per group). Statistical data of IL-1β (Il1b) (E), IL-6 (Il6) (F), TNF-α (Tnfa) (G), MCP-1 (Mcp1p) (H), and MIP-2 (Mip2) (I) mRNA levels in mouse hearts 4 weeks after sham or TAC operation (n=7 per group). Representative immunoblot image (J) and statistics of ASC (K), NLRP3 (L), Caspase 1-p20 (M), and p-NFκB p65 (N) protein levels in WT and TRPV4−/− mice at 4 weeks after sham or TAC operation (n=6 per group). All results represent mean ± SD, a two-way ANOVA followed by the Bonferroni test. TAC, transverse aortic constriction; WT, wild-type.
-
Figure 4—source data 1
Source data file (Excel) for Figure 4B, C and D.
- https://cdn.elifesciences.org/articles/74519/elife-74519-fig4-data1-v1.xlsx
-
Figure 4—source data 2
Source data file (Excel) for Figure 4E-I.
- https://cdn.elifesciences.org/articles/74519/elife-74519-fig4-data2-v1.xlsx
-
Figure 4—source data 3
Source data file (Excel) for Figure 4K, L, M and N.
- https://cdn.elifesciences.org/articles/74519/elife-74519-fig4-data3-v1.xlsx
Figure 5
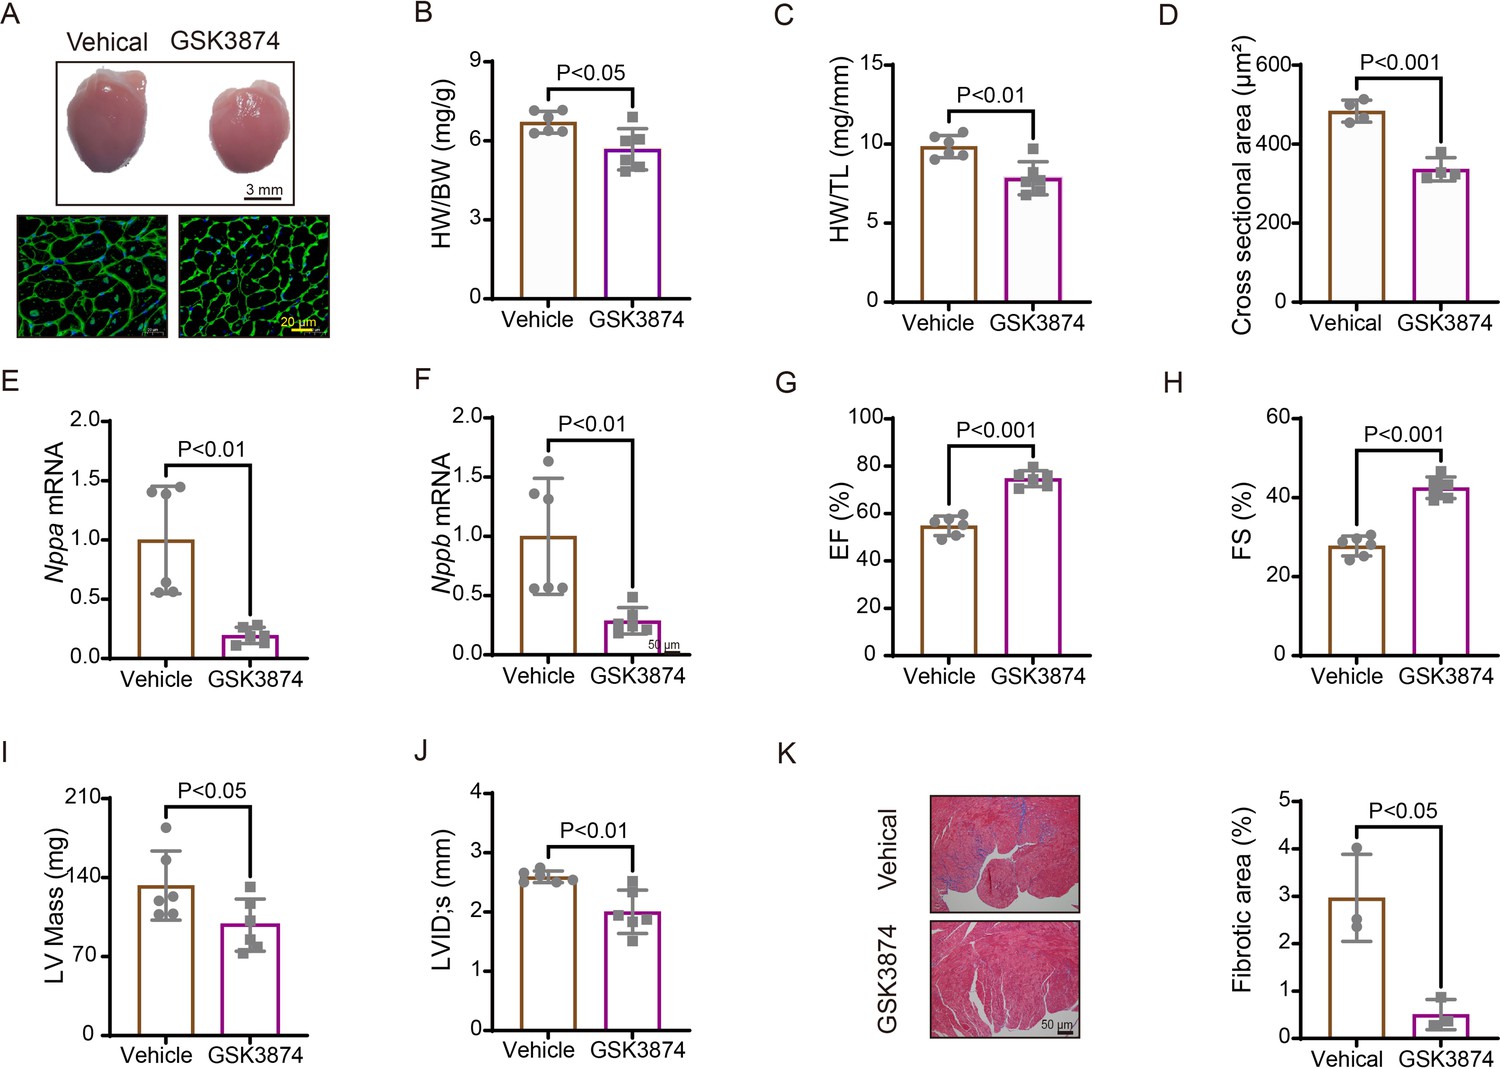
Treatment with TRPV4 antagonist prevents TAC-induced cardiac hypertrophy and dysfunction in mice.
(A) Representative images of heart photo and WGA staining 4 weeks after TAC. Statistical results for HW/BW ratio (n=6 per group) (B), HW/TL ratio (n=6 per group) (C), cross-section area (n=4 per group) (J), ANP (Nppa) (n=6 per group) (E), BNP (Nppb) (n=6 per group) (F), EF (n=6 per group) (G), FS (n=6 per group) (H), LV mass (n=6 per group) (I), and LVIDs (n=6 per group) (J). All results represent mean± SD, an unpaired two-tailed Student’s t-test. Representative images and statistics (K) of Masson’s trichrome-stained hearts 4 weeks after TAC (n=3 per group). All results represent mean ± SD, an unpaired two-tailed Student’s t-test. EF, ejection fraction; FS, fractional shortening; LV, left ventricle; TAC, transverse aortic constriction; WGA, wheat germ agglutinin.
-
Figure 5—source data 1
Source data file (Excel) for Figure 5C–K.
- https://cdn.elifesciences.org/articles/74519/elife-74519-fig5-data1-v1.xlsx
Figure 6
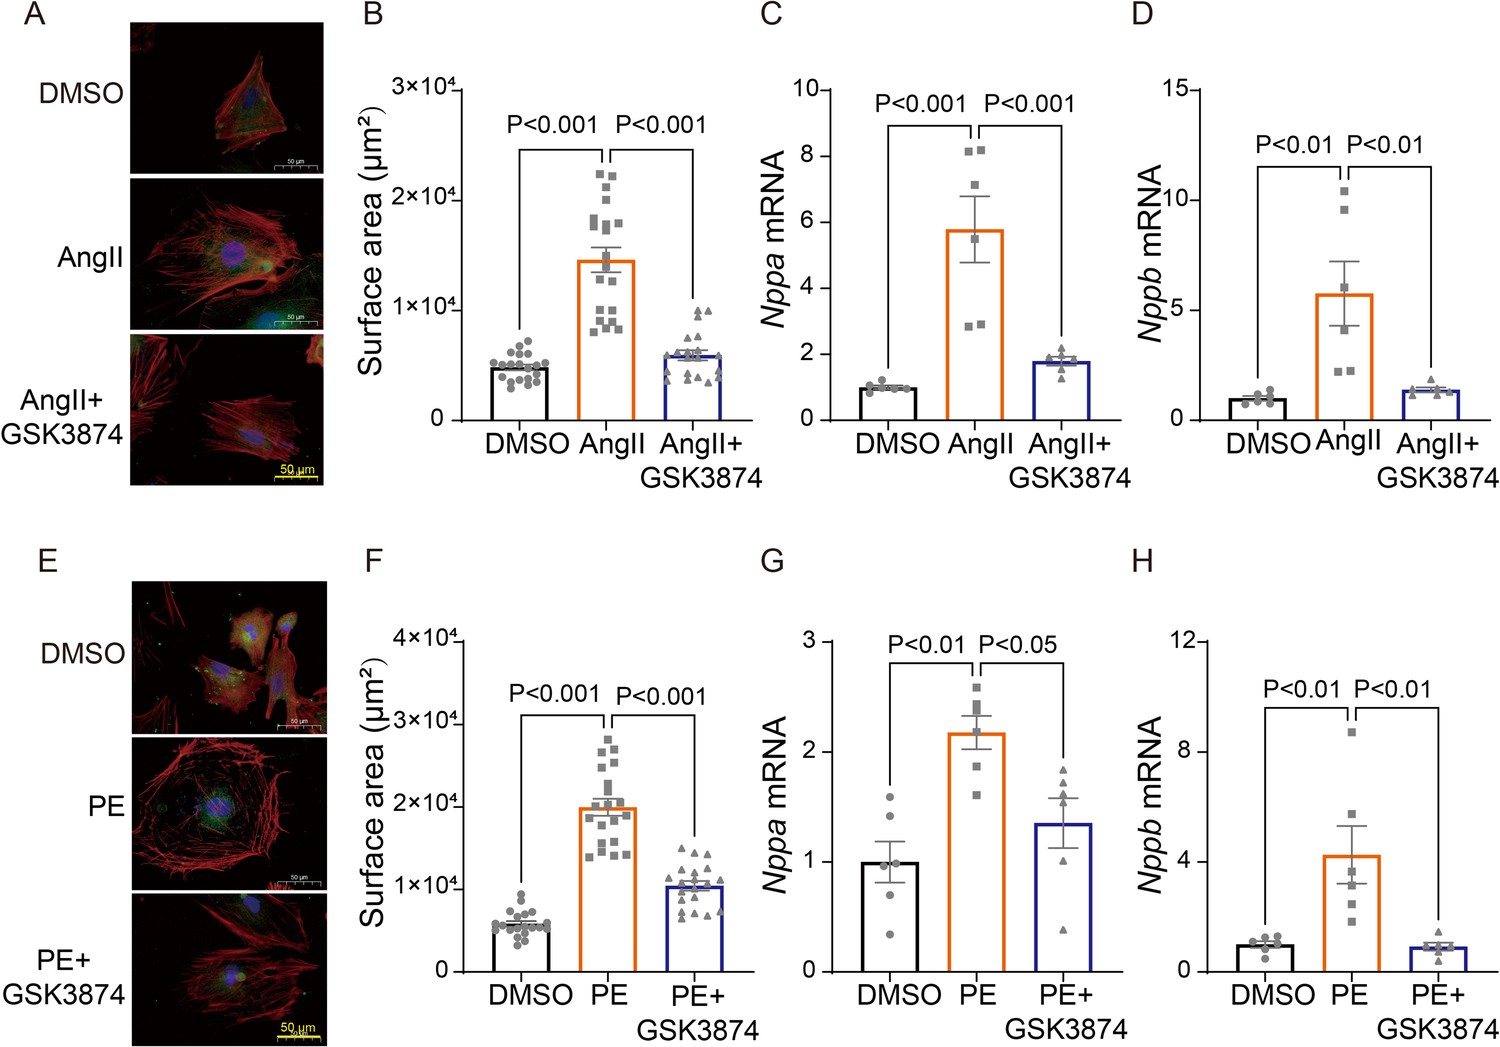
TRPV4 blockade attenuates AngII/PE-induced hypertrophy in NRVMs in vitro.
Representative images (A) and statistics of the cell-surface areas (B) in NRVMs treated with DMSO, AngII, and AngII plus GSK3874 (n=20 cells from three animals). Statistics of ANP (Nppa) (C) and BNP (Nppb) (D) mRNA levels in NRVMs treated with DMSO, AngII, and AngII plus GSK3874 (n=6 per group). Representative images (E) and statistics of the cell-surface areas (F) in NRVMs treated with DMSO, PE, and PE plus GSK3874 (n=20 cells from three animals). Statistics of ANP (Nppa) (G) and BNP (Nppb) (H) mRNA levels in NRVMs treated with DMSO, PE, and PE plus GSK3874 (n=6 per group). All results represent mean ± SD, a one-way ANOVA followed by the Bonferroni test. NRVM, neonatal rat ventricular myocyte.
-
Figure 6—source data 1
Source data file (Excel) for Figure 6B, C, D, F, G and H.
- https://cdn.elifesciences.org/articles/74519/elife-74519-fig6-data1-v1.xlsx
Figure 7
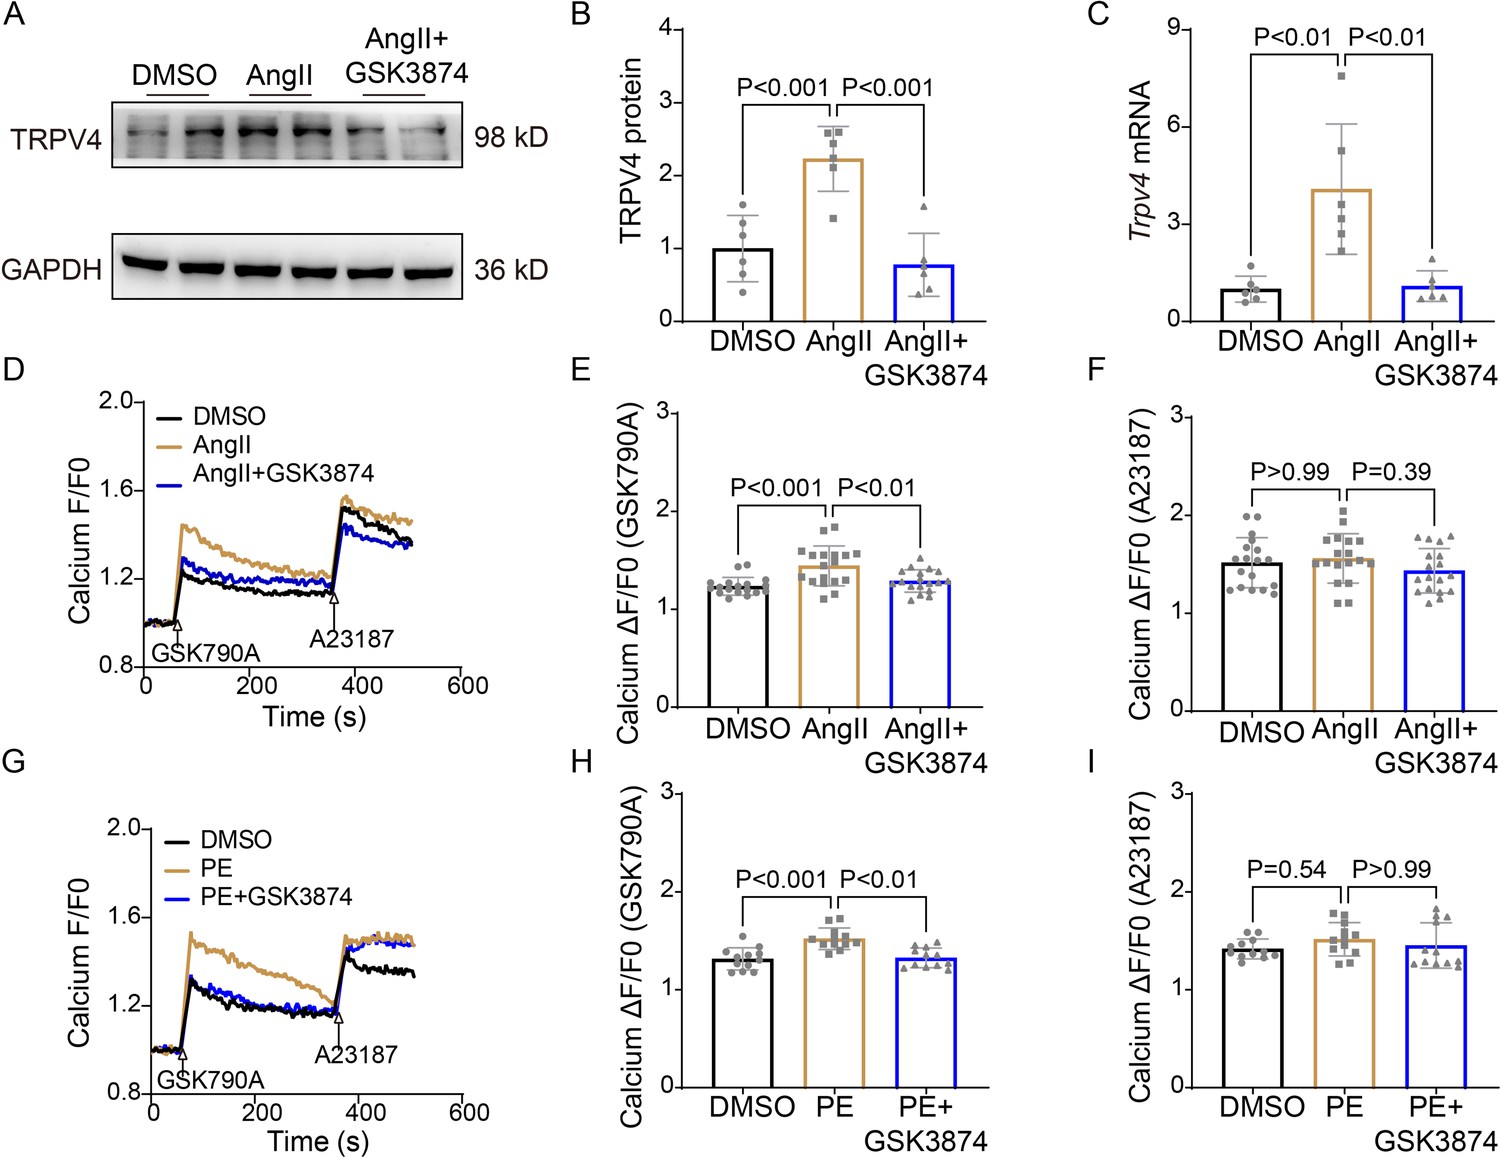
TRPV4 blockade attenuates AngII/PE-induced Ca2+ overload in NRVMs.
Representative immunoblot image (A) and statistics (B) of TRPV4 protein level in NRVMs treated with DMSO, AngII, and AngII plus GSK3874 (n=6 per group). (C). Statistical data of Trpv4 mRNA level in NRVMs treated with DMSO, AngII, and AngII plus GSK3874 (n=6 per group). Representative recording of changes in intracellular Ca2+ induced by 500 nM GSK 790A and 1 μM A23187 in NRVMs treated with DMSO, AngII, and AngII plus GSK3874 (D). Quantification of [Ca2+]i response induced by GSK790A (E) and A23187 (F) -induced in NRVMs treated with DMSO, AngII, and AngII plus GSK3874 (n=18 per group). Representative recording of changes in intracellular Ca2+ induced by 500 nM GSK 790A and 1 μM A23187 in NRVMs treated with DMSO, PE, and PE plus GSK3874 (G). Quantification of [Ca2+]i response induced by GSK790A (H) and A23187 (I)-induced in NRVMs treated with DMSO, PE, and PE plus GSK3874 (n=12 per group). The arrow indicates the time of addition of GSK1016790A and A21387. F0 represents the average fluorescence intensity before GSK1016790A stimulation. All results represent mean ± SD, a one-way ANOVA followed by the Bonferroni test. NRVM, neonatal rat ventricular myocyte.
-
Figure 7—source data 1
Source data file (Excel) for Figure 7B.
- https://cdn.elifesciences.org/articles/74519/elife-74519-fig7-data1-v1.xlsx
-
Figure 7—source data 2
Source data file (Excel) for Figure 7C-I.
- https://cdn.elifesciences.org/articles/74519/elife-74519-fig7-data2-v1.xlsx
Figure 8

TRPV4 activation induces CaMKII phosphorylation.
Representative immunoblot image (A) and statistics (B) of p-CaMKII/CaMKII in NRVMs treated with DMSO, GSK790A, and GSK790A plus GSK3874 (n=4 per group). All results represent mean ± SD, a one-way ANOVA followed by the Bonferroni test. Representative immunoblot image (C) and statistics (D) of p-CaMKII/CaMKII in NRVMs treated with GSK790A in the absence and presence of Ca2+ medium (n=6 per group). All results represent mean ± SD, an unpaired two-tailed student’s t-test. Representative immunoblot image (E) and statistics (F) of p-CaMKII/CaMKII in NRVMs treated with DMSO, AngII, and AngII plus GSK3874 (n=4 per group). All results represent mean ± SD, a one-way ANOVA followed by the Bonferroni test. Representative immunoblot image (G) and statistics (H) of p-CaMKII/CaMKII in the LV from sham or TAC WT mice at indicated time points after the operation (n=6 per group). All results represent mean ± SD, an unpaired two-tailed student’s t-test. Representative immunoblot image (I) and statistics (J) of p-CaMKII/CaMKII in Trpv4 KO mice 1 week or 4 weeks after sham or TAC operation (n=6 per group). All results represent mean ± SD, an unpaired two-tailed student’s t-test. NRVM, neonatal rat ventricular myocyte.
-
Figure 8—source data 1
Source data file (Excel) for Figure 8B, D, F, H and J.
- https://cdn.elifesciences.org/articles/74519/elife-74519-fig8-data1-v1.xlsx
Figure 9
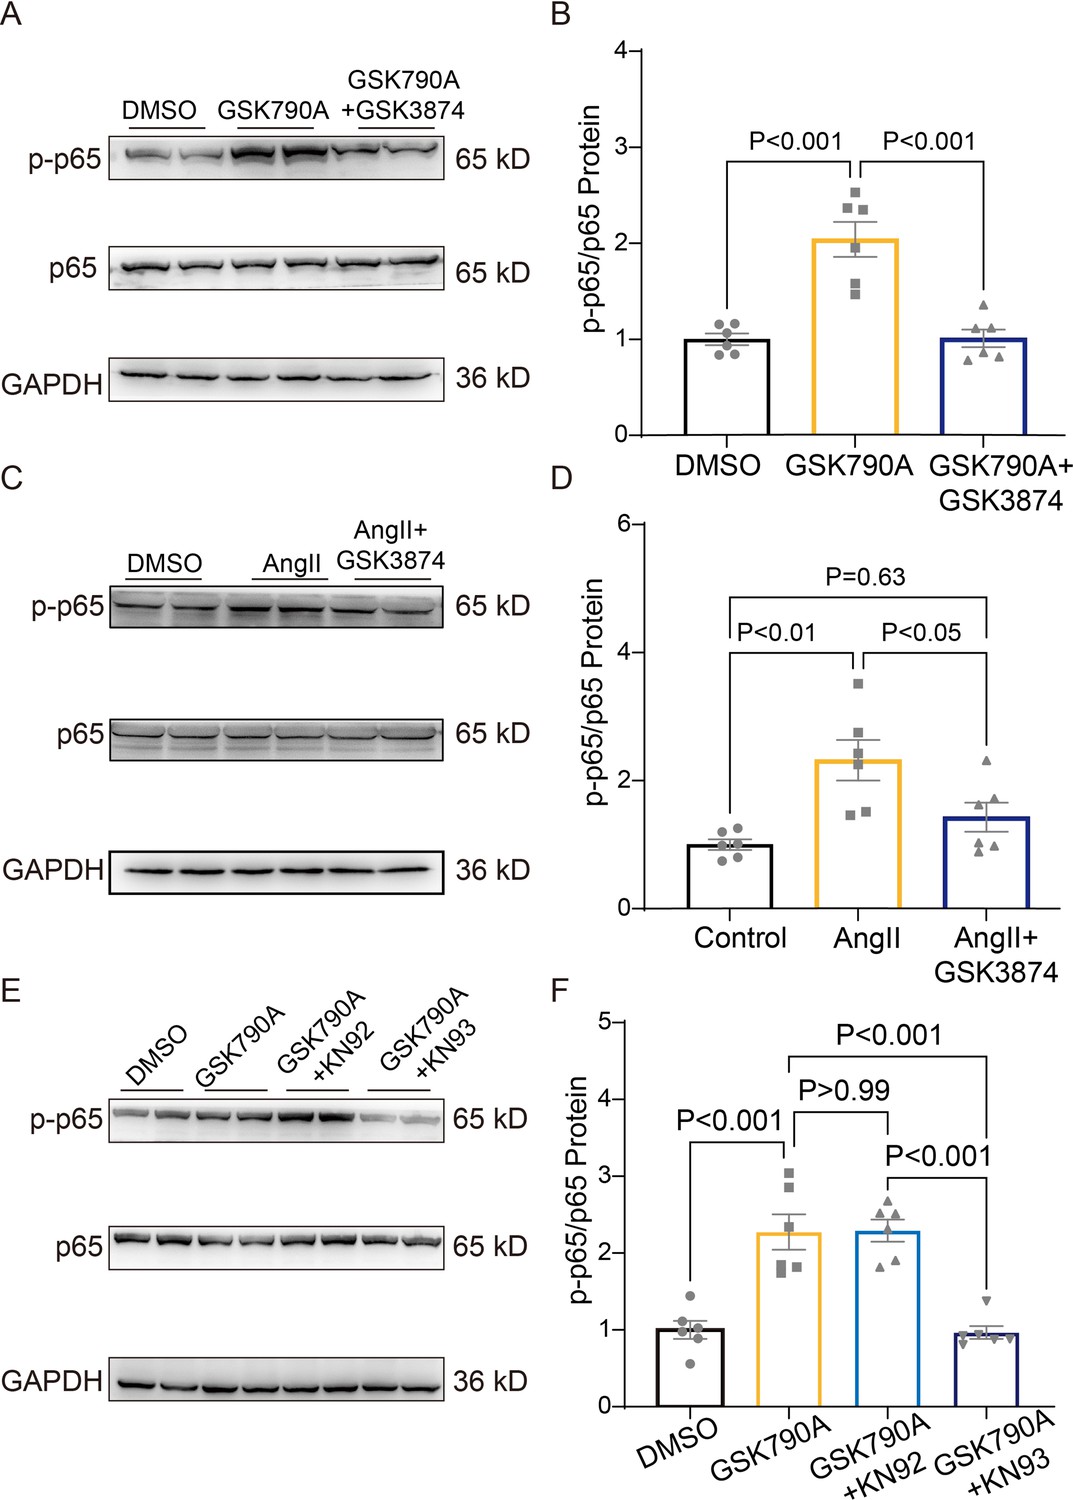
TRPV4 activation induces NFκB phosphorylation via a CaMKII signaling pathway.
Representative immunoblot image (A) and statistics (B) of p-p65 /p65 in NRVMs treated with DMSO, GSK790A, and GSK790A plus GSK3874 (n=6 per group). All results represent mean ± SD, a one-way ANOVA followed by the Bonferroni test. Representative immunoblot image (C) and statistics (D) of p-p65 /p65 in NRVMs treated DMSO, AngII, and AngII plus GSK3874 (n=6 per group). All results represent mean ± SD, a one-way ANOVA followed by the Bonferroni test. Representative immunoblot image (E) and statistics (F) of p-p65 /p65 in NRVMs treated with DMSO, GSK790A, GSK790A plus KN92, and GSK790A plus KN93 (n=6 per group). All results represent mean ± SD, a one-way ANOVA followed by the Bonferroni test.
-
Figure 9—source data 1
Source data file (Excel) for Figure 9B, D and F.
- https://cdn.elifesciences.org/articles/74519/elife-74519-fig9-data1-v1.xlsx
Figure 10
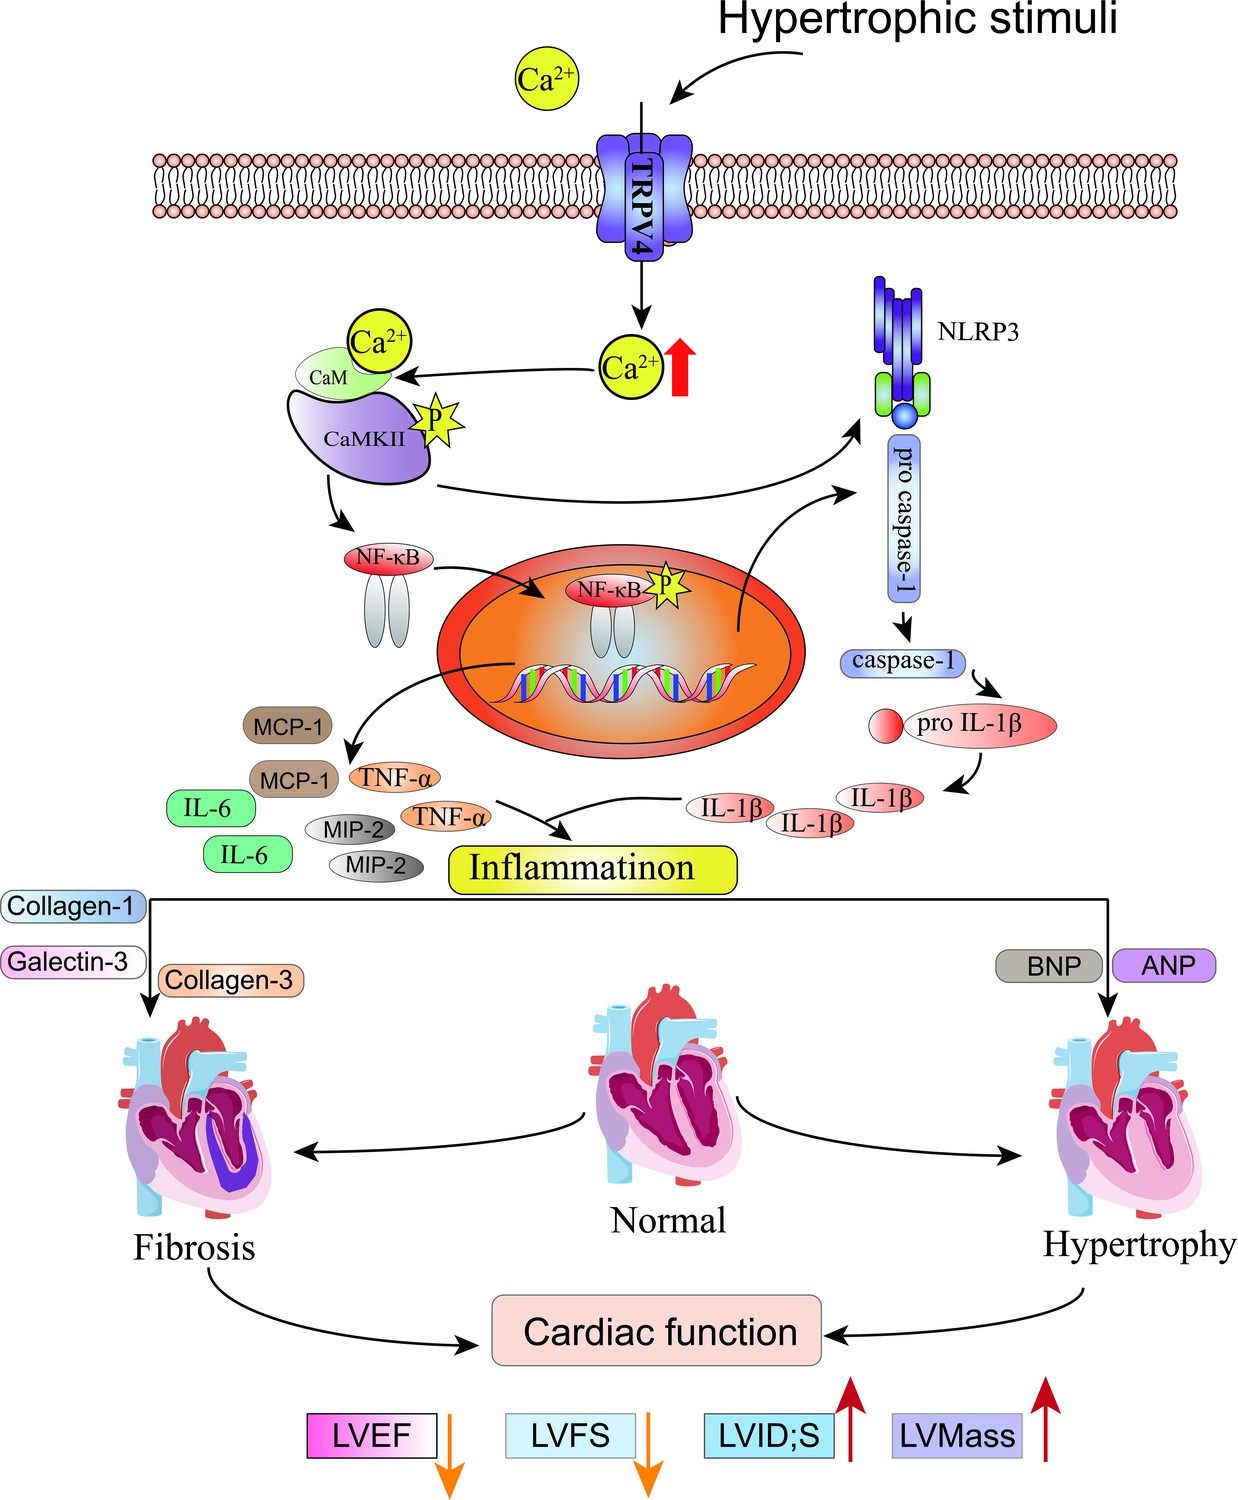
Schematic illustration of potential mechanisms through which TRPV4 activation promotes pathological cardiac hypertrophy.
Appendix 1—figure 1
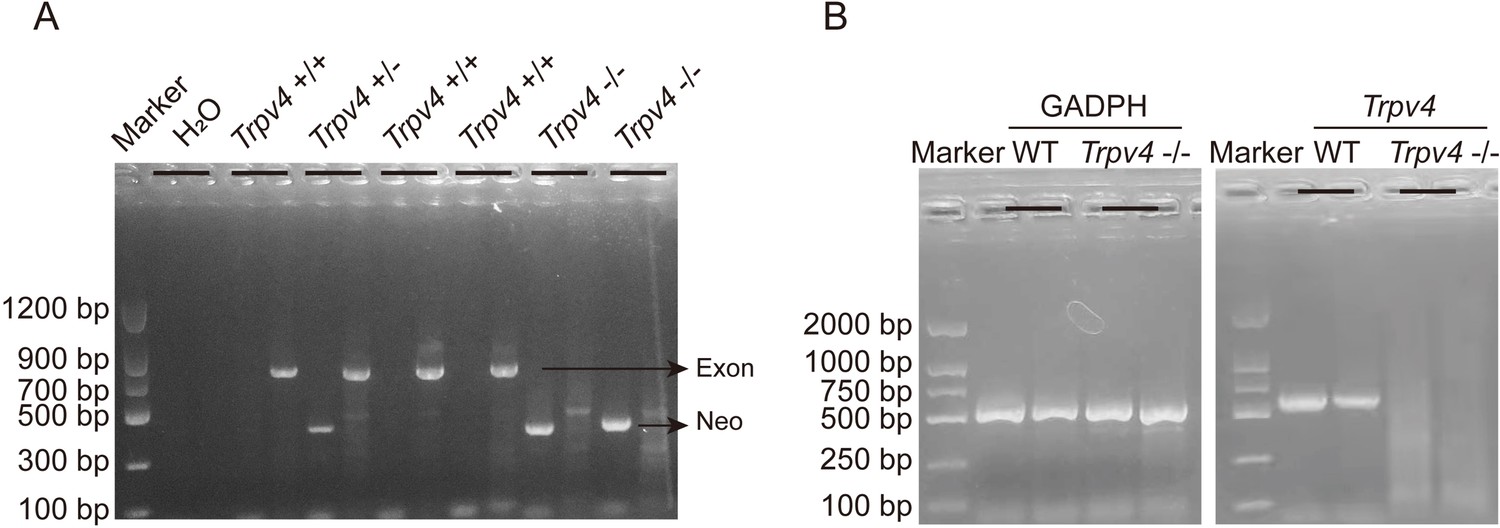
Genotyping of TRPV4 wild-type and Trpv4 KO mice and TRPV4 depletion in the heart of Trpv4 KO mice.
A. Representative RT-PCR genotyping gel image of the WT, Trpv4+/-, and Trpv4-/-. B. RT-PCR of total RNA from heart showing Trpv4 mRNA was present in WT mice but absent in Trpv4 KO mice.
-
Appendix 1—figure 1—source data 1
- https://cdn.elifesciences.org/articles/74519/elife-74519-app1-fig1-data1-v1.zip
Tables
Table 1
Echocardiographic measurements 4 weeks after TAC.
| WT | Trpv4 KO | |||
|---|---|---|---|---|
| Sham | TAC | Sham | TAC | |
| Heart rate (bpm) | 457.61±11.77 | 463.11±16.96 | 463.11±18.86 | 443.78±10.38 |
| LVAW,s (mm) | 1.29±0.14 | 1.41±0.18 | 1.21±0.2 | 1.48±0.17 |
| LVID,d (mm) | 3.32±0.12 | 3.81±0.59 | 2.92±0.38 | 3.11±0.47 |
| LVPW,d (mm) | 0.70±0.08 | 1.08±0.46 | 0.92±0.39 | 1.02±0.37 |
| LVPW,s (mm) | 1.17±0.11 | 1.41±0.57 | 1.33±0.34 | 1.59±0.31 |
| Diameter,s (mm) | 2.05±0.13 | 2.67±0.57 | 1.69±0.32 | 1.80±0.37## |
| Diameter,d (mm) | 3.29±0.12 | 3.62±0.48 | 2.87±0.42 | 3.04±0.45 |
| Volume,s (μl) | 13.73±2.17 | 28.01±14.43* | 8.79±4.00 | 10.36±5.41## |
| Volume,d (μl) | 43.88±3.84 | 56.39±17.41 | 32.23±11.02 | 37.38±12.30 |
| Stroke volume (μl) | 30.14±2.43 | 28.39±4.67 | 23.44±7.19 | 27.02±7.52 |
-
LVAW,s: systolic left ventricular anterior wall, LVID,s: systolic left ventricular internal diameter, LVPW,d: diastolic left ventricular posterior wall, LVPW,s.: systolic left ventricular posterior wall, Data represent means ± SD, n=6 per group, ⁎P<0.05 WT TAC vs WT sham group. ## P<0.01 Trpv4 KO TAC vs WT TAC group
-
Table 1—source data 1
Source data file (Excel) for Table 1.
- https://cdn.elifesciences.org/articles/74519/elife-74519-table1-data1-v1.xlsx
Key resources table
| Reagent type (species) or resource | Designation | Source or reference | Identifiers | Additional information |
|---|---|---|---|---|
| Chemical compound, drug | Ang II | MCE | Cat# HY-13948 | |
| Chemical compound, drug | PE | MACKLIN | Cat# I822933 | |
| Chemical compound, drug | GSK790A | Sigma-Aldrich | Cat# G0798 | |
| Chemical compound, drug | GSK3874 | Sigma-Aldrich | Cat# SML0942 | |
| Chemical compound, drug | A21387 | Sigma-Aldrich | Cat# G0798 | |
| Chemical compound, drug | KN92 | Selleck | Cat# S6507 | |
| Chemical compound, drug | KN93 | Selleck | Cat# S6787 | |
| Chemical compound, drug | Pentobarbital sodium | Sigma-Aldrich | Cat# 76-74-4 | |
| Chemical compound, drug | Collagenase II | Worthington | Cat# ls004176 | |
| Chemical compound, drug | Fluo-4/AM | AAT Bioquest | Cat# AAT-B20401 | |
| Chemical compound, drug | Pluronic F‐127 | Solarbio | Cat# P679 | |
| Sequence-based reagent | BNP (Nppb)_R (mice) | This paper | PCR primers | CAACTTCAGTGCGTTACAGC |
| Sequence-based reagent | Collagenase-1 (Col1a1) _F (mice) | This paper | PCR primers | GAAACCCGAGGTATGCTTGA |
| Sequence-based reagent | Collagenase1 (Col1a1) _R (mice) | This paper | PCR primers | GGGTCCCTCGACTCCTACAT |
| Sequence-based reagent | Collagenase-3 (Col3a1) _F (mice) | This paper | PCR primers | AGCCACCTTGGTCAGTCCTA |
| Sequence-based reagent | Collagenase-3 (Col3a1) _R (mice) | This paper | PCR primers | GTGTAGAAGGCTGTGGGCAT |
| Sequence-based reagent | Galectin-3 (LGALS3)_F (mice) | This paper | PCR primers | CAGGAAAATGGCAGACAGCTT |
| Sequence-based reagent | Galectin-3 (LGALS3)_R(mice) | This paper | PCR primers | CCCATGCACCCGGATATC |
| Sequence-based reagent | IL-1β (Il1b) _F (mice) | This paper | PCR primers | TGCCACCTTTTGACAGTGATG |
| Sequence-based reagent | IL-1β(Il1b)_R (mice) | This paper | PCR primers | TGATGTGCTGCTGCGAGATT |
| Sequence-based reagent | IL-6(Il6)_F (mice) | This paper | PCR primers | GATAAGCTGGAGTCACAGAAGG |
| Sequence-based reagent | IL-6(Il6)_R (mice) | This paper | PCR primers | TTGCCGAGTAGATCTCAAAGT |
| Sequence-based reagent | TNF-α(Tnfa)_F (mice) | This paper | PCR primers | CCCCAAAGGGATGAGAAGTT |
| Sequence-based reagent | TNF-α(Tnfa)_R (mice) | This paper | PCR primers | ACTTGGTGGTTTGCTACGA |
| Sequence-based reagent | MIP-2(Mip2)_F (mice) | This paper | PCR primers | CGCCCAGACAGAAGTCATAG |
| Sequence-based reagent | MIP-2(Mip2)_R (mice) | This paper | PCR primers | TCCTCCTTTCCAGGTCAGTTA |
| Sequence-based reagent | MCP-1(Mcp1p)_F (mice) | This paper | PCR primers | TTTTTGTCACCAAGCTCAAGAG |
| Sequence-based reagent | MCP-1(Mcp1p)_R (mice) | This paper | PCR primers | TTCTGATCCTCATTTGGTTCCGA |
| Sequence-based reagent | Gapdh_F(mice) | This paper | PCR primers | AAGAAGGTGGTGAAGCAGGCAT |
| Sequence-based reagent | Gapdh_F (mice) | This paper | PCR primers | CGGCATCGAAGGTGGAAGAGTG |
| Sequence-based reagent | Trpv4_F (rat) | This paper | PCR primers | CGTCCAAACCTGCGAATGAAGTTC |
| Sequence-based reagent | Trpv4_F (rat) | This paper | PCR primers | CCTCCATCTCTTGTTGTCACTGG |
| Sequence-based reagent | ANP (Nppa)_F (rat) | This paper | PCR primers | ATCTGATGGATTTCAAGAACC |
| Sequence-based reagent | ANP (Nppa)_R (rat) | This paper | PCR primers | CTCTGAGACGGGTTGACTTC |
| Sequence-based reagent | BNP (Nppb)_F (rat) | This paper | PCR primers | CAATCCACGATGCAGAAGCT |
| Sequence-based reagent | BNP (Nppb)_R (rat) | This paper | PCR primers | GGGCCTTGGTCCTTTGAGA |
| Sequence-based reagent | Gapdh_ F (rat) | This paper | PCR primers | ATGGGAAGCTGGTCATCAAC |
| Sequence-based reagent | Gapdh_ R (rat) | This paper | PCR primers | GTGGTTCACACCCATCACAA |
| Antibody | Anti-GAPDH HRP (mouse monoclonal) | Bioworlde | Cat# MB001H RRID: AB_2857326 | Western blot (1:10,000) |
| Antibody | Anti-TRPV4 (rabbit polyclonal) | Alomone labs | Cat# ACC-034 RRID: AB_2040264 | Western blot (1:500) |
| Antibody | Anti-p-CaMKII(Thr287) (rabbit polyclonal) | Thermo Fisher Scientific | Cat# PA5-37833 RRID: AB_2554441 | Western blot (1:500) |
| Antibody | Anti-CaMKII (rabbit monoclonal) | Abcam | Cat# ab52476 RRID: AB_868641 | Western blot (1:1000) |
| Antibody | Anti-p-P65 (Ser536) (rabbit polyclonal) | Affinity | Cat# AF2006 RRID: AB_2834435 | Western blot (1:500) |
| Antibody | Anti-P65 (rabbit polyclonal) | Affinity | Cat# AF5006 RRID: AB_2834847 | Western blot (1:500) |
| Antibody | Anti-NLRP3 (rabbit monoclonal) | Abcam | Cat# ab263899 RRID: AB_2889890 | Western blot (1:500) |
| Antibody | Anti-ASC/TMS1 (rabbit monoclonal) | CST | Cat# 67824 RRID: AB_2799736 | Western blot (1:1000) |
| Antibody | Anti-Cleaved-Caspase 1, p20 (rabbit polyclonal) | Affinity | Cat# AF4005 RRID: AB_2845463 | Western blot (1:500) |
| Antibody | Anti-IL 1β (rabbit monoclonal) | Abcam | Cat# ab234437 | Western blot (1:1000) |
| Antibody | Anti-IL-6 (rabbit monoclonal) | CST | Cat# 12912 RRID: AB_2798059 | Western blot (1:500) |
| Antibody | Anti-TNF-α (rabbit monoclonal) | CST | Cat# 11948 RRID: AB_2687962 | Western blot (1:1000) |
| Antibody | Goat Anti-Rabbit IgG HRP (goat polyclonal) | Affinity | Cat# S0001 RRID: AB_2839429 | Western blot (1:3000) |
| Antibody | Anti-α-actinin (rabbit polyclonal) | Abcam | Cat# Ab137346 RRID: AB_2909405 | ICC (1:500) |
| Commercial assay or kit | cDNA reverse transcription kit | Vazyme | Cat# R211-01 | |
| Commercial assay or kit | SYBR Green PCR Master Mix Kit | CWbio | Cat# cw3008h | |
| Others | Percoll | Cytiva | Cat# 17089109 | A low-viscosity, non-toxic medium suitable for density gradient centrifugation of cells, viruses and subcellular particles |
Appendix 1—table 1
Anatomical parameters, early markers of cardiac hypertrophy and fibrosis, and echocardiographic parameters were measured in wild-type (WT) mice after subjected to TAC versus sham-operated controls (n=6–7/group).
| 2 d | 1 w | 2 w | 4 w | |||||
|---|---|---|---|---|---|---|---|---|
| Sham | TAC | Sham | TAC | Sham | TAC | Sham | TAC | |
| Anatomical parameter | ||||||||
| n | 7 | 7 | 7 | 7 | 7 | 7 | 6 | 6 |
| HW/BW | 4.4±0.1 | 4.5±0.1 | 5.1±0.2 | 7.3±0.7*** | 4.5±0.3 | 7.1±1.1*** | 4.5±0.3 | 7.1±0.8** |
| HW/TL | 6.0±0.2 | 6.0±0.1 | 6.7±0.6 | 8.4±0.6*** | 6.0±0.3 | 9.3±1.4*** | 6.3±0.5 | 9.7±1.6*** |
| Early markers of cardiac hypertrophy and fibrosis | ||||||||
| n | 6 | 6 | 6 | 6 | 6 | 6 | 7 | 7 |
| ANP | 1.0±0.3 | 1.1±0.2 | 1.0±0.5 | 9.1±3.9*** | 1.0±0.4 | 28.1±11.5*** | 1.0±0.2 | 7.3±1.9*** |
| BNP | 1.0±0.2 | 0.7±0.1 | 1.0±0.4 | 11.5±2.0*** | 1.0±0.3 | 5.2±1.1*** | 1.0±0.4 | 2.7±0.4** |
| Collagenase-1 | 1.0±0.4 | 1.4±0.7 | 1.0±0.4 | 1.1±0.3 | 1.0±1.3 | 1.0±0.7 | 1.0±0.2 | 6.8±2.5** |
| Collagenase-3 | 1.0±0.2 | 1.0±0.5 | 1.0±0.4 | 1.30±0.25 | 1.0±1.1 | 2.5±2.1 | 1.0±0.3 | 3.8±1.2** |
| Echocardiographic parameters | ||||||||
| n | 7 | 7 | 7 | 7 | 7 | 7 | 6 | 6 |
| EF (%) | 66.4±7.2 | 65.0±8.9 | 71.0±5.9 | 68.7±3.5 | 75.7±4.4 | 60.2±3.9*** | 68.8±3.3 | 52.8±10.6** |
| FS (%) | 36.0±5.1 | 34.2±6.7 | 39.8±6.6 | 36.1±3.5 | 43.4±4.0 | 31.3±2.6*** | 37.6±2.7 | 26.9±6.5** |
-
HW/BW: heart weight to body weight ratio, HW/TL: heart weight to tibia length ratio, EF: ejection fraction, FS: fractional shortening, Data represent means ± SD, **P<0.01, ***P<0.001, compared between sham- and TAC operated groups.
-
Appendix 1—table 1—source data 1
- https://cdn.elifesciences.org/articles/74519/elife-74519-app1-table1-data1-v1.xls
Appendix 1—table 2
Clinical characteristics of patients with advanced heart failure.
| Patient | Age (y) | Gender | EF | NYHA |
|---|---|---|---|---|
| DCM 1 | 52 | Male | 22.5 | IV |
| DCM 2 | 47 | Male | 12.6 | III |
| DCM 3 | 46 | Male | 15.9 | IV |
| DCM 4 | 20 | Male | 15 | III |
| DCM 5 | 30 | Female | 21 | IV |
| Control 1 | 35 | Male | I | |
| Control 2 | 27 | Male | I | |
| Control 3 | 40 | Male | I |
-
DCM: dilated cardiomyopathy, EF: ejection fraction, NYHA: New York Heart Association
Additional files
-
Transparent reporting form
- https://cdn.elifesciences.org/articles/74519/elife-74519-transrepform1-v1.docx
-
Source data 1
Raw Western blot image.
- https://cdn.elifesciences.org/articles/74519/elife-74519-data1-v1.zip
-
Appendix 1—table 1—source data 1
- https://cdn.elifesciences.org/articles/74519/elife-74519-app1-table1-data1-v1.xls
-
Appendix 1—figure 1—source data 1
- https://cdn.elifesciences.org/articles/74519/elife-74519-app1-fig1-data1-v1.zip
Download links
A two-part list of links to download the article, or parts of the article, in various formats.
Downloads (link to download the article as PDF)
Open citations (links to open the citations from this article in various online reference manager services)
Cite this article (links to download the citations from this article in formats compatible with various reference manager tools)
Activation of transient receptor potential vanilloid 4 is involved in pressure overload-induced cardiac hypertrophy
eLife 11:e74519.
https://doi.org/10.7554/eLife.74519


