Redox regulation of PTPN22 affects the severity of T-cell-dependent autoimmune inflammation
- Division of Medical Inflammation Research, Department of Medical Biochemistry and Biophysics, Karolinska Institutet, Sweden
- Division of Biochemistry, Dept. of Medical Biochemistry and Biophysics, Karolinska Institute, Sweden
- Department of Gastroenterology, the First Affiliated Hospital of Xi'an Jiaotong University, China
- Division of Physiological Chemistry I, Dept. of Medical Biochemistry and Biophysics Karolinska Institute, Sweden
- Department of Cell Biology, Harvard Medical School, United States
- Project Leader Department, Research and Early Development, Respiratory & Immunology, BioPharmaceuticals R&D, AstraZeneca, Sweden
- Translational Science and Experimental Medicine, Research and Early Development Respiratory & Immunology, BioPharmaceuticals R&D, AstraZeneca, Sweden
- Centre d’Immunophénomique, Aix Marseille Université, INSERM, France
- Department of Pharmacological & Technological Chemistry, I.M. Sechenov First Moscow State Medical University, Russian Federation
- Department of Selenoprotein Research, National Institute of Oncology, Hungary
- National and Local Joint Engineering Research Center of Biodiagnosis and Biotherapy, The Second Affiliated Hospital of Xi'an Jiaotong University, China
Figures
Figure 1
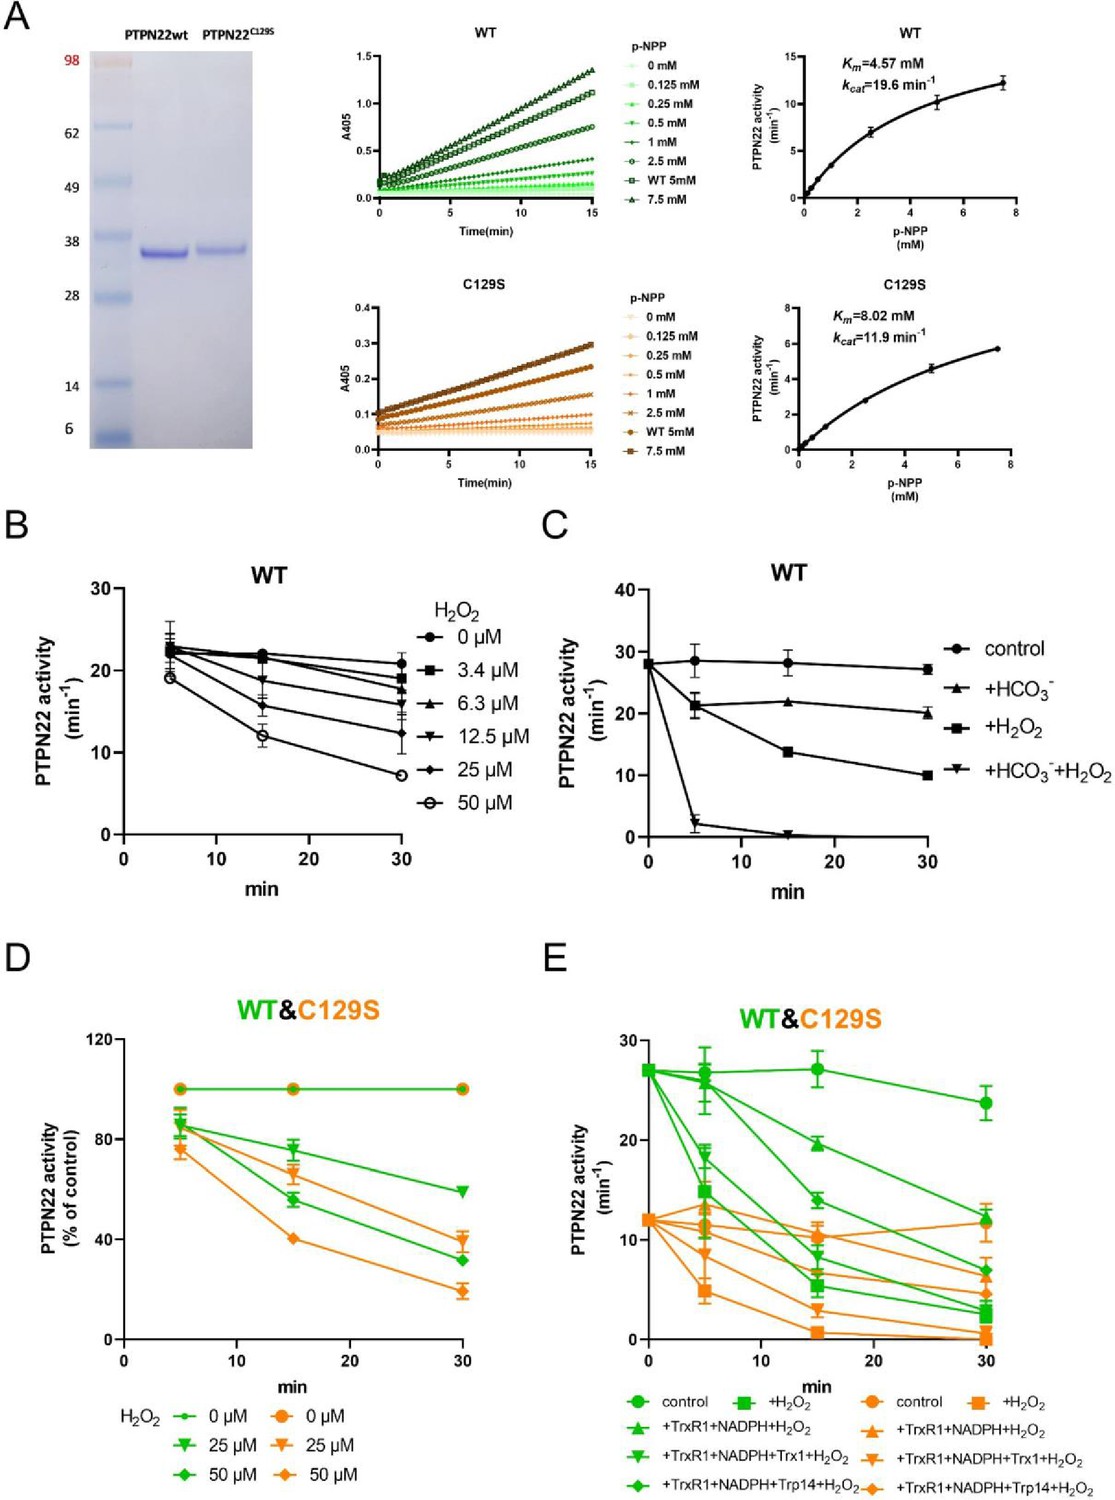
PTPN22C129S is more prone to oxidative inactivation.
(A) Purified human wild-type and PTPN22C129S proteins are shown as analyzed on SDS-PAGE, and kinetic parameters were measured using p-NPP as substrate as shown to the right. Data points represent mean ± SD (error bars) (n = 3). (B) PTPN22 (1400 nM) was treated with indicated concentrations of H2O2 and then assayed for PTP activity at the indicated times. PTPN22 activity is given in min–1 (mol of product/mol of enzyme/min). Data points represent mean ± SD (error bars) (n = 3). (C) PTPN22 (1400 nM) activity was measured as in (A) but with buffer control (●), 25 mM bicarbonate (▲), 30 µM H2O2 (■), or the 896 combination of 30 µM H2O2 and 25 mM bicarbonate (▼). Data points represent mean ± SD (error bars) (n = 4). (D) 897 Wild-type (green) and PTPN22C129S (orange) proteins were treated with indicated H2O2 concentrations and then assayed for PTP activity. Data points represent mean ± SD (error bars) (n = 3), and activities are given as percentage of buffer control for each enzyme. (E) Pre-reduced wild-type (green) and PTPN22C129S (orange) proteins were first preincubated for 10 min either in only buffer (■), with 300 μM NADPH and 0.25 μM TrxR1 (▲), with 300 μM NADPH, 0.25 μM TrxR1 and 10 μM Trx1(▼), or with 300 μM NADPH, 0.25 μM TrxR1, and 10 μM Trp14 (◆), whereupon H2O2 (100 μM) and 1 mM NaN3 were added, except to the control (●), and samples were taken at indicated times for measurement of PTP activity. Data points represent mean ± SD (error bars) (n = 3).
-
Figure 1—source data 1
Raw data for catalytic activity of wild-type and mutant PTPN22.
- https://cdn.elifesciences.org/articles/74549/elife-74549-fig1-data1-v1.docx
-
Figure 1—source data 2
Raw data for PTPN22 activity after H2O2 treatment.
- https://cdn.elifesciences.org/articles/74549/elife-74549-fig1-data2-v1.docx
-
Figure 1—source data 3
Raw data for PTPN22 activity after H2O2 treatment with and without bicarbonate.
- https://cdn.elifesciences.org/articles/74549/elife-74549-fig1-data3-v1.docx
-
Figure 1—source data 4
Raw data for comparison of PTPN22 activity between wild-type and mutant after H2O2 treatment.
- https://cdn.elifesciences.org/articles/74549/elife-74549-fig1-data4-v1.docx
-
Figure 1—source data 5
Raw data for comparison of PTPN22 activity between wild-type and mutant after H2O2 treatment in the presence of reducing systems.
- https://cdn.elifesciences.org/articles/74549/elife-74549-fig1-data5-v1.docx
-
Figure 1—source data 6
Uncropped gel image showing wild-type and mutant PTPN22.
- https://cdn.elifesciences.org/articles/74549/elife-74549-fig1-data6-v1.pptx
Figure 2 with 2 supplements
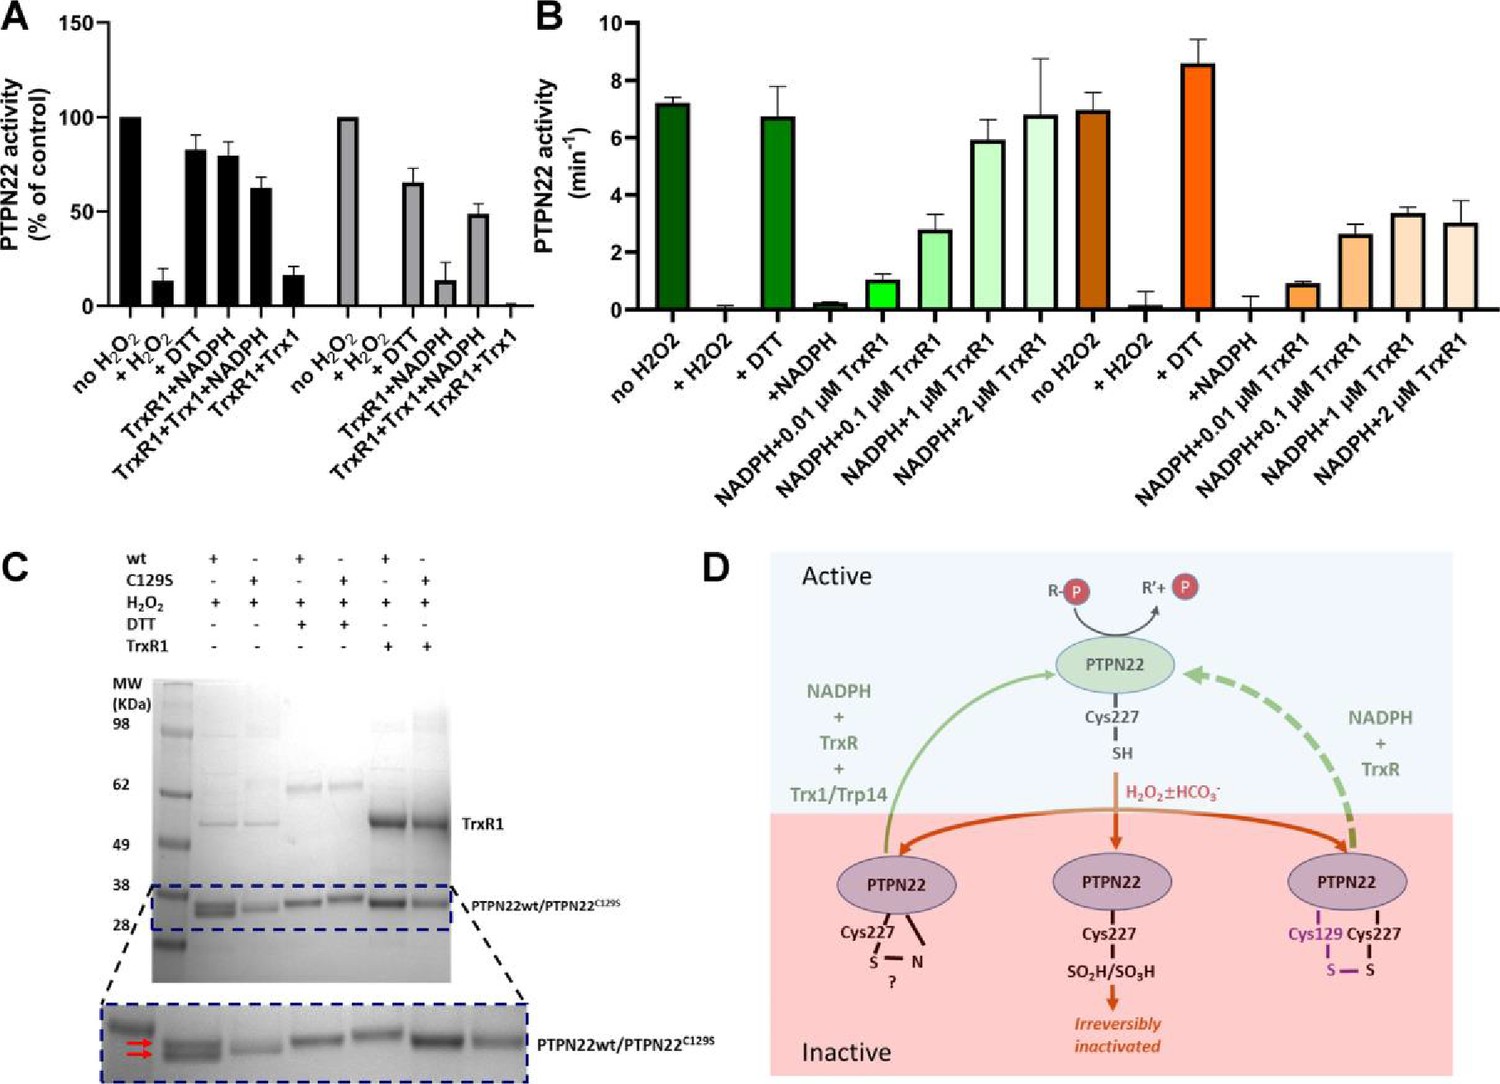
PTPN22 can be reactivated by TrxR1.
(A) Pre-reduced wild-type (black) or PTPN22C129S (gray) proteins were treated with H2O2 (1 mM) for 5 min whereupon residual H2O2 was removed by addition of catalase. Thereafter, the enzymes were incubated for 60 min at 37°C with either only buffer, DTT (10 mM), or with combinations of TrxR1 (2.5 μM) and NADPH (300 μM) and Trx1 (10 μM), as indicated. Finally, the samples were analyzed for PTP activity, with activity reported as percentage of control samples treated identically but without addition of H2O2. (B) Pre-reduced PTPN22 (green) and PTPN22C129S (orange) were treated as described in (A), reactivated with either 10 mM DTT, or NADPH (300 μM) and different concentrations of TrxR1 as indicated. After 60 min at 37°C, samples were analyzed for PTP activity, given as turnover in min–1 (mol of product/mol of enzyme/min). (C) SDS-PAGE analysis of PTPN22 or PTPN22C129S treated similarly to the assay shown in (A) but incubated with H2O2 (100 µM), DTT (10 mM), or TrxR1 (0.5 µM together with 300 µM NADPH), as indicated in the figure. The samples were subsequently analyzed on a nonreducing SDS-PAGE. Note the presence of a double band only in oxidized PTPN22, but not in oxidized PTPN22C129S, which disappears upon incubation with either DTT or TrxR1 (double red arrows in the enlarged portion of the gel picture). (D) A proposed model for redox regulation of PTPN22. Only the reduced form of the enzyme is active (top, light green), which upon oxidation with H2O2 and as further facilitated by bicarbonate (HCO3-) can form several oxidized species (bottom, purple), possibly being either a sulfenyl amide as suggested for PTP1B or some other species that require the complete thioredoxin system for reactivation (left), as well as irreversibly oxidized with the catalytic C227 converted to sulfinic/sulfonic acid (middle), or by forming a disulfide with C129 (right). This disulfide was here found to be amenable to reduction directly by TrxR1, but as the PTPN22C129S mutant cannot form this species, it can also not be reactivated by that reduction path (dashed green arrow). Both PTPN22 and PTPN22C129S can, however, be reactivated by the thioredoxin system from its other nonirreversibly oxidized states (solid green arrow).
-
Figure 2—source data 1
Raw data for reactivation of wild-type and mutant PTPN22.
- https://cdn.elifesciences.org/articles/74549/elife-74549-fig2-data1-v1.docx
-
Figure 2—source data 2
Raw data for reactivation of wild-type and mutant PTPN22 with varying TrxR1 concentrations.
- https://cdn.elifesciences.org/articles/74549/elife-74549-fig2-data2-v1.docx
-
Figure 2—source data 3
Uncropped SDS-PAGE analysis of PTPN22 treated with H2O2 and then reactivated with DTT or TrxR1.
- https://cdn.elifesciences.org/articles/74549/elife-74549-fig2-data3-v1.pptx
Figure 2—figure supplement 1
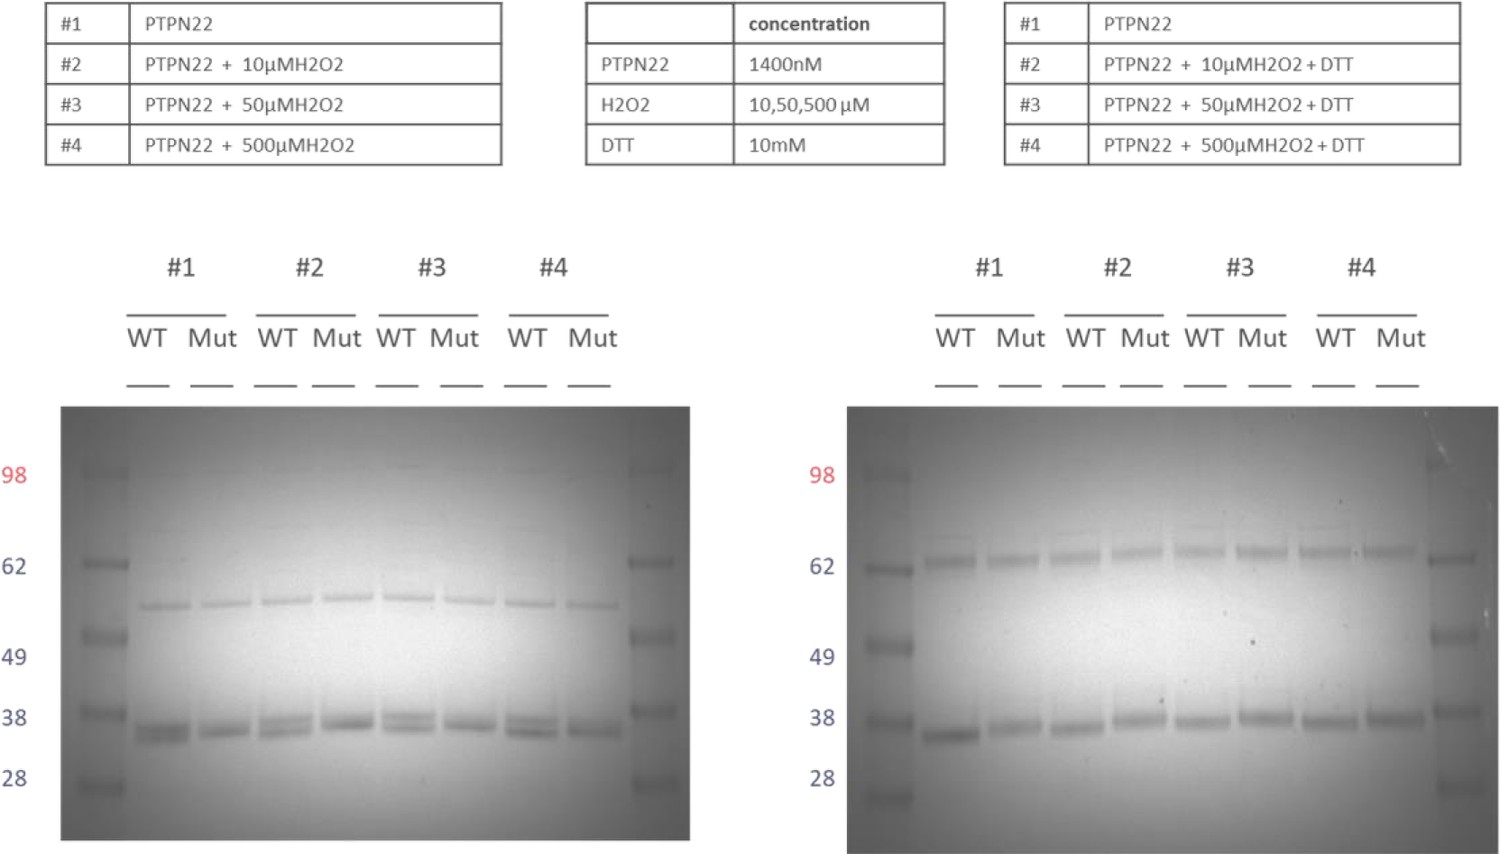
Reproducibility and H2O2 concentration dependence of the double band appearing in oxidized PTPN22 but not in PTPN22C129S, always fully reducible using subsequent treatment with DTT.
-
Figure 2—figure supplement 1—source data 1
Unedited image showing the presence of a double band in oxidized PTPN22, but not in PTPN22 C129S.
- https://cdn.elifesciences.org/articles/74549/elife-74549-fig2-figsupp1-data1-v1.pptx
Figure 2—figure supplement 2
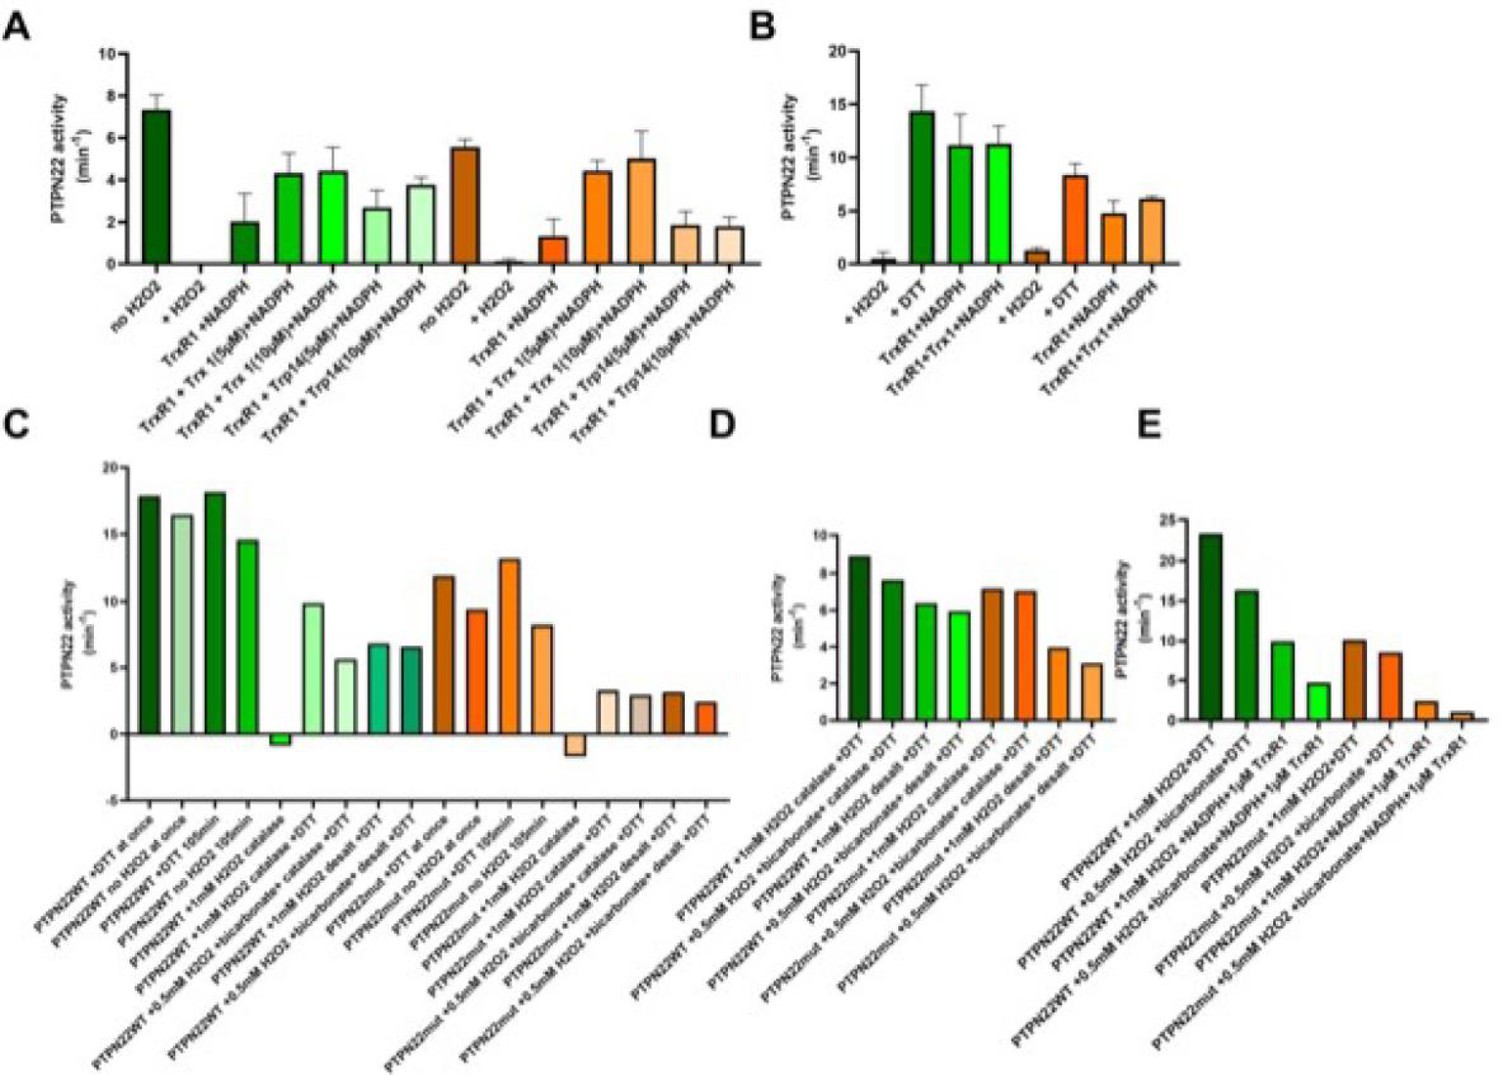
C129S mutant PTPN22 is less sensitive to TrxR1 reactivation compared to WT PTPN22.
(A) Reduced wild-type (green) and C129S mutant (orange) PTPN22 (1400 nM) was pre-oxidized by H2O2 and then reactivated with TrxR1 (0.05 μM) (18 units/mg) and NADPH (300 μM) with or without TRP14 (5 or 10 μM) or Trx1 (5 or 10 μM), as indicated. After incubation for 60 min at 37°C, samples were analyzed for PTP activity. (B) Reduced wild-type (green) and C129S mutant (orange) PTPN22 (1400 nM) was treated with H2O2 (100 μM) for 30 min and then desalted to remove residual H2O2 with subsequent reactivation with DTT (10 mM) or TrxR1 (2.5 μM) (18 units/mg) with or without NADPH (300 μM) and Trx1 (10 μM). After 60 min at 37°C, samples were analyzed for PTP activity. (C) Reduced wild-type (green) and C129S mutant (orange) PTPN22 (1400 nM) was oxidized using H2O2 with or without addition of 25 mM bicarbonate as described in the main text, but some groups included catalase and some reactivated with 10 mM DTT, as indicated. After 60 min at 37°C, samples were analyzed for PTP activity. (D, E) Reduced wild-type (green) and C129S mutant (orange) PTPN22 (1400 nM) was treated as described in (C) and reactivated with either DTT (10 mM) or TrxR1 (1 μM) (18 units/mg) and NADPH (300 μM), as indicated. After 60 min at 37°C, samples were analyzed for PTP activity.
Figure 3 with 2 supplements

PTPN22C129S enhances Th1-mediated inflammation via NOX2-mediated reactive oxygen species (ROS).
(A) Schematic representation of wild-type and PTPN22C129S proteins; in the wild-type protein, the catalytic cysteine 227 may form a disulfide bond with cysteine 129, whilst in the mutant, cysteine 129 is mutated into a serine, abrogating this disulfide bond. (B–L) Mice were immunized according to delayed-type hypersensitivity (DTH) protocol with collagen type II (Col2), and cell populations/recall responses were analyzed 72 hr after challenge. (B, C) Ear swelling of littermate wild-type (n = 8), PTPN22C129S (n = 6), NCF1mi1j (n = 5) and PTPN22C129S/NCF1m1j (n = 7) mice at indicated time points after Col2 challenge. Swelling shown as mean ± SEM (two-way ANOVA). Data is representative of four experiments. (D, E) Measurement of antigen-specific interferon-γ (IFNγ)/IL-2 T cell response against the immunodominant T cell epitope (rCol22259-273) of Col2 as measured by ELISpot in inguinal lymph nodes. (F) Frequencies of indicated cell subsets in PBS-injected and Col2-injected ears measured by flow cytometry; representative gating shown. (G) Mean fluorescence intensity (MFI) of CD4 within Col2-injected ears measured by flow cytometry. (H) qPCR analysis of CXCR3 expression in PBS and Col2-injected ears. (I) Cell count in peripheral lymphoid organs at termination of DTH protocol. (J) Frequencies of indicated cell subsets within inguinal lymph nodes measured by flow cytometry. (K) Frequencies of indicated subsets in inguinal lymph nodes of Vβ12/Vβ12.PTPN22C129S mice; flow cytometry plots show expansion of B22a1+ T cells upon immunization and representative gating for CD62L and CD44. (L) MFI of B22a1 in PBS/Col2-injected ears. Error bars represent mean ± SEM.
-
Figure 3—source data 1
Raw data for ear pinna thickness in the delayed-type hypersensitivity model.
- https://cdn.elifesciences.org/articles/74549/elife-74549-fig3-data1-v1.xlsx
Figure 3—figure supplement 1
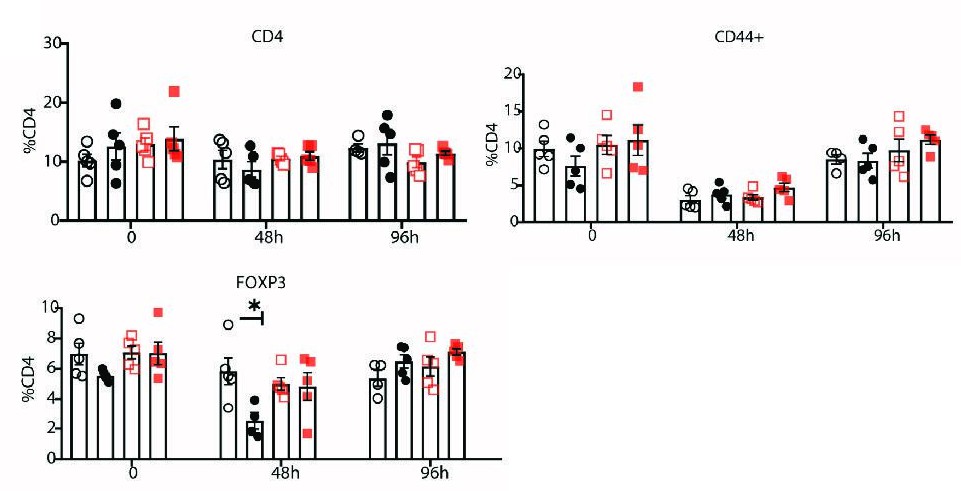
Flow cytometry measurement of indicated cell subsets in blood in mice 0, 48, and 96 hr after primary immunization with Col2.
Figure 3—figure supplement 2
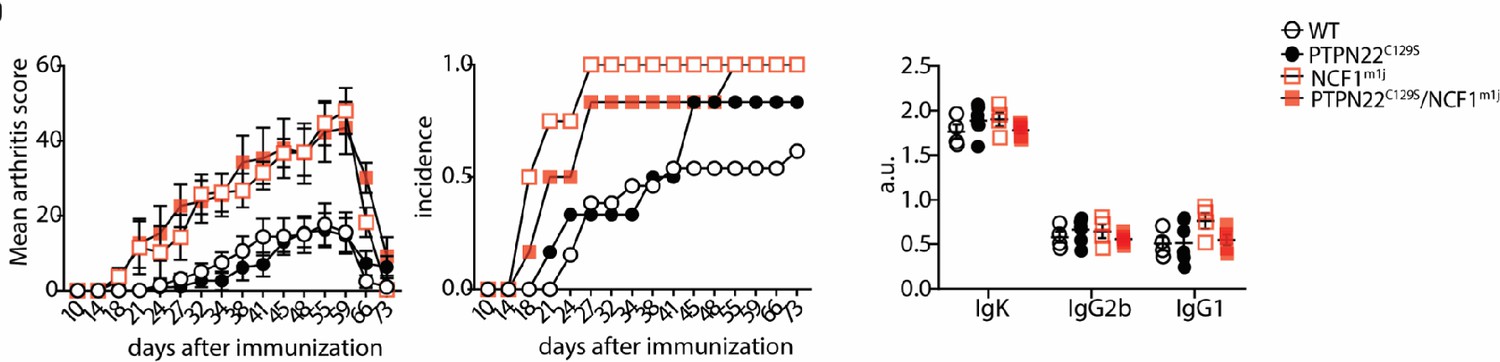
Clinical score (mean ± SEM), incidence, and serum antibody levels at termination of collagen-induced arthritis in littermate mice.
Figure 4
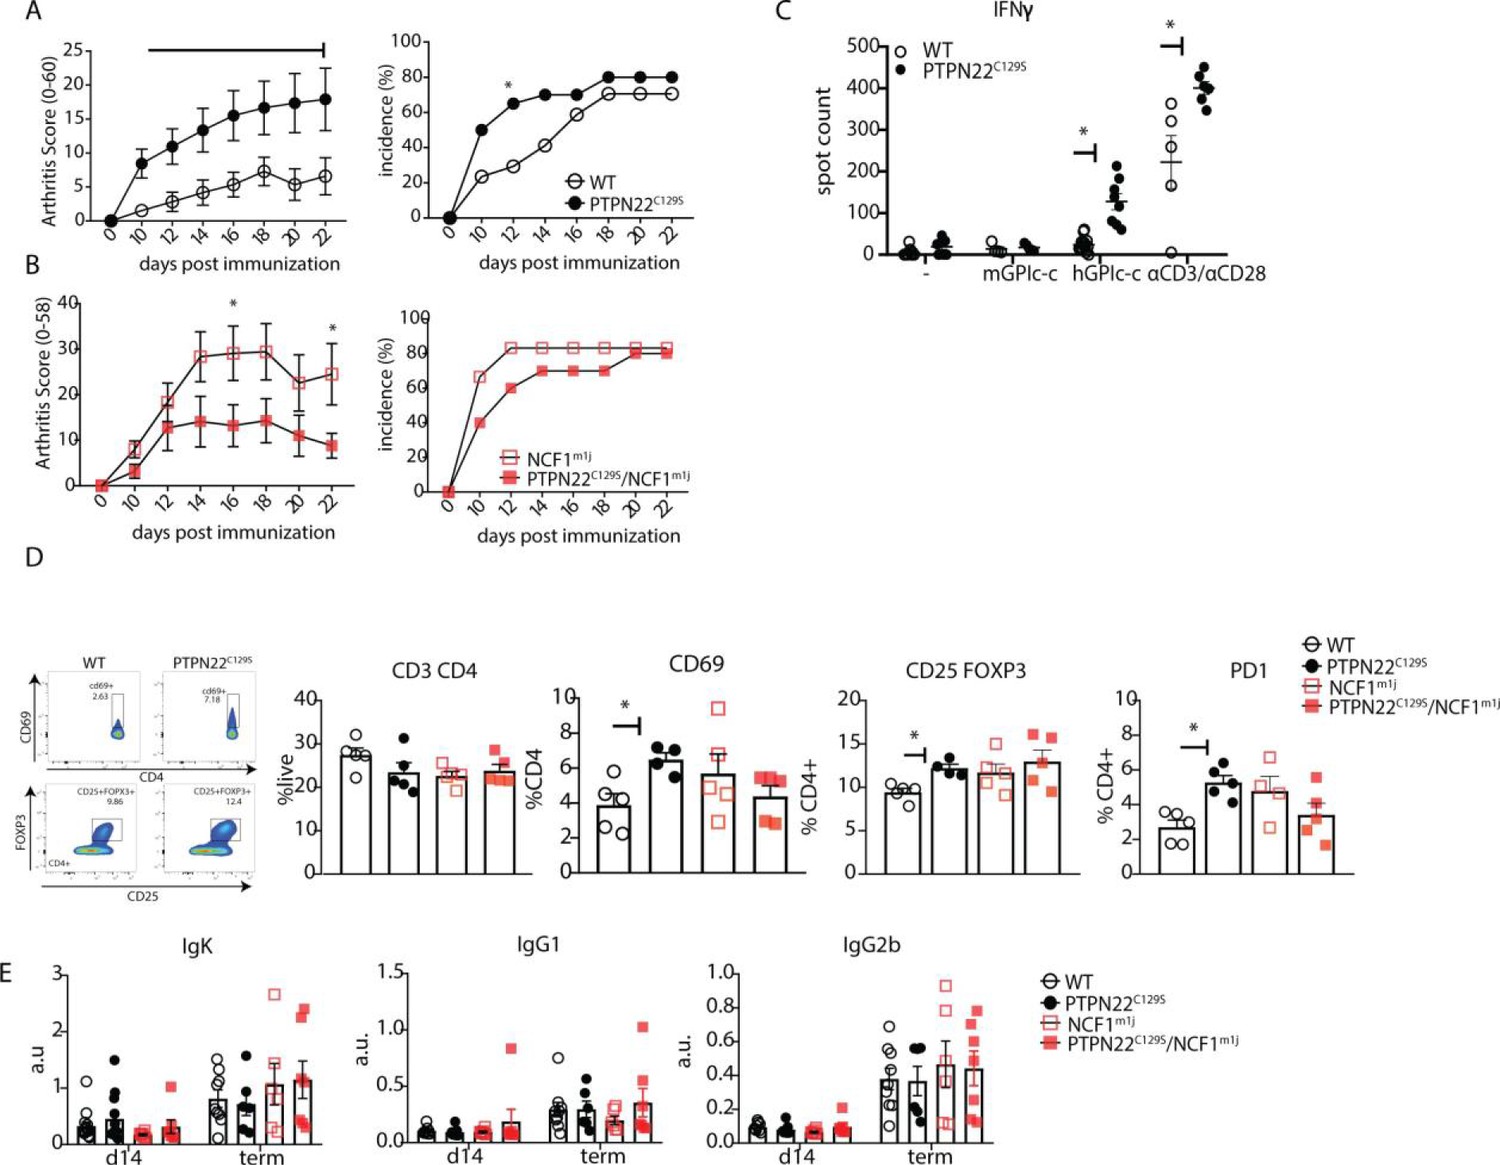
PTPN22C129S enhances arthritis development.
Arthritis was induced using human glucose-6-phosphate isomerase peptide (GPIp) and inflammation was monitored over 22 days. (A, B) Clinical score (mean ± SEM) and incidence of littermate WT (n = 17), PTPN22C129S (n = 20), NCF1m1J (n = 12), and PTPN22C129S/NCF1m1J (n = 10) mice immunized with GPIp. Data from two pooled experiments (two-way ANOVA). (C) Antigen-specific interferon-ɣ (IFNɣ) T cell response against mouse/human GPIp as well as anti-CD3/anti-CD28 in lymph nodes by ELISpot. (D) Percentages of indicated cell subsets in lymph nodes at measured by flow cytometry; representative gating for CD69 and CD25+ FOXP3+ cells shown. (E) Levels of serum antibodies against hGPI day 14 post immunization and at arthritis endpoint measured by ELISA. Error bars represent mean ± SEM.
Figure 5 with 2 supplements
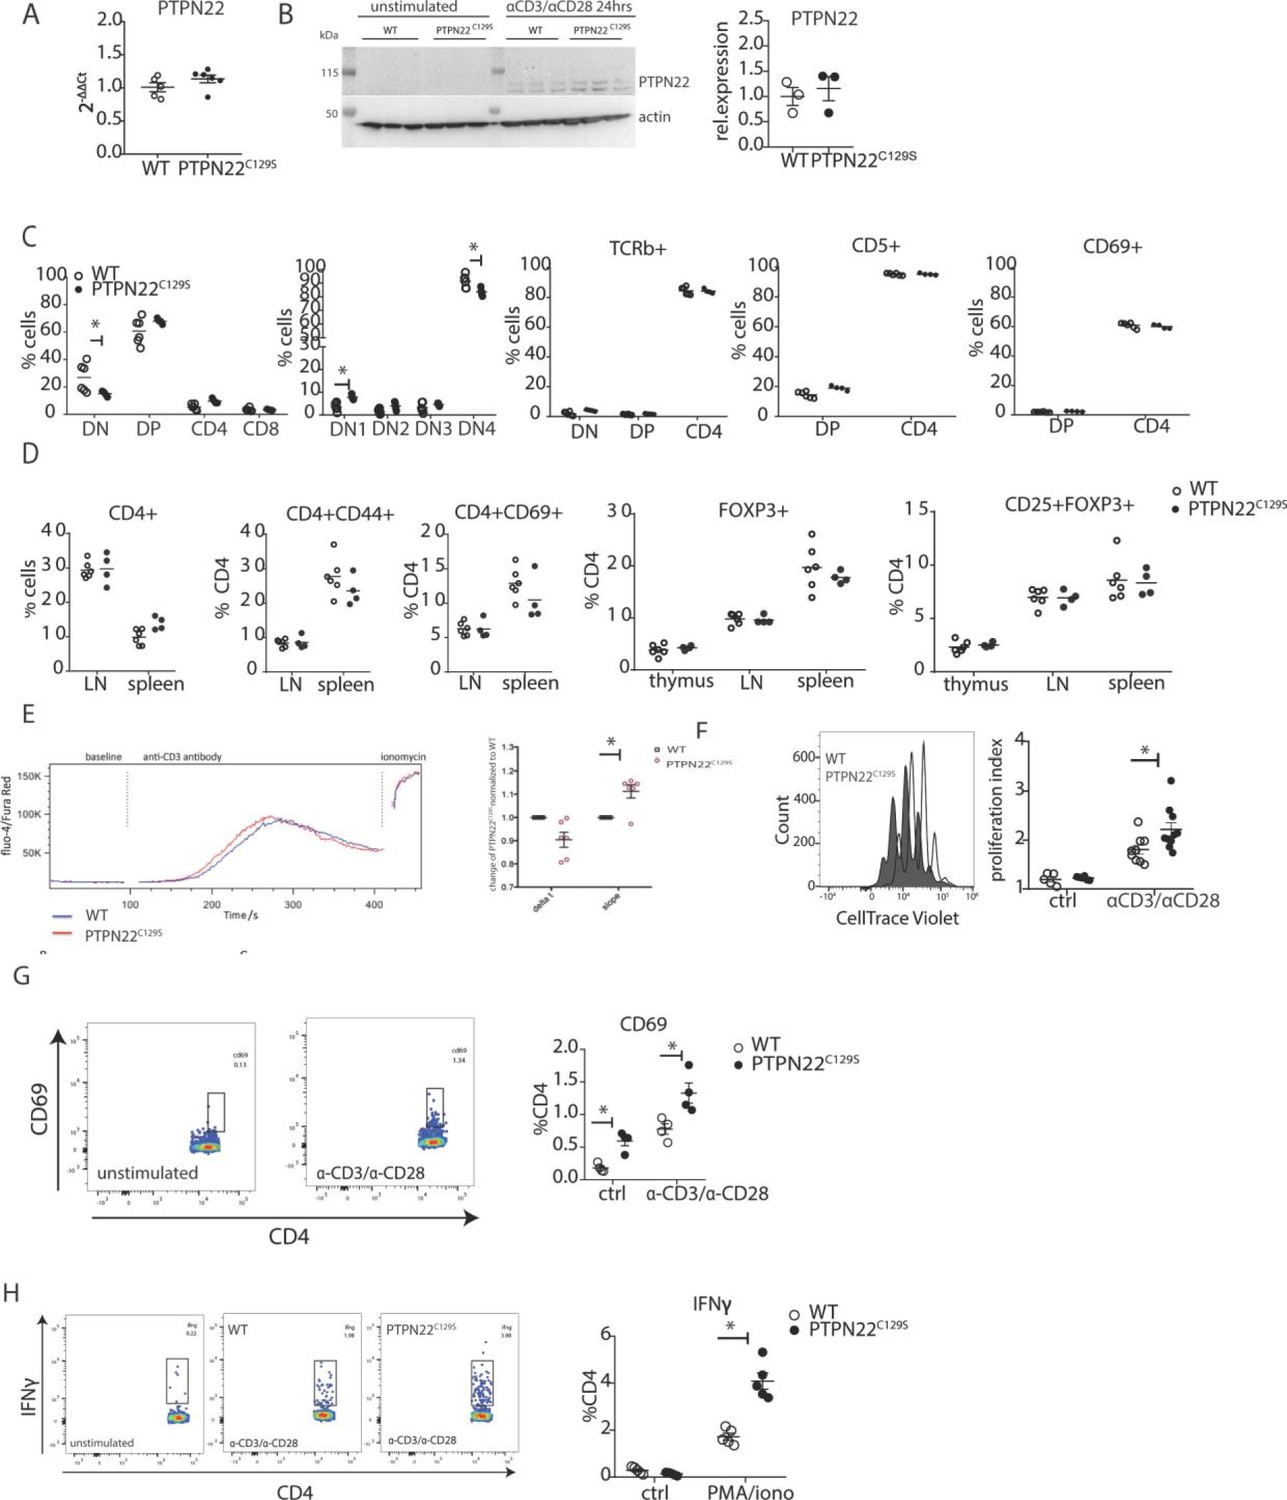
Enhanced activation and proliferation of PTPN22C129S T cells.
(A) Gene expression of PTPN22 in splenocytes shown as fold change over WT. (B) Immunoblot analysis of PTPN22 expression in sorted CD4 T cells either unstimulated or activated in vitro with 1 µg/ml anti-CD3/CD28 for 24 hr. Each lane shows cells from a distinct mouse, and relative expression to the right was calculated by normalizing to loading control (actin). (C, D) Analysis of T cell populations in naïve mice via flow cytometry. (C) Analysis of double negative (DN), double positive (DP), and single positive CD4 and CD8 thymic populations in 10-week-old littermate mice as well as expression of TCRb, CD5, and CD69 on various subsets. (D) Frequencies of activated (CD44+/ CD69+) and regulatory (FOXP3+) CD4+ T cells in thymus and secondary lymphoid organs. (E) Intracellular calcium measurement in CD4 T cells at baseline, after stimulation with anti-CD3, and ionomycin to achieve maximum Ca2+ influx via staining with Fluo4 and FuraRed. Shown is a representative image of the change in ratio of fluo4 to FuraRed expression over time (blue: wild-type; red: PTPN22C129S). Quantification to the right shows slope value that describes how fast the peak of Ca2+ influx is reached (Bajnok et al., 2013). (F) Proliferation of CD4+ T cells as assessed by CellTrace Violet dilution after 96 hr in vitro stimulation with 1 µg/ml anti-CD3/CD28. Proliferation Index is the total number of divisions divided by the number of cells that went into division. Representative proliferation peaks on the left (clear: wild-type; black: PTPN22C129S) and quantification on the right (ctrl refers to unstimulated samples). (G, H) Ex vivo-stimulated CD4 T cells were assessed for CD69 expression/IFNγ production after stimulation with anti-CD3/anti-CD28 or phorbol 12-myristate 13-acetate (PMA)/ionomycin, respectively. Representative gating shown. Error bars represent mean ± SEM.
-
Figure 5—source data 1
Uncropped Western blot images showing PTPN22 expression in CD4+ T cells.
- https://cdn.elifesciences.org/articles/74549/elife-74549-fig5-data1-v1.pptx
-
Figure 5—source data 2
Raw images of PTPN22 expression in CD4+ T cells.
- https://cdn.elifesciences.org/articles/74549/elife-74549-fig5-data2-v1.zip
Figure 5—figure supplement 1
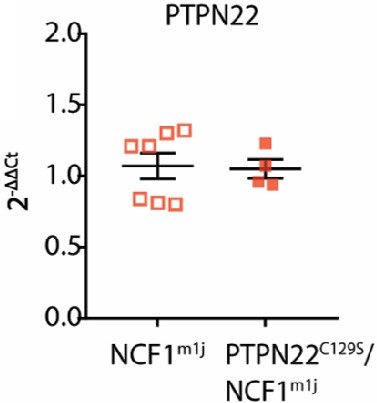
Gene expression of PTPN22 in splenocytes from NCF1m1J and PTPN22C129S/NCF1m1J mice shown as fold change over NCF1m1J.
Figure 5—figure supplement 2
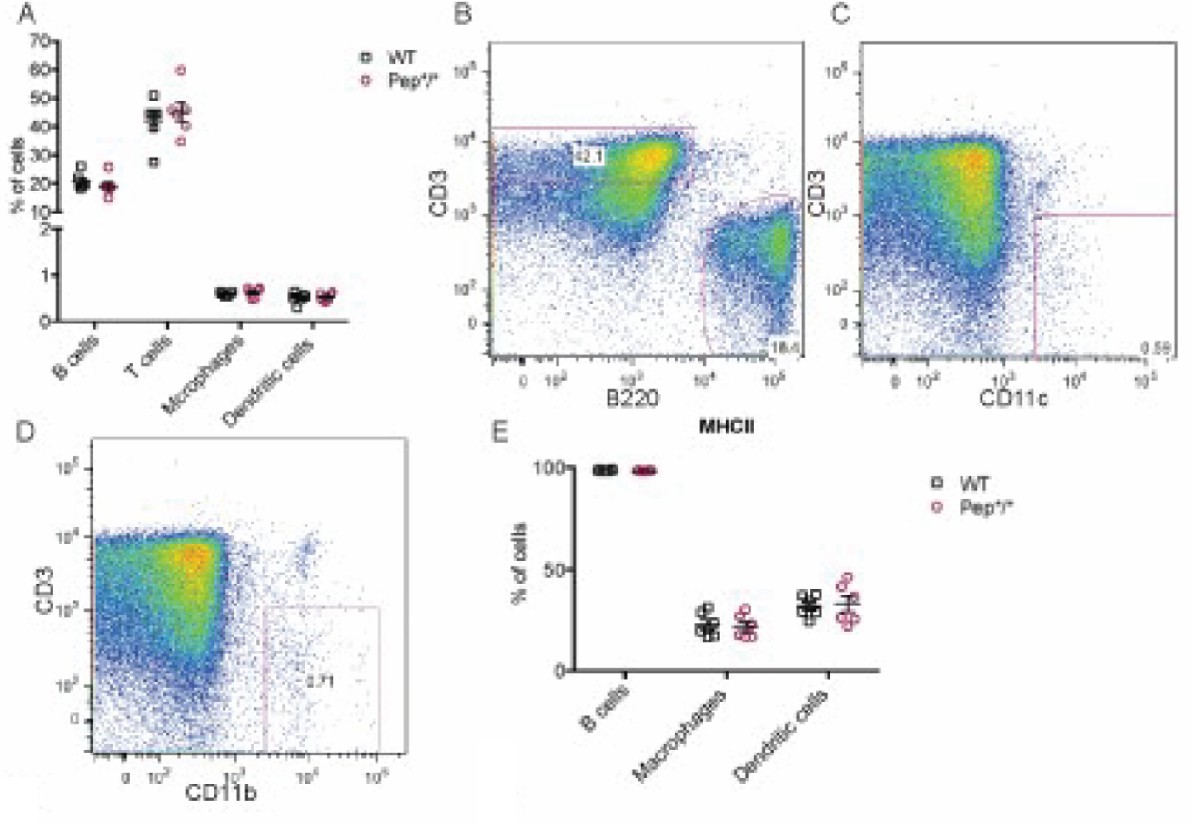
Percentage of B cells (B220+), T cells (CD3+), macrophages (CD11B+), and dendritic cells (CD11B+) in peripheral lymphoid organs as well as major histocompatibility complex (MHC) II expression on B cells, macrophages, and dendritic cells.
Figure 6
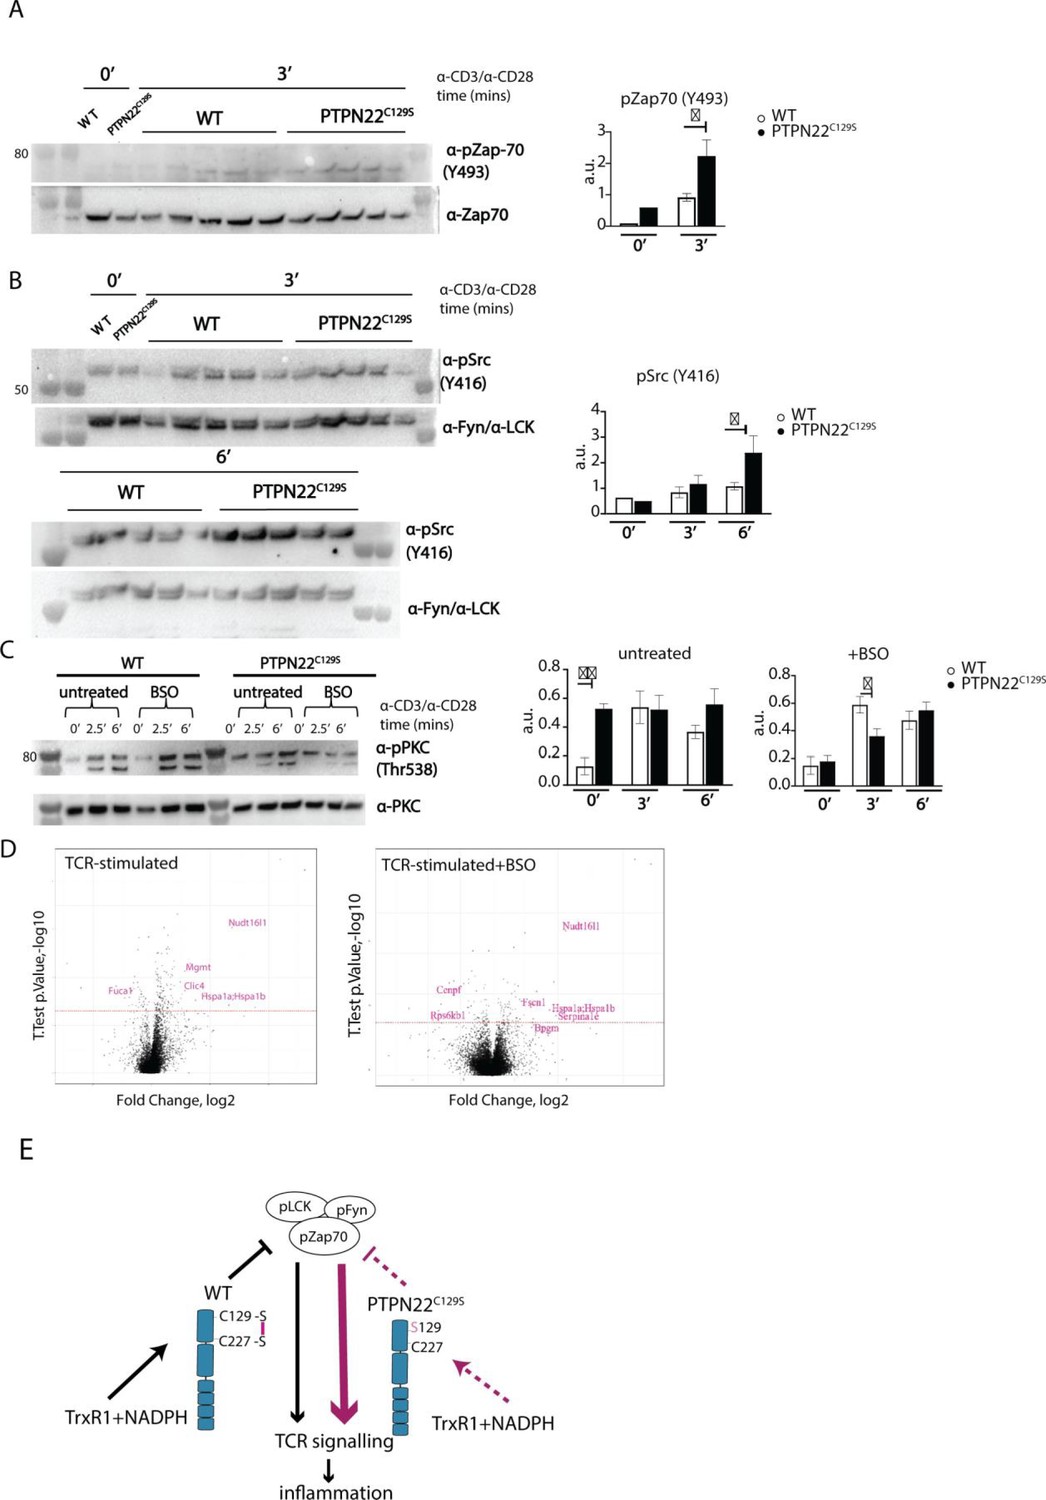
Enhanced phosphorylation of PTPN22C129S targets and increased PKCθ expression.
(A, B) Lymph node cells were stimulated for indicated time points with anti-CD3 plus anti-CD28, and phosphorylation was detected via immunoblotting of total cell lysates with antibodies against activated Zap-70 (A) and Src kinases (B). Antibody against p-Src (Y416) binds to Lck Y394 and Fyn Y417 with the top band representing pFyn and the bottom band pLCK, see Davidson et al., 2016. Each lane reflects distinct wild-type/PTPN22C129S mice and unlabeled lanes show molecular weight markers. Quantification to the right was calculated as phosphorylation signal/total signal normalized to loading control. (C) Lymph node cells were cultured 24 hr with/without buthionine sulphoximine (BSO), a glutathione depletion agent, before in vitro activation with anti-CD3 plus anti-CD28 for indicated time points. Total lysate was analyzed for PKCθ expression via immunoblotting. Representative image shown. Quantification to the right was calculated as phosphorylation signal/total signal normalized to loading control (WT = 6, PTPN22C129S = 8). (D) Volcano plots comparing the proteomic profile of sorted CD4+ T cells from wild-type and PTPN22C129S mice, which were stimulated with anti-CD3 plus anti-CD28 for 5 hr either with or without prior treatment (24 hr) with BSO. Four mice per group were used for proteomic analysis, and p-values were calculated by Welch’s t-test. Proteins that were significantly up/downregulated in PTPN22C129S mutants are highlighted in red. (E) A proposed model for redox regulation of PTPN22 in vivo: upon oxidative pressure within the cell, C227 of PTPN22 forms a disulfide bond with the back-door cysteine C129 as a means of protection from irreversible oxidation and inactivation. When the C227-C129 bond cannot be formed, as is the case in PTPN22C129S mutant, PTPN22 is less sensitive to reactivation by the thioredoxin system, which leads to increased T cell receptor (TCR) signaling and inflammation. Error bars represent mean ± SEM.
-
Figure 6—source data 1
Uncropped Western blot images showing phosphorylation of ZAP70, Src, and PKC upon CD3/CD28 stimulation.
- https://cdn.elifesciences.org/articles/74549/elife-74549-fig6-data1-v1.pptx
-
Figure 6—source data 2
Raw images of ZAP70, Fyn, and LCK expression.
- https://cdn.elifesciences.org/articles/74549/elife-74549-fig6-data2-v1.zip
-
Figure 6—source data 3
Raw images of pZap70 and pSrc expression.
- https://cdn.elifesciences.org/articles/74549/elife-74549-fig6-data3-v1.zip
-
Figure 6—source data 4
Raw images of pPKC expression.
- https://cdn.elifesciences.org/articles/74549/elife-74549-fig6-data4-v1.zip
-
Figure 6—source data 5
Raw data from proteomics analysis.
- https://cdn.elifesciences.org/articles/74549/elife-74549-fig6-data5-v1.xlsx
Additional files
-
Supplementary file 1
Primers used in the study.
- https://cdn.elifesciences.org/articles/74549/elife-74549-supp1-v1.docx
-
Supplementary file 2
Antibody list.
- https://cdn.elifesciences.org/articles/74549/elife-74549-supp2-v1.docx
-
Transparent reporting form
- https://cdn.elifesciences.org/articles/74549/elife-74549-transrepform1-v1.docx
Download links
A two-part list of links to download the article, or parts of the article, in various formats.
Downloads (link to download the article as PDF)
Open citations (links to open the citations from this article in various online reference manager services)
Cite this article (links to download the citations from this article in formats compatible with various reference manager tools)
Redox regulation of PTPN22 affects the severity of T-cell-dependent autoimmune inflammation
eLife 11:e74549.
https://doi.org/10.7554/eLife.74549


