Non-canonical function of an Hif-1α splice variant contributes to the sustained flight of locusts
Figures
Figure 1 with 3 supplements
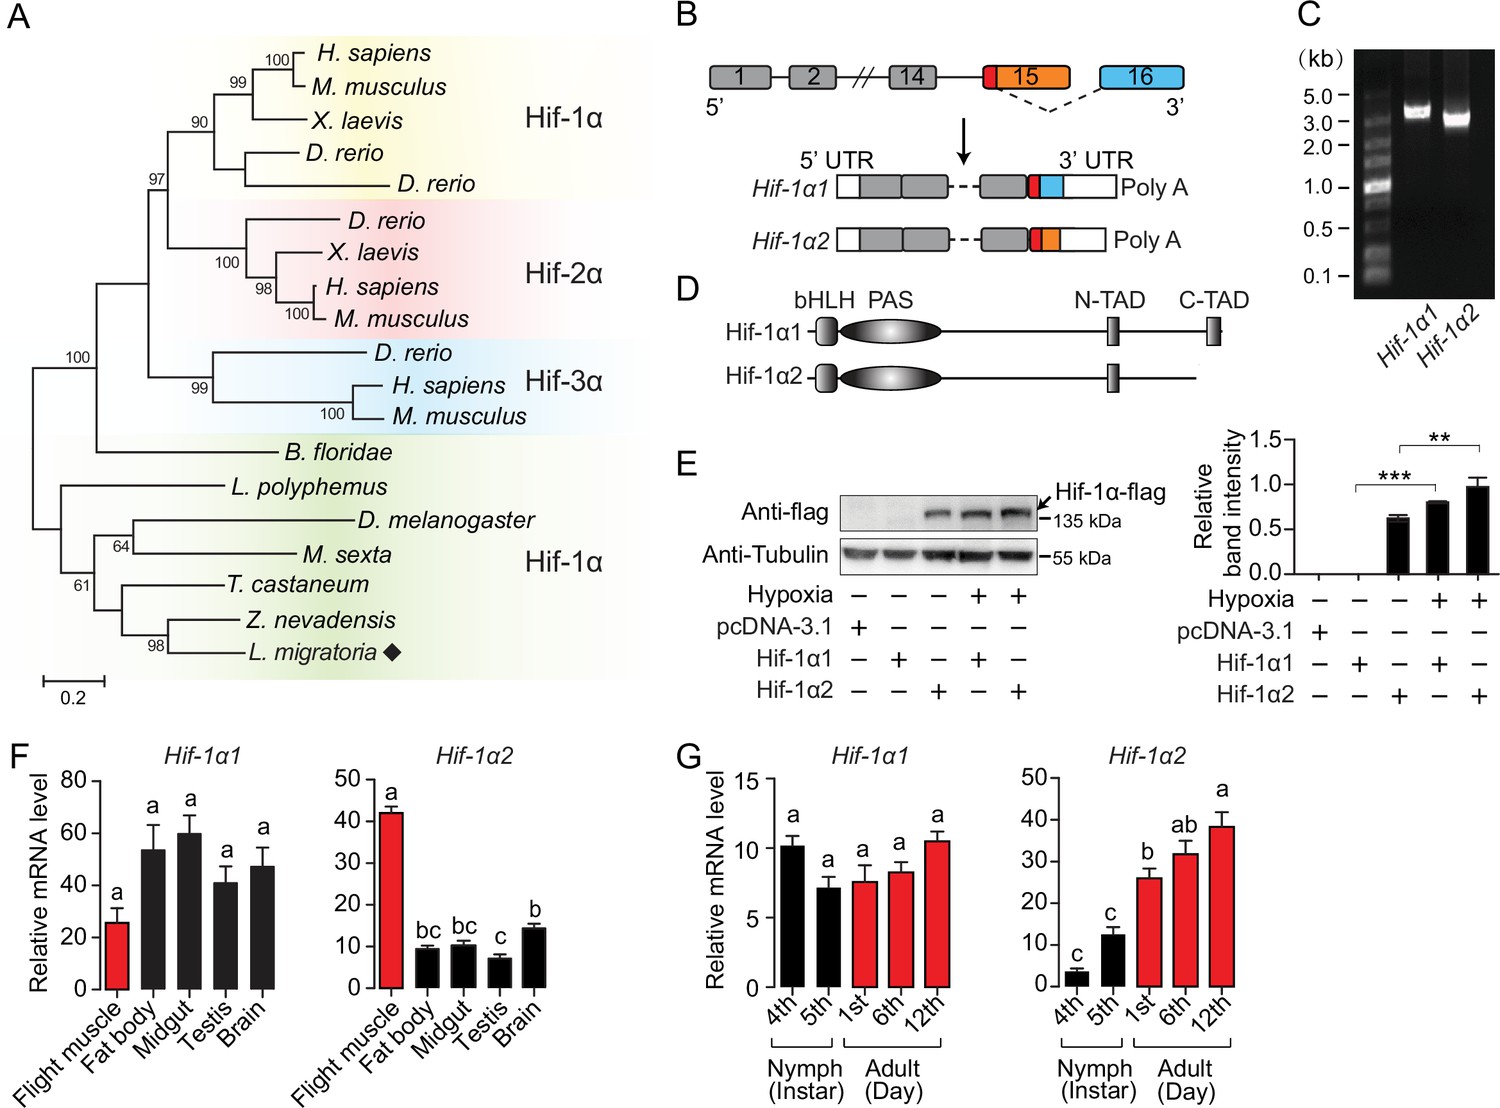
An oxygen-insensitive Hif-1α isoform is identified in locusts.
(A) Phylogenetic tree construction of Hif-α. Amino acid sequences of Hif-α family genes from Homo sapiens, Mus musculus, Xenopus laevis, Danio rerio, Branchiostoma floridae, Limulus polyphemus, Zootermopsis nevadensis, Tribolium castaneum, Manduca sexta, Drosophila melanogaster, and Locusta migratoria were used for analysis. One thousand bootstraps were performed. Only bootstrap values of over 60 are shown. (B) Schematic of Hif-1α and its two alternatively spliced isoform mRNAs, Hif-1α1 and Hif-1α2. (C) Hif-1α1 and Hif-1α2 mRNA expression analyzed by RT-PCR. (D) Schematic of Hif-1α1 and Hif-1α2 proteins. (E) In vitro expression of Hif-1α1 and Hif-1α2 under different oxygen concentrations. As shown in the Western blotting, Hif-1α2 protein is detectable in normoxia and hypoxia (1% O2), while Hif-1α1 is detectable only in hypoxia (n=3 replicates). (F) Tissue distributions of Hif-1α1 and Hif-1α2 (n=3 replicates, 5 locusts/replicate). (G) Expression profiles of Hif-1α1 and Hif-1α2 in thoracic muscle during development (fourth- and fifth-instar nymphs and first-, sixth-, and 12th-day adults; n=4 replicates, 5 locusts/replicate). The values of the columns are shown as mean ± standard error (s.e.m.). One-way ANOVA with Bonfferroni’s test for multiple comparisons, significant differences are denoted by different letters or **p<0.01 and ***p<0.001.
-
Figure 1—source data 1
Raw data for spatiotemporal expression profiles of Hif-1α1 and Hif-1α2.
- https://cdn.elifesciences.org/articles/74554/elife-74554-fig1-data1-v1.xlsx
-
Figure 1—source data 2
Raw data for mRNA and protein expression levels of Hif-1α1 and Hif-1α2.
- https://cdn.elifesciences.org/articles/74554/elife-74554-fig1-data2-v1.docx
Figure 1—figure supplement 1
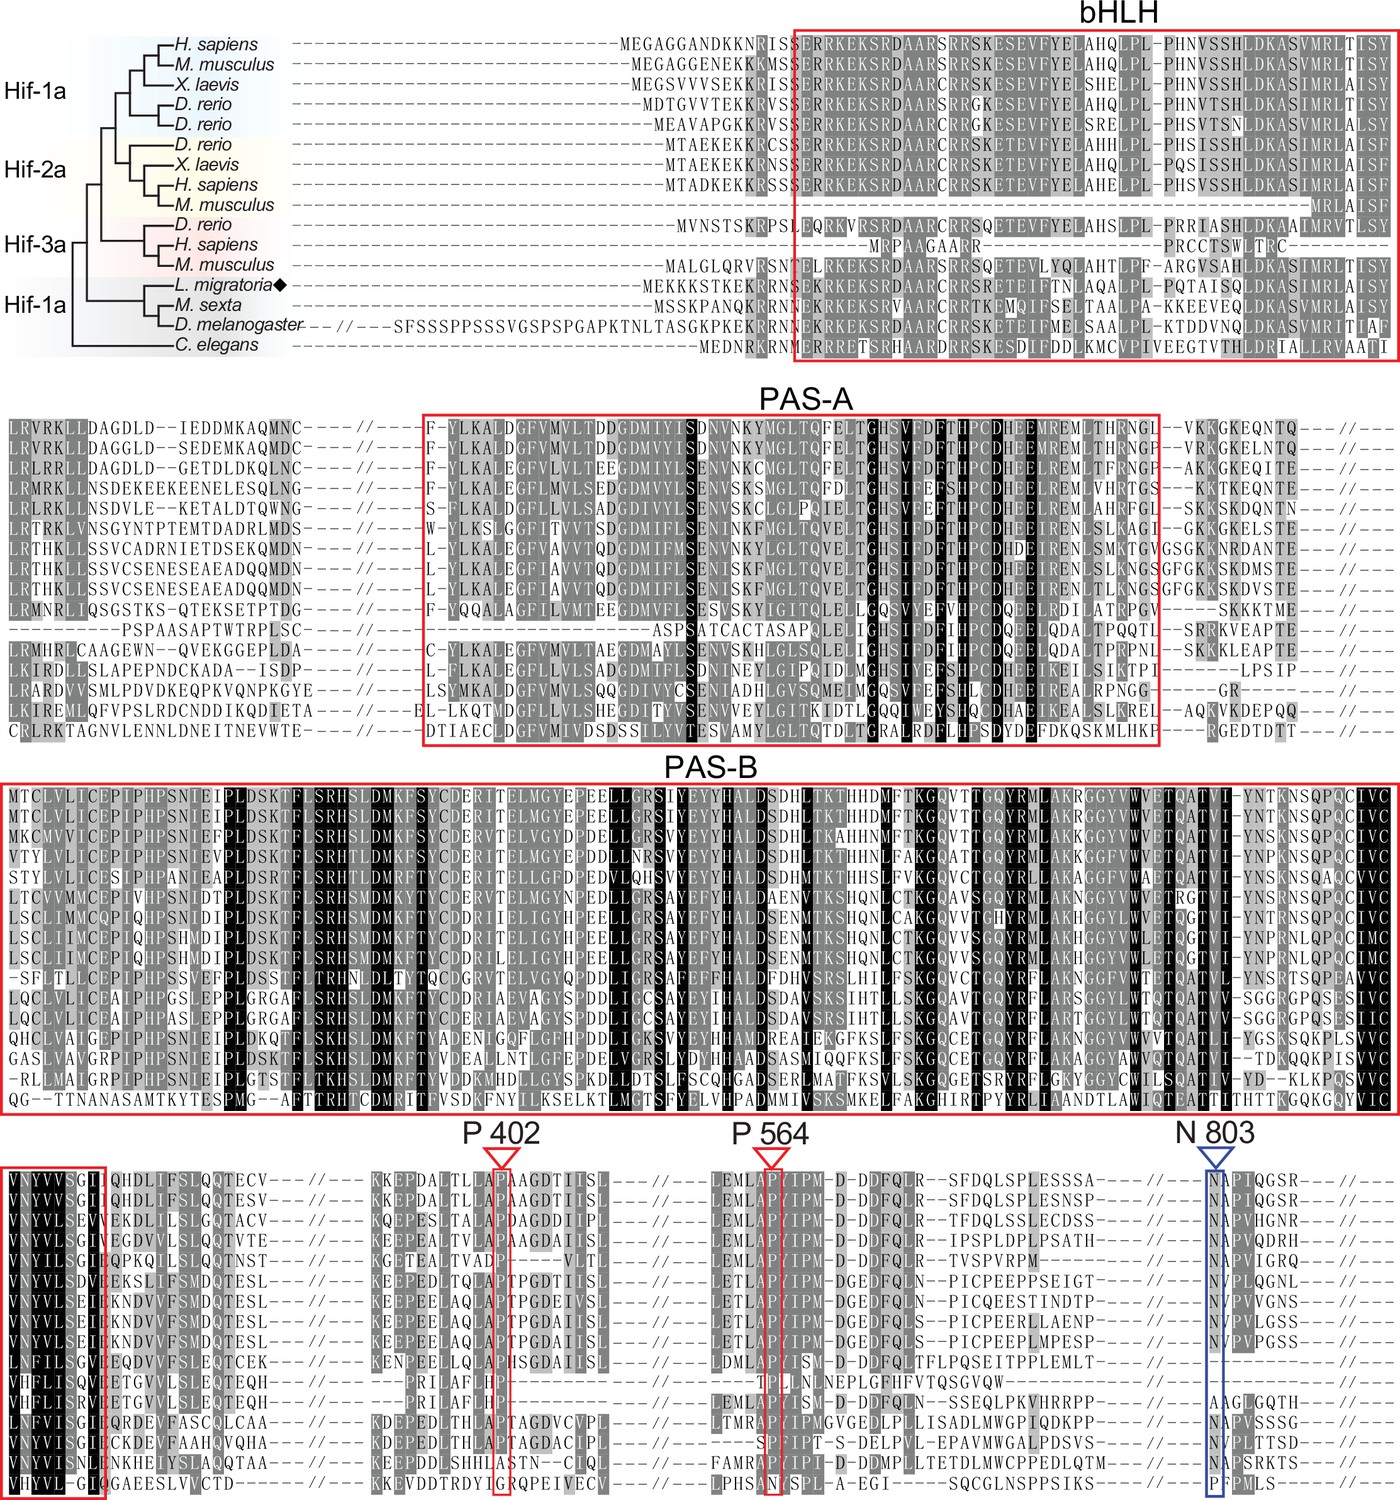
Amino acid alignment of Hif-α in different species.
Alignment among Homo sapiens, Mus musculus, Xenopus laevis, Danio rerio, Manduca sexta, Drosophila melanogaster, Caenorhabditis elegans, and Locusta migratoria on MEGA 5.0 and GENEDOC. The region in red box represents the functional domains of Hif-α, the prolyl hydroxylase (PHD) targeting amino acid residues are noted by red triangles, and the factor-inhibiting Hif (FIH) targeting amino acid residue is noted by a blue triangle.
Figure 1—figure supplement 2
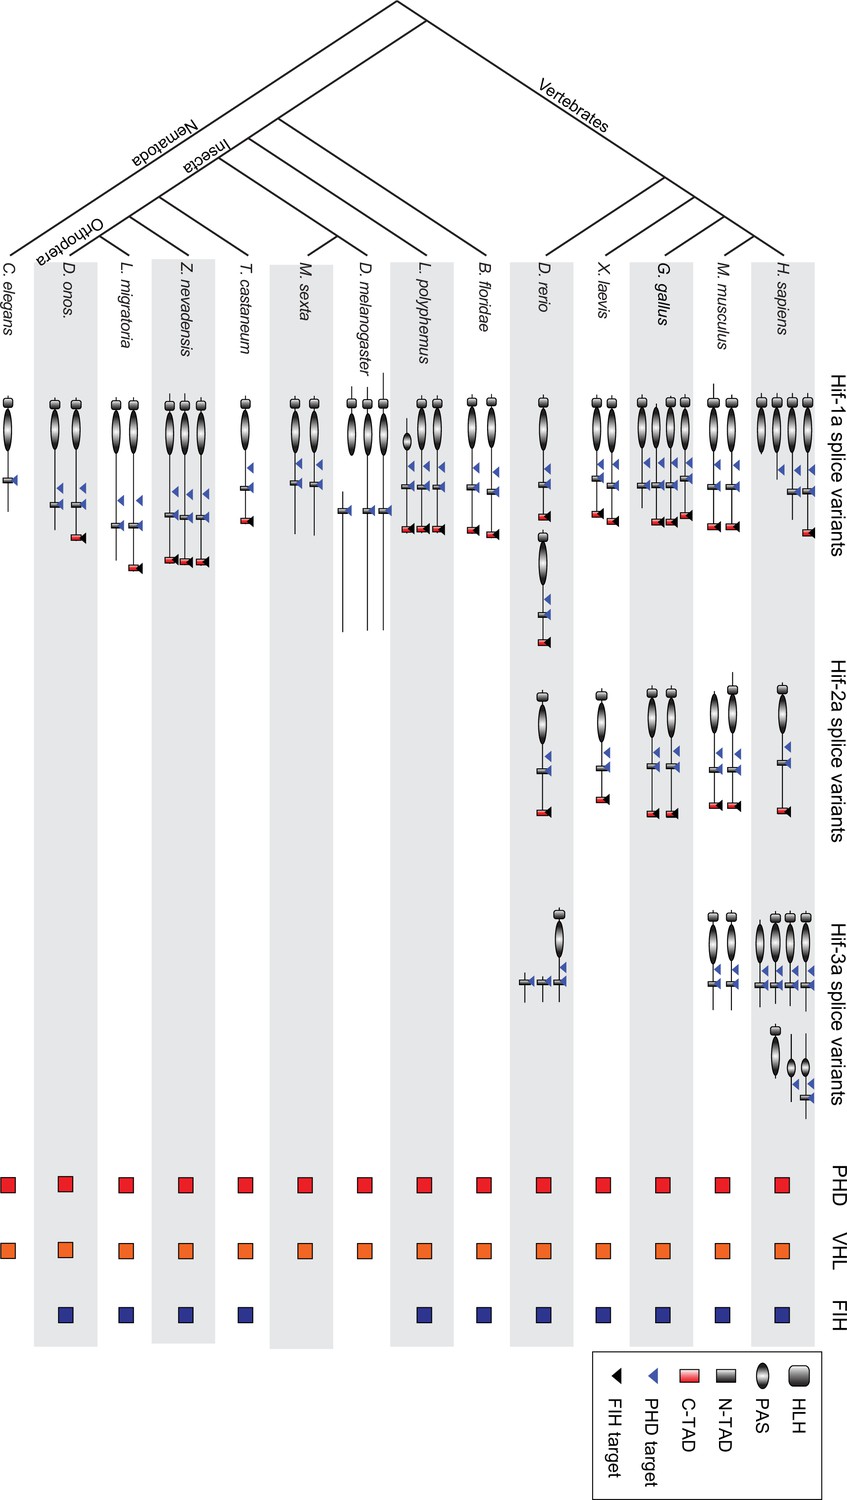
Phylogenetic analysis of Hif-α splice variants across metazoans.
Protein domains are predicted by the Protein Families database. Amino acid sequences of Hif-α family genes from Homo sapiens, Mus musculus, Gallus gallus, Xenopus laevis, Danio rerio, Branchiostoma floridae, Limulus polyphemus, Zootermopsis nevadensis, Tribolium castaneum, Manduca sexta, Drosophila melanogaster, Caenorhabditis elegans, Locusta migratoria, and Deracantha onos were used for analysis. bHLH, basic helix–loop–helix; PAS, Per–Arnt–Sim; N-TAD, N-terminal transcriptional activation domain; C-TAD, C-terminal transcriptional activation domain; PHD, prolyl hydroxylase; VHL, von Hippel Lindau protein; FIH, factor-inhibiting Hif. The colored boxes represent the presence and absence of PHD, VHL and FIH homologues in these taxa at the genomic level.
Figure 1—figure supplement 3
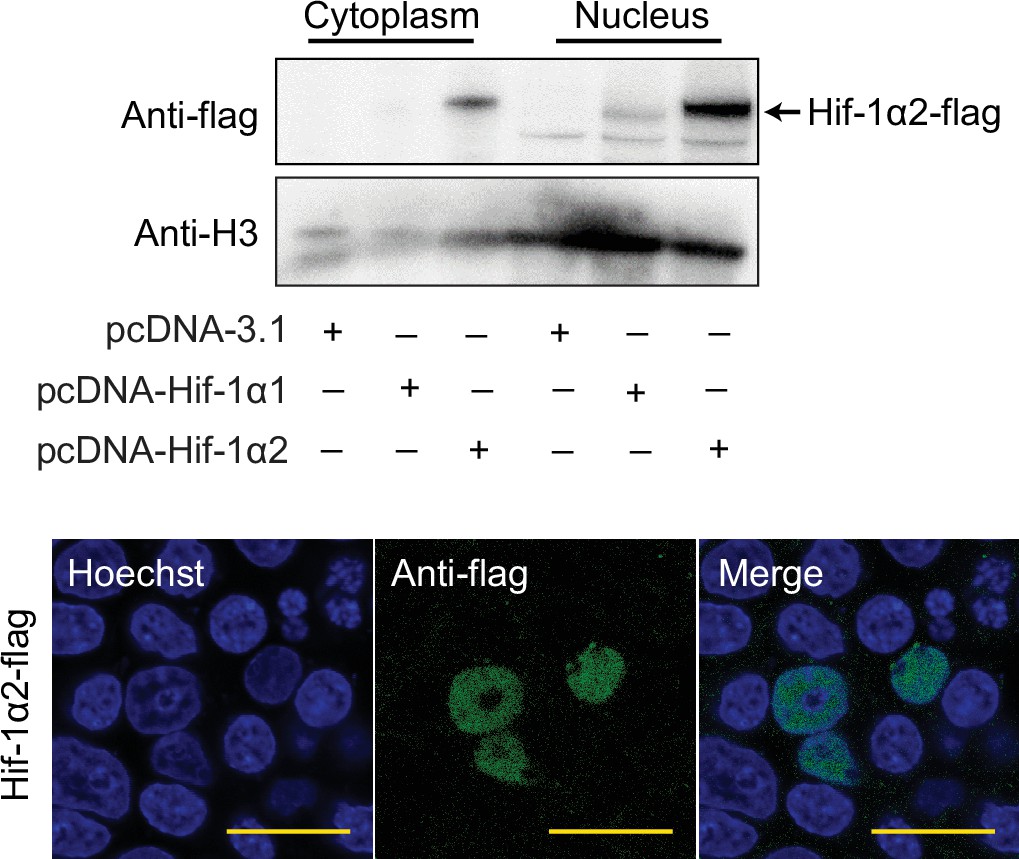
Western blot and immunofluorescence analysis showing the protein of overexpressed Hif-1α2 is located in the nucleus of HEK293T cell in normoxia.
HEK293T cells were transfected with pcDNA-3.1 carrying specific locust Hif-1α1 or Hif-1α2 genes. For immunofluorescence analysis, cells were stained with flag-tag antibody, followed by an Alexa Fluor 488-conjugated anti-mouse IgG (green) at 36 hr post transfection. The cell nuclei were stained with Hoechst (blue). Scale bars: 50 µm.Supplementary file 1.
Figure 2 with 3 supplements
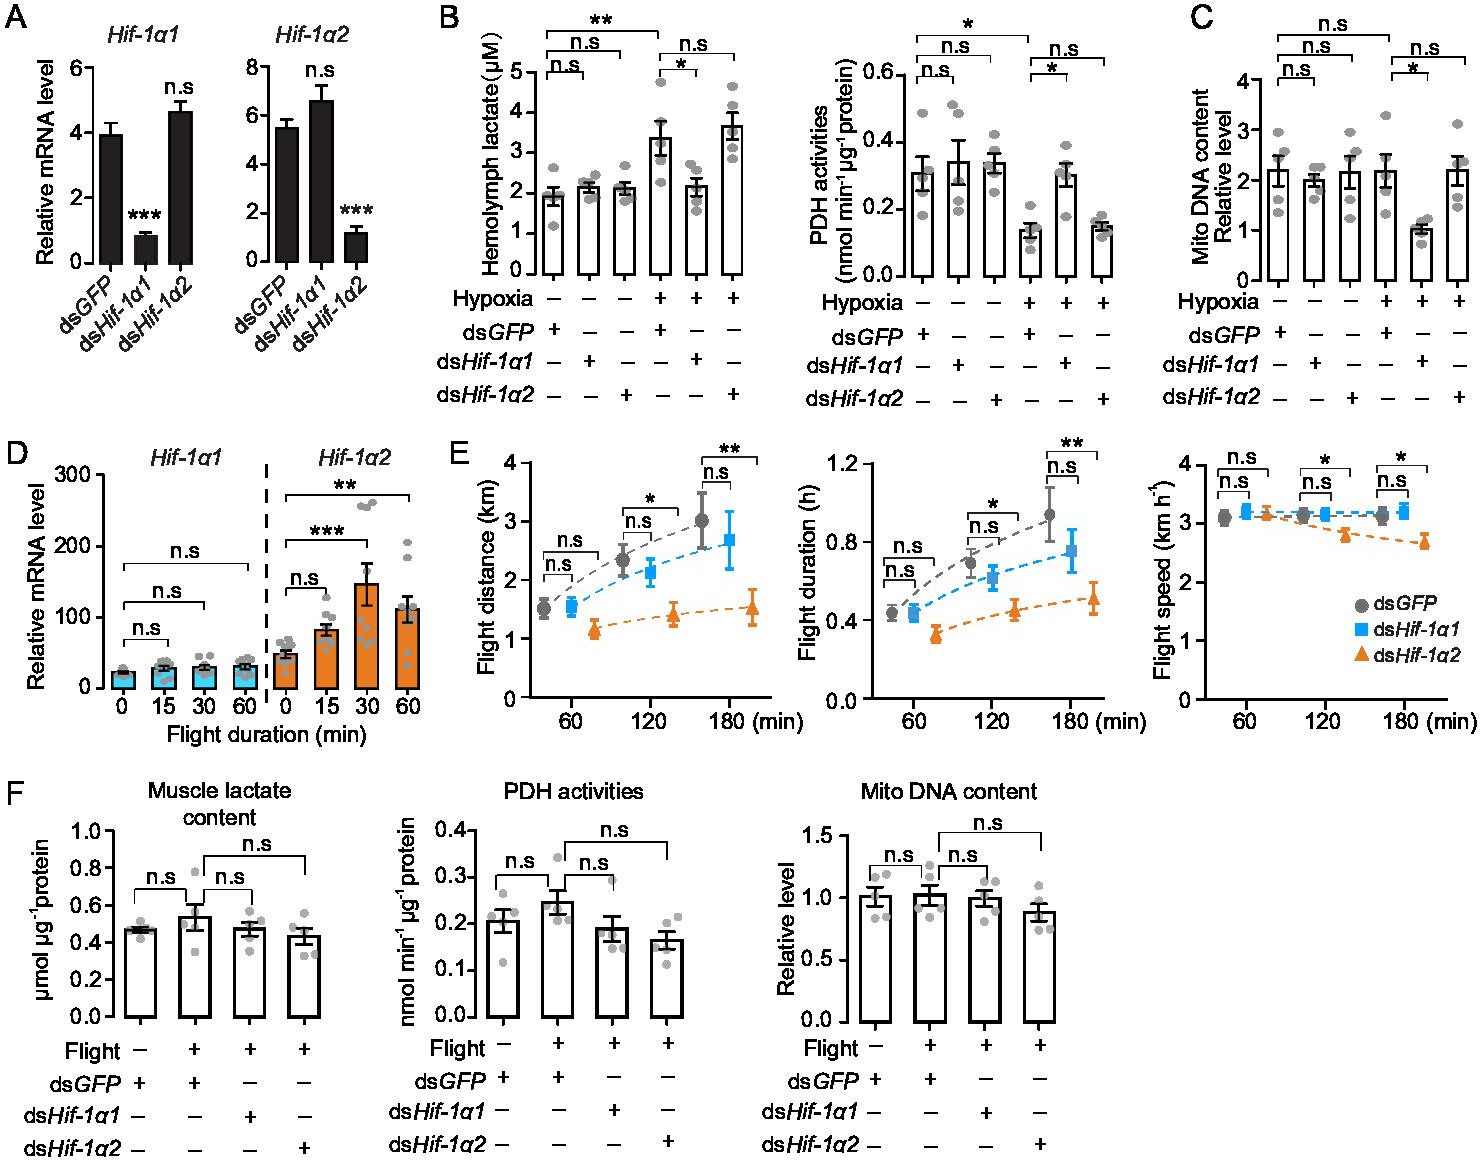
Hif-1α1 regulates systematic hypoxic responses, Hif-1α2 is critical for prolonged flight.
(A) Knockdown of Hif-1α1 and Hif-1α2 via injections of dsHif-1α1 and dsHif-1α2, with dsGFP-injected groups as control (n=5 replicates, 3 locusts/replicate). (B) Hemolymph lactate production and pyruvate dehydrogenase (PDH) activity tests upon short-term hypoxic (3.5 kPa PO2 for 2 hr) exposure (n=5 replicates, 3 locusts/replicate). (C) Mitochondrial DNA copy number measurements upon long-term hypoxic (3.5 kPa PO2 for 13 hr) exposure (n=5 replicates, 3 locusts/replicate). (D) Expression levels of Hif-1α1 and Hif-1α2 under flight treatment (n=9 replicates, 1 locust/replicate). (E) Flight performance tests, data for each time point was obtained independently (n≥34). (F) Muscle lactate level, PDH activity, and mitochondrial DNA copy number measurements upon flight treatment (n=5 replicates, 3 locusts/replicate). (A and E) Student’s t-test for pairwise comparisons, with dsGFP-injected groups as control. (B, D, and F) One-way ANOVA with Bonfferroni’s test for multiple comparisons. Values are mean ± s.e.m. Significant differences are denoted by *p<0.05, **p<0.01, and ***p<0.001; n.s. represents no significant difference.
-
Figure 2—source data 1
Raw data for mRNA expression profile of Hif-1α1 and Hif-1α2 under flight treatment.
Raw data for lactate content, pyruvate dehydrogenase (PDH) activity, mitochondrial DNA copy number measurement, and flight performance test in the absence of Hif-1α1 and Hif-1α2, respectively.
- https://cdn.elifesciences.org/articles/74554/elife-74554-fig2-data1-v1.xlsx
Figure 2—figure supplement 1
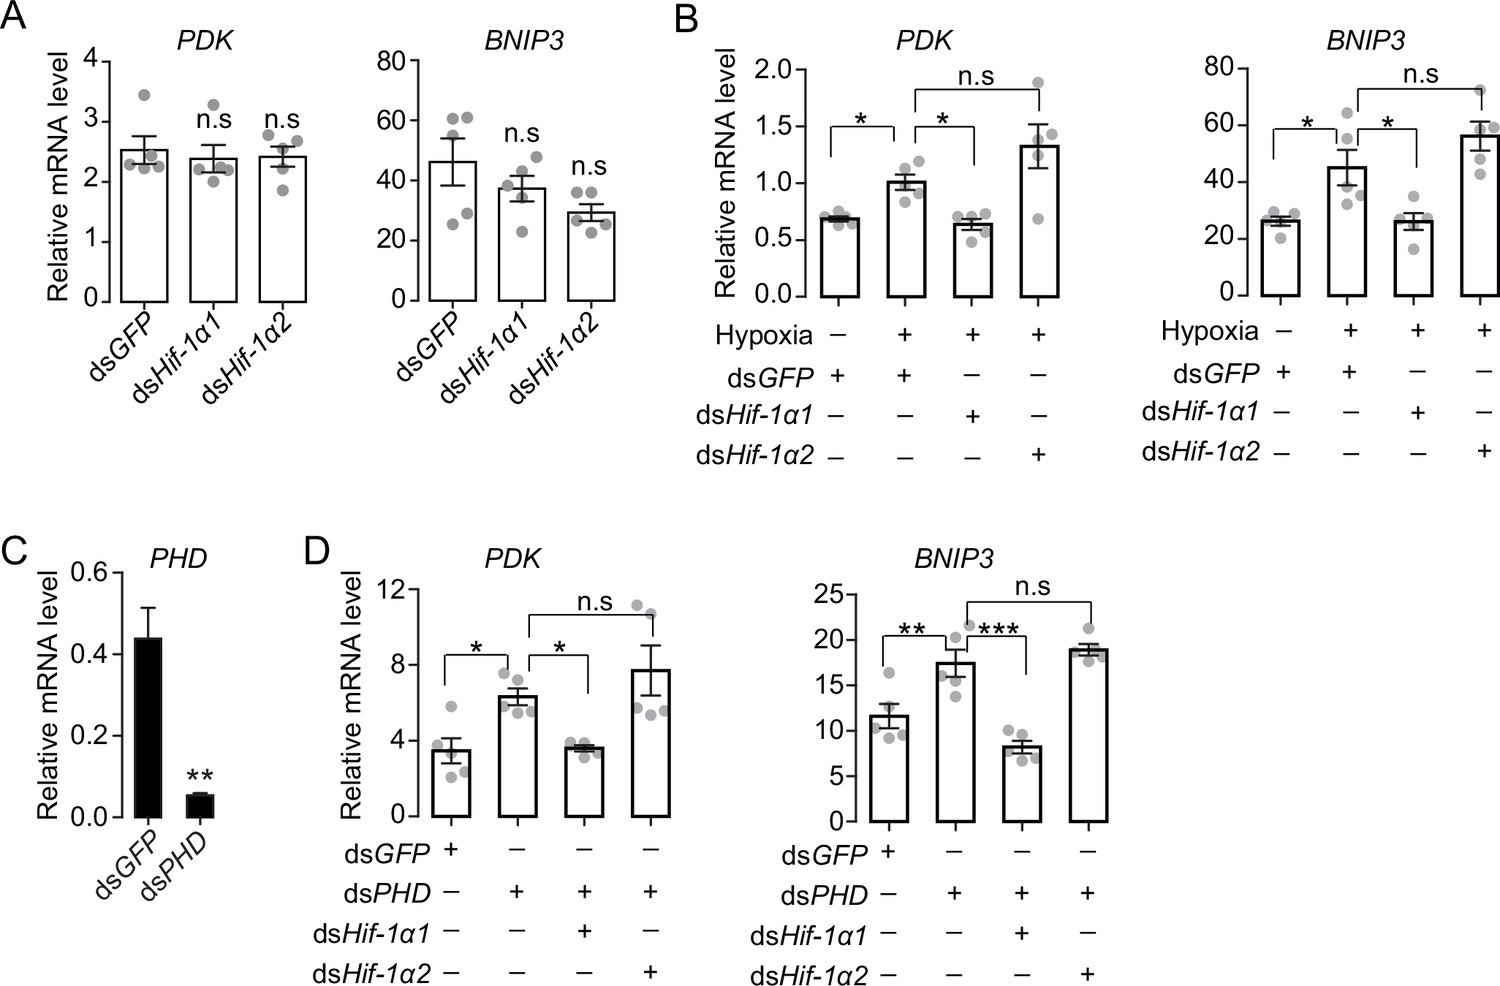
Hif-1α1 regulates metabolic reprogramming upon hypoxic exposure.
(A) Knockdown of Hif-1α1 and Hif-1α2 had no effect on PDK and BNIP3 gene expression in normoxia (n=5 replicates, 3 locusts/replicate). (B) Hypoxia (3.5 kPa PO2 for 2 hr)-induced upregulations of PDK and BNIP3 mediated by Hif-1α1 but not Hif-1α2 (n=5 replicates, 3 locusts/replicate). (C) Prolyl hydroxylases (PHD) knockdown efficiency test (n=5 replicates, 3 locusts/replicate). (D) Attenuation of PHD silencing-induced upregulations of PDK and BNIP3 by knockdown of Hif-1α1 (n=5 replicates, 3 locusts/replicate). One-way ANOVA with Bonfferroni’s test for multiple comparisons. Values are mean ± s.e.m. Significant differences are denoted by *p<0.05, **p<0.01, and ***p<0.001; n.s. represents no significant difference.
-
Figure 2—figure supplement 1—source data 1
Raw data for PDK and BNIP3 expression levels under hypoxic treatment.
- https://cdn.elifesciences.org/articles/74554/elife-74554-fig2-figsupp1-data1-v1.xlsx
Figure 2—figure supplement 2
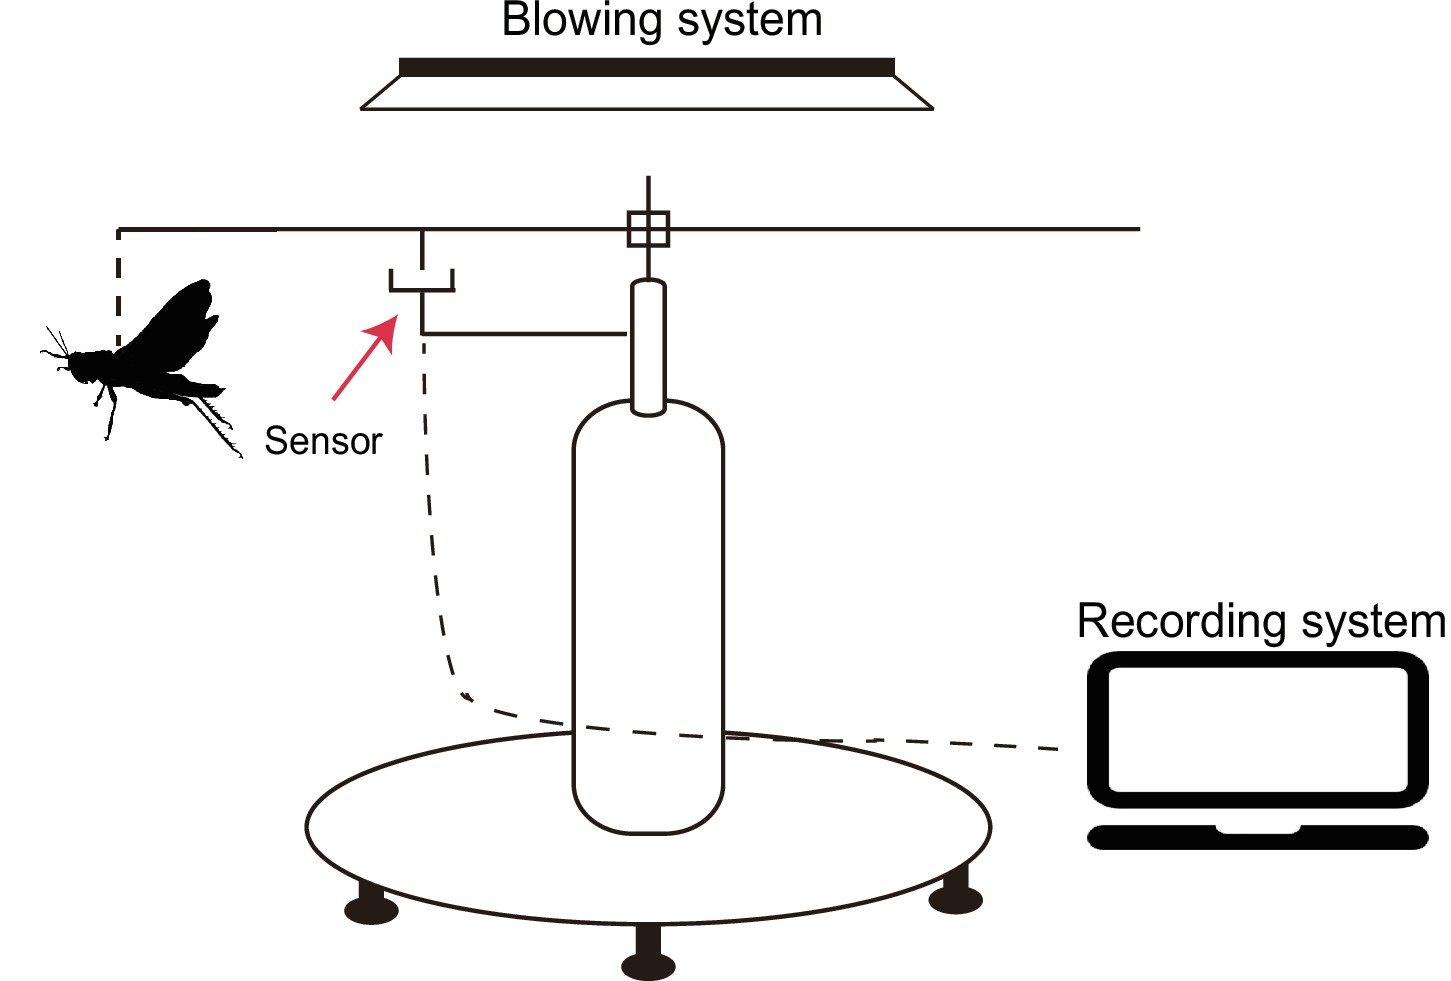
Schematic diagram of a flight mill.
Figure 2—figure supplement 3
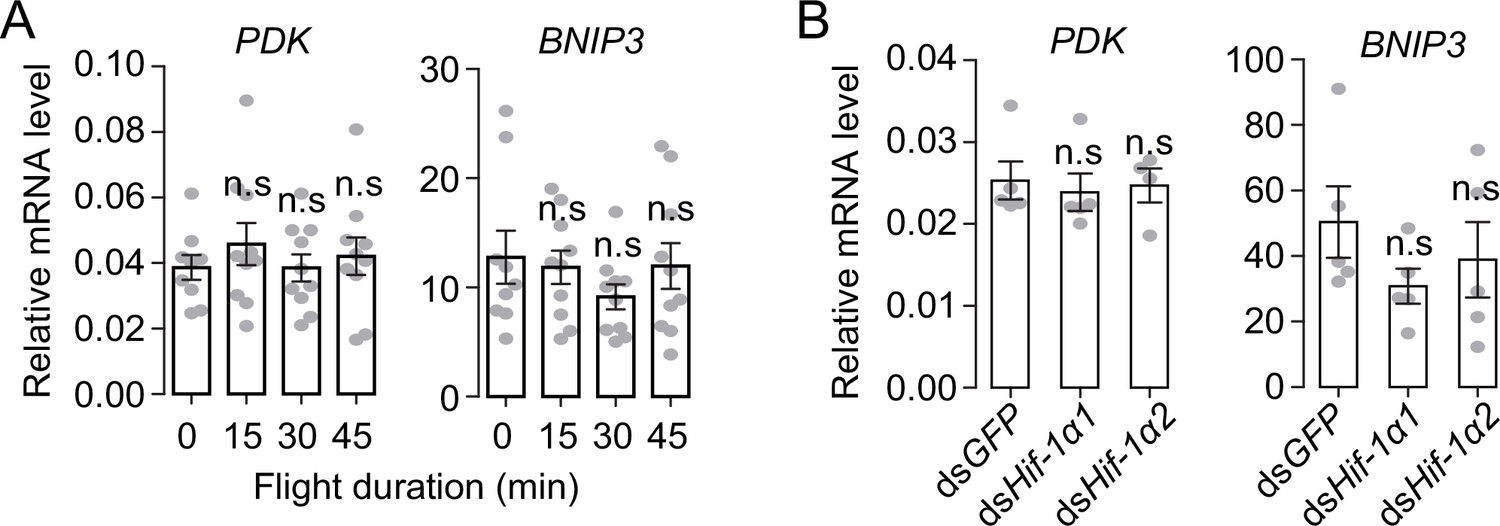
The Hif-1α1-mediated hypoxic responses cannot be triggered by flight.
(A) Expression levels of PDK and BNIP3 upon flight induction (n=9 replicates, 1 locust/replicate). (B) No effect of the knockdown of Hif-1α1 and Hif-1α2 during flight on the mRNA expression levels of PDK and BNIP3 (n=5 replicates, 3 locusts/replicate). Values are mean ± s.e.m. n.s. represents no significant difference (Student’s t-test).
-
Figure 2—figure supplement 3—source data 1
Raw data for PDK and BNIP3 expression levels under flight treatment.
- https://cdn.elifesciences.org/articles/74554/elife-74554-fig2-figsupp3-data1-v1.xlsx
Figure 3 with 2 supplements
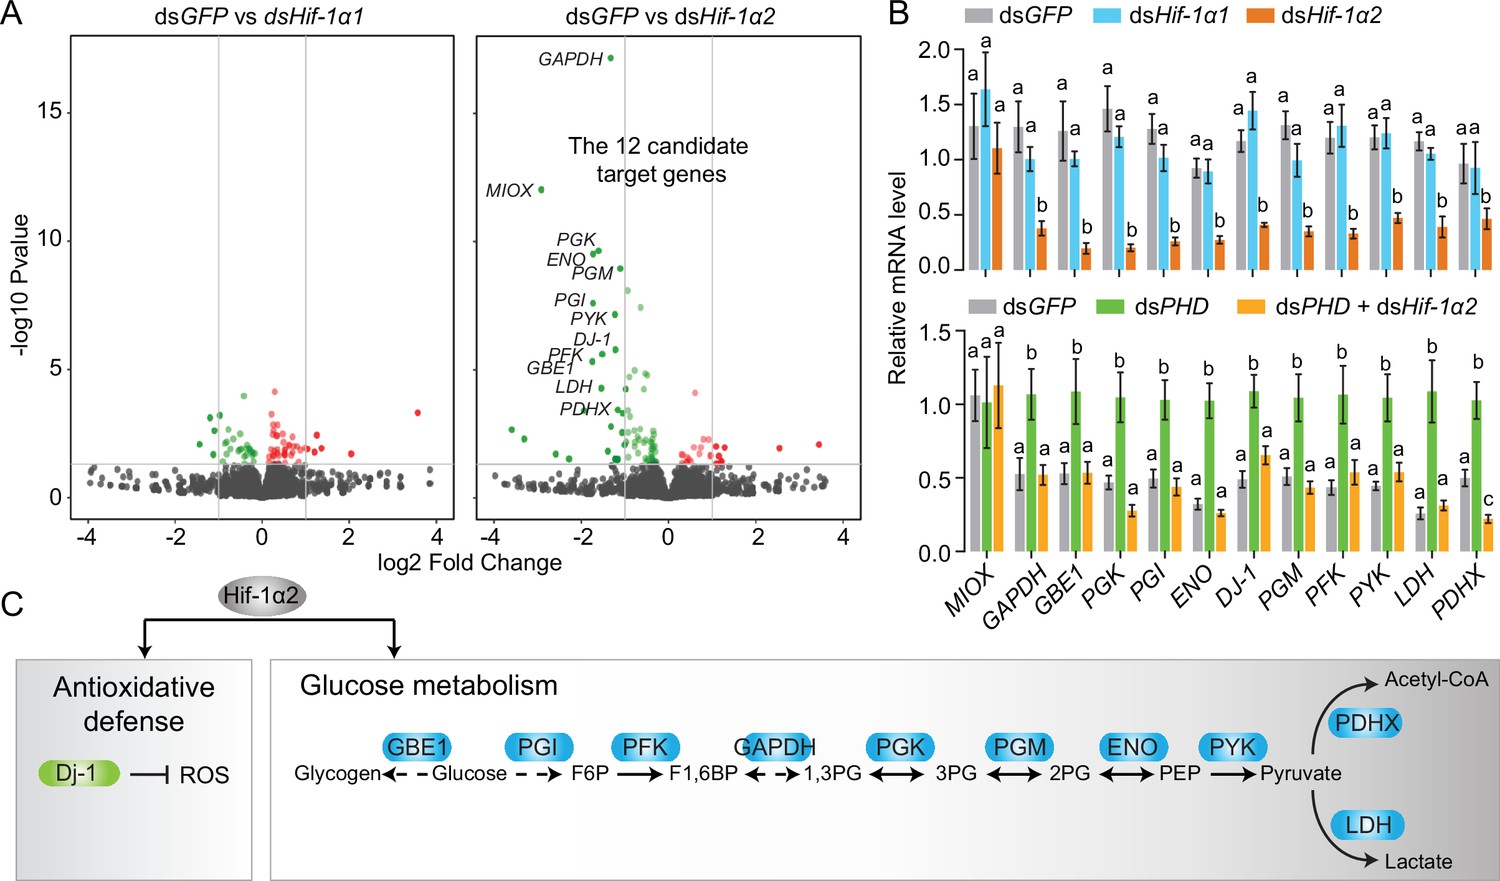
Hif-1α2 target gene identification in flight muscle.
(A) Volcano plot showing a global gene expression pattern of Hif-1α1 and Hif-1α2 knockdown groups compared with that of dsGFP-injected group in normoxia under resting conditions. Downregulated genes are colored in green, and upregulated genes are colored in red. The top 12 differentially expressed genes with false discovery rate (FDR) values lower than 0.05 are noted by their gene names and identified as candidate target genes of Hif-1α2. (B) Quantitative real-time PCR (qRT-PCR) confirmation of the expression patterns of the 12 candidate target genes. Columns are mean ± s.e.m. Significant differences are denoted by different letters (one-way ANOVA with Bonfferroni’s test for multiple comparisons, p<0.05, n=4–5 replicates, 5 locusts/replicate). (C) Two biological processes regulated by Hif-1α2 under normoxic conditions.
-
Figure 3—source data 1
Raw data for quantitative real-time PCR (qRT-PCR) verifications of Hif-1α2 target genes.
- https://cdn.elifesciences.org/articles/74554/elife-74554-fig3-data1-v1.xlsx
Figure 3—figure supplement 1
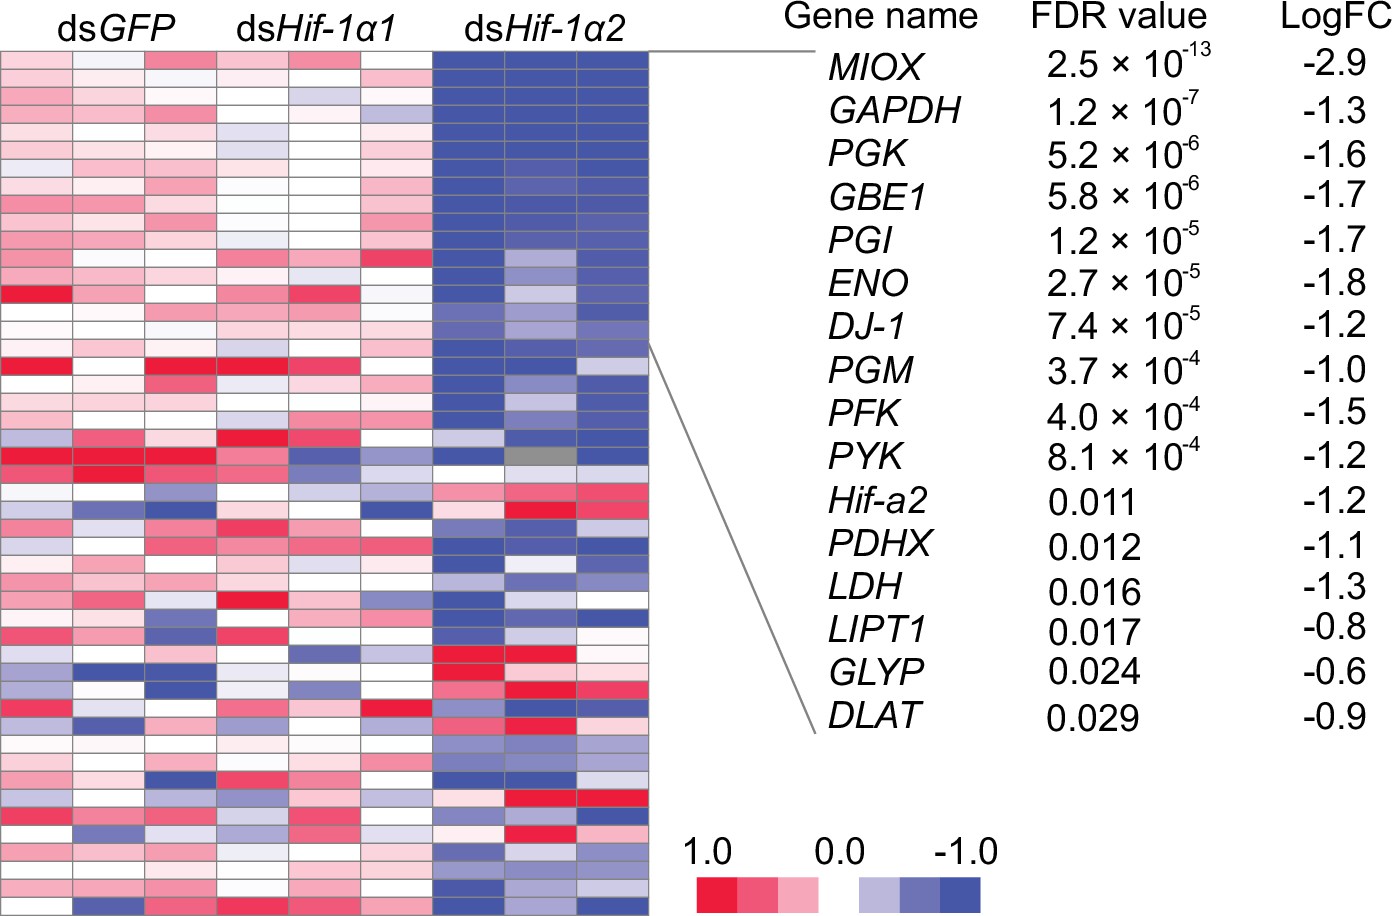
Heat map showing the expression patterns of candidate target genes of Hif-1α2.
Heat map signal indicates log2 fold change values relative to the mean expression within each group. Genes with false discovery rate (FDR) lower than 0.05 are shown on the right side.
Figure 3—figure supplement 2
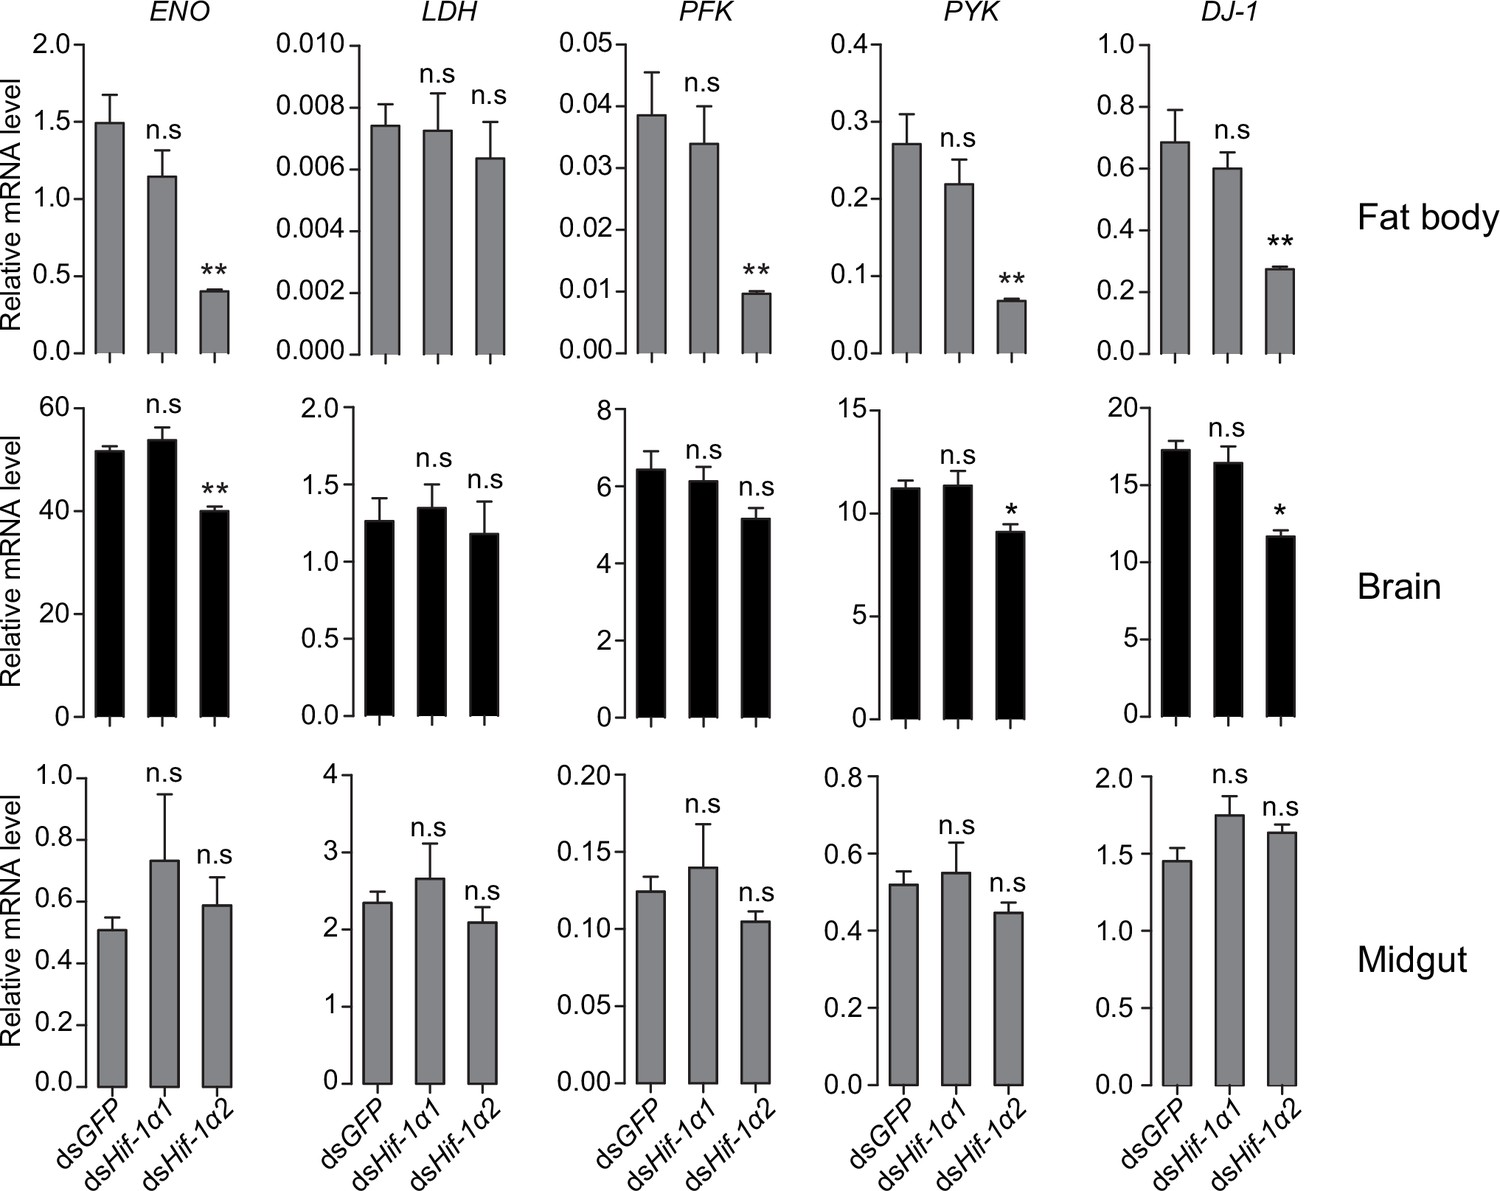
Regulatory effects of Hif-1α on its target genes in fat body, brain, and midgut.
Values are mean ± s.e.m. Significant differences are denoted by *p<0.05 and **p<0.01, and n.s. represents no significant difference (Student’s t-test, n=4 replicates, 3 locusts/replicate).
-
Figure 3—figure supplement 2—source data 1
Raw data for quantitative real-time PCR (qRT-PCR) verifications of Hif-1α2 target genes in multiple tissues.
- https://cdn.elifesciences.org/articles/74554/elife-74554-fig3-figsupp2-data1-v1.xlsx
Figure 4
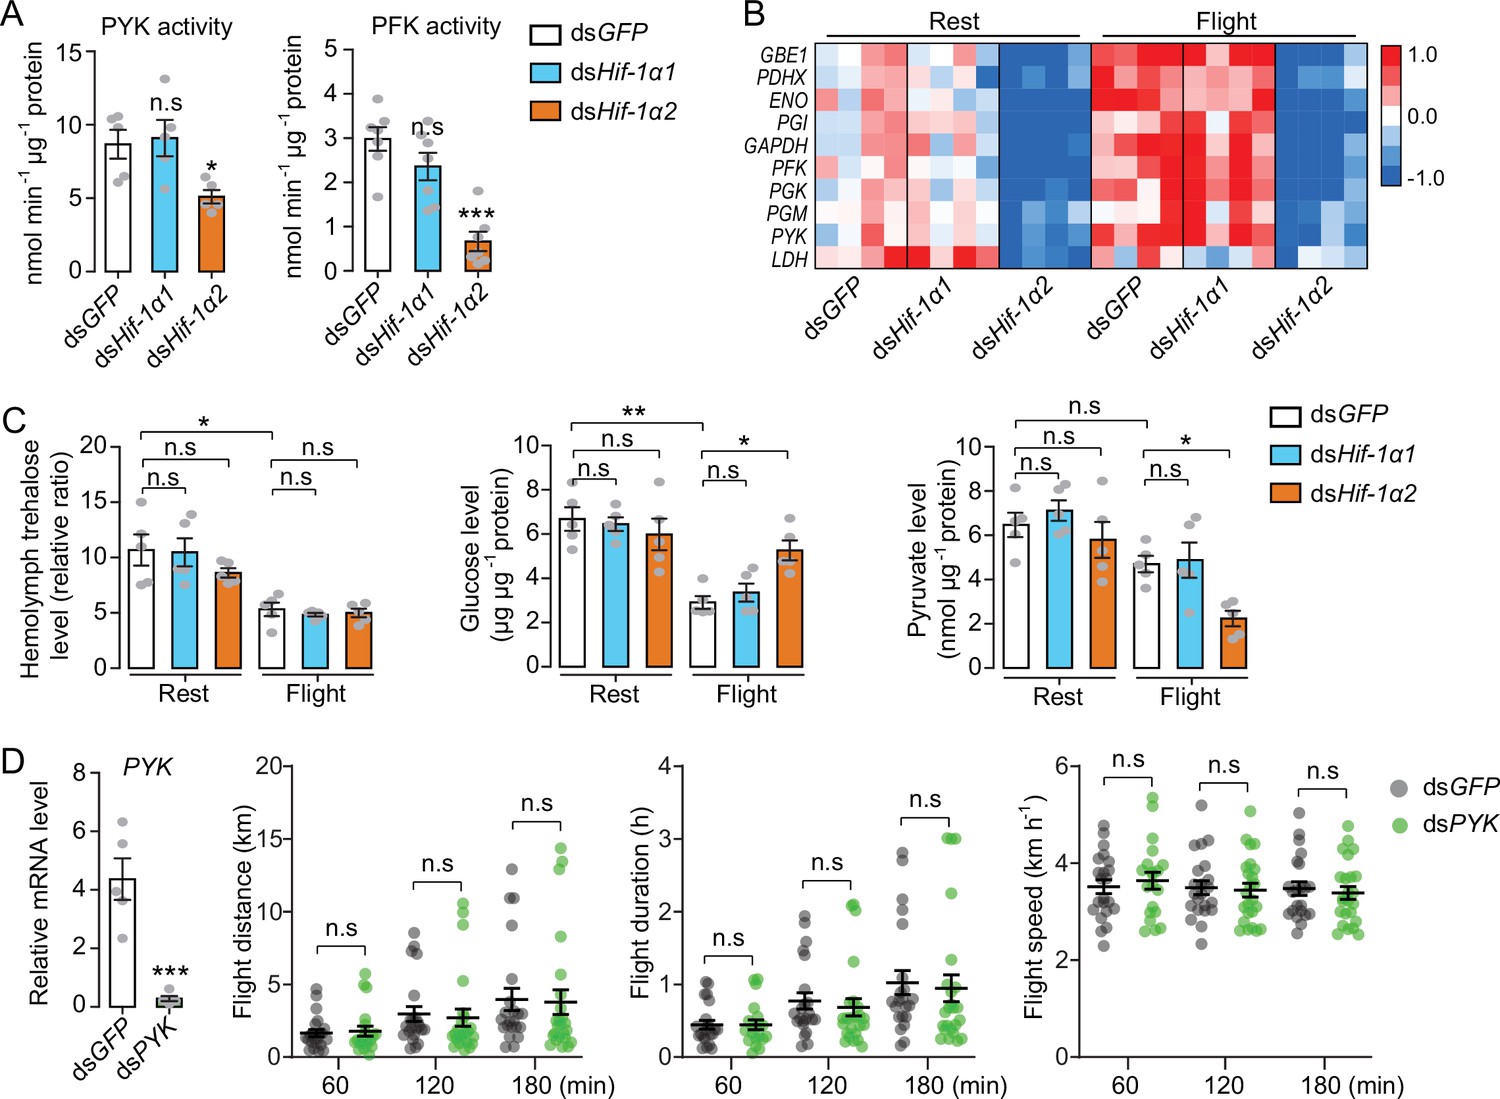
Hif-1α2 regulates glucose metabolism during flight.
(A) Enzyme activities of pyruvate kinase (PYK) and phosphofructokinase (PFK) repressed by knockdown of Hif-1α2 in flight muscles under resting conditions (n=5–7 replicates, 3 locusts/replicate). (B) Flight-induced upregulations of glycolytic genes repressed by knockdown of Hif-1α2 (n=4 replicates, 3 locusts/replicate). Heat map signal indicates log2 fold change values relative to the mean expression within each group. (C) Knockdown of Hif-1α2 demonstrated no effect on hemolymph trehalose content but inhibited glucose utilization and pyruvate generation in flight muscle during flight (n=5 replicates, 3 locusts/replicate). (D) No effect of PYK knockdown (n=5 replicates, 3 locusts/replicate) on long-term flight performance (n≥20). (A and D) Student’s t-test for pairwise comparisons, with dsGFP-injected groups as control. (B and C) One-way ANOVA with Bonfferroni’s test for multiple comparisons. Values are mean ± s.e.m. Significant differences are denoted by *p<0.05, **p<0.01, and ***p<0.001; n.s. represents no significant difference.
-
Figure 4—source data 1
Raw data for enzyme activities, metabolite contents, and Hif-1α2 target gene expression profiles, and raw data for flight performance tests in the absence of pyruvate kinase (PYK).
- https://cdn.elifesciences.org/articles/74554/elife-74554-fig4-data1-v1.xlsx
Figure 5
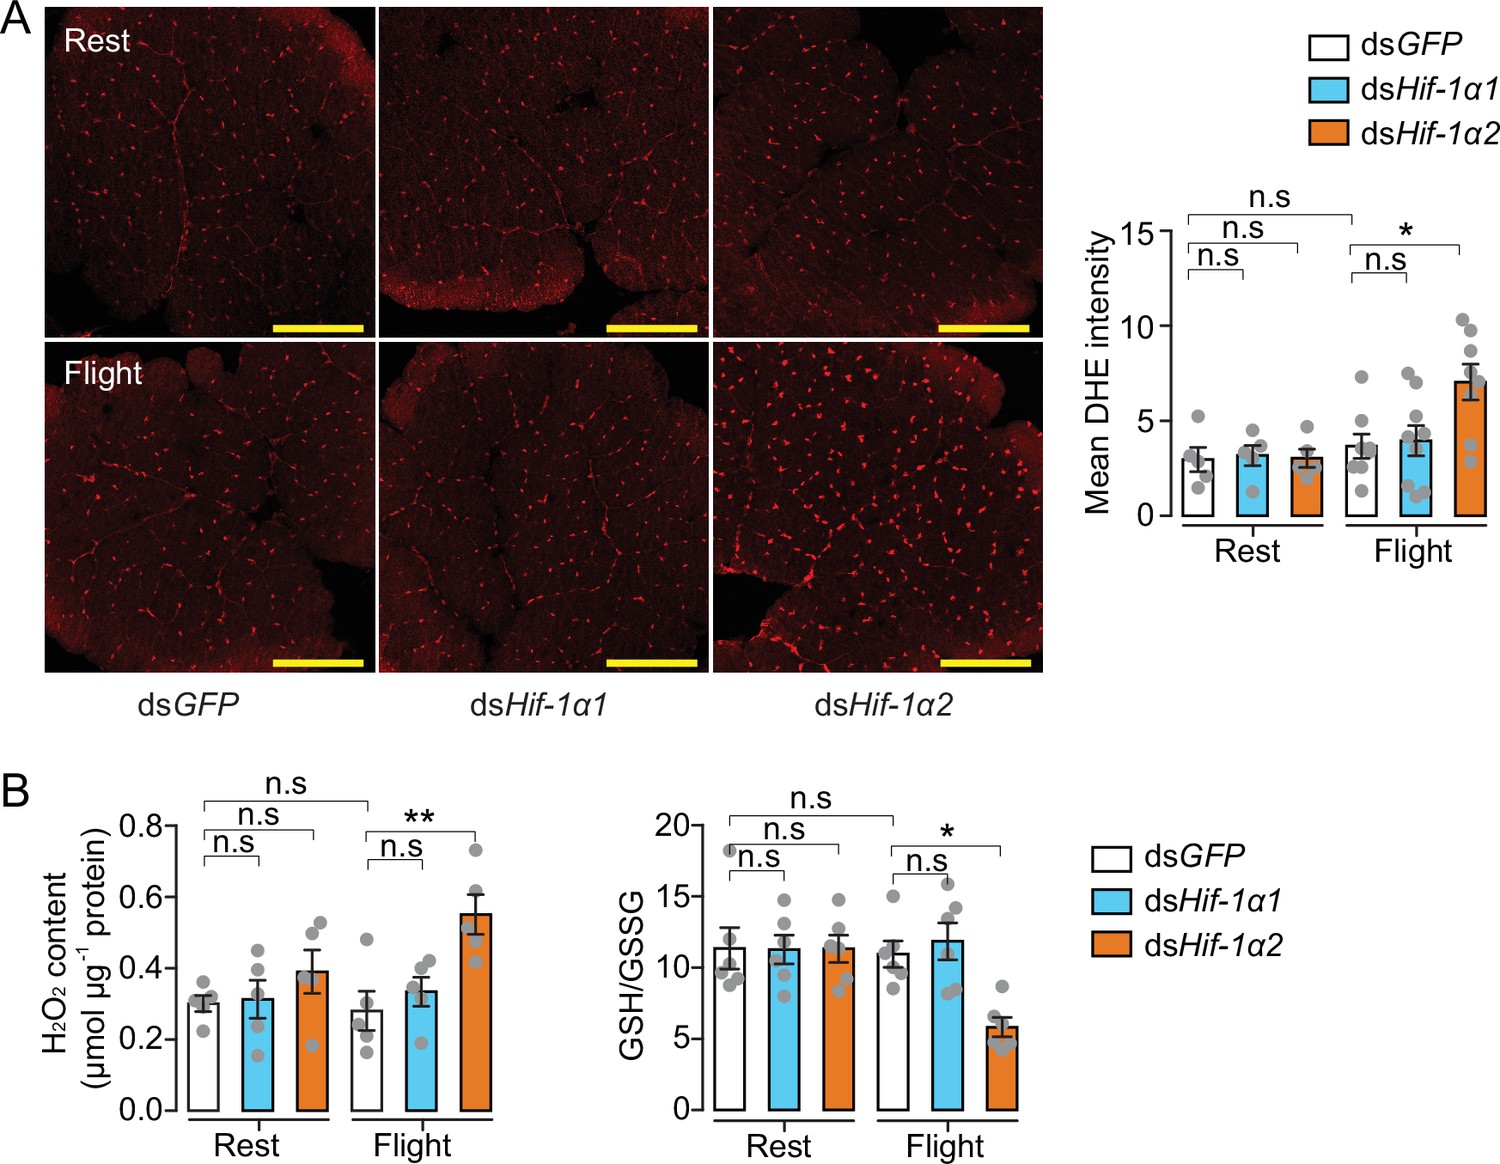
Hif-1α2 regulates redox homeostasis during flight.
(A) High levels of reactive oxygen species (ROS) in flight muscle in the knockdown of Hif-1α2 locusts during flight. Scale bars: 200 µm. Dihydroethidium (DHE) staining intensity was quantified using ImageJ software (https://imagej.nih.gov/ij, n=5–8 replicates). (B) Promotion of H2O2 production and reduction in the ratios of reduced to oxidized glutathione (GSH/GSSG) by knockdown of Hif-1α2 during flight (n=5–6 replicates, 3 locusts/replicate). One-way ANOVA with Bonfferroni’s test for multiple comparisons. Values are mean ± s.e.m. Significant differences are denoted by *p<0.05 and **p<0.01; n.s. represents no significant difference.
-
Figure 5—source data 1
Raw data for dihydroethidium (DHE) staining intensity, H2O2 content, and reduced to oxidized glutathione (GSH/GSSG) level.
- https://cdn.elifesciences.org/articles/74554/elife-74554-fig5-data1-v1.xlsx
Figure 6 with 2 supplements
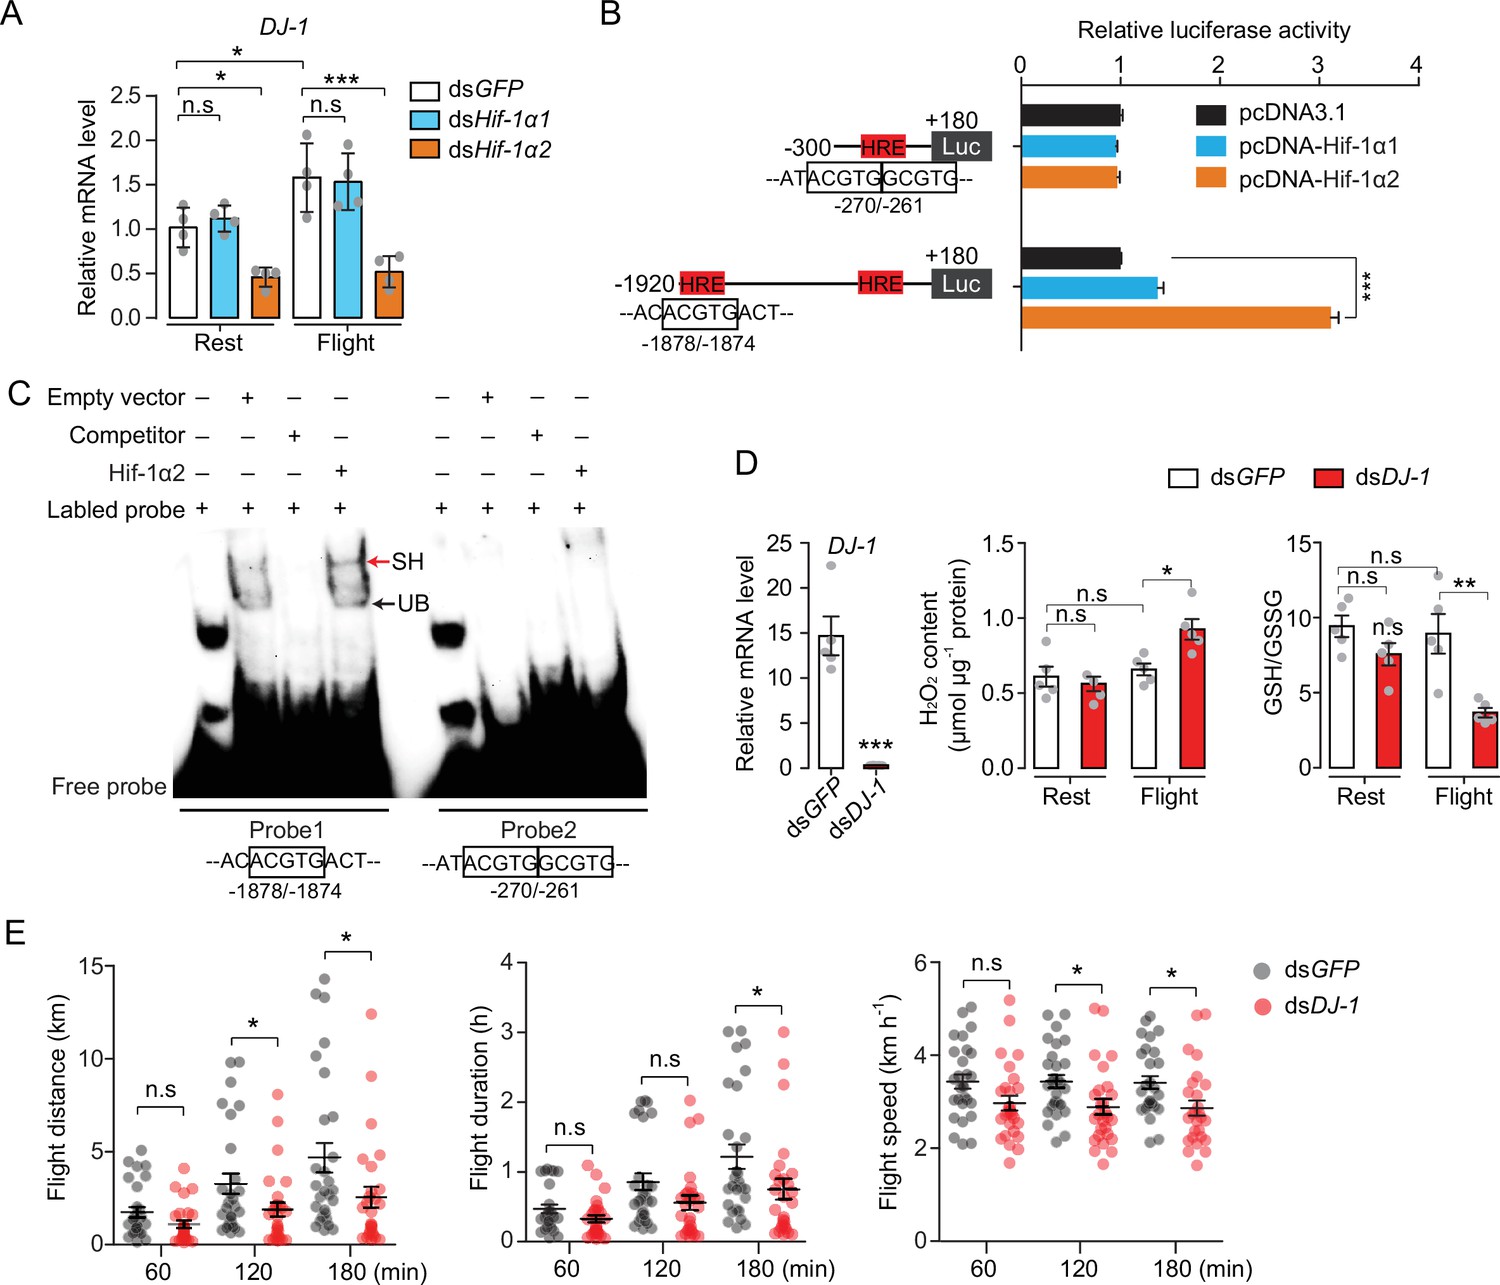
Hif-1α2 regulates redox homeostasis via Dj-1.
(A) Hif-1α2-dependent flight-induced upregulations of DJ-1 (n=4 replicates, 3 locusts/replicate). (B) Dual luciferase assay demonstrating the effect of Hif-1α1 and Hif-1α2 overexpression on DJ-1 promoter (n=4 replicates). (C) Electrophoretic mobility shift assays showing the nuclear extracts which contain Hif-1α2 could bind to the hypoxia response element (HRE) of DJ-1 promoter. Unlabeled probes were used as competitors. SH represents shift binding of Hif-1α2, UB represents unspecific banding. (D) Knockdown of DJ-1 promoted H2O2 accumulation, and reduced the ratios of reduced to oxidized glutathione (GSH/GSSG) in muscle during flight (n=5 replicates, 3 locusts/replicate), and (E) impaired long-term flight performance of locusts (n≥27). Student’s t-test for pairwise comparisons. One-way ANOVA with Bonfferroni’s test for multiple comparisons. Values are mean ± s.e.m. Significant differences are denoted by *p<0.05, **p<0.01, and ***p<0.001; n.s. represents no significant difference.
-
Figure 6—source data 1
Raw data for DJ-1 expression profiles and luciferase assay.
Raw data for H2O2 content, reduced to oxidized glutathione (GSH/GSSG) level, and flight performance test in the absence of Dj-1.
- https://cdn.elifesciences.org/articles/74554/elife-74554-fig6-data1-v1.xlsx
-
Figure 6—source data 2
Raw data for electrophoretic mobility shift assays.
- https://cdn.elifesciences.org/articles/74554/elife-74554-fig6-data2-v1.docx
Figure 6—figure supplement 1
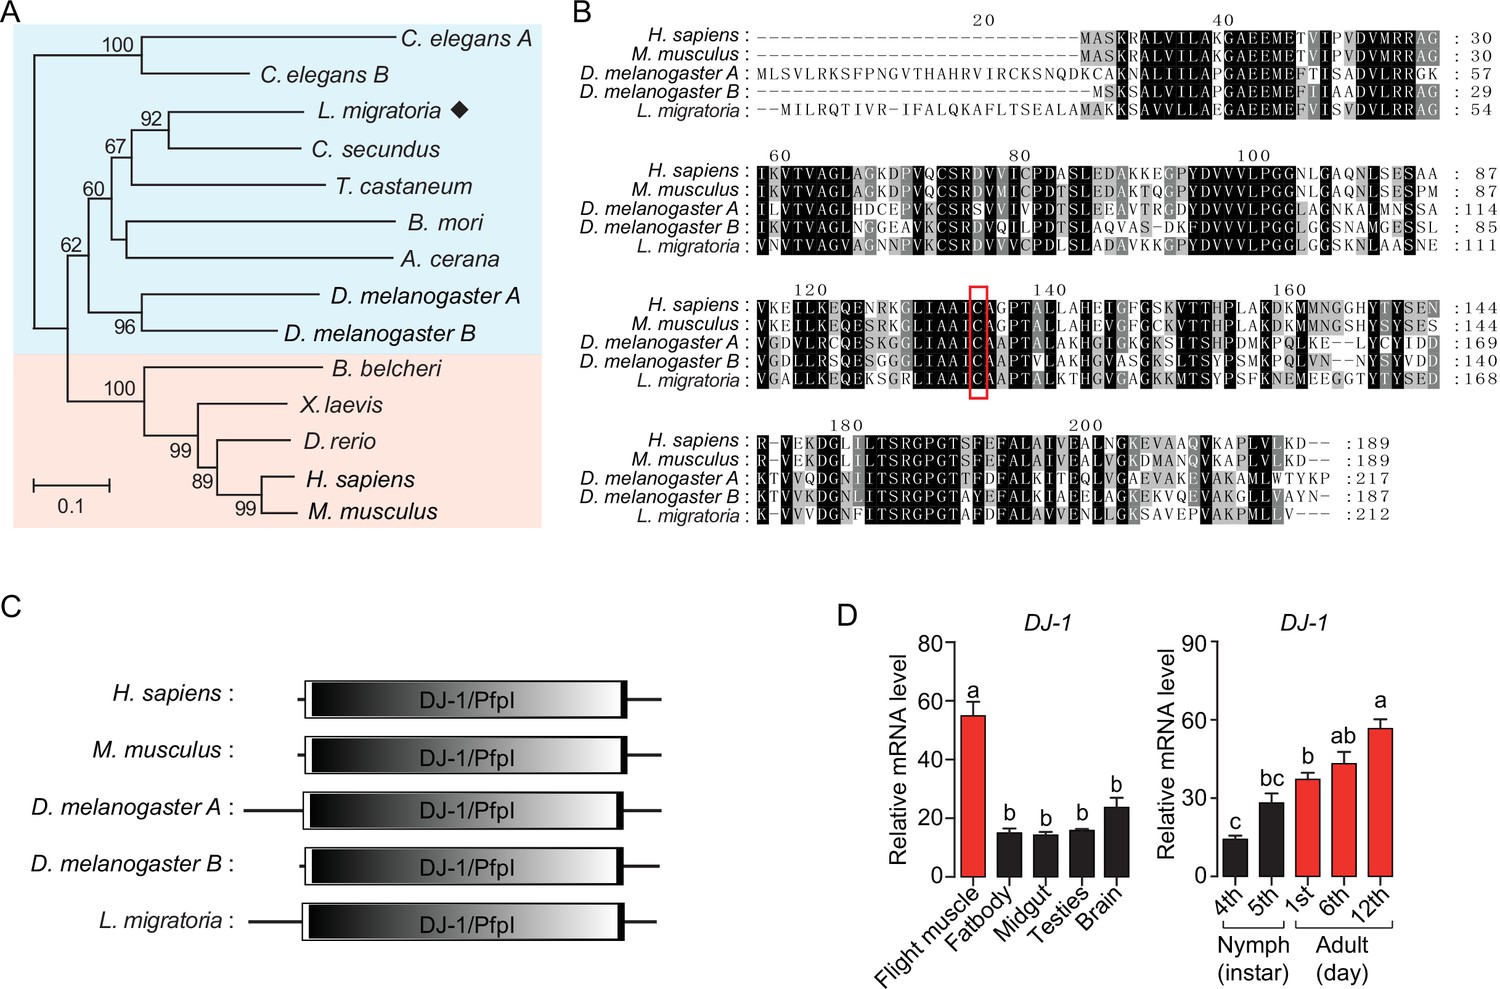
DJ-1 is evolutionarily conserved in animals.
(A) Phylogenetic tree construction of Dj-1. MEGA 5.0 was used for phylogenetic tree analysis with the corresponding amino acid sequences of Dj-1 family genes from Homo sapiens, Mus musculus, Xenopus laevis, Danio rerio, Branchiostoma belcheri, Manduca sexta, Drosophila melanogaster, Tribolium castaneum, Bombyx mori, Apis cerana, Cryptotermes secundus, Caenorhabditis elegans and Locusta migratoria. One thousand bootstraps were performed, and only bootstrap values ≥60 are shown. (B) Sequence alignment of Dj-1. The alignment among H. sapiens, M. musculus, D. melanogaster, and L. migratoria were performed using MEGA 5.0 software. The amino acid residue in the red box is the cysteine residue that responds to reactive oxygen species (ROS) oxidation. (C) Dj-1 is a highly conserved protein that belongs to the DJ-1/ThiJ/PfpI superfamily. The structural domain of Dj-1 protein is predicted using the SMART software (http://smart.embl-heidelberg.de/). (D) Tissue distributions of DJ-1 and expression profiles of DJ-1 at different developmental stages in the thoracic muscle (fourth- and fifth-instar nymphs and first-, sixth-, and 12th-day adults; n≥4 replicates, 5 locusts/replicate). One-way ANOVA with Bonfferroni’s test for multiple comparisons. Values are mean ± s.e.m. Significant differences are denoted by different letters.
-
Figure 6—figure supplement 1—source data 1
Raw data for spatiotemporal expression profiles of DJ-1.
- https://cdn.elifesciences.org/articles/74554/elife-74554-fig6-figsupp1-data1-v1.xlsx
Figure 6—figure supplement 2
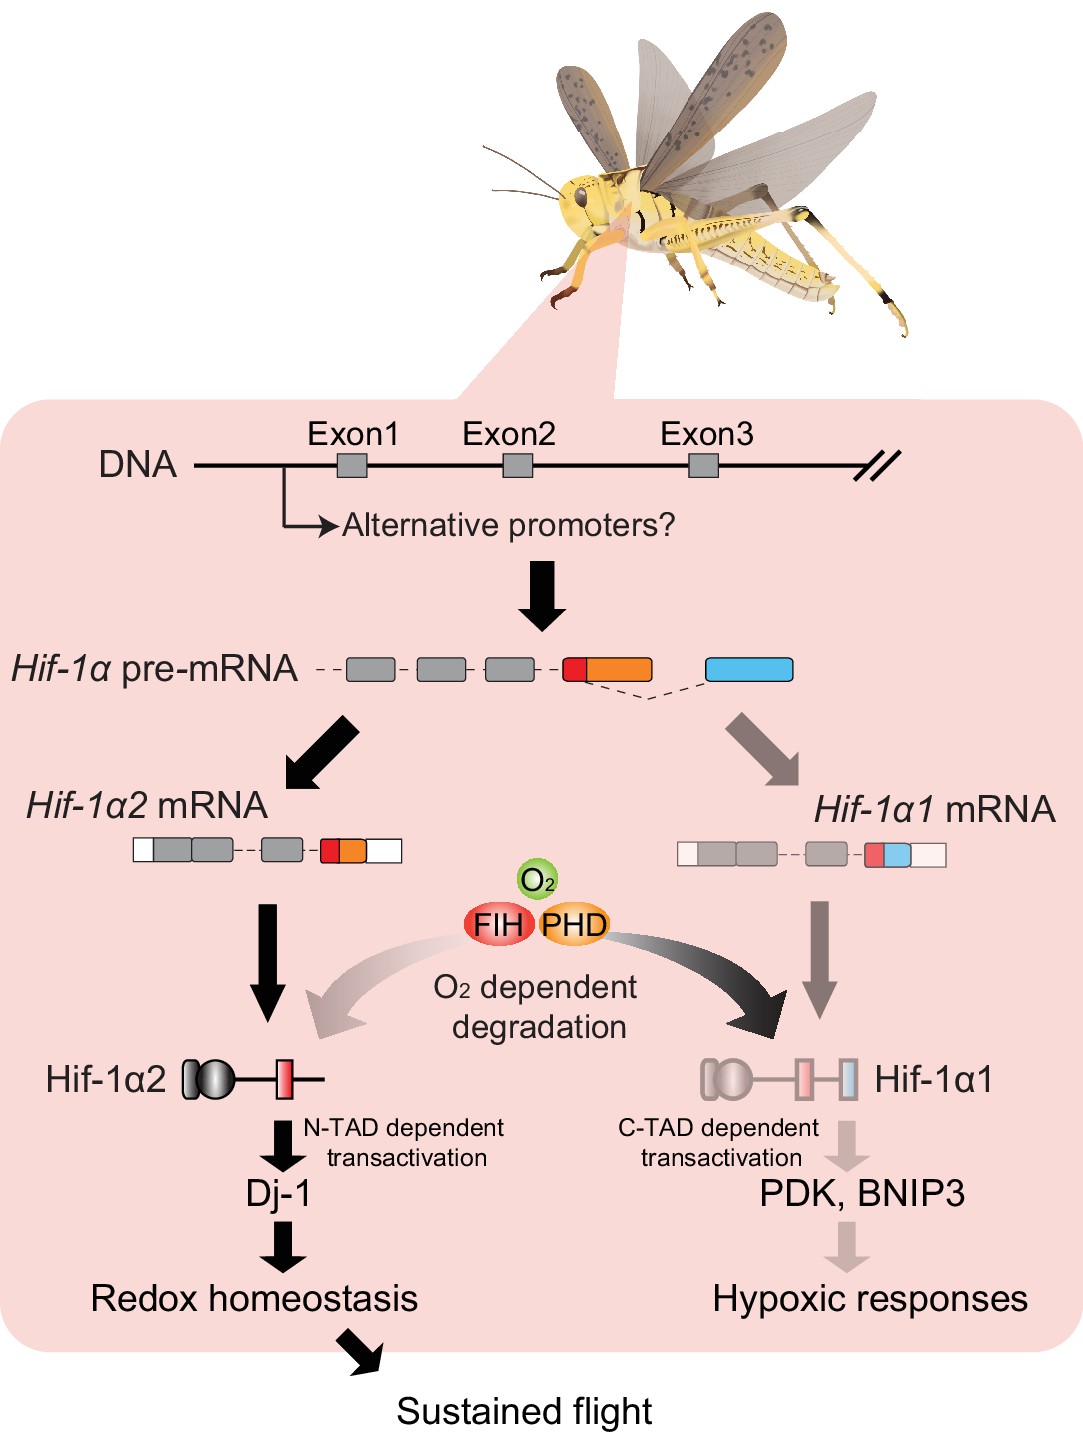
Working model showing the upstream and downstream regulatory details of Hif-1α1 and Hif-1α2 during locust flight.
Muscle-abundant expression of Hif-1a2 is possibly contributed by tissue-specific promoters and splicing factors. Owing to the alternatively spliced C-terminal transactivation domain (C-TAD), Hif-1α1 and Hif-1α2 exhibit distinct abilities in oxygen-sensing and transactivating gene expressions. During flight, Hif-1α1 protein degrades under an oxygen-dependent manner, while Hif-1α2 upregulates extensively and maintains redox homeostasis through promoting Dj-1 production and thus contributes to the sustained flight of locusts.
Additional files
-
Supplementary file 1
Primers used in this study.
- https://cdn.elifesciences.org/articles/74554/elife-74554-supp1-v1.docx
-
MDAR checklist
- https://cdn.elifesciences.org/articles/74554/elife-74554-mdarchecklist1-v1.docx
Download links
A two-part list of links to download the article, or parts of the article, in various formats.
Downloads (link to download the article as PDF)
Open citations (links to open the citations from this article in various online reference manager services)
Cite this article (links to download the citations from this article in formats compatible with various reference manager tools)
Non-canonical function of an Hif-1α splice variant contributes to the sustained flight of locusts
eLife 11:e74554.
https://doi.org/10.7554/eLife.74554


