Short-term plasticity in the human visual thalamus
- University of Pisa, Italy
- IRCCS Stella Maris, Italy
- Laboratoire des systèmes perceptifs, Département d’études cognitives, École normale supérieure, PSL Research University, France
- IMAGO7 Foundation, Italy
Figures
Figure 1 with 2 supplements
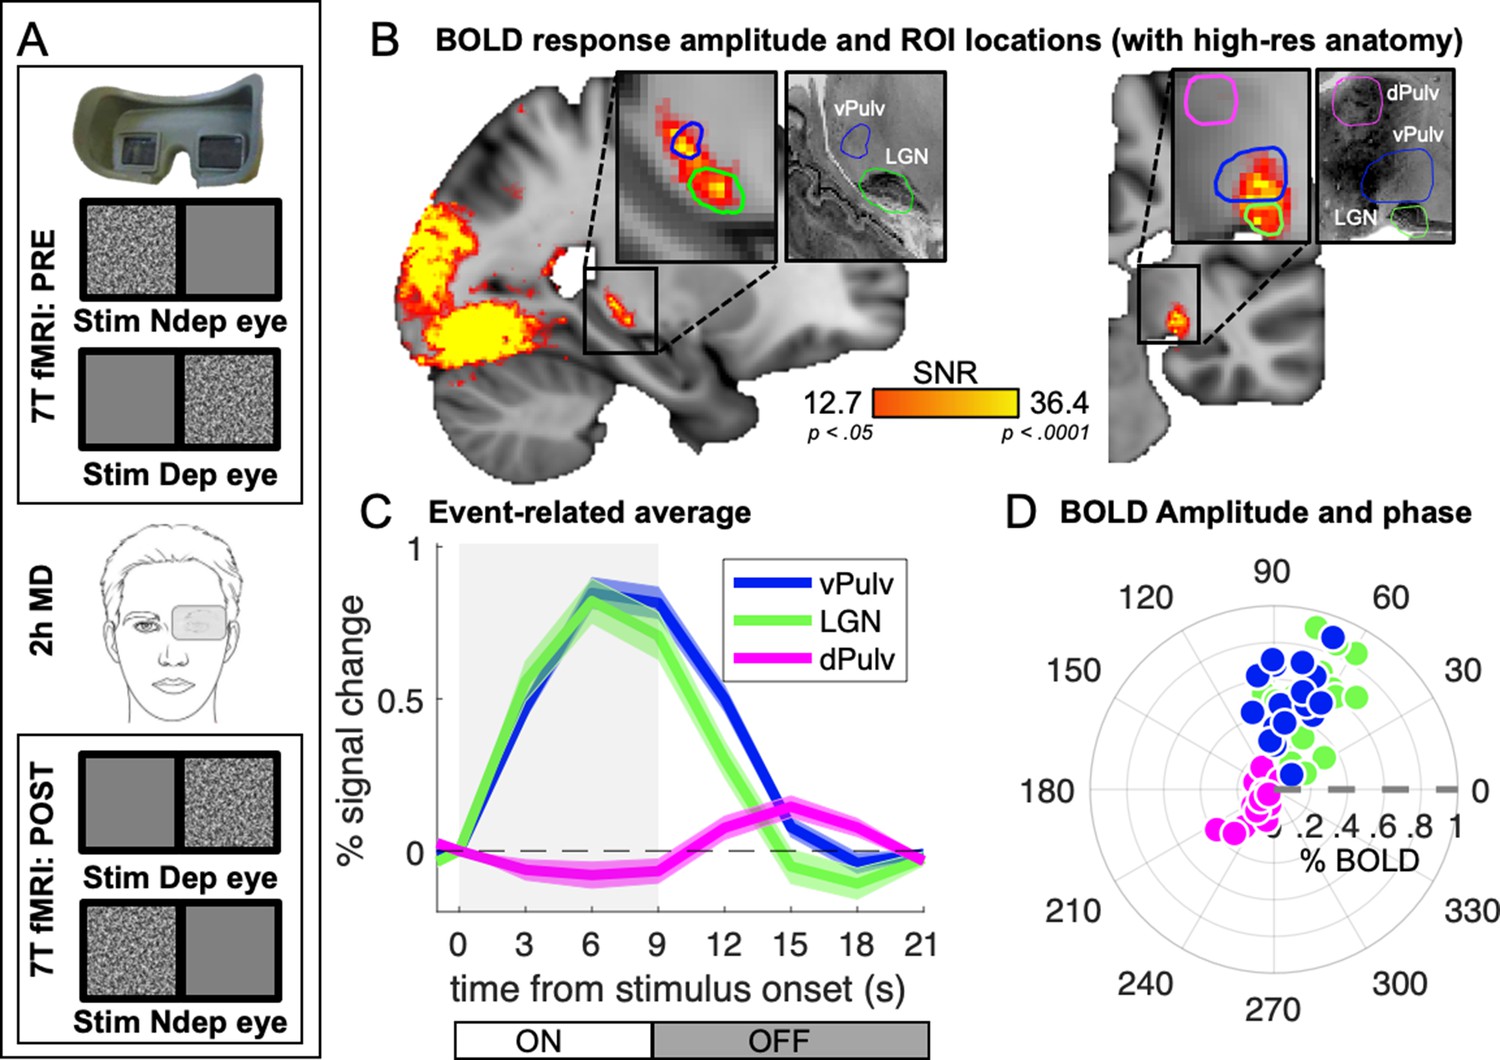
Average 7T BOLD responses in the thalamus.
(A) Experimental design. Responses to monocular presentations of dynamic bandpass noise were recorded before and after 2 hr of monocular deprivation. Binocular rivalry was measured immediately before each scanning session and used to estimate the shift of perceptual eye dominance following deprivation. (B) Map of visually evoked activity, estimated by Fourier analysis of the BOLD time series, pooled across conditions and participants and mapped on the 1 mm3 MNI template. Activity in each voxel was measured as signal-to-noise ratio, defined as the amplitude at stimulus fundamental frequency divided by the mean square root of the amplitude of neighboring frequencies (as in Biagi et al., 2015). Maps are thresholded by the associated p values, False Discovery Rate (FDR) corrected. Colored lines outline the three independently defined subcortical regions of interest (ROIs) (Guest et al., 2021): ventral pulvinar (vPulv), Lateral Geniculate Nucleus (LGN), and mid-dorsal pulvinar (dPulv). For visualization purposes, these ROIs are also mapped on a publicly available high-resolution 0.4 mm3 anatomy (https://osf.io/xkqb3/; Amunts et al., 2013; Xiao et al., 2019). (C) Temporal dynamics of the BOLD response in the three subcortical ROIs; curves and shaded areas show means and standard errors across participants (data pooled across all sessions and averaged after subtracting the baseline BOLD signal at stimulus onset; the gray shaded area represents stimulus contrast modulation ON/OFF). (D) Polar plot of phase (angle) and amplitude (radius) at the stimulus fundamental frequency for each ROI. The fundamental harmonic phase of the stimulus contrast modulation corresponds to a phase of 0° (dashed gray line) and phase delays are represented as counterclockwise rotations and expressed in degrees. Each dot represents an individual participant. Averages across participants are shown in Figure 1—figure supplement 1.
Figure 1—figure supplement 1
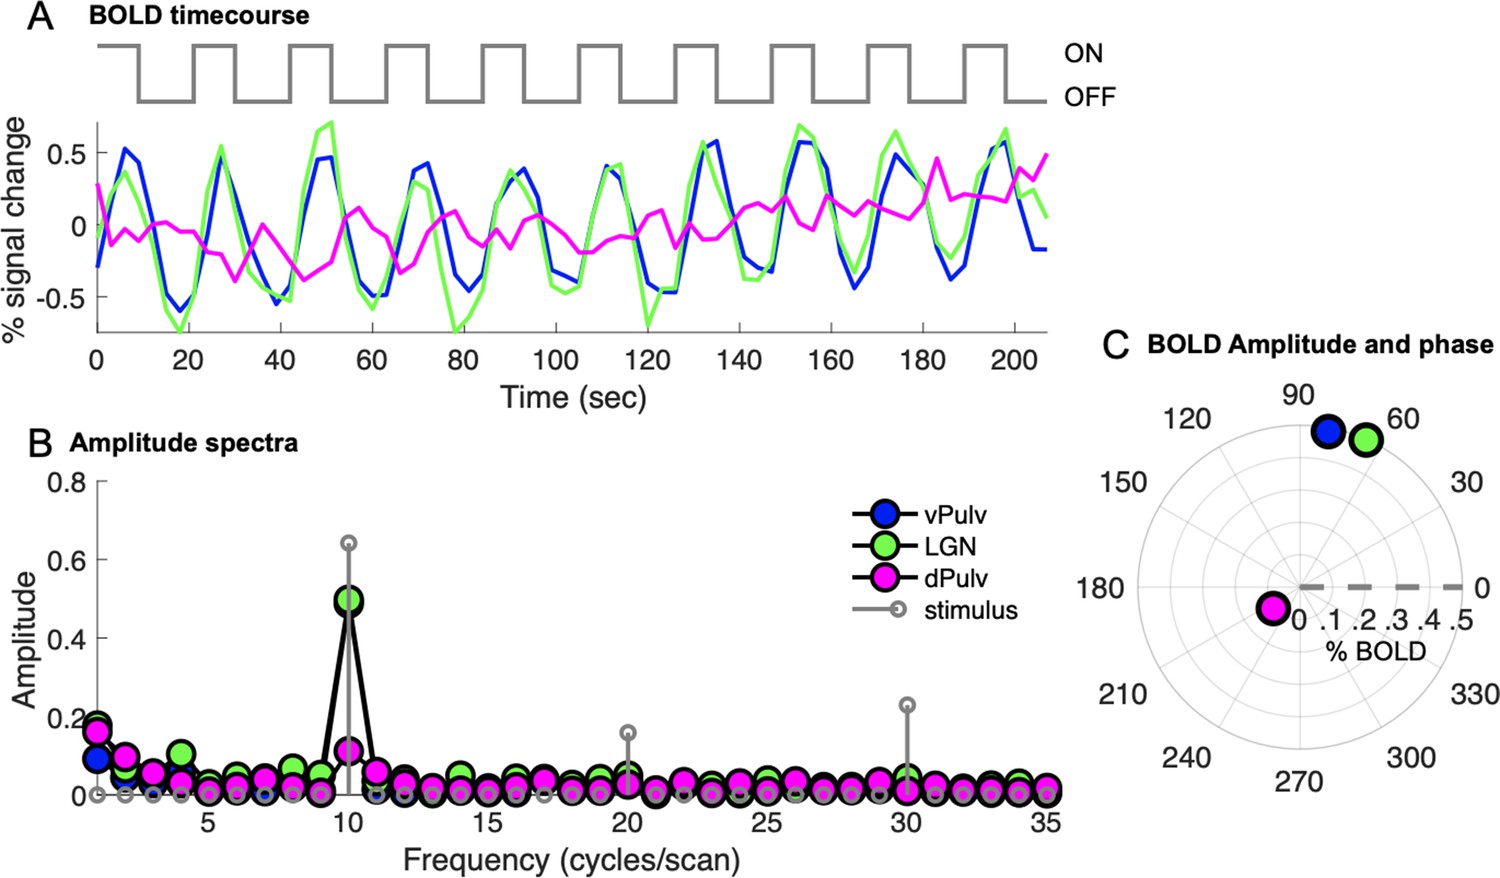
Fourier analysis of BOLD responses.
(A) BOLD timecourses for each region of interest (ROI), averaged across conditions, subjects, and voxels. The gray line above the plot shows the stimulus contrast modulation (ON/OFF). (B) Fourier spectra (amplitude) of the BOLD timecourses in panel A and of the stimulus contrast modulation; the fundamental frequency of the stimulus is 10 cycles per scan, corresponding to 1/21 s. (C) Polar plot of phase and amplitude at the stimulus fundamental frequency, for each ROI. Same conventions as in Figure 1D. The fundamental harmonic phase of the stimulus contrast modulation corresponds to phase of 0° (dashed gray line) and phase delays are represented as counterclockwise rotations (e.g., the average Lateral Geniculate Nucleus [LGN] timecourse has a phase of about 60° corresponding to 1/6 of the stimulus cycle of 21 s).
Figure 1—figure supplement 2
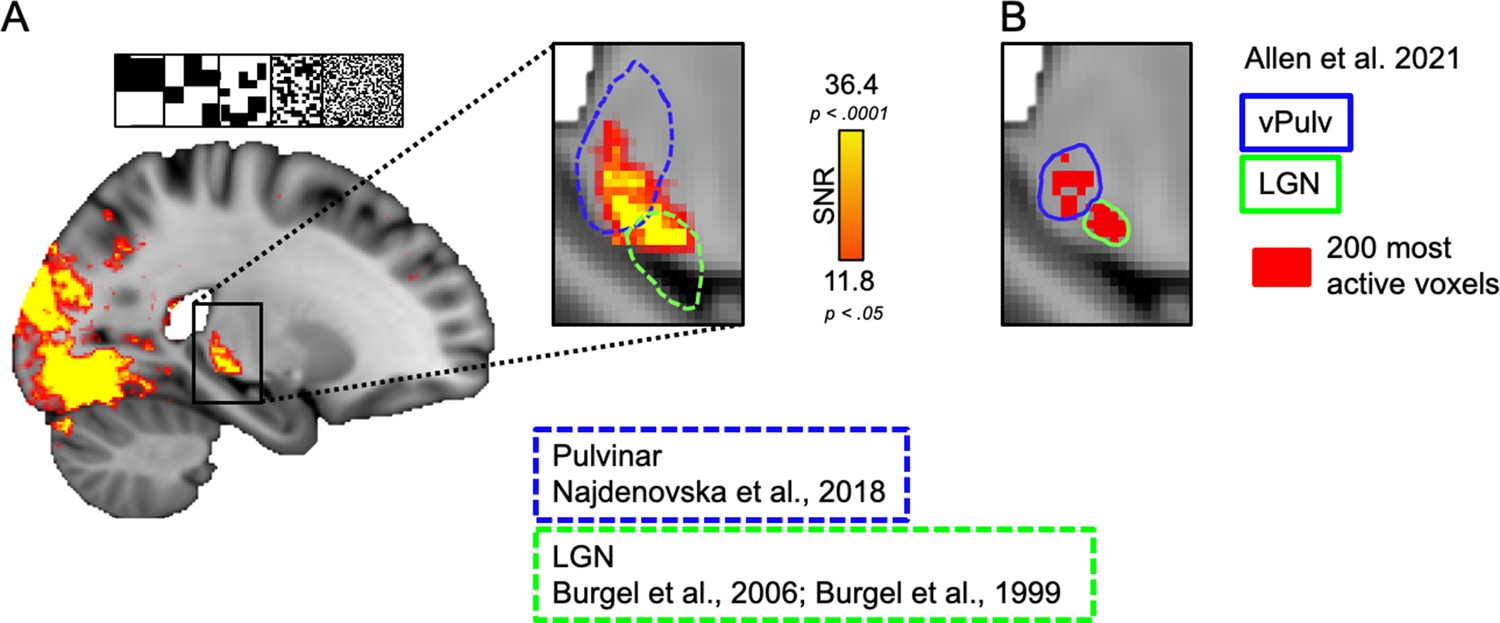
Alternative definition of thalamic regions of interest (ROIs).
(A) BOLD response evoked in a subset of participants (N = 9) with a visual-localizer experiment (binary noise, shown at the top). BOLD timecourses were averaged across participants after aligning to the MNI space. Activity in each voxel was measured using Fourier analysis and computing the signal-to-noise ratio (SNR, or ratio of the amplitude at the stimulus fundamental frequency divided by the amplitude at neighboring frequencies) and associated p values (FDR corrected). Dashed blue and green outlines show the anatomical templates (Bürgel et al., 2006; Bürgel et al., 1999; Najdenovska et al., 2018) that we used in conjunction with functional activations to define alternative ROIs for visual pulvinar and Lateral Geniculate Nucleus (LGN). (B) Red patches show the 200 voxels with higher SNR in response to our localizer stimulus, within each anatomical mask: LGN and pulvinar. Continuous lines show ROIs used for the main analyses (Guest et al., 2021), indicating that the two approaches converged on similar ROI definitions.
Figure 2 with 2 supplements
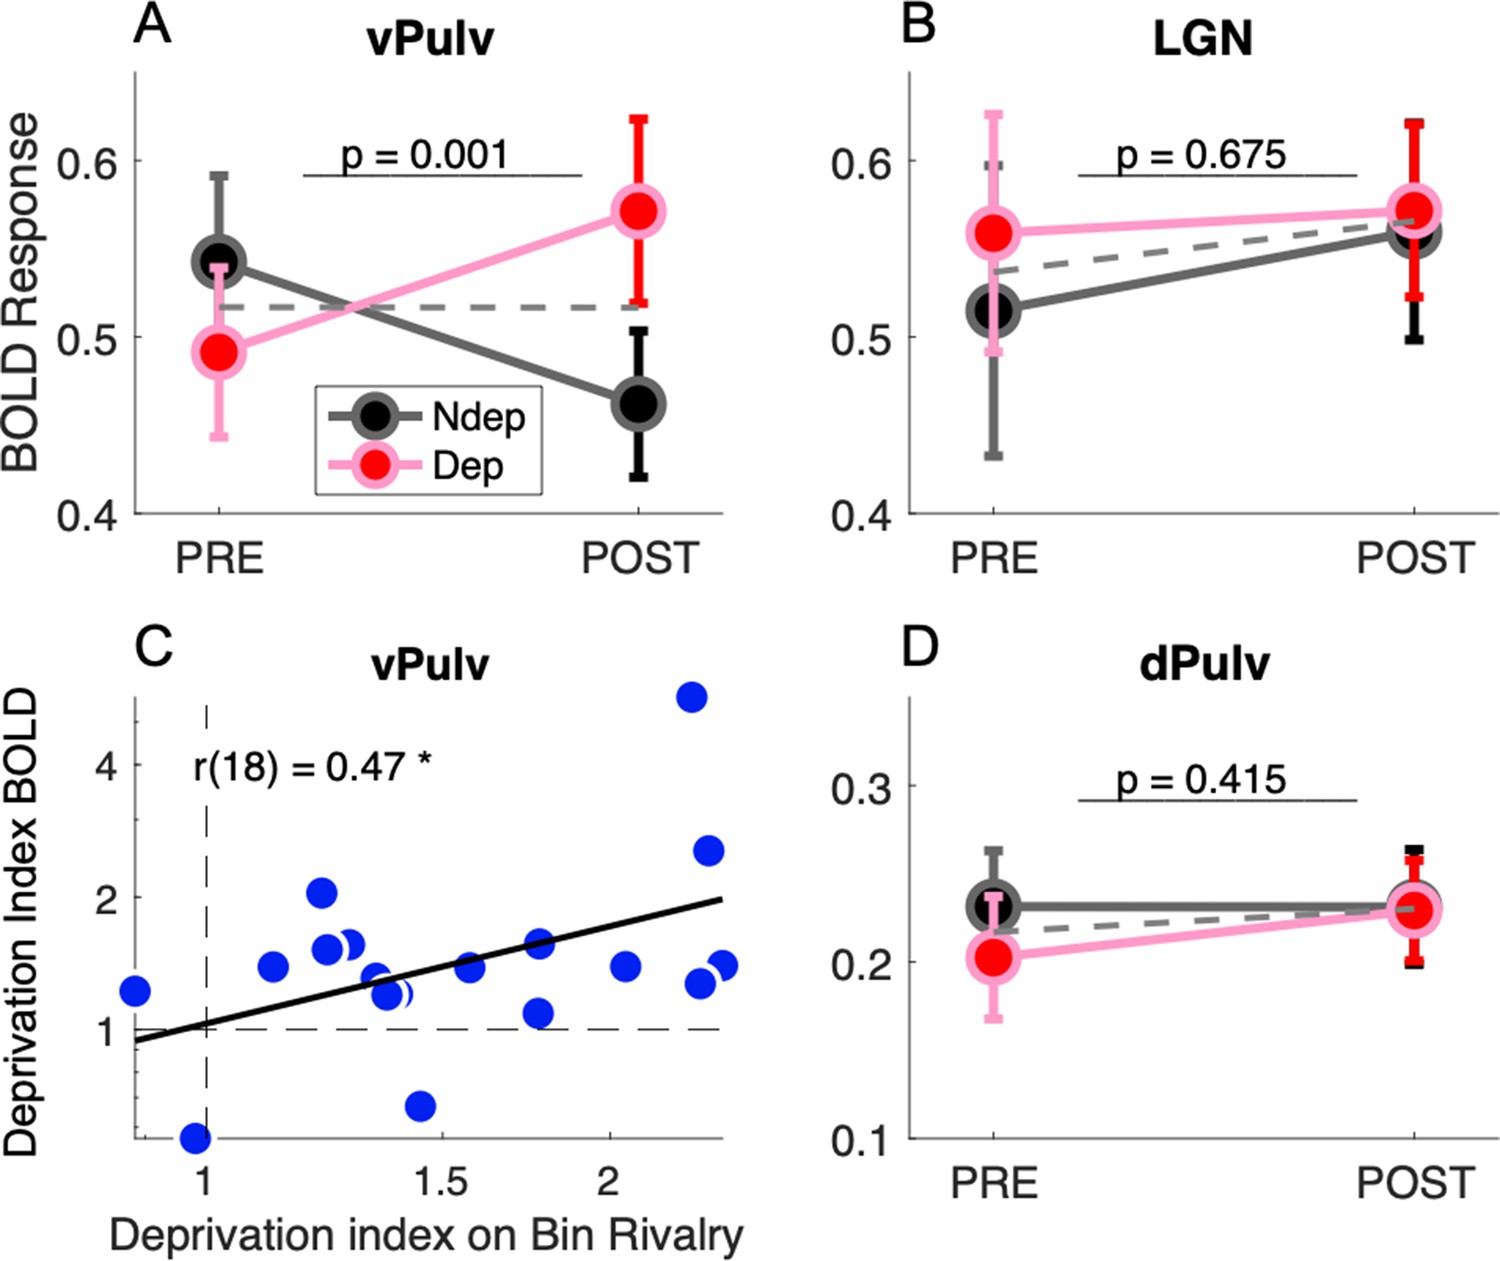
Short-term plasticity in ventral pulvinar, not in Lateral Geniculate Nucleus (LGN) or mid-dorsal pulvinar (dPulv).
(A, B, D) Modulation of visually evoked BOLD responses with monocular deprivation, in the deprived and nondeprived eye. BOLD responses were quantified by fast Fourier analysis of the functional magnetic resonance imaging (fMRI) time series, taking the amplitude at the stimulus fundamental frequency. Symbols show means and standard error of the mean (SEM) across participants. Panels A, B, and D shows results for ventral pulvinar (vPulv), LGN, and dPulv, respectively. Note the amplified ordinate scale for dPulv data. Dashed gray lines show the average monocular responses before and after deprivation. The text inset reports the p value of the ANOVA interaction term (time by eye). (C) Correlation between deprivation indices computed, for each participant, for BOLD responses in vPulv and for perceptual responses during binocular rivalry (same equation as in Binda et al., 2018); the text inset shows Pearson’s correlation coefficient, and the asterisk marks significance at p < 0.05.
Figure 2—figure supplement 1
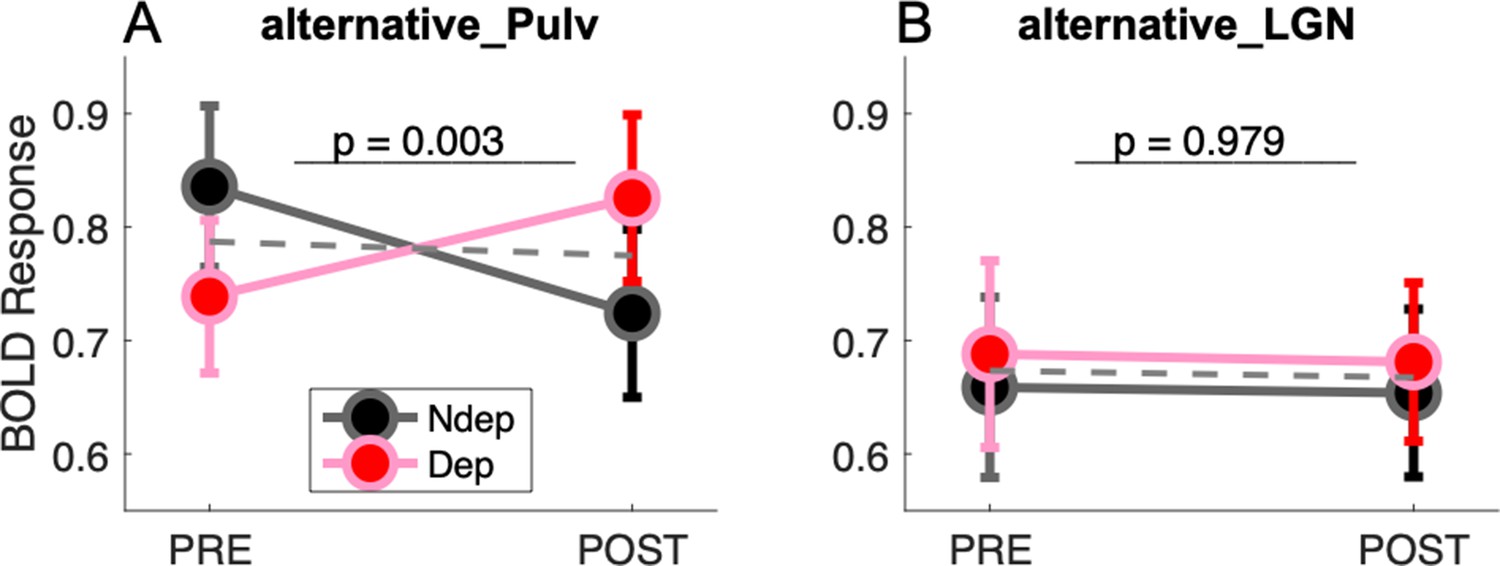
Alternative region of interest (ROI) definition confirms short-term plasticity in pulvinar, not in Lateral Geniculate Nucleus (LGN).
Modulation of BOLD responses with monocular deprivation in anatomically defined ROIs (Bürgel et al., 2006; Bürgel et al., 1999; Najdenovska et al., 2018) intersected with functional activations (Figure 1—figure supplement 2) to map visually responsive pulvinar (A) and LGN (B). Same conventions as in Figure 2.
Figure 2—figure supplement 2
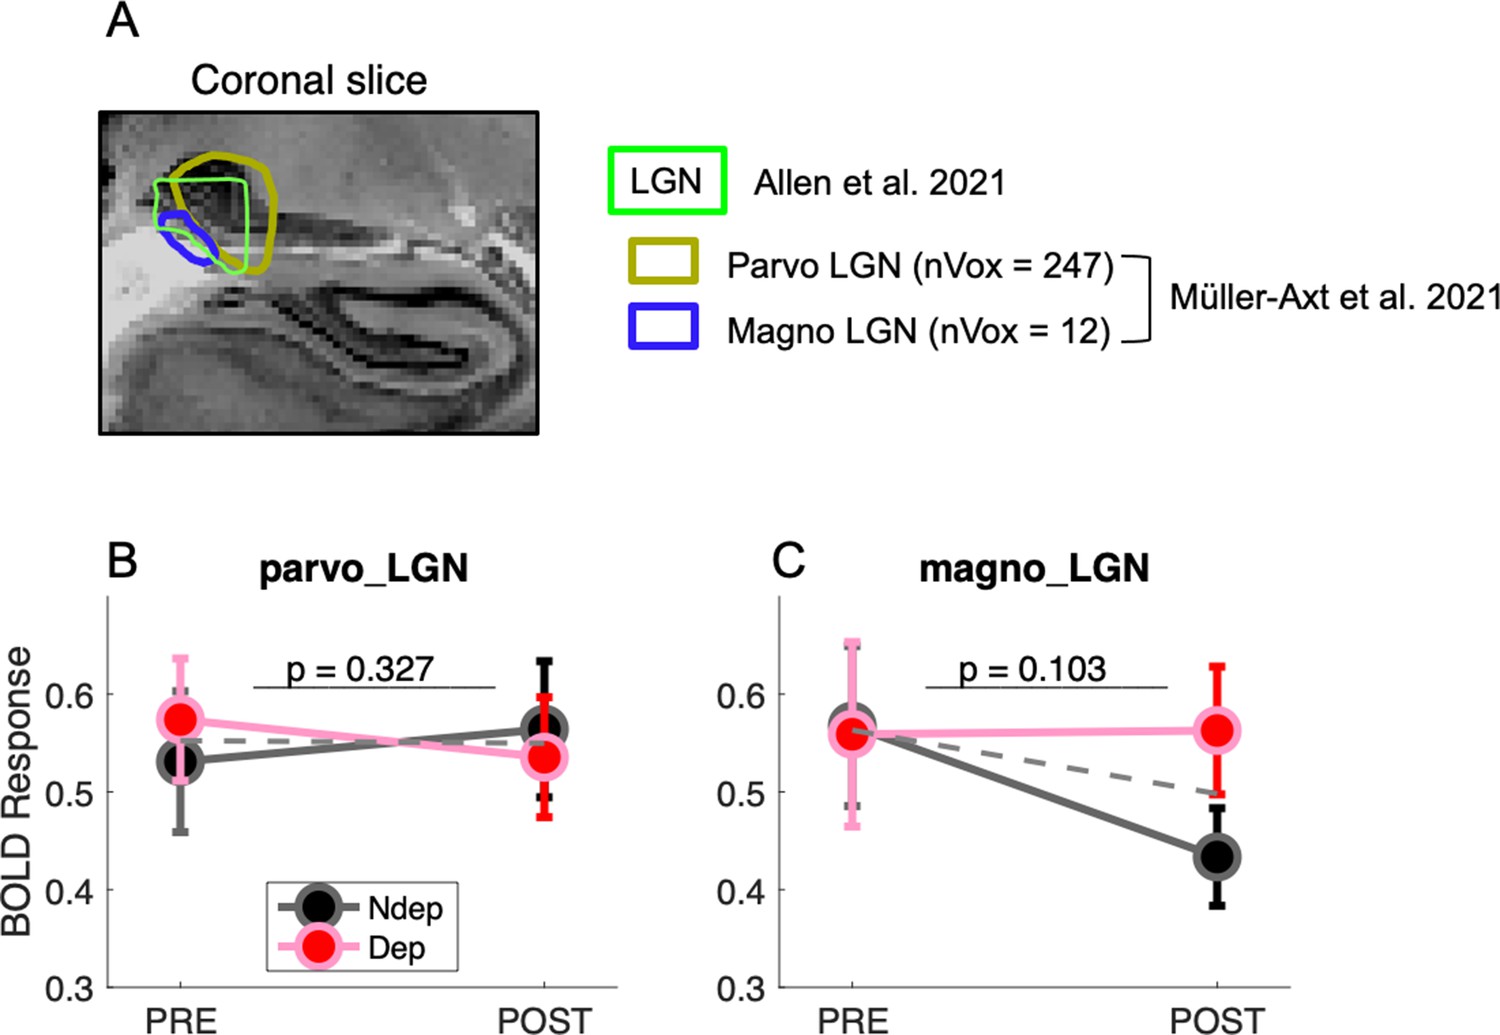
Monocular deprivation does not affect either parvocellular or magnocellular Lateral Geniculate Nucleus (LGN) divisions.
(A) Coronal slice of the high-resolution 0.4 mm3 anatomy downloaded from a public repository (https://osf.io/xkqb3/; Amunts et al., 2013; Xiao et al., 2019); the hippocampus is evident on the lower right of the image; colored lines highlight the LGN regions of interest (ROIs): dark yellow and dark blue for parvo- and magnocellular subdivisions of the LGN obtained from quantitative MRI anatomical image (Müller-Axt et al., 2021) and green for the LGN used in the main analysis (Guest et al., 2021). Numbers give the size of each subdivision in anatomical (1 mm3) resolution. (B, C) Modulation of responses by monocular deprivation for parvo- and magnocellular division of the LGN. Same conventions as in Figure 2.
Additional files
Download links
A two-part list of links to download the article, or parts of the article, in various formats.
Downloads (link to download the article as PDF)
Open citations (links to open the citations from this article in various online reference manager services)
Cite this article (links to download the citations from this article in formats compatible with various reference manager tools)
Short-term plasticity in the human visual thalamus
eLife 11:e74565.
https://doi.org/10.7554/eLife.74565


