Inhibition of β1-AR/Gαs signaling promotes cardiomyocyte proliferation in juvenile mice through activation of RhoA-YAP axis
- Division of Experimental Hematology and Cancer Biology, Cincinnati Children's Hospital Medical Center, United States
- Department of Pediatrics, College of Medicine, University of Cincinnati, United States
Figures
Figure 1 with 1 supplement
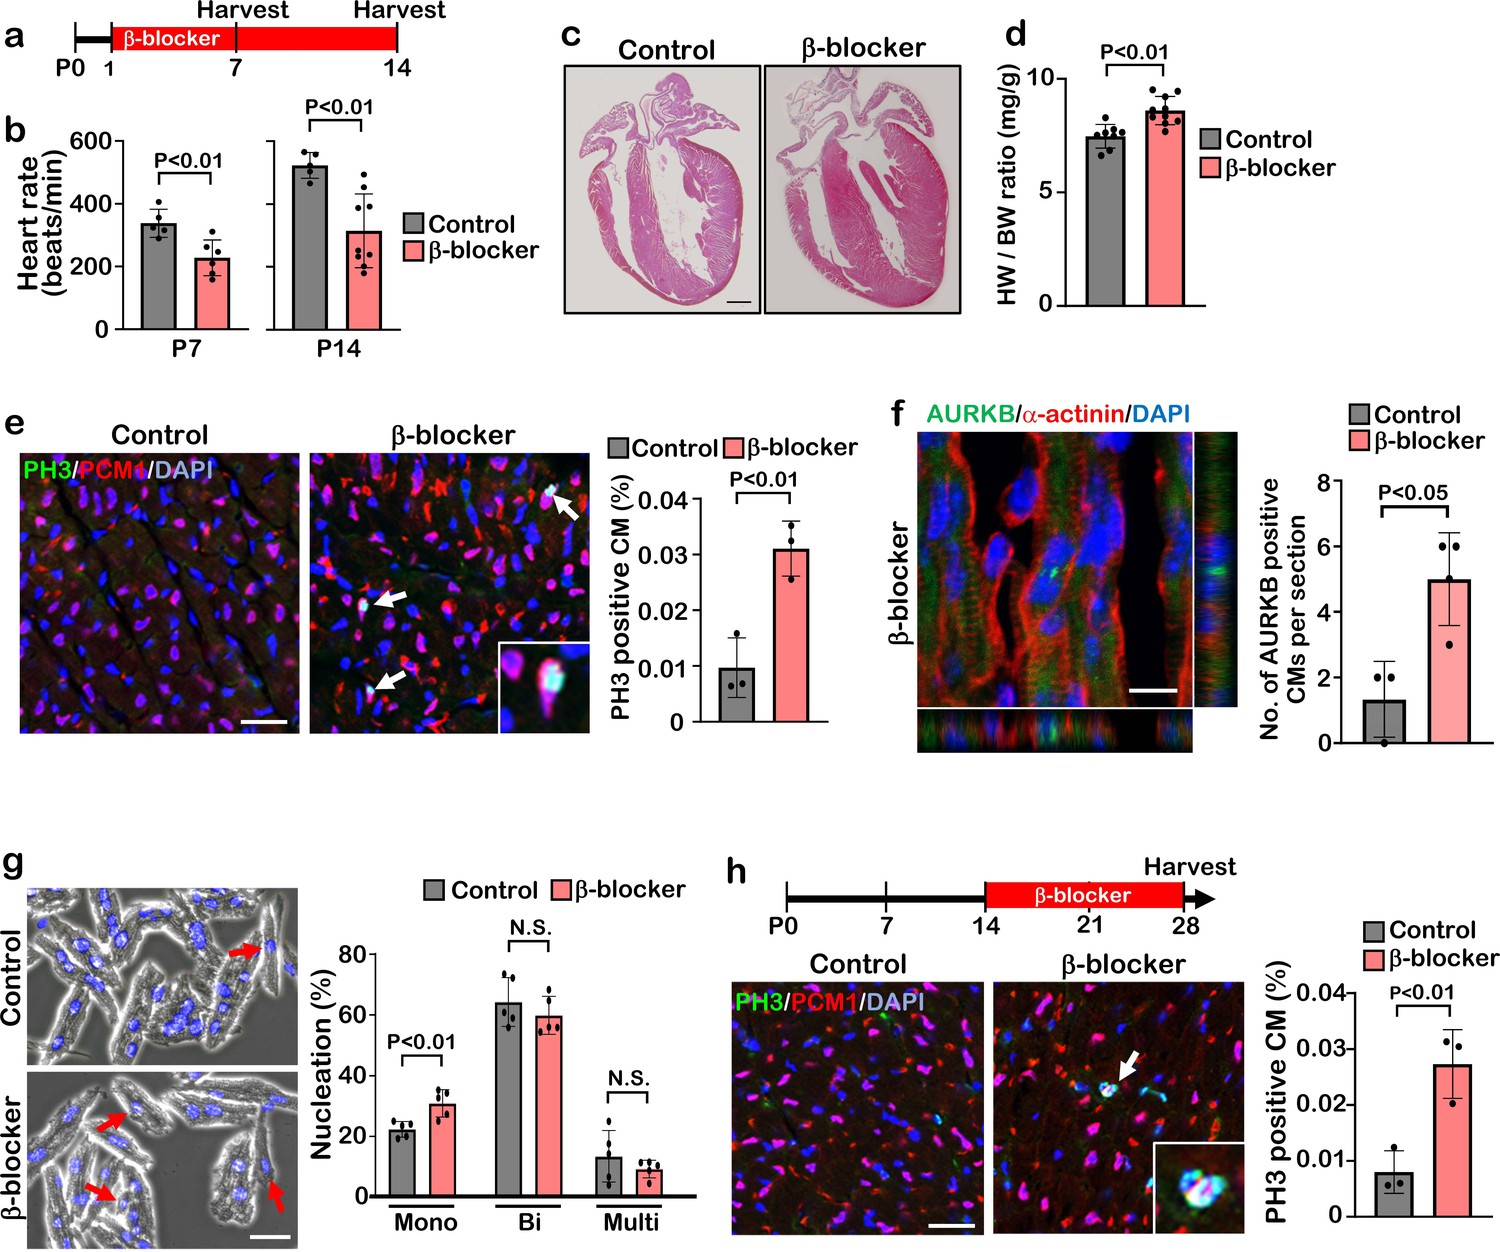
β-blocker (Metoprolol) treatment promotes neonatal-juvenile cardiomyocyte proliferation.
(a) Schematic of experimental timeline. (b) Heart rate of the saline (control) and β-blocker-treated mice at P7 and P14. Data are as mean ± SD, Student’s t-test, P7, n≥5; P14, n≥5. (c) H&E staining of control and β-blocker-treated hearts at P14. Scale bar: 500μm. (d) Heart weight (HW) to body weight (BW) ratio at P14. Data are as mean ± SD, Student’s t-test, n≥8. (e) Co-immunostaining of PH3 and PCM1 of heart sections from control and β-blocker-treated mice at P14 (left panel). Arrows indicate PH3-positive CMs. Inset shows high-magnification image of PH3-positive CM. Quantification of PH3 positive cardiomyocytes (right panel). Data are as mean ± SD, Student’s t-test, n=3. Scale bar: 50μm. (f) Aurora kinase B (AURKB) staining of P7 β-blocker treated heart. Scale bar: 10 μm (left panel). Quantification of AURKB positive cardiomyocytes at P7 (right panel). Data are as mean ± SD, Student’s t-test, n=3. (g) DAPI staining of isolated cardiomyocytes from P14 control and β-blocker treated hearts (right panel). Quantification of mono-nucleated, bi-nucleated and multi-nucleated cardiomyocytes in P14 control and β-blocker treated hearts (left panel). Data are as mean ± SD, Student’s t-test, n=5. N.S., not significant. Scale bar: 100μm. (h) PH3 and PCM1 co-immunostaining of P28 heart sections of control and mice with daily β-blocker treatment from P14 (left panel). Arrow indicates PH3-positive CMs. Inset shows high-magnification image of PH3-positive CM. Quantification of PH3 positive cardiomyocytes (right panel). Data are as mean ± SD, Student’s t-test, n=3. Scale bar: 50μm.
Figure 1—figure supplement 1
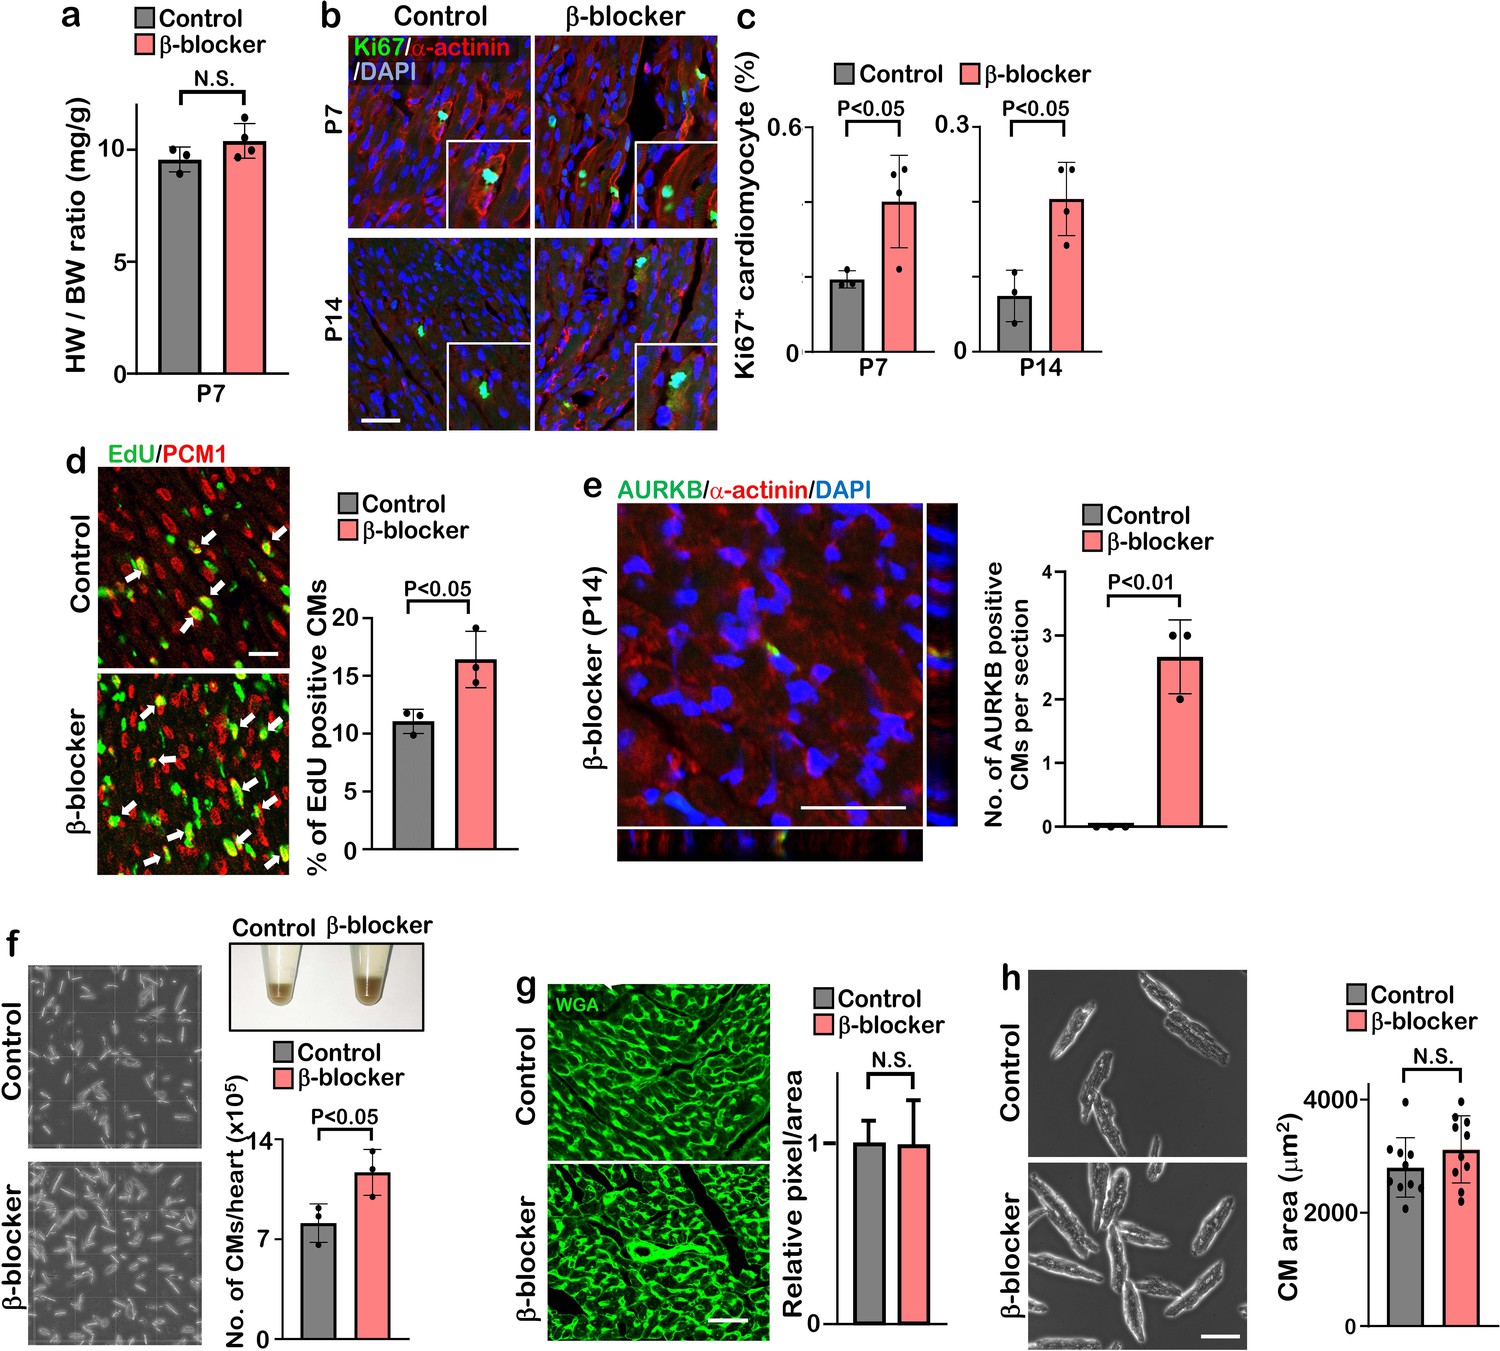
β-blocker treatment promotes cardiomyocyte proliferation after the cardiac regeneration window.
(a) Heart weight (HW) to body weight (BW) ratio of β-blocker treated heart at P7 (Student’s t-test, n≥3). (b) Ki67 and cardiac α-actinin staining of heart sections from control and β-blocker treated mice at P7 and P14. Insets show high-magnification image of Ki67-positive CM. Scale bar: 50μm. (c) Quantification of Ki67 positive cardiomyocytes at P7 and P14. Data are as mean ± SD, Student’s t-test, n=4. (d) Co-immunostaining of EdU and PCM1 of heart sections from control and β-blocker-treated mice at P14 (left panel). Arrows indicate EdU-positive CMs. Quantification of EdU positive cardiomyocytes (right panel). Data are as mean ± SD, Student’s t-test, n=3. Scale bar: 25μm. (e) Aurora kinase B (AURKB) staining of P14 β-blocker treated heart. Scale bar: 20 μm (left panel). Quantification of AURKB positive cardiomyocytes at P14 (right panel). (f) Images of isolated cardiomyocytes and quantification of number of isolated cardiomyocytes from control and β-blocker treated hearts at P14. Pellets of isolated cardiomyocytes from a whole heart are shown in 1.5 ml tubes. Data are as mean ± SD, Student’s t-test, n=3. (g) Wheat germ agglutinin (WGA)-stained sections of the LV compact zone in hearts of P14 control and β-blocker treated mice (n=3). Scale bar: 50μm. Quantification of relative pixel per area of WGA-positive cardiomyocytes (Student’s t-test, n=8) (right panel). N.S., not significant. (h) Images (left) and quantification (right) of isolated cardiomyocytes from control and β-blocker treated mice. Twenty cardiomyocytes from 10 individual hearts were measured. Student’s t-test was used. Scale bar: 100μm.
Figure 2 with 2 supplements
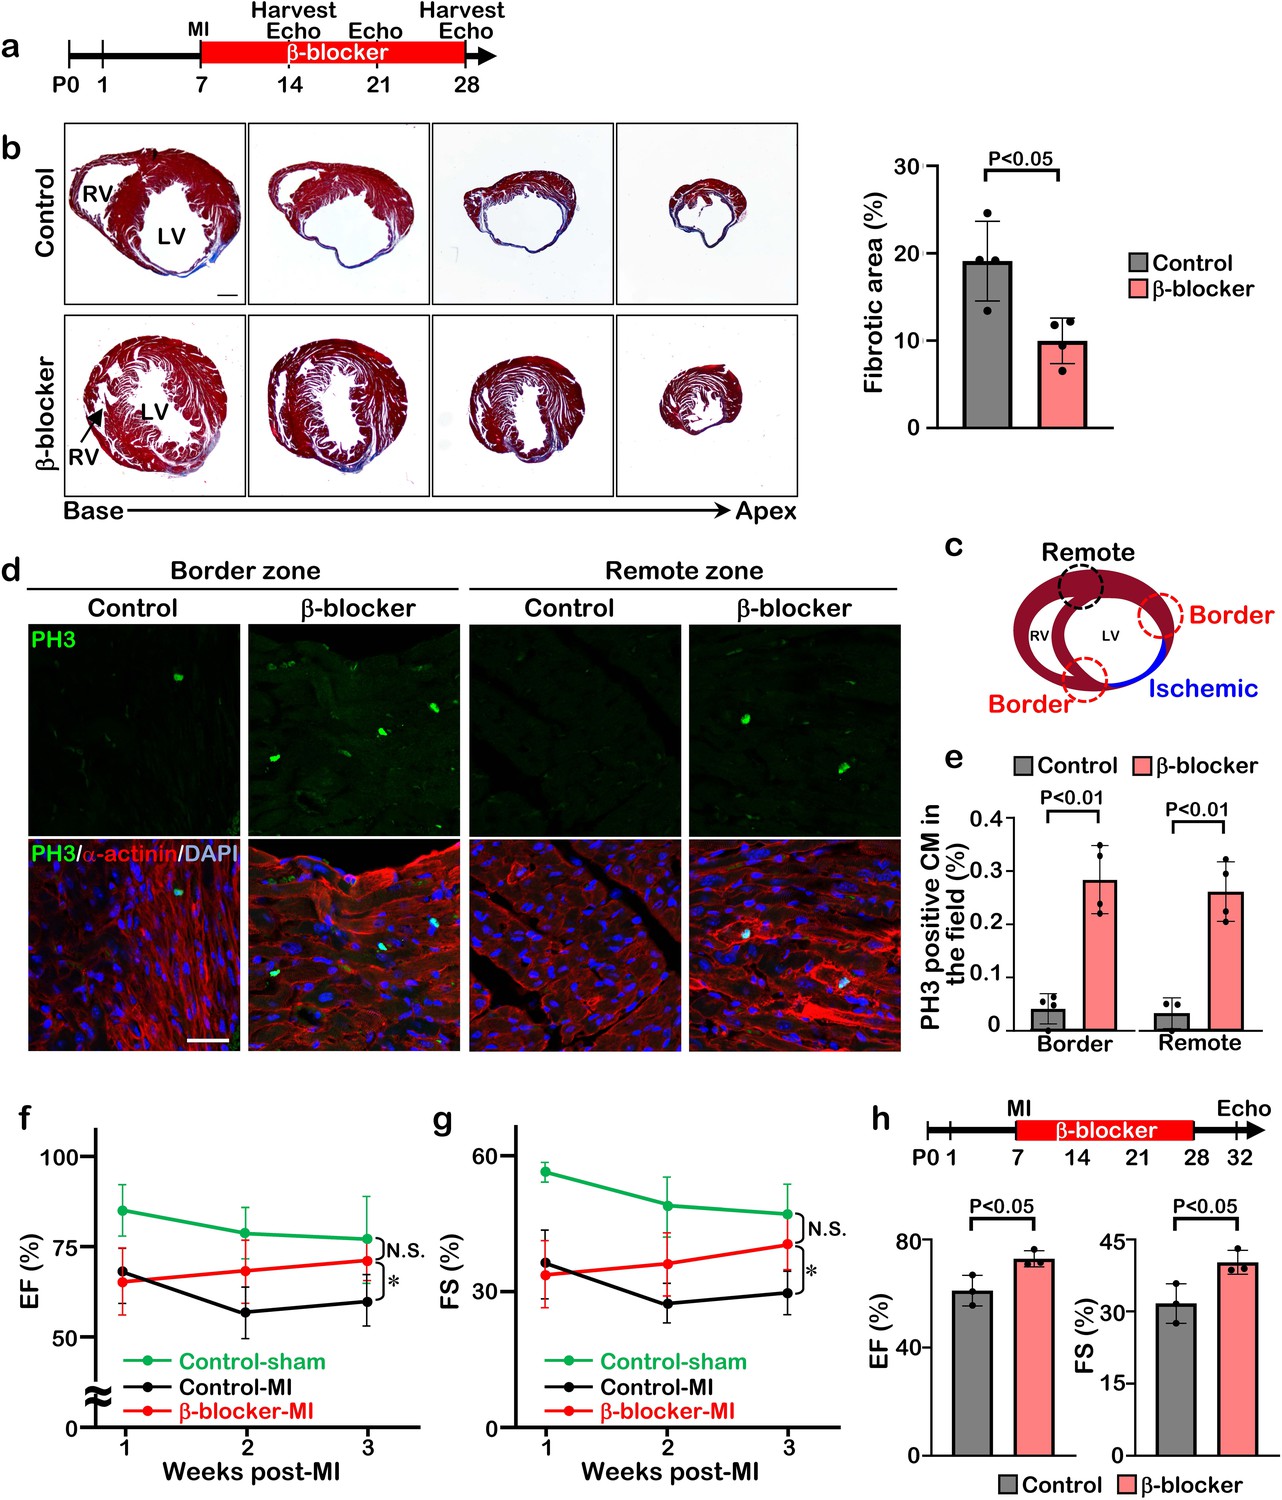
β-blocker treatment promotes cardiac regeneration and cardiomyocyte proliferation following injury in juvenile hearts.
(a) Schematic of experimental timeline. (b) Masson’s trichrome staining of heart sections from control and β-blocker-treated mice 3 weeks post-MI (left panel). Scale bar: 500μm. Quantification of the fibrotic areas (right panel). Data are as mean ± SD, Student’s t-test, n=4. (c–e) PH3 and cardiac α-actinin staining of injured hearts treated with saline or β-blocker at 3 weeks post-MI. Data are as mean ± SD, Student’s t-test, n≥3. Scale bar: 25μm. (f–g) Echocardiographic analysis of control and β-blocker-treated mice at 3 weeks post MI surgery. Serial echocardiographic measurements of EF and FS of injured hearts treated with saline (Control) or β-blocker (n=9). ANOVA test, *, p<0.01; N.S., not significant. (h) P7 mice were subjected to LAD ligation and treated with β-blocker from P8 to P28. 4 days after final β-blocker treatment, the heart function was assessed by echocardiography. Data are as mean ± SD, Student’s t-test, n=3.
Figure 2—figure supplement 1
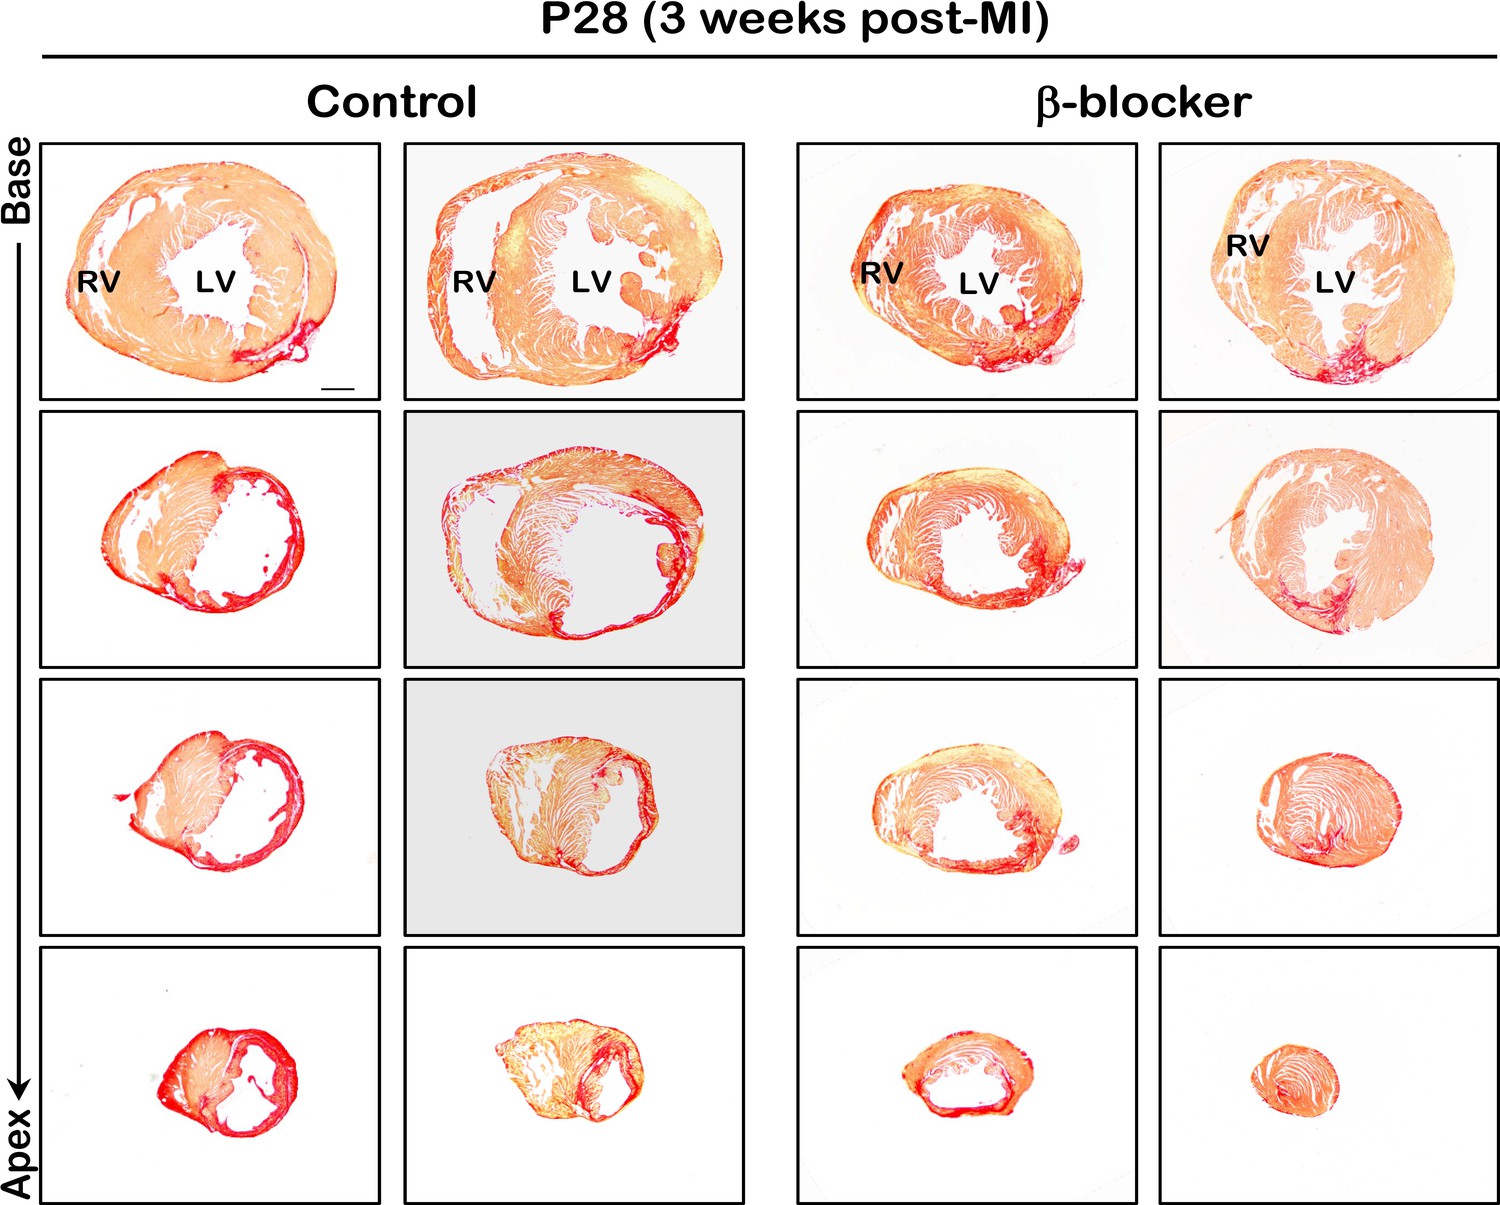
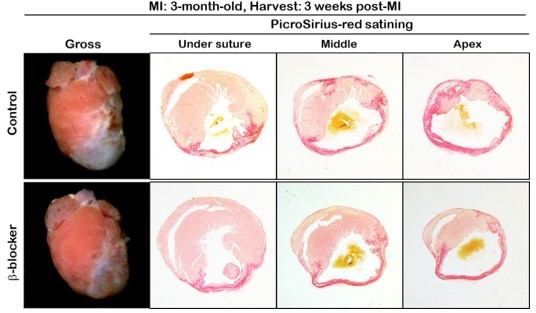
Scar area is reduced in β-blocker treated hearts 3 weeks post MI.
Hearts were subjected to LAD ligation at P7 and treated with β-blocker from P8 for 3 weeks. Scar area was analyzed by sirius red staining of transverse sections at P28. Serial sections were cut at 200μm intervals from the site of the ligature to the apex. Red region indicates fibrotic scar area. Scale bar: 500μm.
Figure 2—figure supplement 2
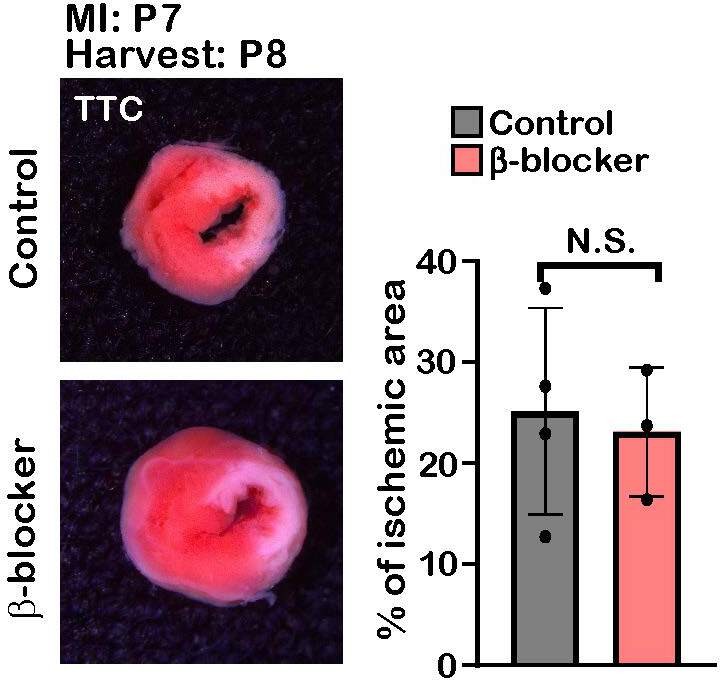
β-blocker doesn’t have cardioprotective effect at juvenile period.
2,3,5-Tripherylterazolium chloride (TTC) staining of control and β-blocker treated hearts 1 day post-MI. Right panel showed the % of ischemic area of each heart. Student t-test. N.S., not significant.
Figure 3 with 1 supplement
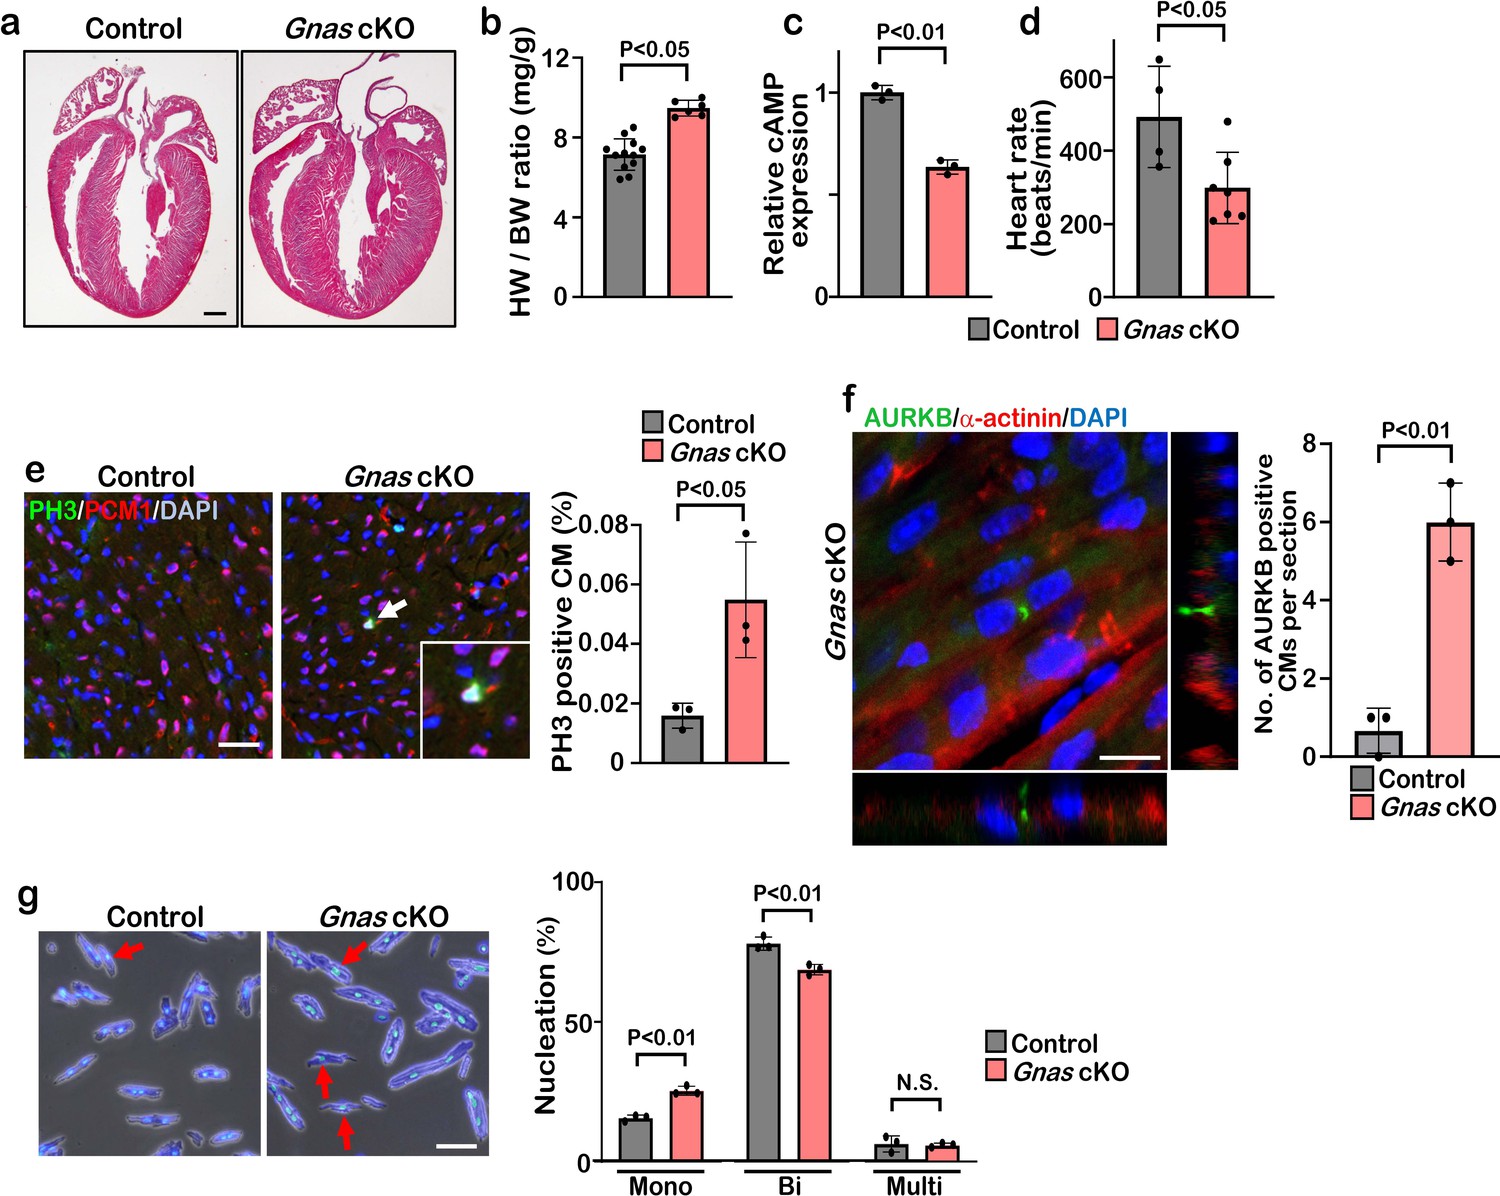
Deletion of Gnas promotes cardiomyocyte proliferation.
(a) Hematoxylin and eosin staining of P7 control and Gnas cKO heart sections. Scale bar: 500μm. (b) Heart weight (HW) to body weight (BW) ratio of P7 Gnas cKO mice. Data are as mean ± SD, Student’s t-test, n≥5. (c) Relative cAMP level in P7 control and Gnas cKO hearts. Data are as mean ± SD, Student’s t-test, n=3. (d) Heart rate at P14 in control and Gnas cKO mice. Data are as mean ± SD, Student’s t-test, n≥4. (e) PH3 and PCM1 staining of left ventricle sections of control and Gnas cKO mice at P14 (left panel). Arrow indicates PH3-positive CM. Inset shows high-magnification image of PH3-positive CM. Quantification of PH3 positive cardiomyocytes (right panel). Data are as mean ± SD, Student’s t-test, n=3. Scale bar: 50μm. (f) Aurora kinase B (AURKB) staining of P7 Gnas cKO heart (left panel). Quantification of AURKB-positive cardiomyocytes in the control and Gnas cKO mice (right panel). Data are as mean ± SD, Student’s t-test, n=3. Scale bar: 10 μm. (g) DAPI staining of isolated cardiomyocytes from P14 control and Gnas cKO hearts (left panel). Quantification of mono-nucleated, bi-nucleated and multi-nucleated cardiomyocytes in P14 Gnas cKO hearts (right panel). Data are as mean ± SD, Student’s t-test, n=3. Scale bar: 50μm.
Figure 3—figure supplement 1
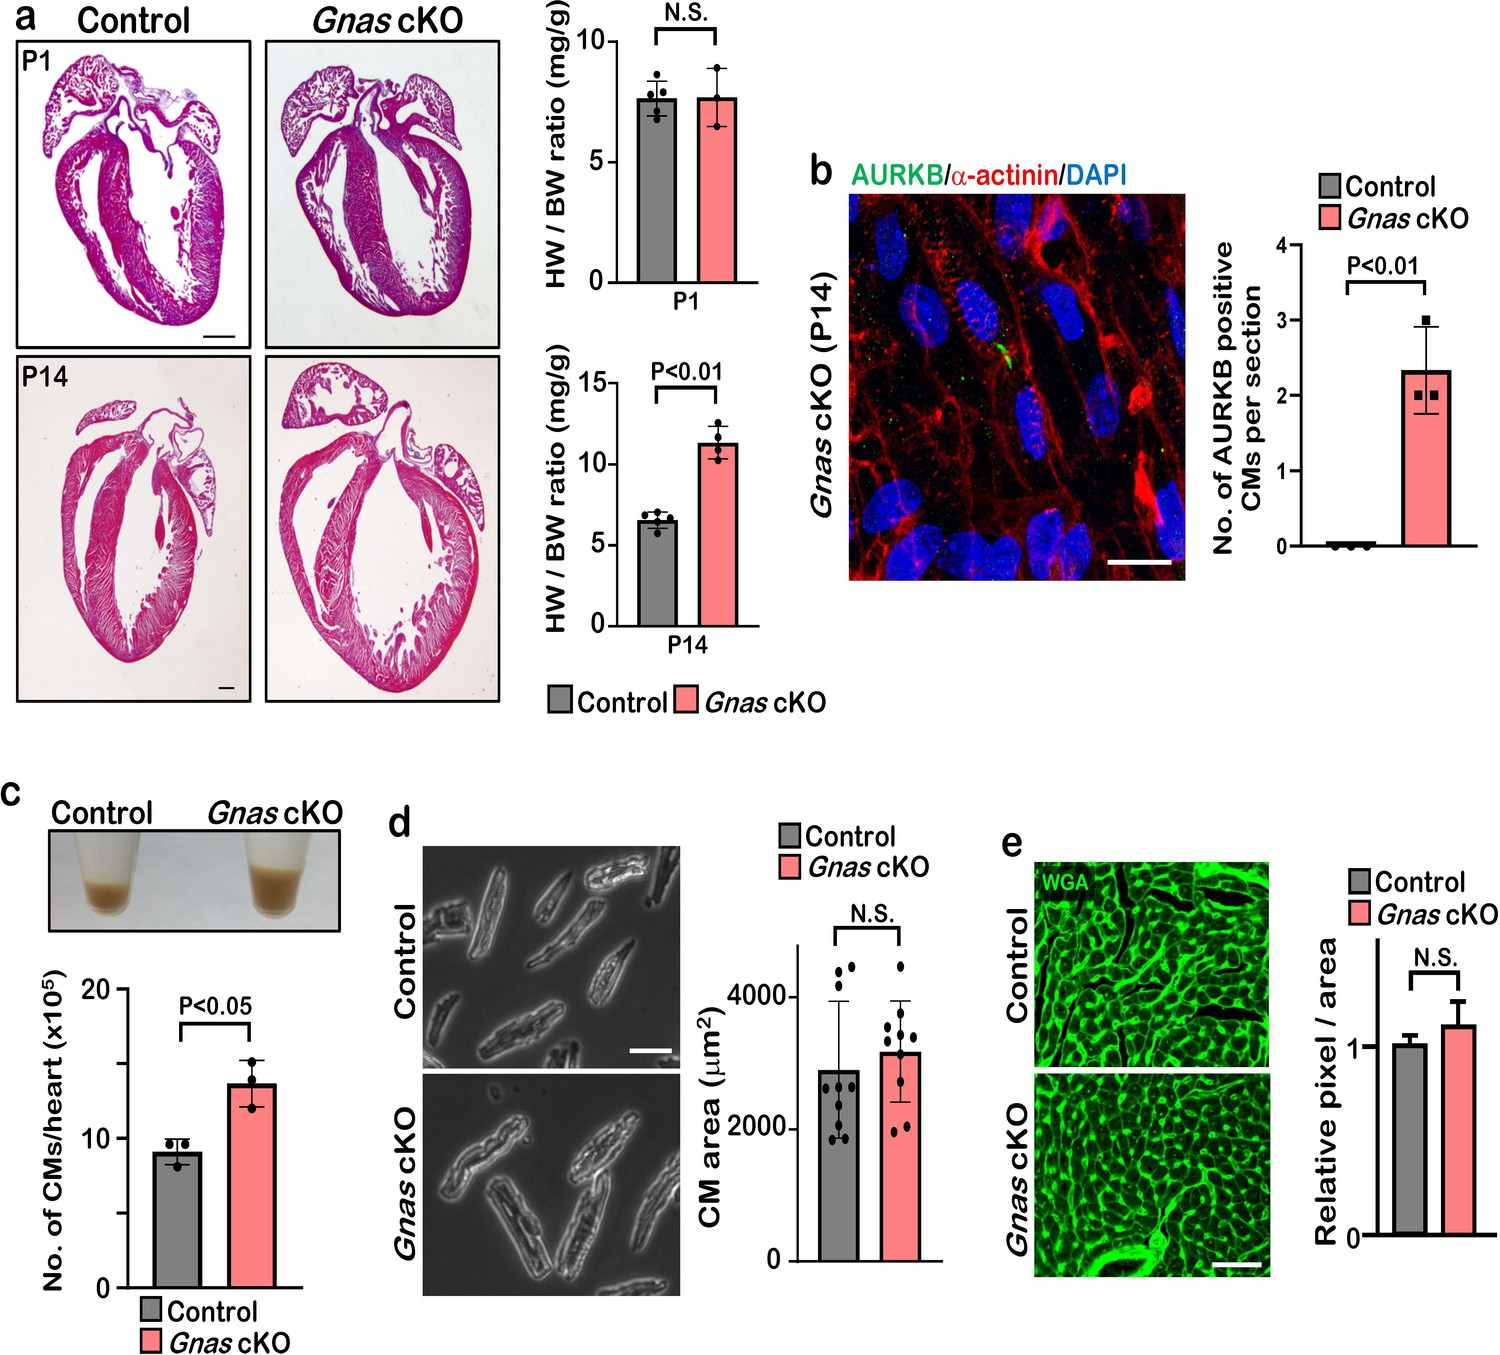
Gnas cKO hearts exhibit enlarged phenotype but do not show cardiac hypertrophy.
(a) H&E staining of control and Gnas cKO hearts at P1 (upper panels) and P14 (lower panels) and quantification of heart weight-to-body weight ratio of control and Gnas cKO neonates at P1 and P14, respectively. Data are as mean ± SD, Student’s t-test, n≥3. Scale bar: 500μm. (b) Aurora kinase B (AURKB) staining of P14 Gnas cKO heart (left panel). Quantification of AURKB positive cardiomyocytes in the control and Gnas cKO mice (right panel). Scale bar: 10 μm. (c) Pellet of cardiomyocytes isolated from a WT and Gnas cKO heart at P14 (upper panel) and quantification of number of isolated cardiomyocytes (lower panel). Data are as mean ± SD, Student’s t-test, n=3. (d) Isolated cardiomyocytes from control and Gnas cKO mice at P14 (left panel). Scale bar: 100μm. Quantification of the area of isolated cardiomyocytes measured with Image J software (right panel). Data are as mean ± SD, 20 cardiomyocytes from 9 individual hearts were measured, Student’s t-test was used. (e) Wheat germ agglutinin (WGA) staining of P14 control and Gnas cKO heart sections (left panel). Quantification of relative pixel per area of WGA-positive cardiomyocytes (right panel). N.S., not significant. Data are as mean ± SD, Student’s t-test, n=8. Scale bar: 50μm.
Figure 4 with 2 supplements

Inhibition of βAR-Gαs signaling leads to elevation of YAP activity in the cardiomyocytes.
(a) Functional enrichment of GO terms for the common down-regulated genes in Gnas cKO and β-blocker treated hearts at P7 (fold change ≤0.8). (b) GSEA plot shows that fatty acid metabolic genes are down-regulated in Gnas cKO and β-blocker-treated hearts. (c) Q-PCR analysis of fatty acid metabolism related genes in control and Gnas cKO hearts at P14. Data are as mean ± SD, Student’s t-test, n=3. (d) Transmission electron microscopy images of mitochondria in ventricular cardiomyocytes of P14 control and Gnas cKO hearts. Scale bar: 600 nm. (e) Q-PCR analysis of mitochondrial DNA in control and Gnas cKO hearts at P14. Mitochondrial DNA copy number was normalized to nuclear DNA copy number (mtDN1 vs. H19, and mtDN2 vs. Mx1). Data are as mean ± SD, Student’s t-test, n=3. (f) Functional enrichment of GO term for the up-regulated genes in Gnas cKO and β-blocker treated hearts at P7 (fold change ≥1.2). (g) GSEA plot showed that YAP signature genes are up-regulated in Gnas cKO and β-blocker treated hearts. (h) Q-PCR analysis of YAP target gene expression, Ccn2 and Ankrd1, in control and β-blocker treated hearts at P14. Data are as mean ± SD, Student’s t-test, n=3. (i) YAP and cardiac α-actinin immunostaining of heart sections from control and β-blocker treated mice at P7 (n=3). Inset shows high-magnification image of nuclear YAP in CMs. Scale bar: 50μm. (j) Heart weight (HW) to body weight (BW) ratio of P14 control (n=15), control with β-blocker (n=13), Yap cKO (n=4), and Yap cKO with β-blocker (n=5) treated mice. Data are as mean ± SD, ANOVA test, N.S., not significant. (k) Quantification of the number of PH3 positive cardiomyocytes per view. Data are as mean ± SD, ANOVA test, n=4. N.S., not significant.
Figure 4—figure supplement 1
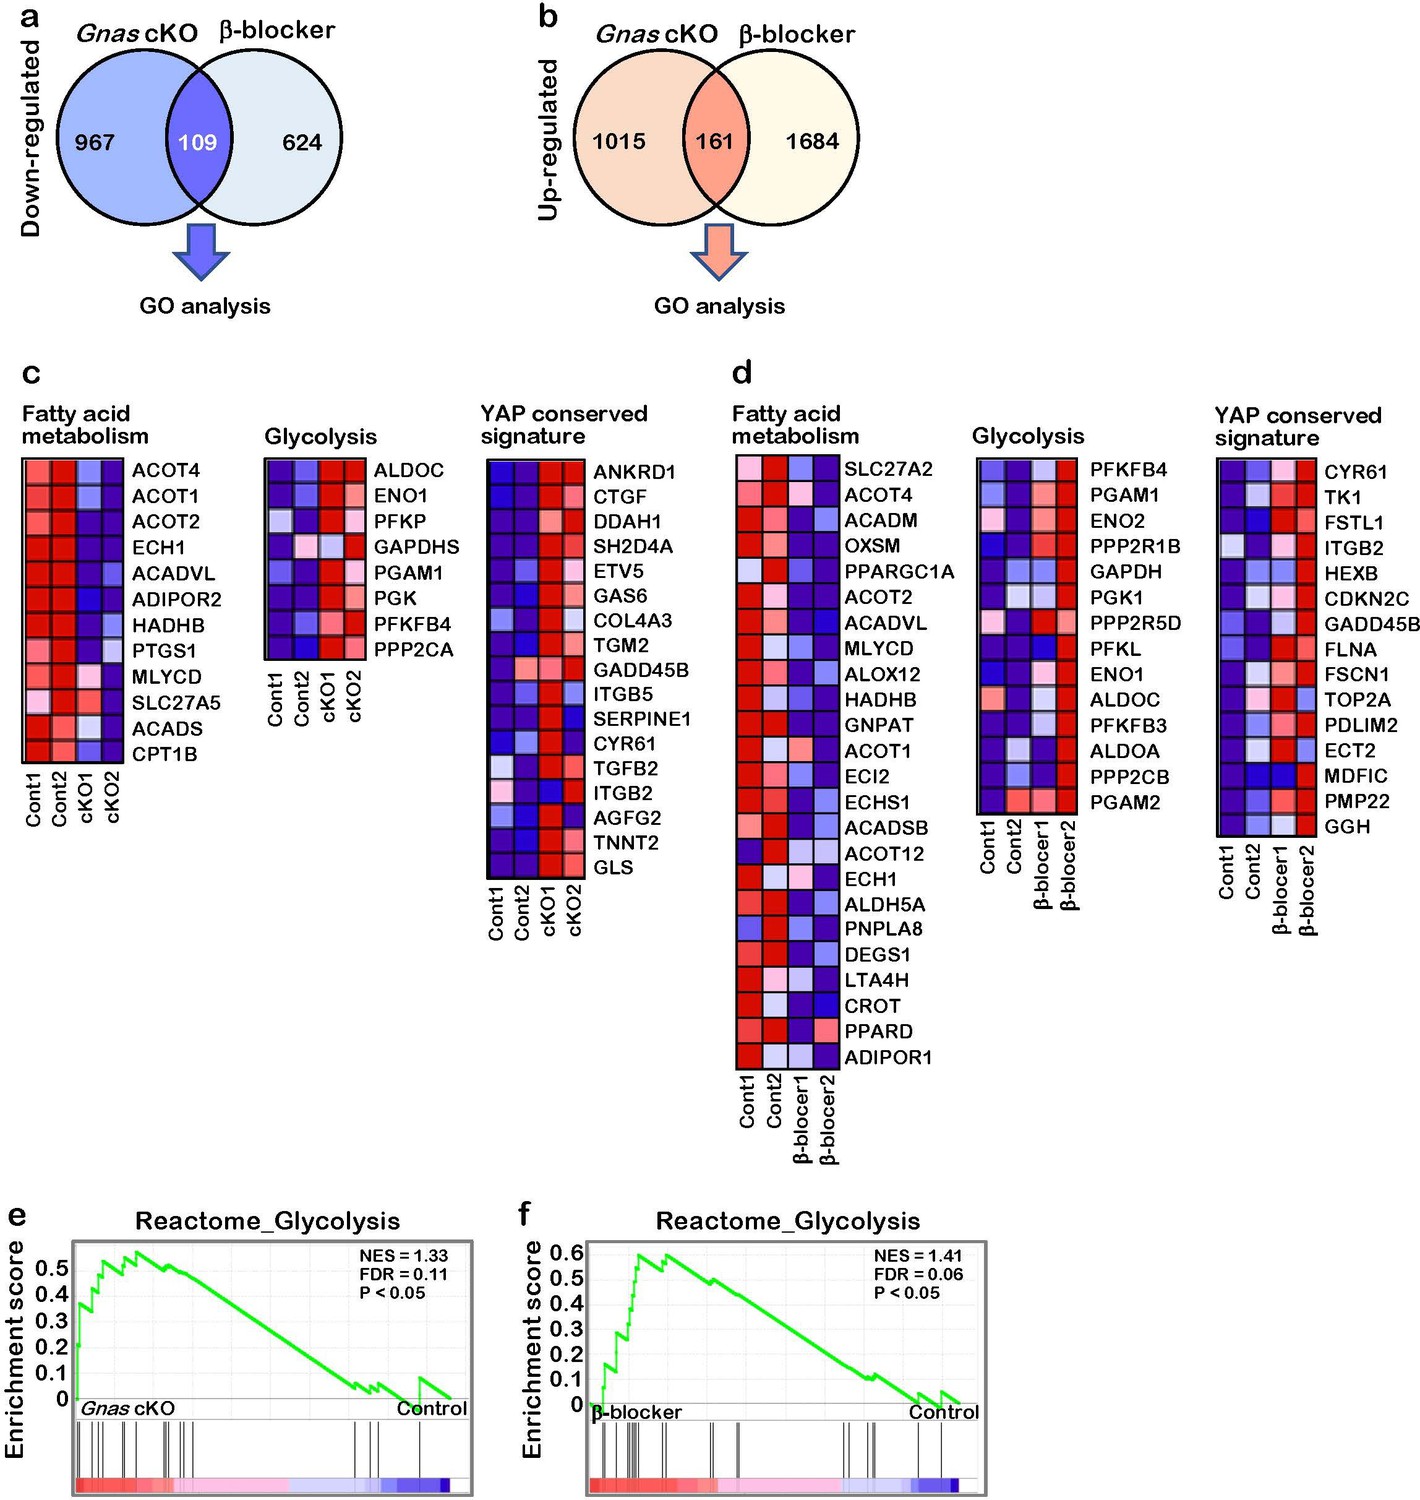
Differential gene expression in Gnas cKO and β-blocker-treated hearts.
(a) The Venn diagram shows the down-regulated genes in Gnas cKO and β-blocker treated hearts at P7 (fold change ≤0.8). The total and overlay numbers of down-regulated genes are 1700 and 109, respectively. The overlapped genes were used for GO analysis. (b) The Venn diagram shows the up-regulated genes in Gnas cKO and β-blocker-treated hearts at P7 (fold change ≥1.2). The total and overlay numbers of up-regulated genes are 2860 and 161, respectively. The overlapped genes were used for GO analysis. (c) Heat map of fatty acid metabolism, glycolysis, and YAP signature related gene expression from RNA-seq data, Control vs. Gnas cKO hearts. (d) Heat map of fatty acid metabolism, glycolysis, and YAP signature related gene expression from RNA-seq data, Control vs. β-blocker-treated hearts. (e) GSEA identified significant enrichment of glycolysis related gene expression in Gnas cKO hearts. (f) GSEA identified significant enrichment of glycolysis related gene expression in β-blocker treated hearts.
Figure 4—figure supplement 2
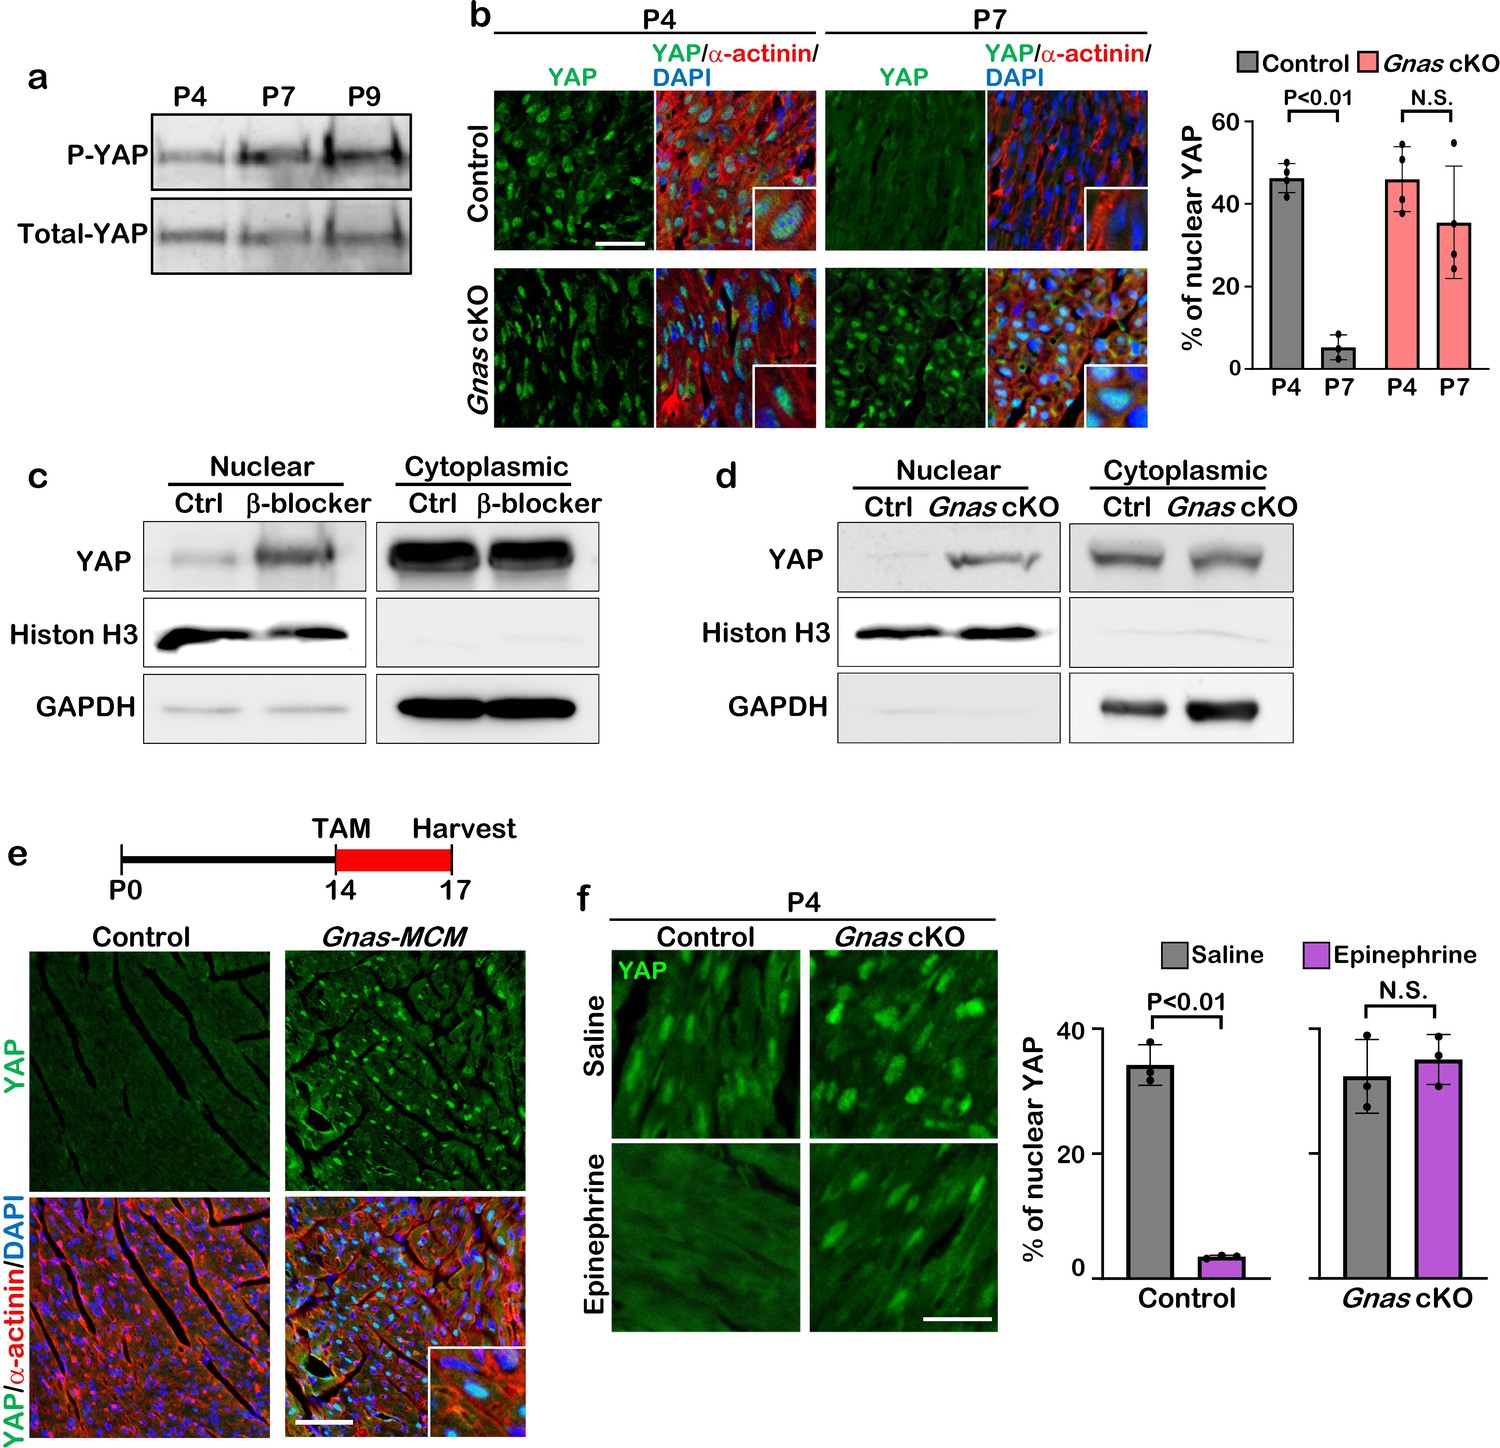
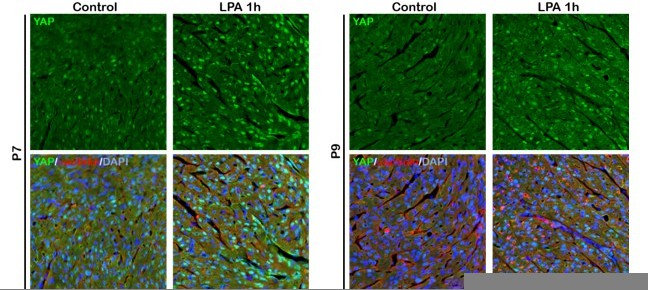
YAP activity is regulated by Gαs.
(a) Western blot analysis of lysate from P4, P7, and P9 hearts using phospho-YAP (P-YAP) or total YAP antibodies. (b) YAP and cardiac α-actinin immunostaining of P4 and P7 control and Gnas cKO heart sections (left panel). Inset shows high-magnification image of nuclear YAP in CMs. Scale bar: 25μm. Quantification of nuclear YAP localization in cardiomyocytes of control and Gnas cKO hearts (right panel). Data are as mean ± SD, Student’s t-test, n≥3. (c) Fractionation assay of P14 control and β-blocker-treated hearts. Histone H3 is a positive marker for the nuclear fraction and GAPDH is a positive marker for the cytoplasmic fraction. (d) Fractionation assay of P14 control and Gnas cKO hearts. Histone H3 is a positive marker for the nuclear fraction and GAPDH is a positive marker for the cytoplasmic fraction. (e) Schematic illustration of experimental design. Tamoxifen (TAM) was injected into Gnasflox/flox; Myh6MerCreMer (Gnas-MCM) mice at P14, and hearts were harvested at P17 (upper panel). YAP and cardiac α-actinin co-immunostaining of heart sections from control and Gnas cKO hearts at P17 (lower panel). Inset shows high-magnification image of nuclear YAP in CMs. Scale bar: 50μm. (f) YAP immunostaining of P4 WT and Gnas cKO hearts treated with saline or epinephrine (left panel). Scale bar: 25μm. Quantification of nuclear YAP localization in cardiomyocytes of P4 WT and Gnas cKO heart treated with saline or epinephrine (right panel). Data are as mean ± SD, Student’s t-test, n=3. N.S., not significant. The online version of this article includes the source data for Figure 4-figure supplement 2.
-
Figure 4—figure supplement 2—source data 1
Raw data of Western Blots.
- https://cdn.elifesciences.org/articles/74576/elife-74576-fig4-figsupp2-data1-v2.zip
Figure 5 with 2 supplements
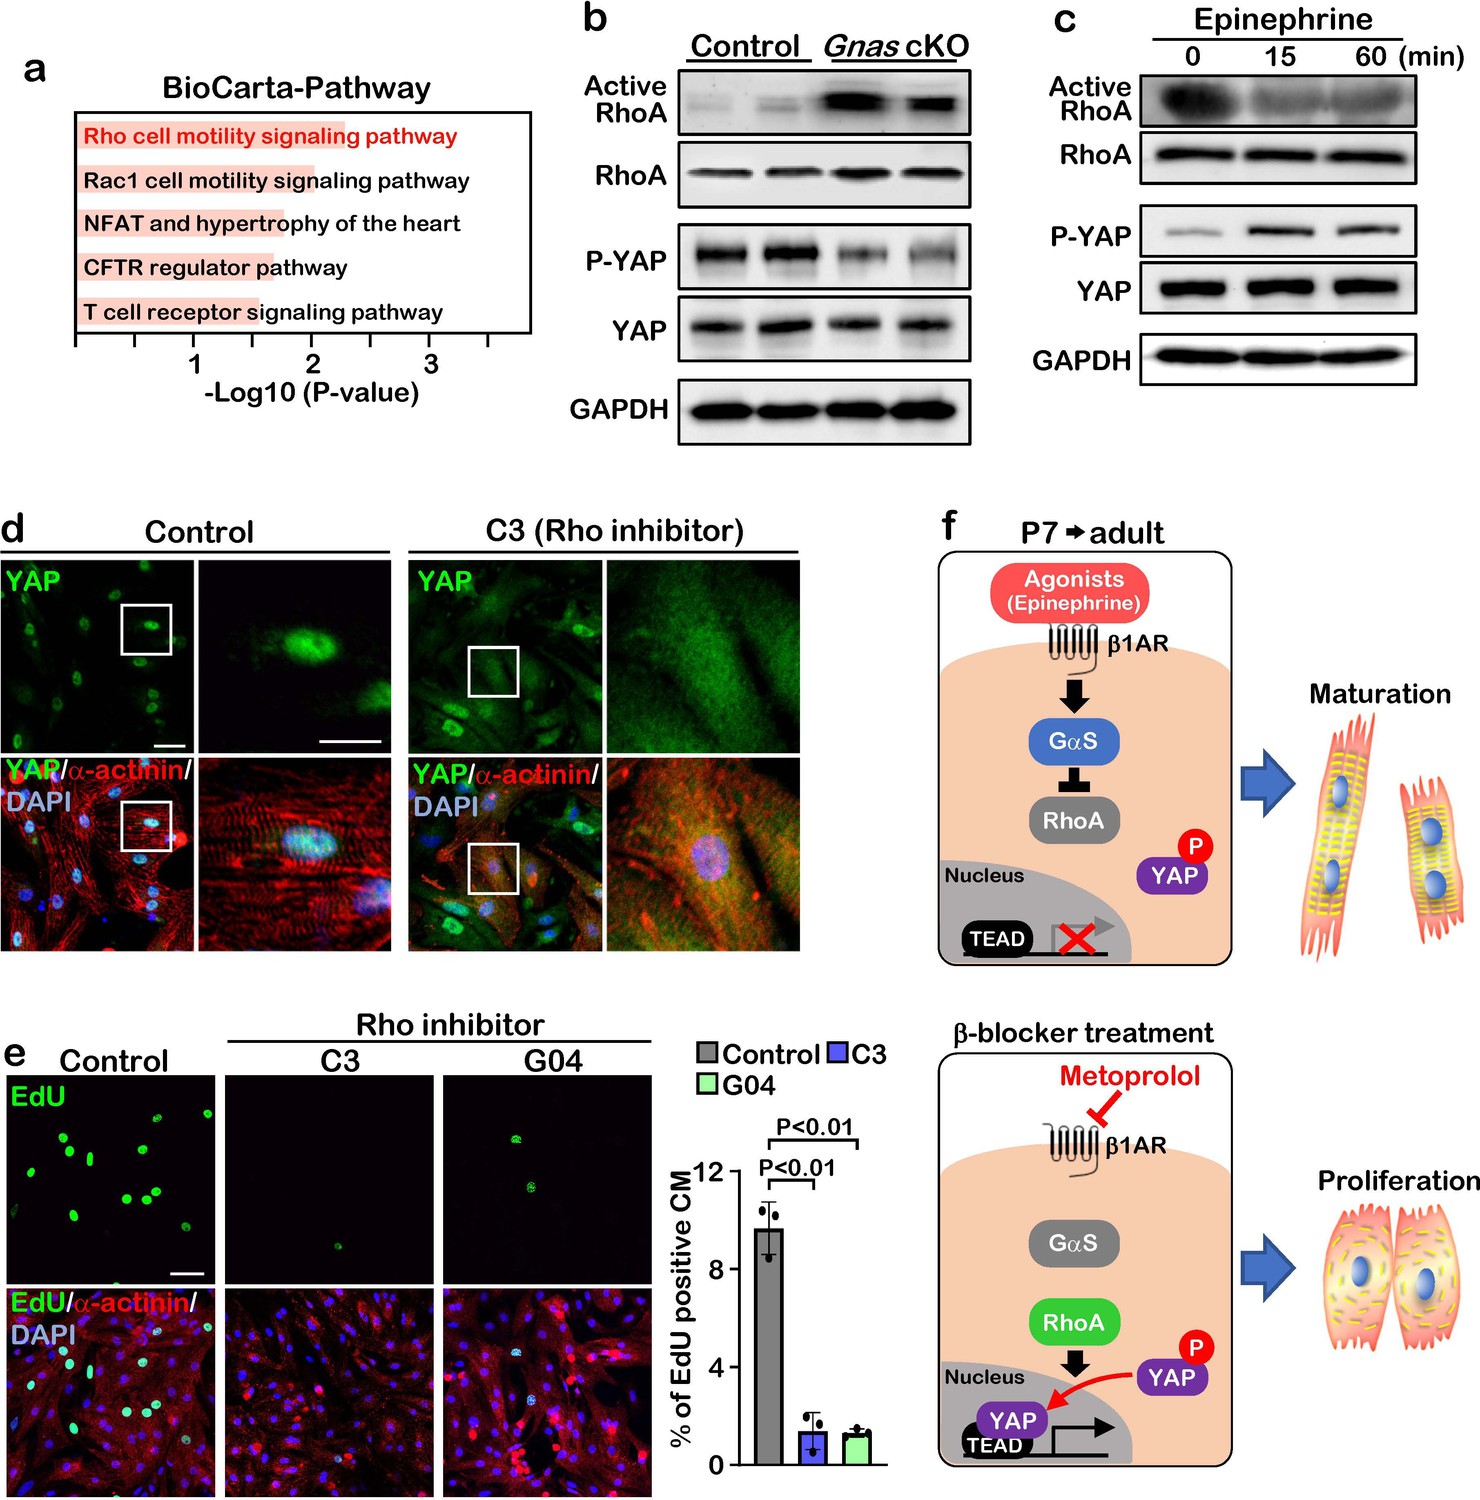
GαS regulates cardiomyocyte proliferation through RhoA mediated YAP activation.
(a) Functional enrichment of GO terms for the common up-regulated genes. (b) Active-RhoA pull-down assay and western blot analysis of P7 control and Gnas cKO hearts. (c) Active-RhoA pull-down assay and western blot analysis of cultured cardiomyocytes with epinephrine treatment. (d) Immunostaining of YAP in cultured cardiomyocytes treated with C3 (Rho inhibitor). Scale bar: 50μm (left panel) and 25μm (right panel). (e) EdU incorporation assay on rat neonatal cardiomyocytes treated with Rho inhibitors (left panel). Quantification of EdU-labelled proliferating cardiomyocytes stained with cardiac α-actinin. Data are as mean ± SD, n=3 (right panel). Scale bar: 50μm. (f) Model of β1-AR-Gαs signaling regulation of cardiomyocyte proliferation. The online version of this article includes the source data for Figure 5.
-
Figure 5—source data 1
Raw data of Western Blots.
- https://cdn.elifesciences.org/articles/74576/elife-74576-fig5-data1-v2.zip
Figure 5—figure supplement 1
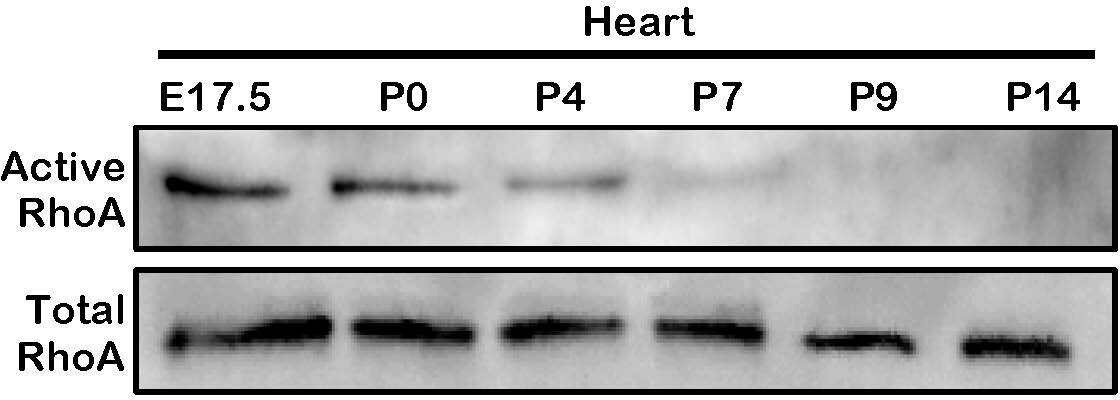
RhoA activity is only detected in the embryonic and postnatal hearts.
Active-RhoA pull-down assay of wild type hearts at several time points. The online version of this article includes the following source data for Figure 5—figure supplement 1.
-
Figure 5—figure supplement 1—source data 1
Raw data of Western Blots.
- https://cdn.elifesciences.org/articles/74576/elife-74576-fig5-figsupp1-data1-v2.zip
Figure 5—figure supplement 2
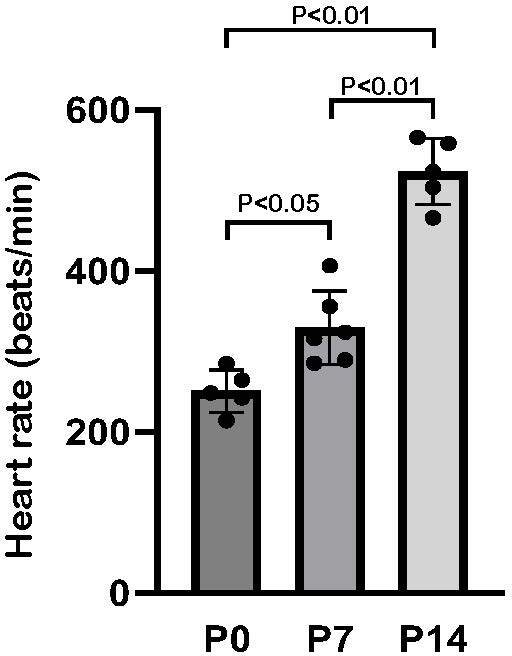
Comparison of heart rate at different ages.
Heart rate at P0, P7, and P14 in C57BL6 mice. Data are as mean ± SD, n≥5.
Author response image 1
Author response image 2
Tables
Appendix 1—key resources table
| Reagent type (species) or resource | Designation | Source or reference | Identifiers | Additional information |
|---|---|---|---|---|
| gene (Mus musculus) | Gnas | NCBI | Gene:14683 | |
| strain, strain background (Mus musculus) | C57BL/6 J | The Jackson Laboratory | IMSR_JAX:000664 | |
| genetic reagent (Mus musculus) | Gnasflox/flox | The Jackson Laboratory | IMSR_JAX:035239 | |
| genetic reagent (Mus musculus) | Yapflox/flox | Xin et al., 2011 | ||
| genetic reagent (Mus musculus) | Myh6-Cre | Sanbe et al., 2003 | ||
| genetic reagent (Mus musculus) | Myh6-MerCreMer | Sohal et al., 2001 | ||
| biological sample (Rattus norvegicus) | Primary neonatal rat cardiomyocytes | In this paper | Freshly isolated from neonatal rats | |
| antibody | PCM1 (rabbit polyclonal) | Sigma | Car#: HPA023370 | IHC (1:1000) |
| antibody | Phspho-histon H3 (PH3) (mouse monoclonal) | Millipore | Car#: 05–806 | IHC (1:100) |
| antibody | Sarcomeric a-actinin (mouse monoclonal) | Sigma | Car#: A7811 | IHC (1:200) |
| antibody | Cardiac Troponin T (mouse monoclonal) | Thermo | Car#: MA295-P1 | IHC (1:200) |
| antibody | YAP (Rabbit monoclonal) | Cell Signaling | Cat#: 14074 | IHC (1:100) |
| antibody | YAP (Rabbit polyclonal) | Novus | Cat#: NB110-58358 | WB (1:1000) |
| antibody | Phospho-YAP (Rabbit monoclonal) | Cell Signaling | Cat#: 13008 | WB (1:1000) |
| antibody | RhoA (Rabbit monoclonal) | Cell Signaling | Cat#: 2117 | WB (1:1000) |
| antibody | GAPDH (Rabbit monoclonal) | Cell Signaling | Cat#: 2118 | WB (1:1000) |
| antibody | Ki67 (Rabbit monoclonal) | Thermo | Cat#: RM9106 | IHC (1:200) |
| antibody | Aurora B (AurkB) (Rabbit polyclonal) | Abcam | Cat#: ab2254 | IHC (1:100) |
| antibody | Histon H3 (Rabbit polyclonal) | Abcam | Cat#: ab1791 | WB (1:3000) |
| sequence- based reagent | Hmgcs2-F | This paper | qPCR primer | GAAGAGAGCGA TGCAGGAAAC |
| sequence- based reagent | Hmgcs2-R | This paper | qPCR primer | GTCCACATATT GGGCTGGAAA |
| sequence- based reagent | Nqo1-F | This paper | qPCR primer | AGGATGGGAG GTACTCGAATC |
| sequence- based reagent | Nqo1-R | This paper | qPCR primer | TGCTAGAGATG ACTCGGAAGG |
| sequence- based reagent | Pla2g4e-F | This paper | qPCR primer | AGGTGGAGTTC CTACTCGAAG |
| sequence- based reagent | Pla2g4e-R | This paper | qPCR primer | TGTTCTCGAAGG AGTCTGTCA |
| sequence- based reagent | Pla2g5-F | This paper | qPCR primer | CCAGGGGGCT TGCTAGAA |
| sequence- based reagent | Pla2g5-R | This paper | qPCR primer | AGCACCAATC AGTGCCATCC |
| sequence- based reagent | mtDN1-F | This paper | qPCR primer | CTCTTATCCACG CTTCCGTTACG |
| sequence- based reagent | mtDN1-R | This paper | qPCR primer | GATGGTGGTAC TCCCGCTGTA |
| sequence- based reagent | mtDN2-F | This paper | qPCR primer | CCCATTCCACT TCTGATTACC |
| sequence- based reagent | mtDN2-R | This paper | qPCR primer | ATGATAGTAGAG TTGAGTAGCG |
| sequence- based reagent | CTGF-F | This paper | qPCR primer | GGGCCTCTT CTGCGATTTC |
| sequence- based reagent | CTGF-R | This paper | qPCR primer | ATCCAGGCAAG TGCATTGGTA |
| sequence- based reagent | Ankrd1-F | This paper | qPCR primer | GGATGTGCCGA GGTTTCTGAA |
| sequence- based reagent | Ankrd1-R | This paper | qPCR primer | GTCCGTTTATAC TCATCGCAGAC |
| commercial assay or kit | Neonatal cardiomyocyte isolation kit | Cellutron | NC-6031 | |
| commercial assay or kit | RNeasy mini kit | Qiagen | 74104 | |
| chemical compound, drug | Epinephrine | Sigma | E4375 | 100 mM |
| chemical compound, drug | C3 | Cytoskeleton | CT04 | 1 mg/ml |
| chemical compound, drug | GO4 | Provided by Dr. Yi Zheng | 100 mM | |
| chemical compound, drug | Tamoxifen | Sigma | T5648 | 50 mg/kg, IP injection |
| chemical compound, drug | Metoprolol (b-blocker) | Sigma | M5391 | 2 mg/kg, IP injection |
| chemical compound, drug | 5-ethynyl-2- deoxyuridine (EdU) | Thermo | Cat#: C10337 | 5 mg/kg, IP injection |
| software, algorithm | ImageJ | National Institutes of Health (NIH) | ||
| other | 4',6-diamidino-2- phenylindole (DAPI) | Invitrogen | D1306 | For nuclear staining |
| other | Wheat germ agglutinin (WGA) | Invitrogen | W11261 | For plasma membrane staining |
| other | Collagenase B | Roche | 11088815001 | 1.8 mg/ml For heart digestion |
| other | Collagenase D | Roche | 11088866001 | 2.4 mg/ml For heart digestion |
| other | 2,3,5- Tripherylterazolium chloride (TTC) | Sigma | T8877 | For staining of ischemic region |
Additional files
Download links
A two-part list of links to download the article, or parts of the article, in various formats.
Downloads (link to download the article as PDF)
Open citations (links to open the citations from this article in various online reference manager services)
Cite this article (links to download the citations from this article in formats compatible with various reference manager tools)
Inhibition of β1-AR/Gαs signaling promotes cardiomyocyte proliferation in juvenile mice through activation of RhoA-YAP axis
eLife 11:e74576.
https://doi.org/10.7554/eLife.74576


