Structural and functional properties of a magnesium transporter of the SLC11/NRAMP family
- Department of Biochemistry, University of Zurich, Switzerland
Figures
Figure 1 with 1 supplement

Phylogenetic analysis of the SLC11/NRAMP family.
(A) Model of the consensus ion binding site of NRAMP transporters as obtained from the X-ray structure of ScaDMT (PDBID 5M95) in complex with Mn2+. Regions of α1 and α6 are shown as Cα-trace, selected residues coordinating the ion as sticks. (B) Phylogenetic tree of SLC11 residues with different clades of the family highlighted. Selected family members are indicated. The consensus sequence of the respective ion binding site of each clade is shown.
Figure 1—figure supplement 1
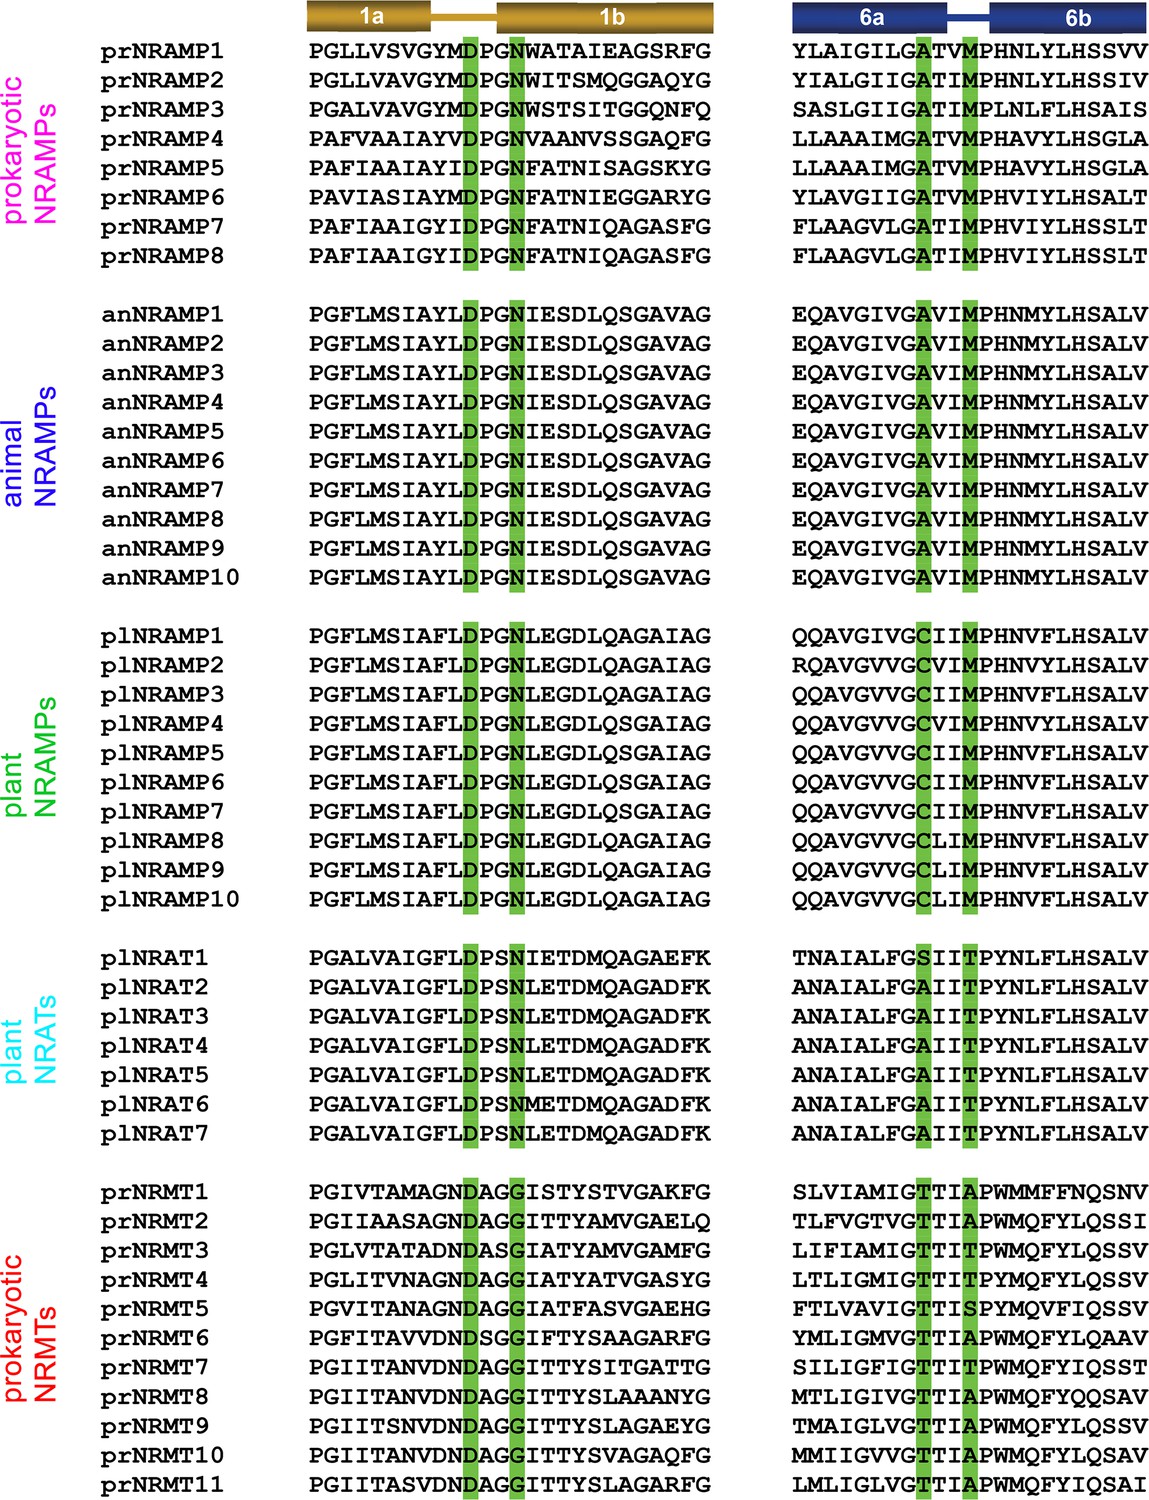
Sequence alignment of selected protein regions of SLC11 family members.
Residues constituting the ion binding site are highlighted in green. Secondary structure elements are indicated on the top. Prokaryotic NRAMPSs (prNRAMP): 1 D. radiodurans (Uniprot: Q9RTP8), 2 S. capitis (Uniprot: A0A4U9TNH6), 3 E. coelocola (Uniprot: E4KPW4), 4 E. coli (UniProt: sp|P0A769|MNTH_ECOLI), 5 M. tuberculosis (UniProt: sp|P9WIZ5|MNTH_MYCTU), 6 B. subtilis (UniProt: sp|P96593|MNTH_BACSU), 7 S. typhimurium (Uniprot: sp|Q9RPF4|MNTH_SALTY), 8 P. aeruginosa (Uniprot: sp|Q9RPF3|MNTH1_PSEAE). Animal NRAMPs (anNRAMP): 1 H. sapiens NRAMP2 (NCBI: NP_001366375.1), 2 P. paniscus NRAMP2 (NCBI: XP_008949491.1), 3 C. sabaeus NRAMP2 (NCBI: XP_037853046.1), 4 R. roxellana NRAMP2 (NCBI: XP_010383634.1), 5 M. mulatta NRAMP2 (NCBI: EHH20731.1), 6 E. caballus NRAMP2 (NCBI: XP_023499318.1), 7 C. canadensis NRAMP2 (NCBI: XP_020035491.1), 8 H. hyaena NRAMP2 (NCBI: XP_039097283.1), 9 C. ferus NRAMP2 (NCBI: XP_032348726.1), 10 B. indicus NRAMP2 (NCBI: XP_019816126.1). Plant NRAMPs (plNRAMP): 1 P. vulgaris (NCBI: XP_007155869.1), 2T. subterraneum (NCBI: GAU12542.1), 3 G. max (NCBI: NP_001344702.1), 4 C. arietinum (NCBI: XP_004511877.1), 5 D. chrysotoxum (NCBI: KAH0462125), 6T. cacao (NCBI: XP_007047433.1), 7 V. unguiculata (NCBI: XP_027914252.1), 8 G. soja (NCBI: KAG4933418.1), 9 M. truncatula (NCBI: XP_003611648.1), 10 A. annua (NCBI: PWA53748.1). Plant NRATs (plNRAT): 1 O. sativa (NCBI: XP_015625418.1), 2 D. oligosanthes (NCBI: OEL35611.1), 3 S. italica (NCBI: XP_004952002.1), 4 S. bicolor (NCBI: XP_002451480.2), 5 P. miliaceum (NCBI: RLM80353.1), 6 P. virgatum (NCBI: XP_039819678.1), 7 Z. mays (NCBI: PWZ19830.1). Prokaryotic NRMTs (prNRMT): 1 P. propionicus (NCBI: WP_011735082.1), 2 M. australiensis (NCBI: WP_013780282.1), 3 C. saccharolyticus (NCBI: WP_011916762.1), 4 A. bacterium (NCBI: PYS45348.1), 5 G. bemidjiensis (NCBI: WP_012531668.1), 6T. narugense (NCBI: PMP85905.1), 7 C. acetobutylicum (NCBI: WP_034583260.1), 8 M. paludicola (NCBI: BAI61876.1), 9 S. aciditrophicus (NCBI: WP_011418107.1), 10 S. usitatus (NCBI: WP_011688372.1), 11 E. laentae (NCBI: WP_009305646.1).
Figure 2 with 1 supplement
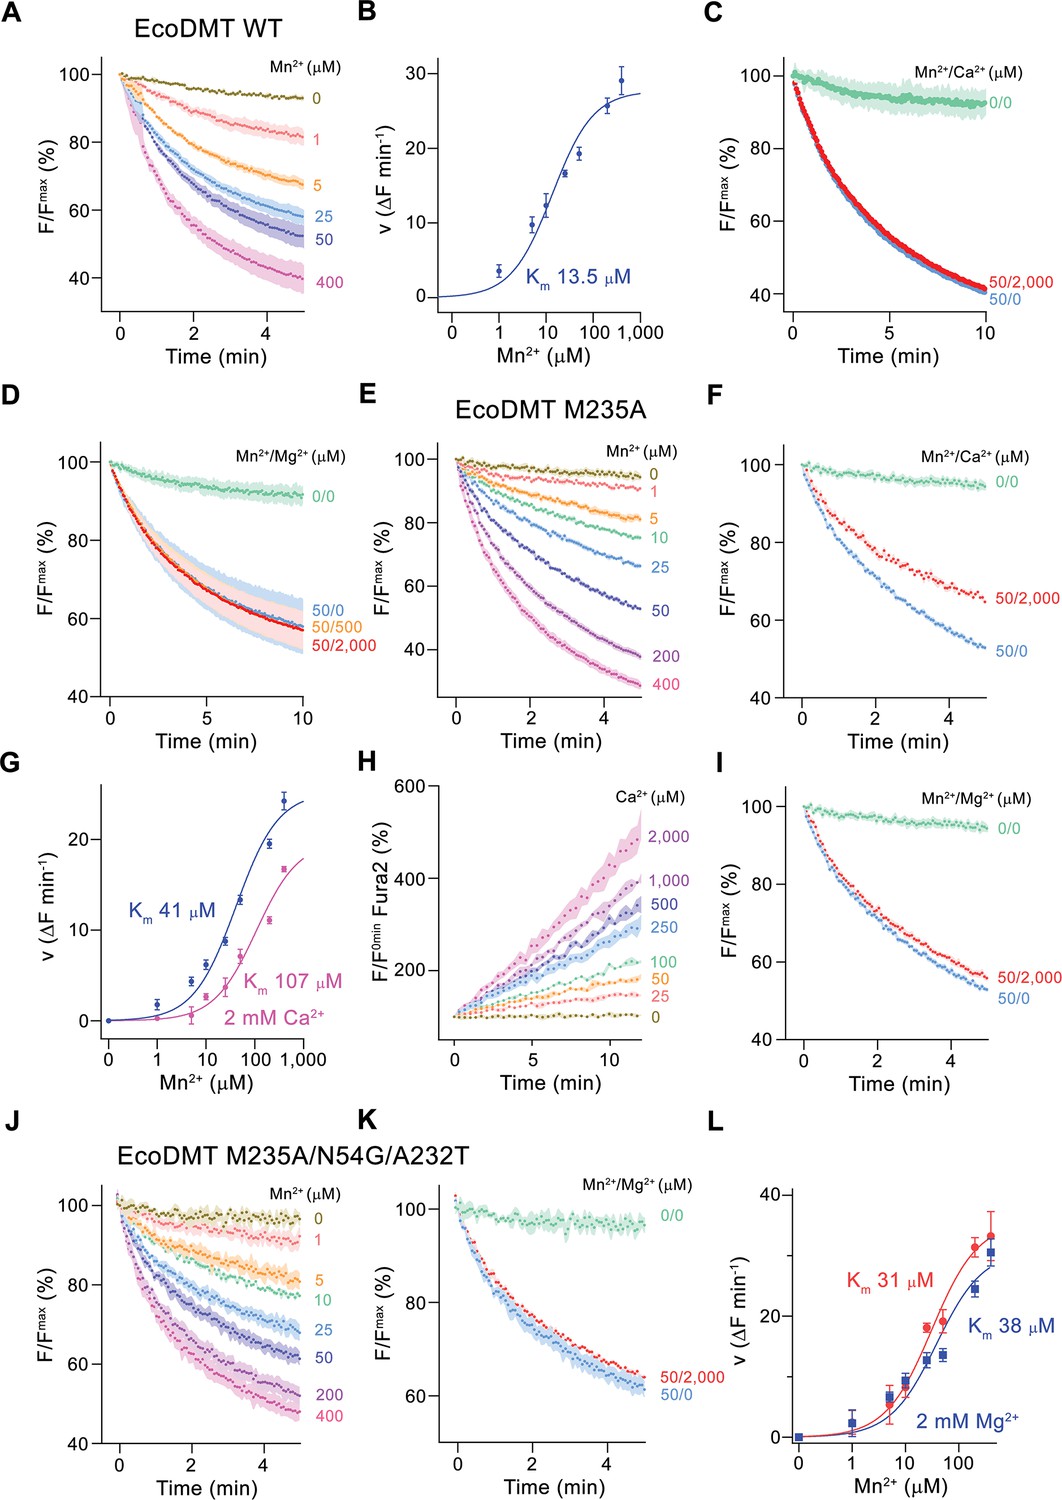
Functional characterization of EcoDMT mutants.
(A) EcoDMT-mediated Mn2+ transport into proteoliposomes. Data display mean of three experiments from three independent reconstitutions. (B) Mn2+ concentration dependence of transport. Initial velocities were derived from individual traces of experiments displayed in (A), the solid line shows the fit to a Michaelis–Menten equation with an apparent Km of 13.5 μM. (C) Mn2+ transport in presence of Ca2+. Data display mean of seven experiments from two independent reconstitutions, except for the measurement without divalent ions (0/0, green, mean of two experiments). (D) Mn2+ transport into EcoDMT proteoliposomes in presence of Mg2+. Data display mean of 3 (0/0, green), 4 (50/0, blue) and nine experiments (50/500, orange and 50/2000, red) from three independent reconstitutions. (E) Mn2+ transport into proteoliposomes containing the EcoDMT mutant M235A. Data display mean of eight experiments from three independent reconstitutions. (F) Inhibition of Mn2+ transport in the mutant M235A by Ca2+ (3 experiments from three independent reconstitutions). (G) Mn2+ concentration dependence of transport into M235A proteoliposomes. For Mn2+, initial velocities were derived from individual traces of experiments displayed in (E), for Mn2+ in presence of 2 mM Ca2+, data show mean of three experiments from three independent reconstitutions. The solid lines are fits to a Michaelis–Menten equation with apparent Km of 41 μM (Mn2+) and 107 uM (Mn2+ in presence of 2 mM Ca2+). (H) Ca2+-transport into M235A proteoliposomes assayed with the fluorophore Fura-2. Data display mean of tree experiments from three independent reconstitutions. (I) Mn2+ transport in presence of Mg2+. Data display mean of 6 experiments from three independent reconstitutions. (J) Mn2+ transport into proteoliposomes containing the EcoDMT triple mutant M235A/N54G/A232T. Data display mean of three experiments from three independent reconstitutions. (K) Inhibition of Mn2+ transport in the mutant M235A/N54G/A232T by Mg2+ (six experiments from three independent reconstitutions). (L) Mn2+ concentration dependence of transport into M235A/N54G/A232T proteoliposomes. For Mn2+, initial velocities were derived from individual traces of experiments displayed in (J), for Mn2+ in presence of 2 mM Mg2+, data show mean of three (without Mg2+, red) and six experiments (with Mg2+, blue) from three independent reconstitutions. The solid lines are fits to a Michaelis–Menten equation with apparent Km of 31 μM (Mn2+) and 38 µM (Mn2+ in presence of 2 mM Mg2+). (A, C, D, E, F, I, J, K) Uptake of Mn2+ was assayed by the quenching of the fluorophore calcein trapped inside the vesicles. (A, C, D, E, F, H, I, J, K) Averaged traces are presented in unique colors. Fluorescence is normalized to the value after addition of substrate (t = 0). Applied ion concentrations are indicated. (A–L), Data show mean of the indicated number of experiments, errors are s.e.m.
Figure 2—figure supplement 1
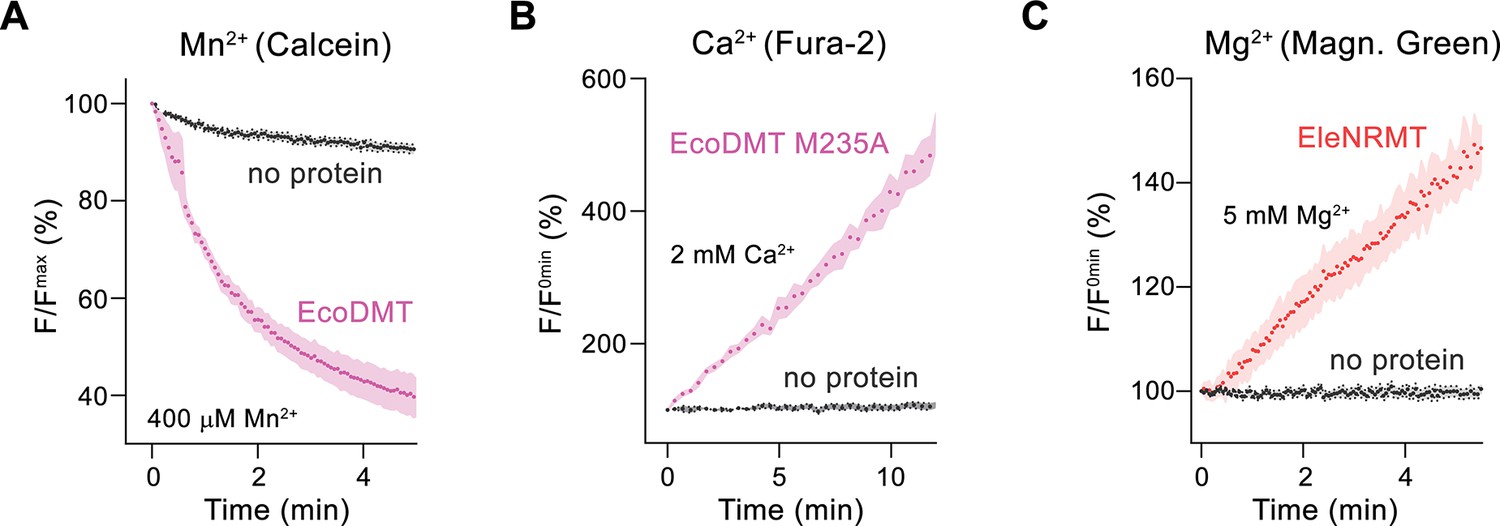
Assay controls.
Non-specific leak into protein-free liposomes in assay conditions used for the detection of different divalent cations. The respective fluorophores are trapped inside the liposomes. (A) Mn2+ transport assayed by the quenching of the fluorophore calcein. (B) Ca2+ transport assayed by the fluorescence increase of the fluorophore Fura-2. (C) Mg2+ transport assayed by the fluorescence increase of the fluorophore Magnesium Green. Traces show experiments at the highest concentration of divalent cations used in the study. The signal of protein-free liposomes (no protein) is shown in gray, the specific transport mediated by the indicated protein constructs is shown for comparison (pink for Mn2+ and Ca2+ red for Mg2+). Dots show mean values of independent replicates (A, no protein n = 12, EcoDMT n = 3; B, no protein n = 13, EcoDMT M235A n = 3; C, no protein n = 13, EleNRMT n = 3) errors are s.e.m.
Figure 3 with 2 supplements
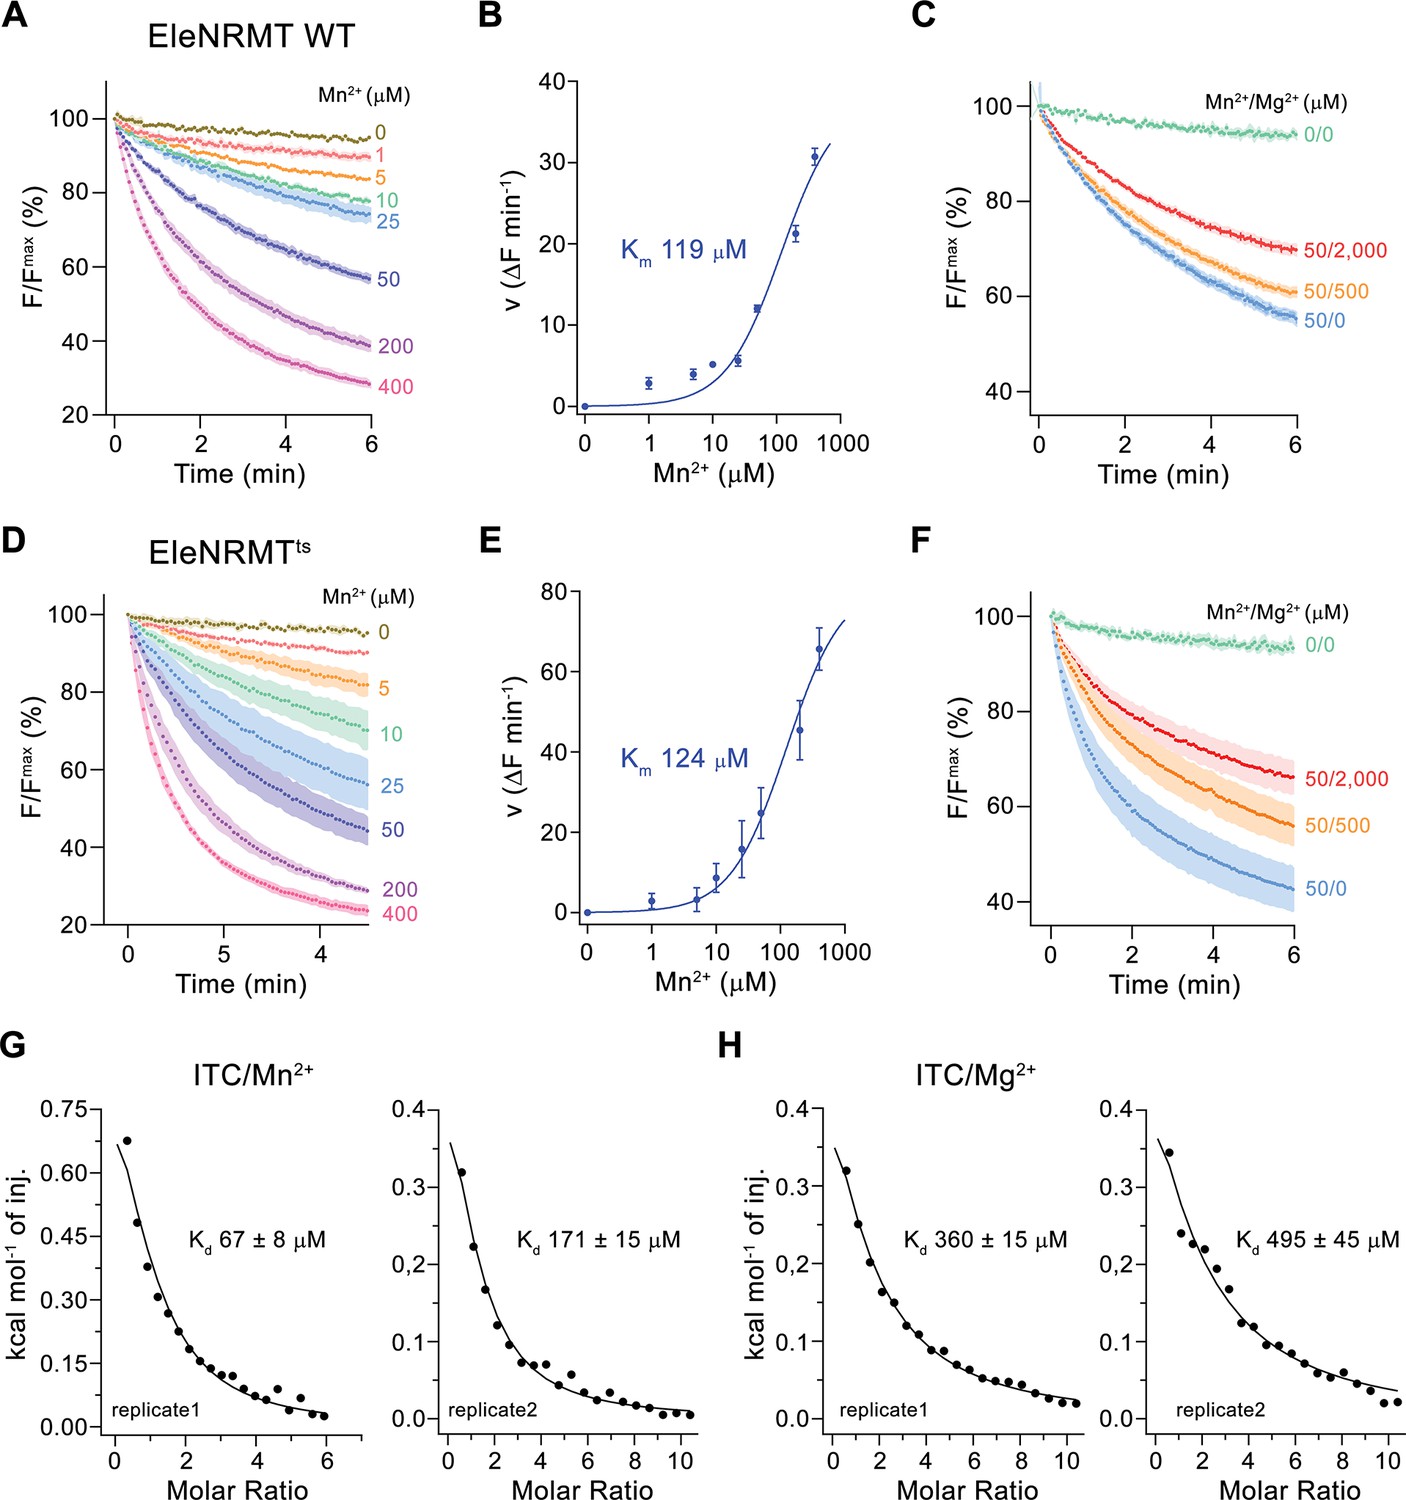
Transport properties of EleNRMT.
(A) EleNRMT mediated Mn2+ transport into proteoliposomes. Data display mean of three experiments from two independent reconstitutions. (B) Mn2+ concentration dependence of transport. Initial velocities were derived from individual traces of experiments displayed in (A), the solid line shows the fit to a Michaelis–Menten equation with an apparent Km of 119 μM. (C) Mn2+ transport in presence of Mg2+. Data display mean of 3 (0/0, green), 6 (50/0, blue), 5 (50/500, orange), and 9 (50/2000, red) experiments from two independent reconstitutions. (D) Mn2+ transport into proteoliposomes mediated by the thermostabilized mutant EleNRMTts. Data display mean of four experiments from two independent reconstitutions, except for the measurement with 25 μM Mn2+ (mean of three experiments). (E) Mn2+ concentration dependence of transport. Initial velocities were derived from individual traces of experiments displayed in (D), the solid line shows the fit to a Michaelis–Menten equation with an apparent Km of 124 μM. (F) Mn2+ transport in presence of Mg2+. Data display mean of 4 (0/0, green), 9 (50/0, blue), 11 (50/500, orange), and 8 (50/2000, red) experiments from two independent reconstitutions. A, C, D, F. Uptake of Mn2+ was assayed by the quenching of the fluorophore calcein trapped inside the vesicles. Averaged traces are presented in unique colors. Fluorescence is normalized to the value after addition of substrate (t = 0). Applied ion concentrations are indicated. (A–F), Data show mean of the indicated number of experiments, errors are s.e.m. (G–H), Binding isotherms obtained from isothermal titrations of Mn2+ (G) and Mg2+ (H) to EleNRMTts. The data shown for two biological replicates per condition was fitted to a model assuming a single binding site with the binding isotherm depicted as solid line. Errors represent fitting errors.
Figure 3—figure supplement 1
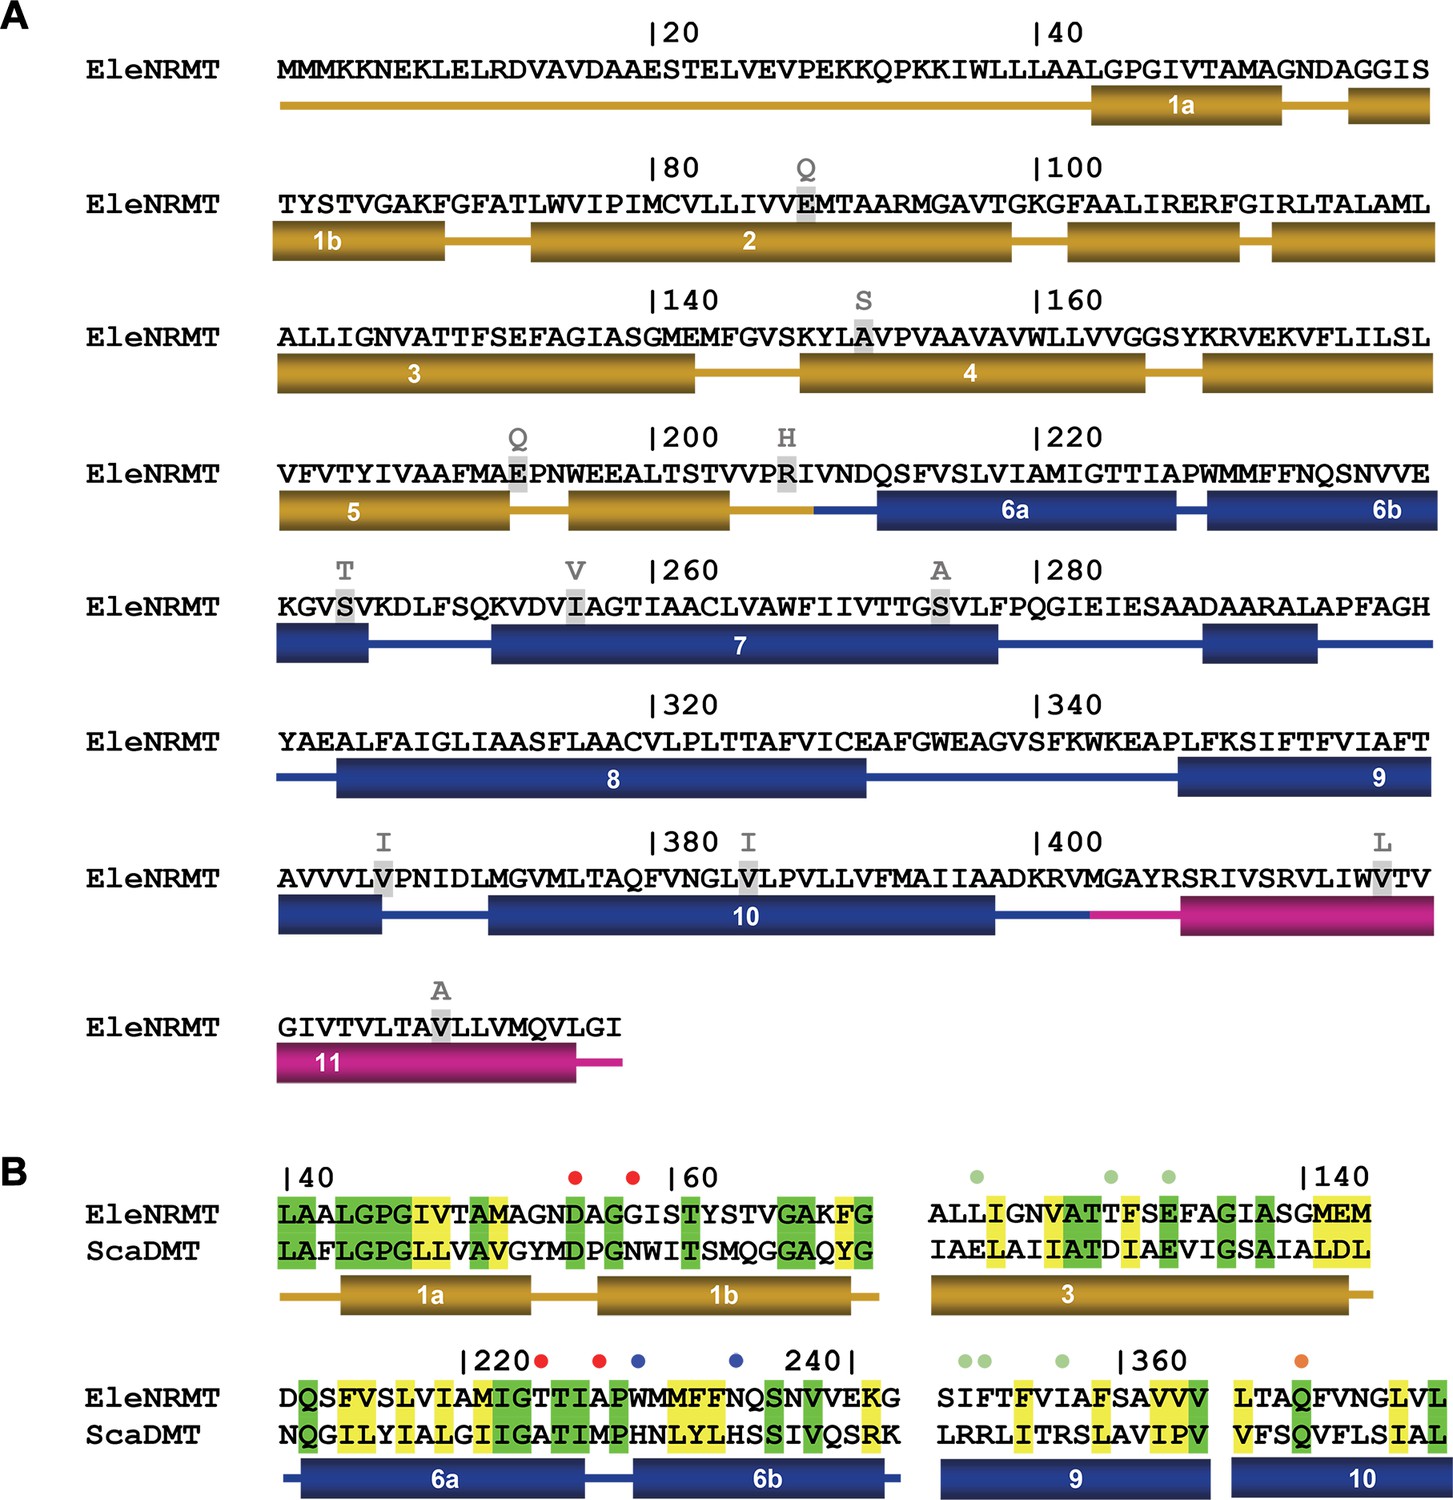
EleNRMT sequence and topology.
(A) Sequence of EleNRMT (NCBI: WP_009305646.1) with secondary structure elements indicated below. Residues mutated in the thermostabilized EleNRMTts are highlighted with replacements shown on top. (B) Comparison of functionally relevant regions of EleNRMT and the Mn2+ transporter ScaDMT (Uniprot: A0A4U9TNH6) with secondary structure elements shown below. Dots indicate ion binding site (red), a residue interacting with the ion in an occluded state (orange) and positions relevant for H+ transport in NRAMPs on α6 (blue) and α3, 9 (green).
Figure 3—figure supplement 2
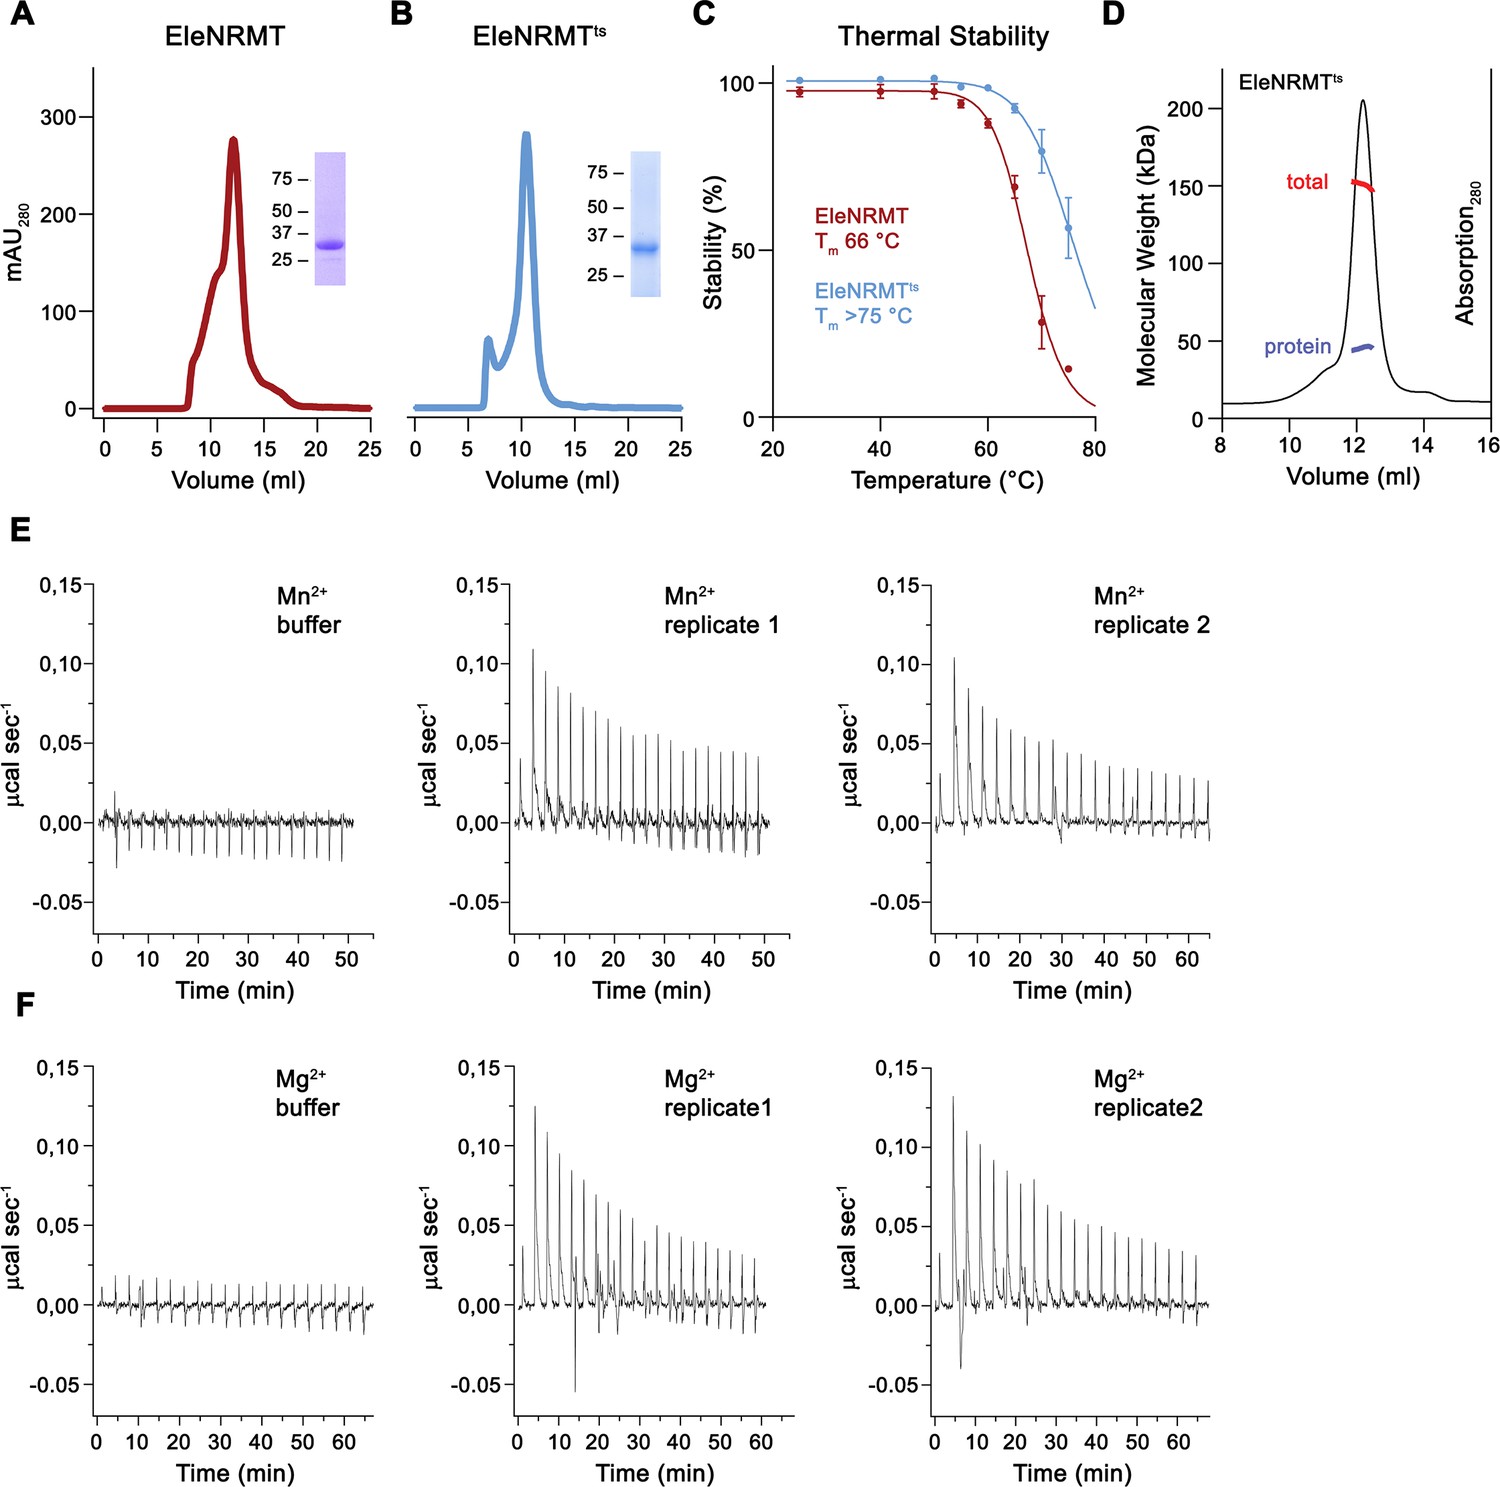
Stabilization and biochemical characterization of EleNRMT.
Gel filtration profiles on a Superdex 200 column of WT EleNRMT (A) and the thermostabilized construct of ElenRMTts (B). Insets show SDS-PAGE gel of peak fractions with molecular weight marker indicated (kDa). (C) Thermal stability of EleNRMT and EleNRMTts as determined by fluorescence-based size-exclusion chromatography (Hattori et al., 2012). Data show averages of four technical replicates, errors are s.e.m. (D) SEC/MALS experiment of purified EleNRMTts with obtained molecular weight corresponding to a monomeric transporter (measured molecular weight of 45.6 kDa versus theoretical molecular weight of 46.9 kDa). Thermograms of Mn2+ (E) and Mg2+ (F) binding to EleNRMTts obtained from isothermal titration calorimetry experiments shown in Figure 3G and H. (E, F) Panels show titration against buffer (left) and traces of two biological replicates (center, right).
Figure 4 with 1 supplement
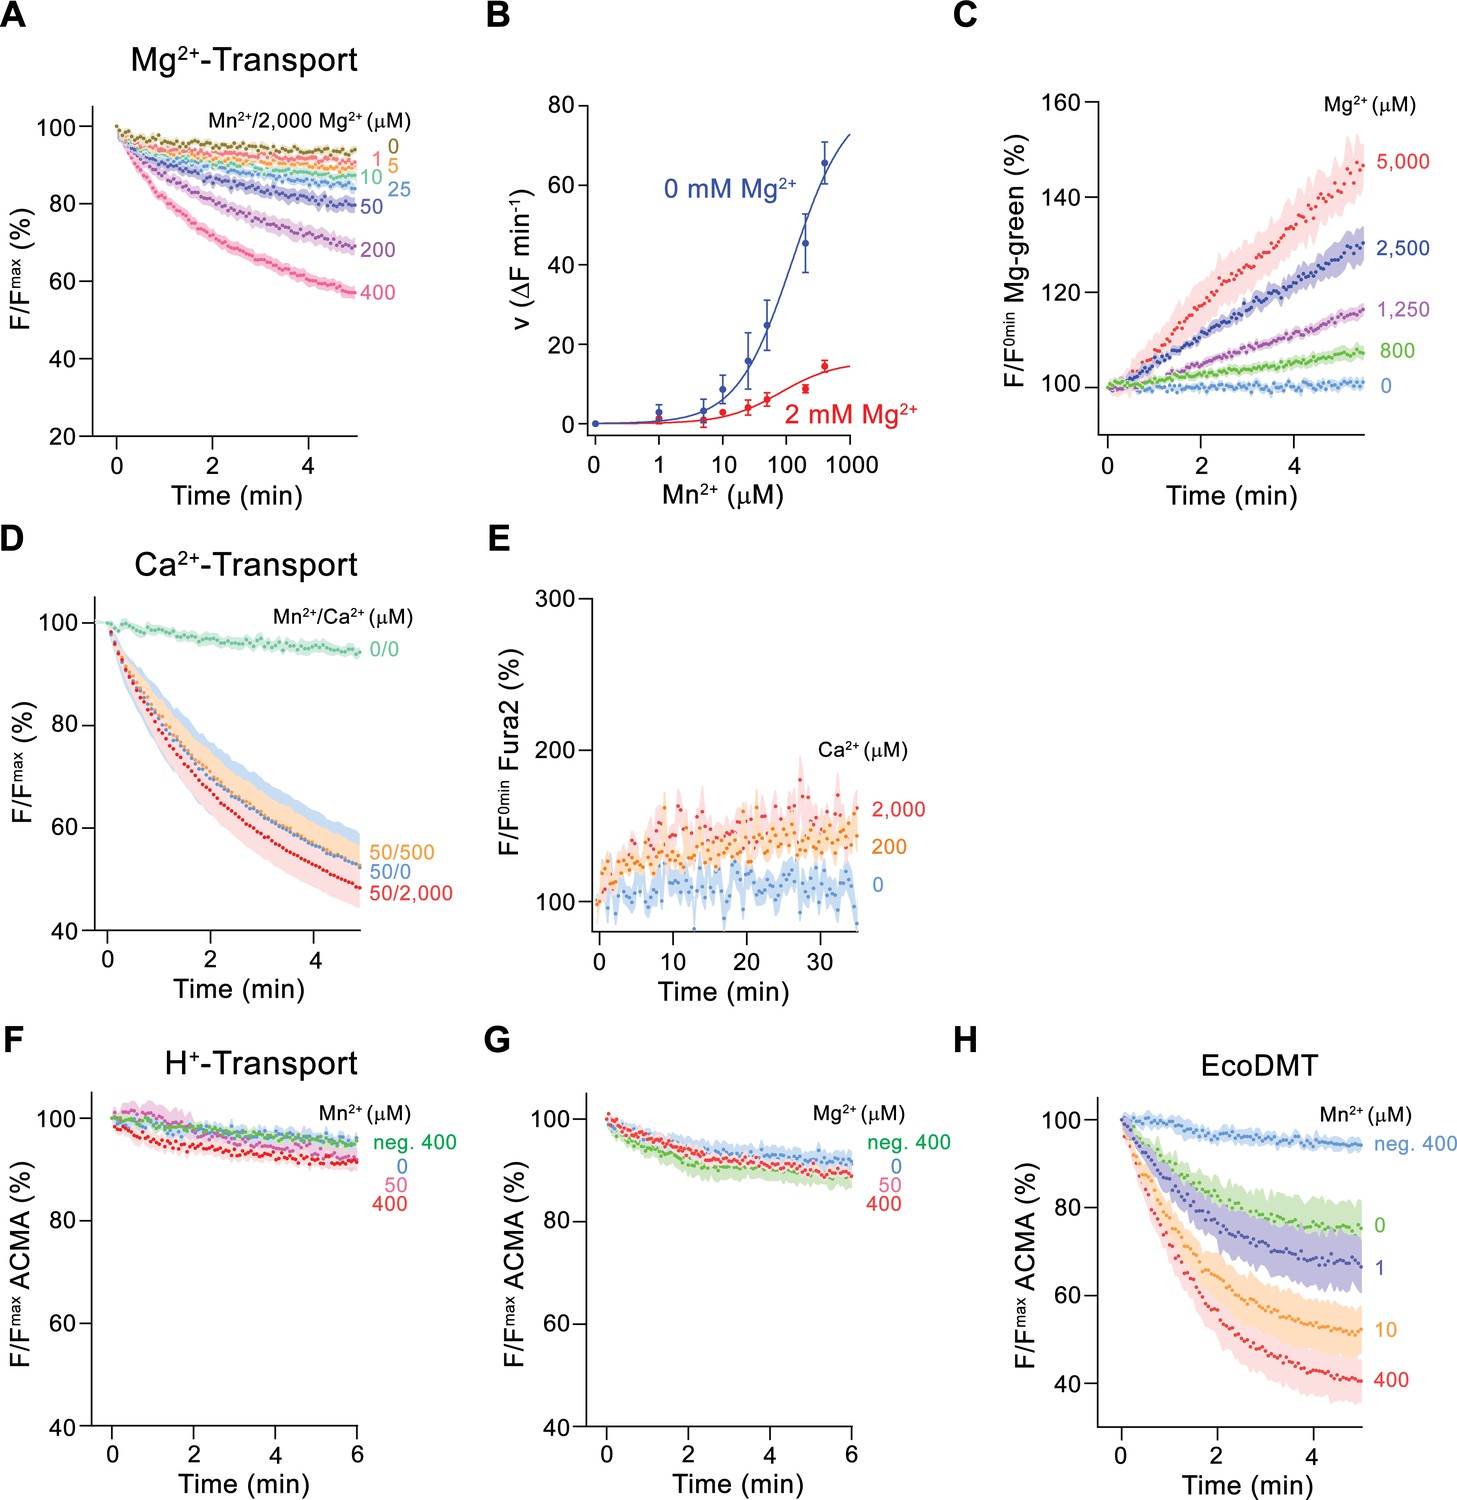
Ion selectivity and substrate coupling.
(A–E) Metal ion transport by EleNRMTts. (A) EleNRMTts mediated Mn2+ transport into proteoliposomes in presence of 2 mM Mg2+. Data display mean of eight experiments from three independent reconstitutions, except for the measurement with 200 μM Mn2+ (mean of seven experiments). (B) Mn2+ concentration dependence of transport into EleNRMTts proteoliposomes. For Mn2+, data are as displayed in Figure 3E, for Mn2+ in presence of 2 mM Mg2+, initial velocities were derived from individual traces of experiments displayed in (A). The solid lines are fits to a Michaelis–Menten equation. (C) Mg2+-transport into EleNRMTts proteoliposomes assayed with the fluorophore Magnesium Green. Data display mean of 5 (0 μM Mg2+), 8 (800 μM and 1250 μM Mg2+), 4 (2500 μM Mg2+), and 3 (5000 μM Mg2+) experiments from two independent reconstitutions. (D) Mn2+ transport in presence of Ca2+. Data display mean of 4–11 experiments from three independent reconstitutions. (A, D) Uptake of Mn2+ was assayed by the quenching of the fluorophore calcein trapped inside the vesicles. (E) Ca2+-transport into EleNRMTts proteoliposomes assayed with the fluorophore Fura-2. Data display mean of 3 (0 μM Ca2+), 12 (200 μM Ca2+) and 9 (2000 μM Ca2+) experiments from 2 independent reconstitutions. The small increase of the fluorescence at high Ca2+ concentrations likely results from non-specific leak into proteoliposomes. (F–H) Assay of H+ transport with the fluorophore ACMA. Experiments probing metal ion coupled H+ transport into proteoliposomes containing EleNRMTts upon addition of Mn2+ (eight experiments from two independent reconstitutions) (F) and Mg2+ (eight experiments from two independent reconstitutions) (H) do not show any indication of H + transport. Mn2+ coupled H+ transport into EcoDMT proteoliposomes (three experiments from three independent reconstitutions and for the negative control [no protein, 400 μM Mn2+], 4 measurements) is shown for comparison (I). A, C-H Averaged traces are presented in unique colors. Fluorescence is normalized to the value after addition of substrate (t = 0). Applied ion concentrations are indicated. (A–H), Data show mean of the indicated number of experiments, errors are s.e.m.
Figure 4—figure supplement 1
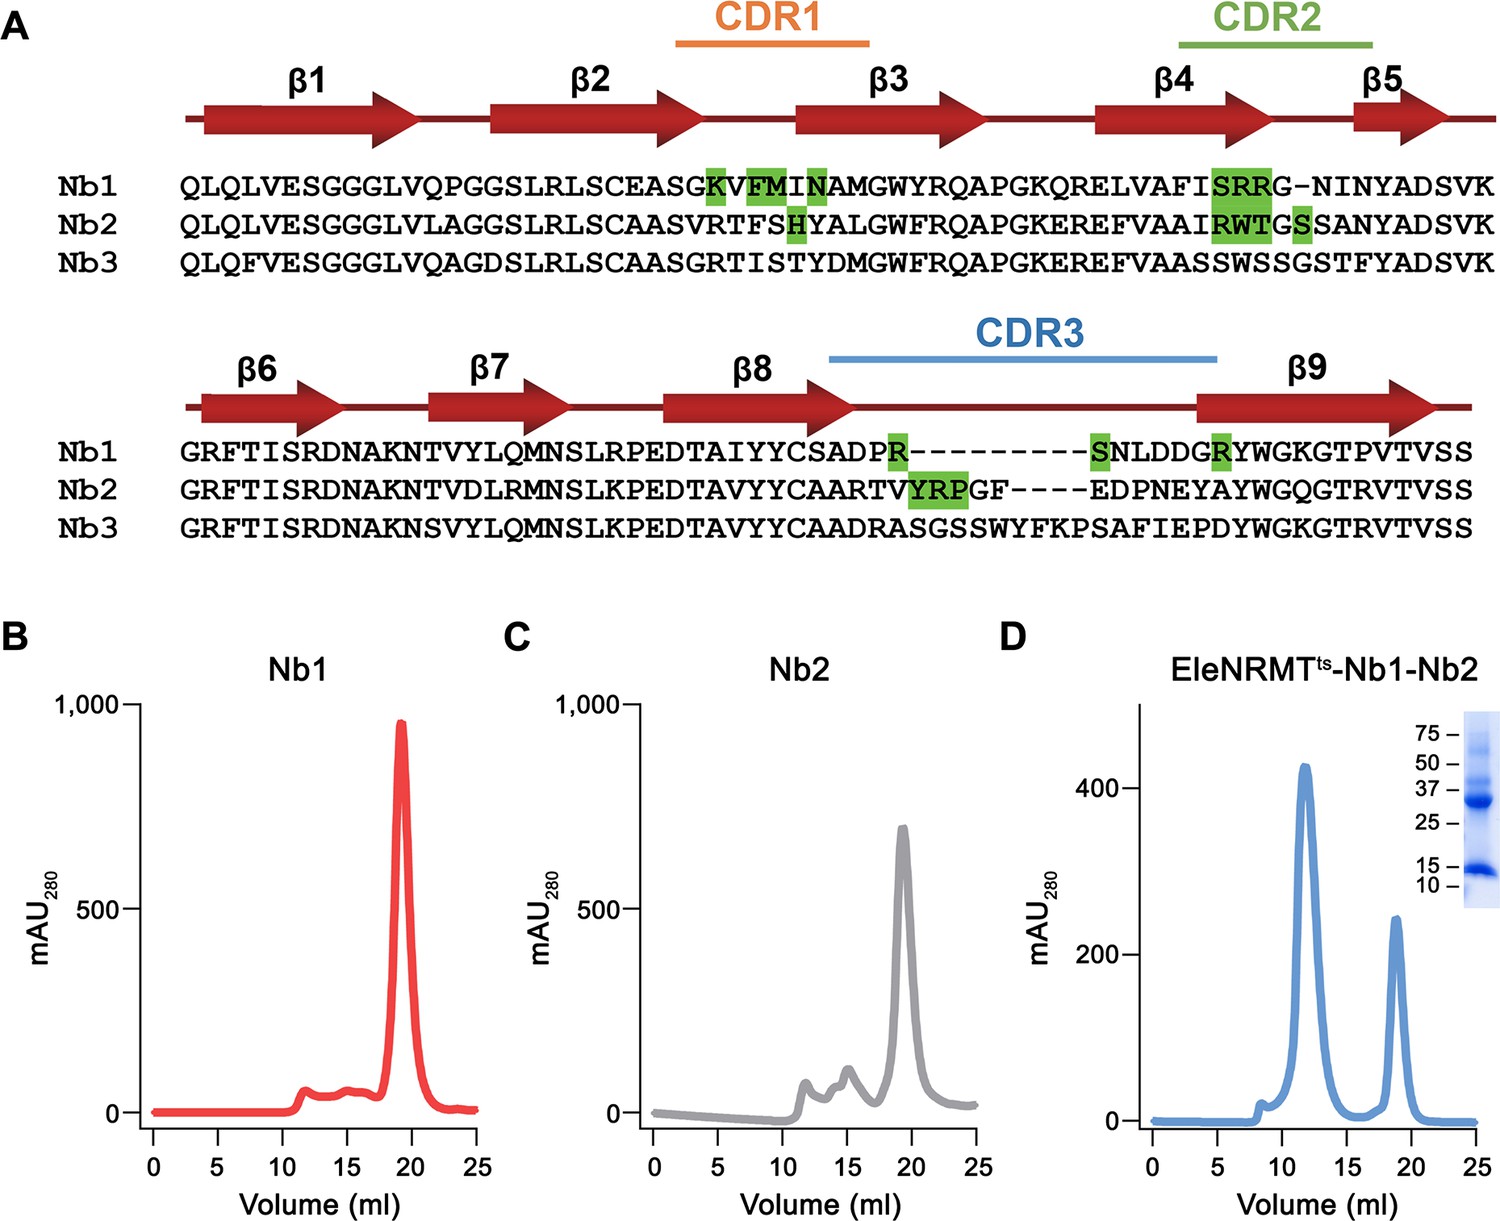
Nanobody selection.
(A) Sequence alignment of the three EleNRMT binders Nb1-Nb3. Secondary structure is shown above. The location of complementary determining regions (CDRs) are indicated, residues in Nb1 and Nb2 making contacts with EleNRMTts are highlighted in green. SEC profiles of purified (B) Nb1, (C) Nb2, and (D) the EleNRMTts-Nb1,2 complex assembled with a stoichiometric excess of both nanobodies. Inset shows SDS-PAGE gel with molecular weights (kDa) indicated.
Figure 5 with 5 supplements

Structural characterization of EleNRMTts by Cryo-EM and X-ray crystallography.
(A) Cryo-EM density (contoured at 5 σ) of EleNRMTts in complex with Nb1 and Nb2 at 3.5 Å viewed from within the membrane with the extracellular side on top and (B), ribbon representation of the complex in the same view. Proteins are shown in unique colors. (C) Anomalous difference density of Mn2+ obtained from the crystal structure of the EleNRMTts-Nb1-Nb2 complex (calculated at 5 Å and displayed as black mesh contoured at 4.5 σ). Model of EleNRMTts encompassing the unwound center of helices α1 and α6 is shown as ribbon.
Figure 5—figure supplement 1
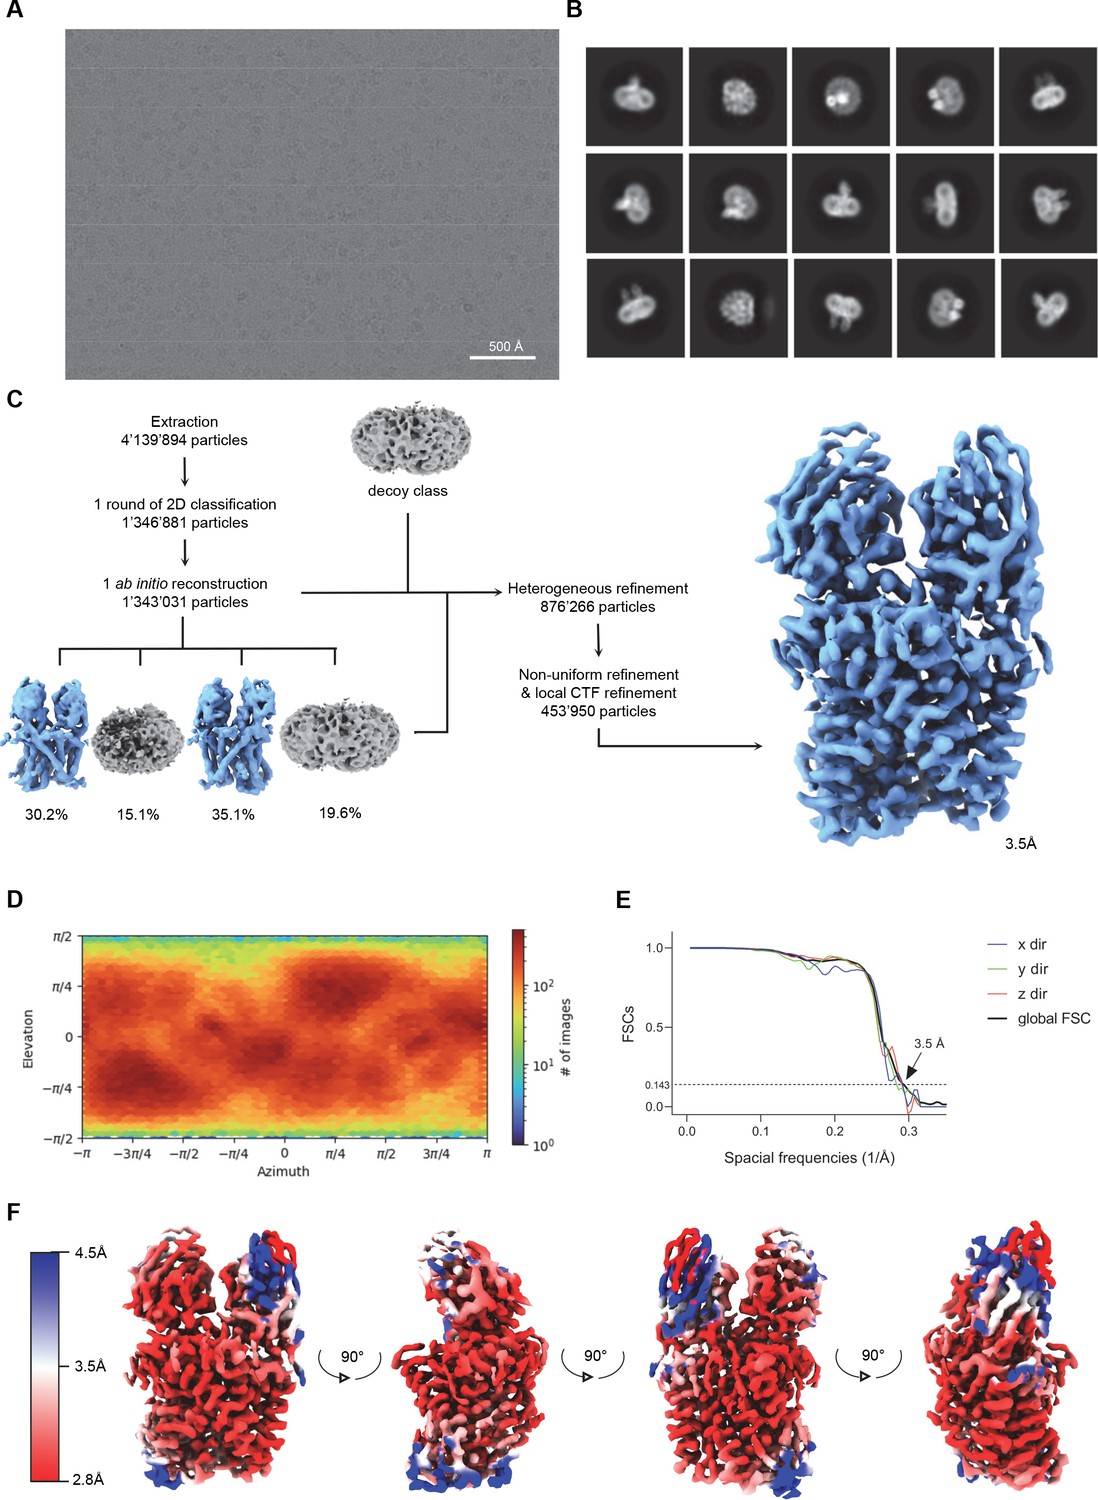
Cryo-EM reconstruction of the EleNRMTts-nanobody complex.
(A) Representative micrograph (out of a total of 22 117 images) of the complex acquired with a Titan Krios G3i microscope equipped with a K3 camera. (B) 2D class averages of the EleNRMTts-Nb1-Nb2 dataset. (C) Data processing workflow. After extraction and one round of 2D classification, a single ab initio reconstruction with four classes was performed. The particle distribution is indicated in %. The two most promising classes, together with a decoy class were subjected to nine rounds of heterogeneous refinement. Non-uniform (NU) refinement, local CTF-refinement and a second round of NU-refinement with C1 symmetry yielded a map at a resolution of 3.5 Å. (D) Angular distribution of particle orientations. The heatmap displays the number of particles for a given viewing angle. (E) Directional and global FSC plots. The global FSC is shown in black. Dashed line indicates 0.143 cut-off and the resolution at which the FSC curve drops below 0.143 is indicated. The directional FSC curves providing an estimation of anisotropy of the dataset are shown for directions x, y, and z. (F) Final 3D reconstruction of the EleNRMTts-Nb1-Nb2 complex in indicated orientations, colored according to the local resolution, estimated in cryoSPARC v.3.2.0.
Figure 5—figure supplement 2
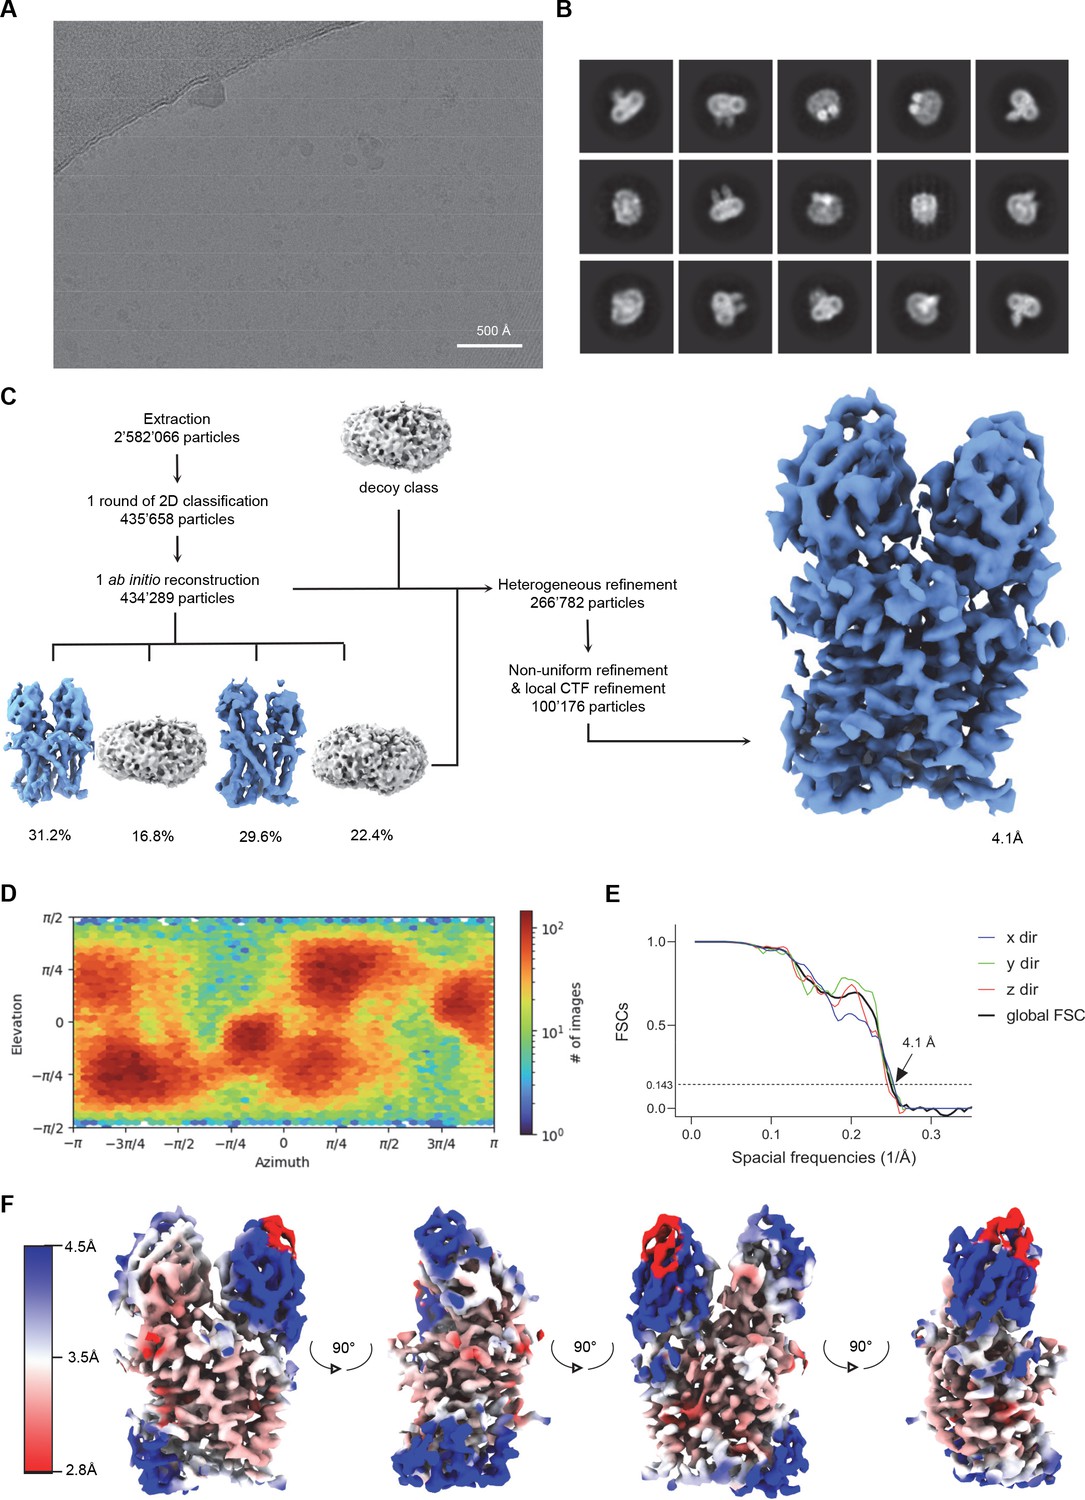
Cryo-EM reconstruction of EleNRMTts-nanobody in presence of Mg2+.
(A) Cryo-EM reconstruction of the EleNRMTts-nanobody complex in presence of Mg2+. (A) Representative micrograph (out of a total of 12,427 images) of the complex acquired with a Titan Krios G3i microscope equipped with a K3 camera. (B) 2D class averages of the EleNRMTts-Nb1-Nb2 dataset. (C) Data processing workflow. After extraction and one round of 2D classification, a single ab initio reconstruction with four classes was performed. The particle distribution is indicated in %. The particles from the two most promising classes, together with a decoy class were subjected to 22 rounds of heterogeneous refinement. Non-uniform (NU) refinement, local CTF-refinement and a second round of NU-refinement with C1 symmetry yielded a map at a resolution of 4.1 Å. (D) Angular distribution of particle orientations. The heatmap displays the number of particles for a given viewing angle. (E) Directional and global FSC plots. The global FSC is shown in black. Dashed line indicates 0.143 cut-off and the resolution at which the FSC curve drops below 0.143 is indicated. The directional FSC curves providing an estimation of anisotropy of the dataset are shown for directions x, y, and z. (F) Final 3D reconstruction of the EleNRMTts-Nb1-Nb2 complex in indicated orientations, colored according to the local resolution, estimated in cryoSPARC v.3.2.0.
Figure 5—figure supplement 3
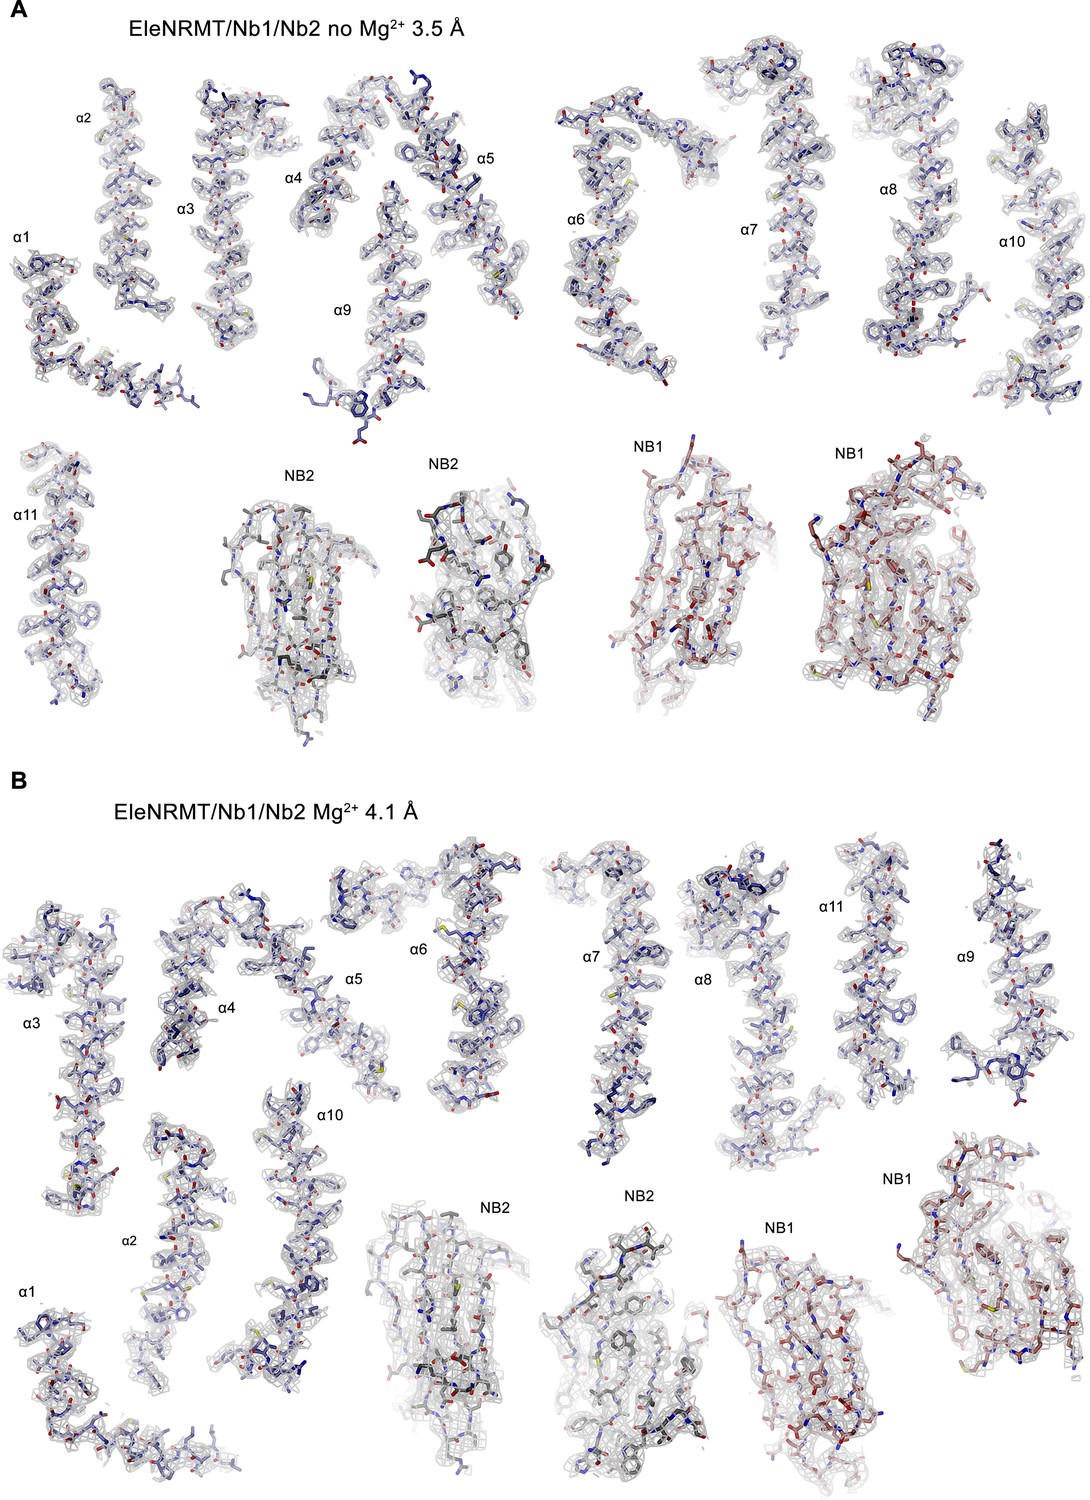
Cryo-EM densities of EleNRMT-nanobody complexes.
(A) EleNRMTts-nanobody complex in absence of Mg2+ at 3.5 Å. Electron density (contoured at 6σ, gray mesh) is shown superimposed on indicated protein regions. (B) EleNRMTts-nanobody complex in presence of Mg2+ at 4.1 Å. Electron density (contoured at 6σ, gray mesh) is shown superimposed on indicated protein regions.
Figure 5—figure supplement 4
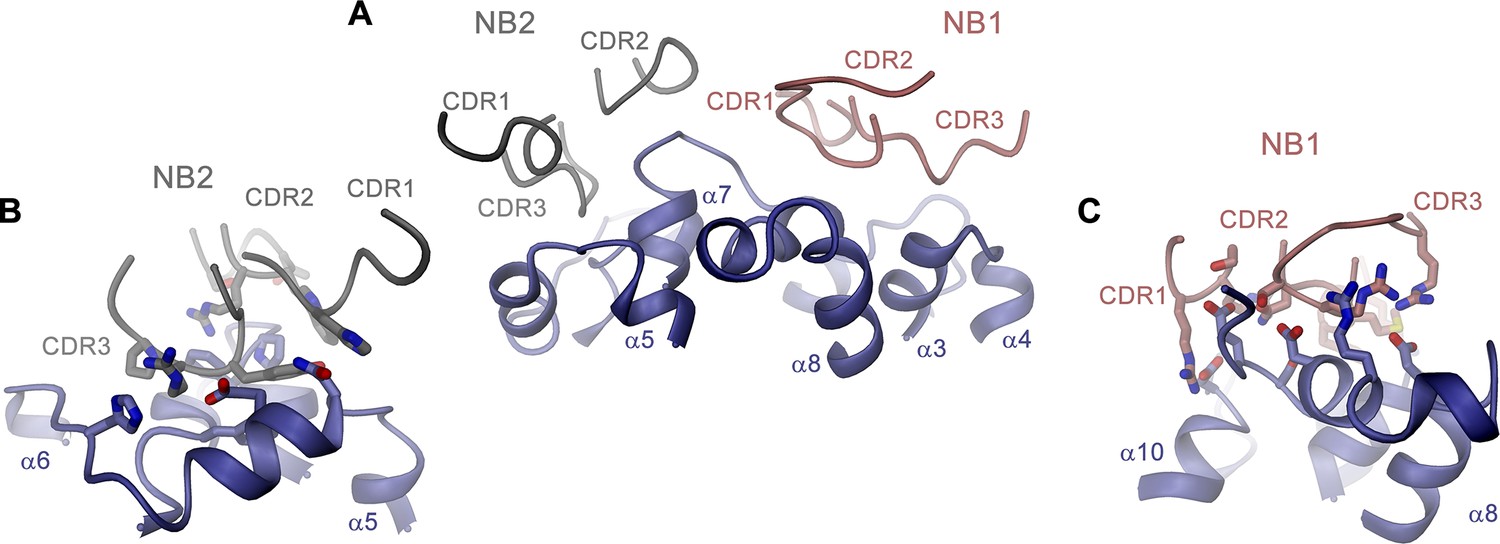
Nanobody binding interfaces.
(A) Contact region of EleNRMTts and nanobodies Nb1 and Nb2. (B) Binding interface of Nb2. (C) Binding interface of Nb1. (B, C), Side chains of residues mediating binding interactions between the transporter and the nanobodies are displayed as sticks. (A–C) Proteins are shown as ribbons with respective regions labeled.
Figure 5—figure supplement 5

X-ray structures of EleNRMT-nanobody complexes in presence of Mg2+ and Mn2+ and comparison to cryo-EM structures.
(A) Structure of the EleNRMTts-Nb1-Nb2 complex in Mg2+ at 4.1 Å (B) Structure of the EleNRMTts-Nb1-Nb2 complex soaked in Mn2+ at 4.6 Å. A, B 2Fo-Fc density (contoured at 1 σ) is shown as green mesh superimposed on the model. (B, C), Anomalous difference electron density (calculated at 6 Å and contoured at 4 σ) from the dataset displayed in B is depicted as black mesh. (A-C), shown is one of two complexes in the asymmetric unit as Cα trace with protein chains displayed in unique colors. Phases for 2Fo-Fc and anomalous difference density maps were obtained from molecular replacement using the cryo-EM model improved by constrained minimal refinement. Residual density in the cryo-EM maps of the EleNRMTts-Nb1-Nb2 complex in vicinity to the Mn2+ binding position (indicated by black sphere) in absence (D) and presence of Mg2+ (E). Protein is represented as sticks, water (red) or Mg2+ (green) as spheres. Maps are as displayed in Figure 5—figure supplement 3.
Figure 6
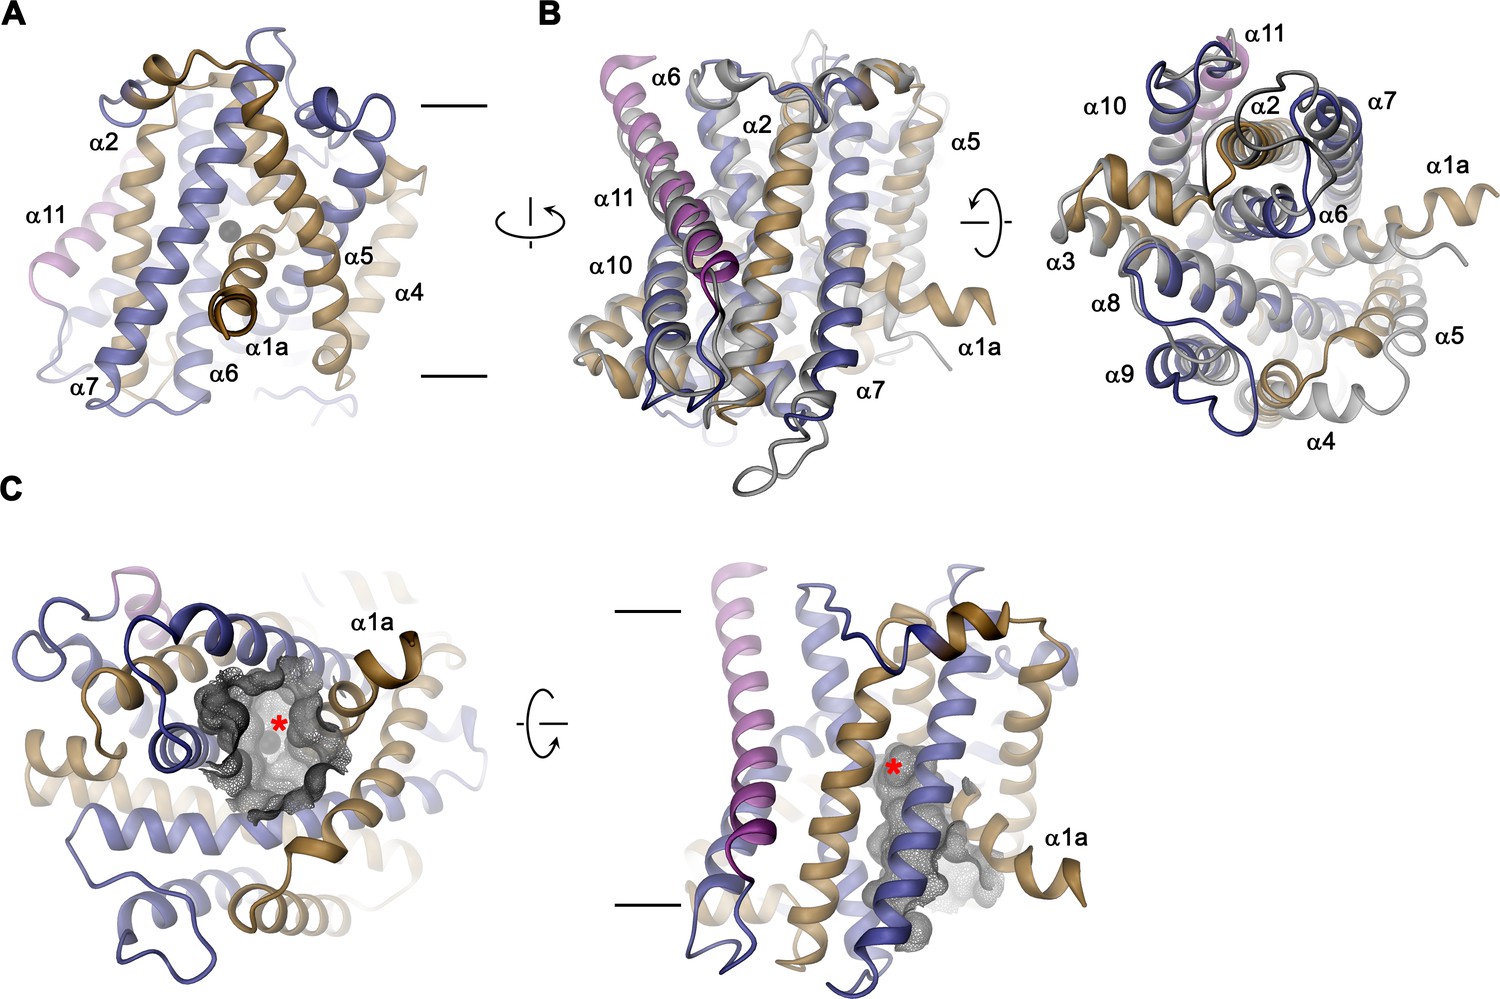
EleNRMT structure.
(A) Ribbon representation of EleNRMT viewed from within the membrane with α1-α5 colored in beige, α6- α10 in blue and α11 in magenta. The position of a bound ion is indicated by a black sphere. (B) Superposition of EleNRMT and ScaDMT (based on PDBID:5M94 with modeled α1a), both showing equivalent inward-open conformations. Ribbon representation of ScaDMT is shown in gray, the representation of EleNRMT is as in A. (C) Ribbon representation of EleNRMT with surface of the aqueous cavity leading to the ion binding site displayed as mesh. Left, view from the cytoplasm and, right, from within the membrane. A bound ion is represented by a black sphere whose position is indicated with a red asterisk. A-C Selected helices are labeled. Membrane boundaries (A, C) and relationship between views (A–C) are indicated.
Figure 7
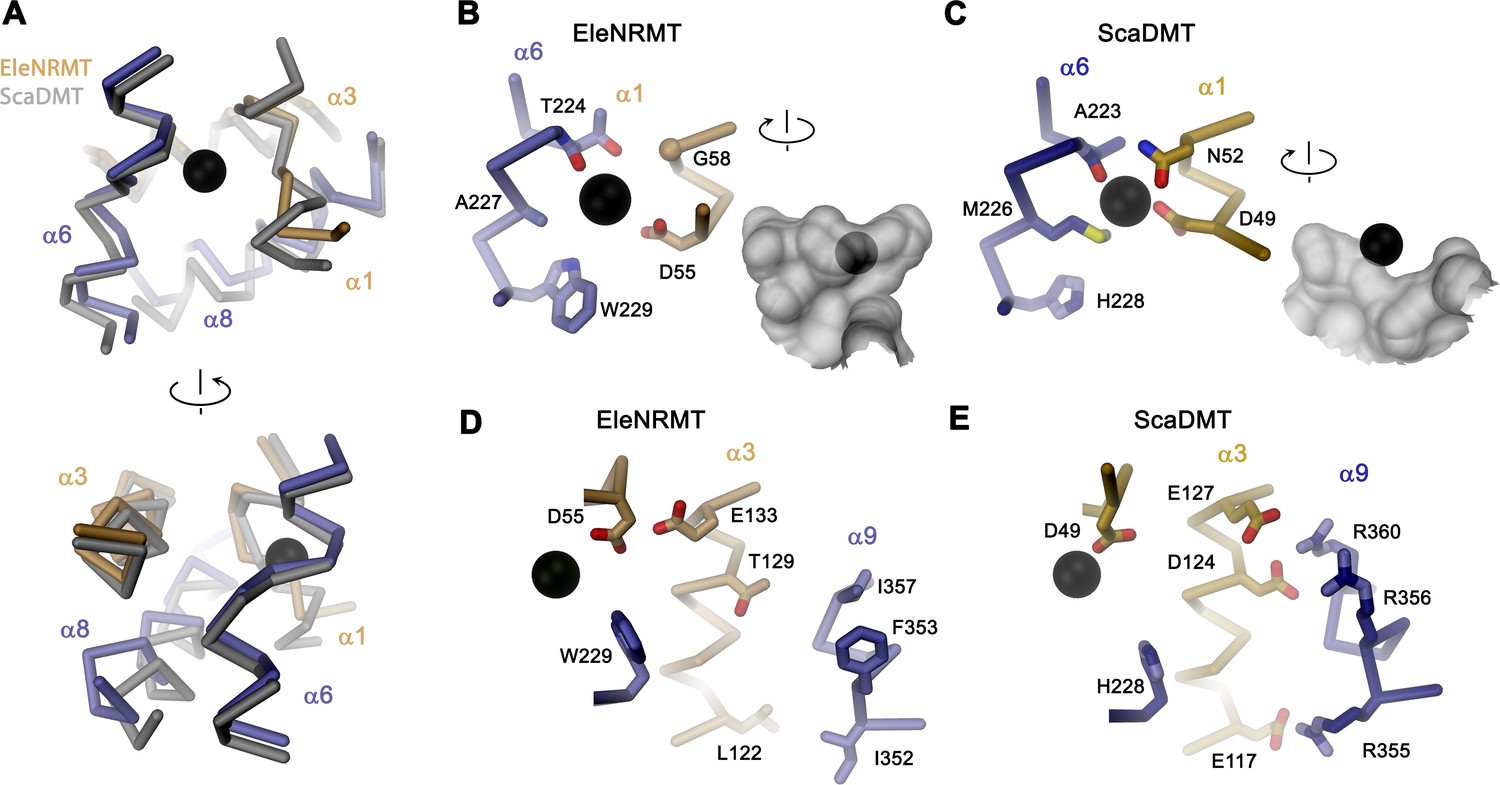
Comparison of regions of functional relevance between EleNRMT and ScaDMT.
(A) Superposition of the metal ion binding regions of EleNRMT and ScaDMT (PDBID:5M95). The coloring is as in Figure 6B. The relationship between views is indicated. (B) Metal ion binding sites of EleNRMT (B) and ScaDMT (C). (B, C), inset (right) shows molecular surface surrounding the bound ion with indicated relationship. Whereas the ion in EleNRMT is located inside the aqueous cavity, its location in ScaDMT is outside of the cavity, tightly surrounded by coordinating residues. (D) Region of EleNRMT on α3 and α9 implicated in proton transport in NRAMPs and corresponding region in ScaDMT (E). (D, E) The bound ion with the conserved binding site aspartate on α1 and a residue corresponding to the first α6b histidine in NRAMPs, which was identified as potential H+ acceptor, are shown for reference. (A-E) The proteins are depicted as Cα-trace, selected residues as sticks. The position of bound metal ions is represented as a black sphere. (B-E) Selected secondary structure elements and residues are indicated.
Figure 8
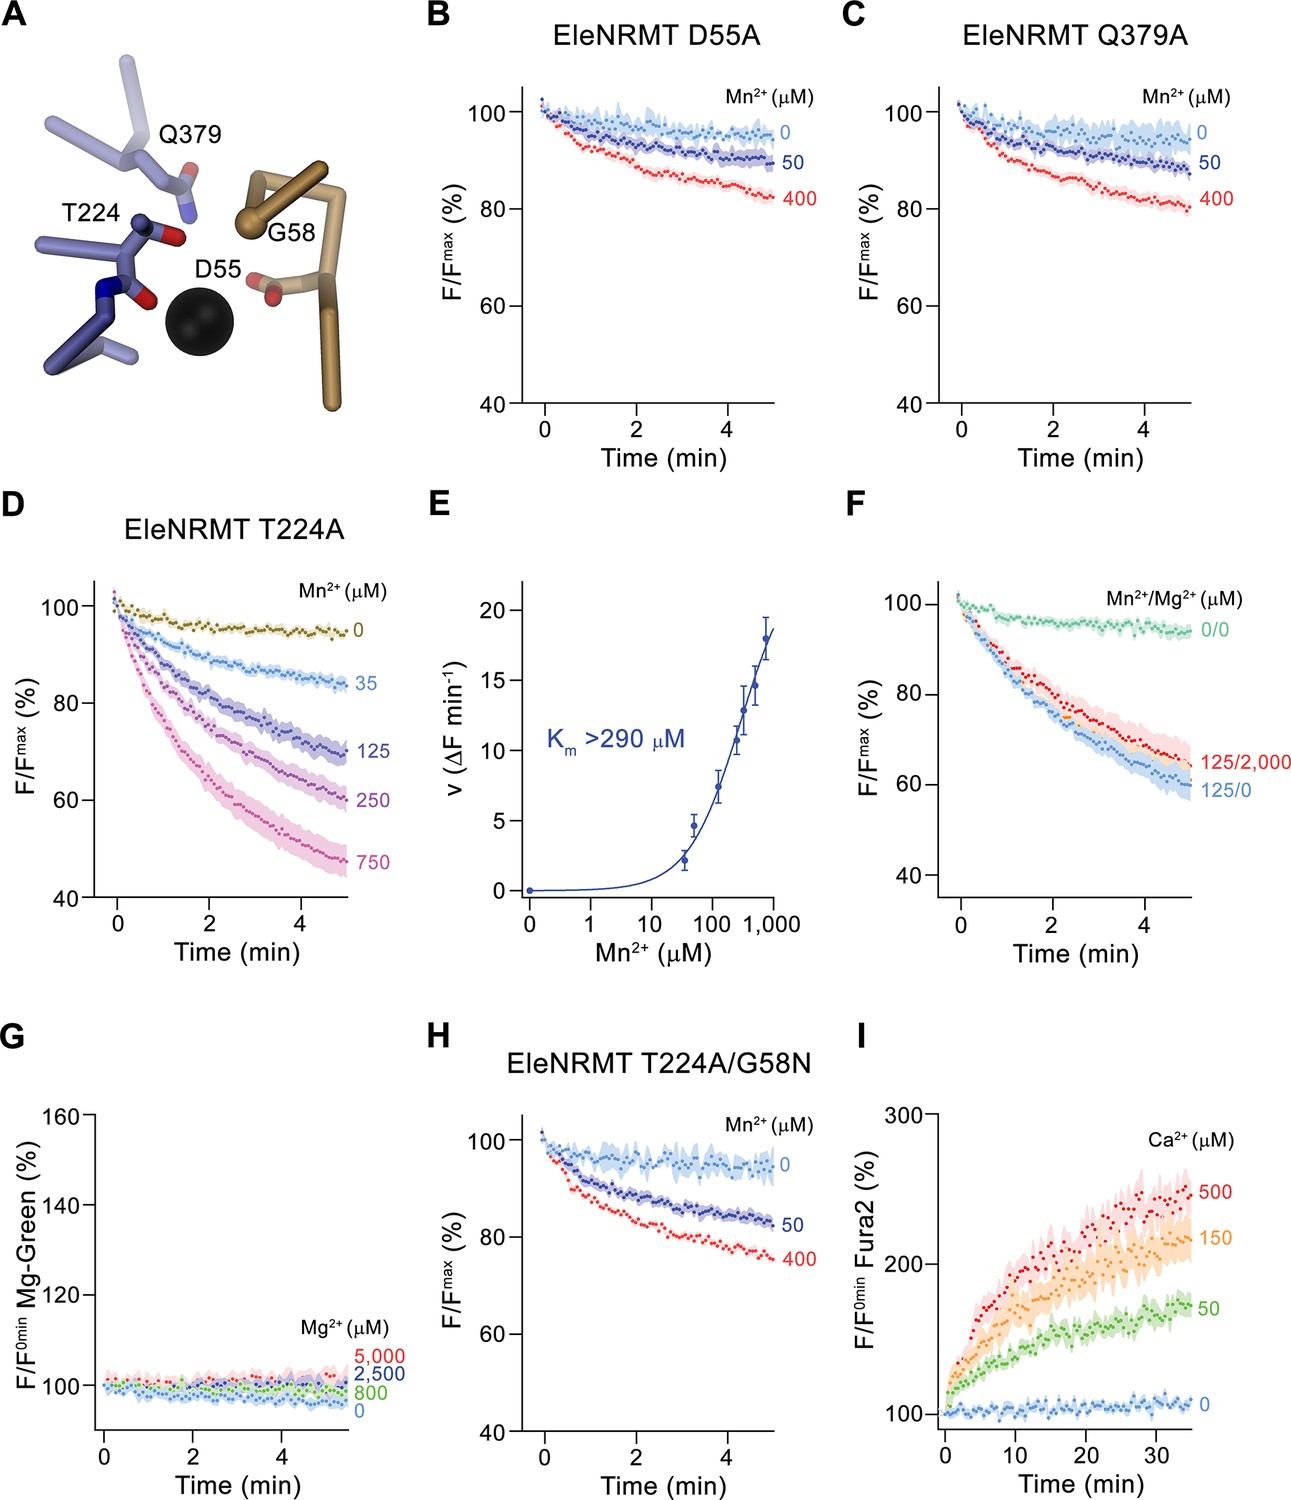
Functional characterization of binding site mutants.
(A) Model of the ion binding site of EleNRMT with ion (black sphere) showing bound Mn2+. Regions of α1 and α6 are shown as Cα-trace, selected residues coordinating the ion as sticks. (B–D) Mn2+ transport mediated by EleNRMTts binding site mutants. (B) D55A (2 (0 μM Mn2+), 6 (50 μM Mn2+), and 7 (400 μM Mn2+) experiments from two independent reconstitutions), (C) Q379A (2 (0 μM Mn2+), 6 (50 μM Mn2+), and 7 (400 μM Mn2+) experiments from two independent reconstitutions), (D) T224A (5 experiments from two independent reconstitutions). (E) Mn2+ concentration dependence of transport of T224A. Initial velocities were derived from individual traces of experiments displayed in (D), the solid line shows the fit to a Michaelis–Menten equation with an apparent Km exceeding 290 μM. (F) Mn2+ transport into T224A proteoliposomes in presence of Mg2+ (4 experiments from two independent reconstitutions). (G) Mg2+-transport into T224A proteoliposomes assayed with the fluorophore Magnesium green (4 experiments from two independent reconstitutions). (H-I) Transport mediated by the EleNRMTts binding site mutant T224A/G58N. (H) Mn2+ transport into proteoliposomes containing T224A/G58N (2 (0 μM Mn2+), 6 (50 μM Mn2+), and 7 (400 μM Mn2+) experiments from two independent reconstitutions). (I) Ca2+-transport into T224A/G58N proteoliposomes assayed with the fluorophore Fura-2 (9 (0 μM Ca2+), 10 (50 μM Ca2+), 11 (150 μM Ca2+), and 10 (500 μM Ca2+) experiments from two independent reconstitutions). (B-D), (F- H) Uptake of Mn2+ was assayed by the quenching of the fluorophore calcein trapped inside the vesicles. (B-D), (F-I) Averaged traces are presented in unique colors. Fluorescence is normalized to value after addition of substrate (t = 0). Applied ion concentrations are indicated. (B–I), Data show mean of the indicated number of experiments, errors are s.e.m.
Figure 9
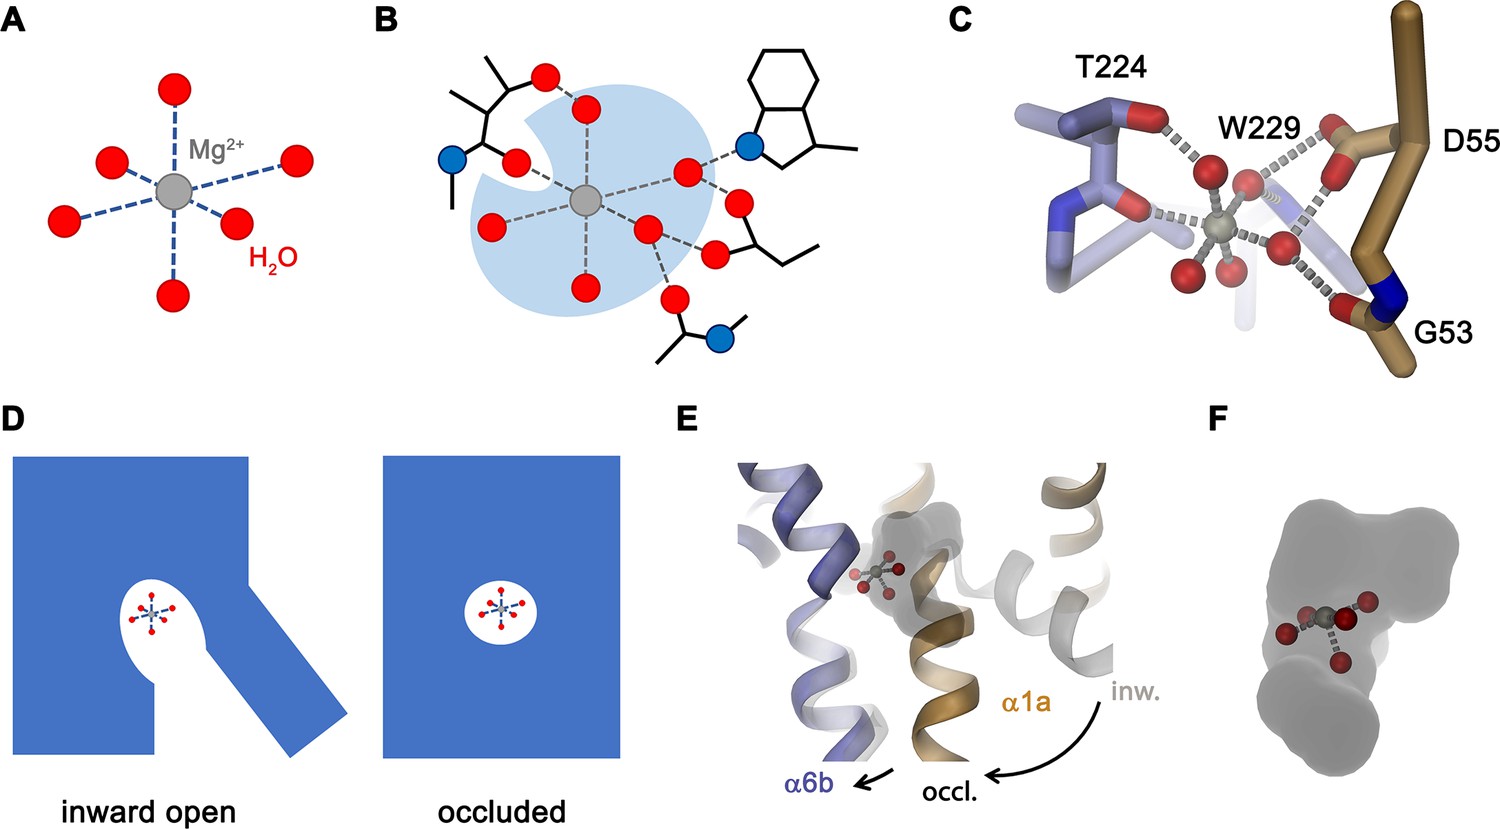
Features of Mg2+ transport by NRMTs.
Schematic depiction of (A), the octahedral coordination of the first hydration shell surrounding a Mg2+ ion and (B), the same octahedral coordination within the binding site of a NRMT with five of the six water molecules remaining bound to the ion and where the bulk of protein interactions with the ion are mediated via coordinated water. (C) Model of Mg2+ bound to the site of EleNRMT in the inward-facing conformation. The coordinates of the hydrated Mg2+ were obtained from the high-resolution structure of the Mg2+ transporter MgtE (PDBID 4U9L). The Mg2+ ion was placed on the position of Mn2+ obtained from the anomalous difference density defined in the X-ray structure. A single water molecule with a backbone oxygen atom was removed and the remaining complex was oriented to maximize interactions of coordinating waters with protein residues. Regions of the binding site are represented as Cα-trace and selected interacting residues as sticks. (D) Schematic depiction from an inward-facing to an occluded conformation of a NRMT with bound hydrated Mg2+ indicated. (E) Hypothetical model of the transition of EleNRMT from an inward-facing (gray) to an occluded conformation (colored) that was based on the occluded conformation of DraNRAMP (PDBID: 6C3I). (F) Close-up of the binding pocket of the hypothetical model of the occluded conformation with bound Mg2+–5H2O complex.
Author response image 1
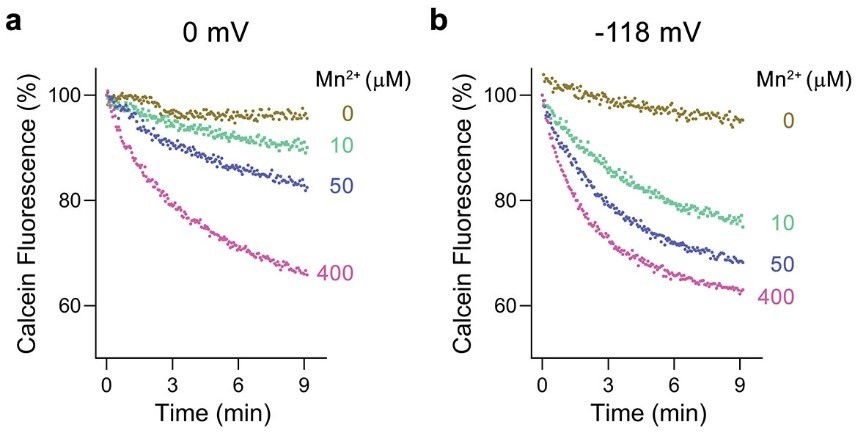
Voltage dependence of Mn2+ transport by EcoDMT.
a, Mn2+ transport assayed at a membrane potential of 0 mV. b, Mn2+ transport assayed at a membrane potential of -118 mV. a, b Mn2+ uptake into proteoliposomes was monitored by the quenching of calcein trapped inside the liposomes. Traces measured with indicated Mn2+ concentrations added to the outside are shown in unique colors.
Author response image 2
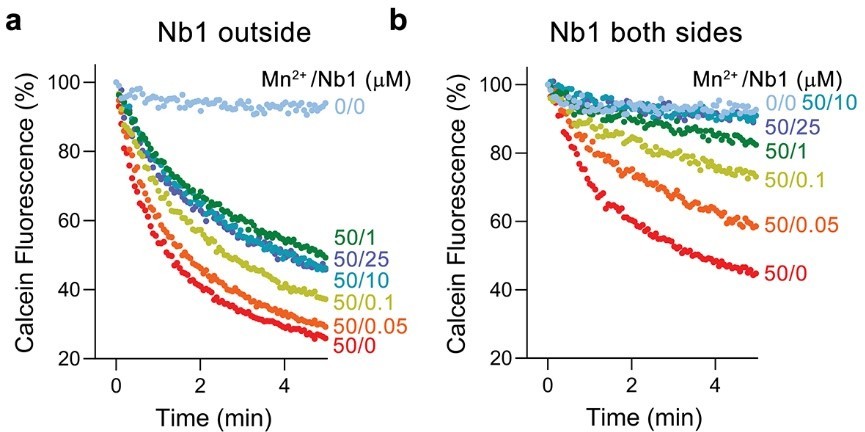
Inhibition of EleNRMT mediated Mg2+ transport by Nb1.
a, Mn2+ transport into proteoliposomes containing EleNRMT upon addition of indicated concentrations of Nb1 to the outside. b, Mn2+ transport into proteoliposomes containing EleNRMT upon addition of indicated concentrations of Nb1 added to both sides of the liposome. Partial inhibition reflects the about equal distribution of orientation of EleNRMT within the liposomes.
Tables
Table 1
Cryo-EM data collection, refinement and validation statistics.
| Dataset 1EleNRMT-NB(EMDB-13985)(PDB 7QIA) | Dataset 2EleNRMT-NB Mg2+ complex(EMDB-13987)(PDB 7QIC) | |
|---|---|---|
| Data collection and processing | ||
| Microscope | FEI Titan Krios | FEI Titan Krios |
| Camera | Gatan K3 GIF | Gatan K3 GIF |
| Magnification | 130’000 | 130’000 |
| Voltage (kV) | 300 | 300 |
| Electron exposure (e–/Å2) | 69.725 / 61 / 69.381 | 69.554 |
| Defocus range (μm) | –1.0 to –2.4 | –1.0 to –2.4 |
| Pixel size* (Å) | 0.651 (0.3255) | 0.651 (0.3255) |
| Initial number of micrographs (no.) | 22,117 | 12,427 |
| Initial particle images (no.) | 4 139 894 | 2 582 066 |
| Final particle images (no.) | 453 950 | 100 176 |
| Symmetry imposed | C1 | C1 |
| Map resolution (Å)FSC threshold | 3.50.143 | 4.10.143 |
| Map resolution range (Å) | 2.9–7.0 | 3.3–8.3 |
| Refinement | ||
| Model resolution (Å)FSC threshold | 3.50.5 | 4.10.5 |
| Map sharpening b-factor (Å2) | –184.4 | –159.2 |
| Model vs Map CC (mask) | 0.80 | 0.79 |
| Model compositionNon-hydrogen atomsProtein residuesLigandWater | 4,84363903 | 4,8416391 (Mg)0 |
| B factors (Å2)ProteinLigandWater | 20.0509.12 | 46.5236.240 |
| R.m.s. deviationsBond lengths (Å)Bond angles (°) | 0.0030.600 | 0.0030.650 |
| Validation MolProbity score Clashscore Poor rotamers (%) | 2.0611.630 | 2.1012.860.2 |
| Ramachandran plot Favored (%) Allowed (%) Disallowed (%) | 92.107.900 | 92.267.740 |
-
*
Values in parentheses indicate the pixel size in super-resolution.
Table 2
X-ray data collection and refinement statistics.
| EleNRMT-Nb complex(PDB 7QJI) | EleNRMT-Nb complex Mn2+-soak(PDB 7QJJ) | |
|---|---|---|
| Data collection | ||
| Space group | P21 | P21 |
| Cell dimensions | ||
| a, b, c (Å) | 93.3, 122.2, 149.1 | 92.9, 115.9, 149.1 |
| α,β,γ (°) | 90, 107.8, 90 | 90, 107.6, 90 |
| Wavelength (Å) | 1.000 | 1.896 |
| Resolution (Å) | 50–4.1 (4.2–4.1) | 50–4.6 (4.7–4.6) |
| Rmerge | 12.5 (166.8) | 15.4 (147.6) |
| I / σI | 11.6 (2.4) | 10.8 (1.8) |
| Completeness (%) | 99.1 (98.9) | 99.8 (99.6) |
| Redundancy | 25.1 (27.1) | 14.0 (14.1) |
| Refinement | ||
| Resolution (Å) | 12–4.1 | 12–4.6 |
| No. reflections | 23,749 | 15,764 |
| Rwork / Rfree | 26.7 / 31.5 | 28.4 / 32.8 |
| No. atoms | ||
| Protein | 9,632 | 9,632 |
| ligands | 0 | 2 |
| B-factors | ||
| Protein | 287.3 | 270.8 |
| ligands | - | 192.0 |
| R.m.s deviations | ||
| Bond lengths (Å) | 0.003 | 0.003 |
| Bond angles (°) | 0.60 | 0.60 |
-
Values in parentheses are for highest-resolution shell.
Key resources table
| Reagent type (species) or resource | Designation | Source or reference | Identifiers | Additional information |
|---|---|---|---|---|
| Chemical compound, drug | 1-palmitoyl-2-oleoyl-sn-glycero-3-phospho-(1'rac-glycerol) (18:1 06:0 POPG) | Avanti Polar Lipids | 840457 C | |
| Chemical compound, drug | E. coli polar extract | Avanti Polar Lipids | 100600 P | |
| Chemical compound, drug | 1-palmitoyl-2-oleoyl-sn-glycero-3-phosphoethanolamine (18:1 06:0 POPE) | Avanti Polar Lipids | 850757 C | |
| Chemical compound, drug | Triton X-100 | Sigma | Cat#T9284 | |
| Chemical compound, drug | Lysozyme | Applichem | Cat#A3711 | |
| Chemical compound, drug | Benzamidine | Sigma | B6506 | |
| Chemical compound, drug | Chloroform | Fluka | 25,690 | |
| Chemical compound, drug | DM | Anatrace | D322 | |
| Chemical compound, drug | DDM | Anatrace | D310S | |
| Chemical compound, drug | Diethyl ether | Sigma | 296,082 | |
| Chemical compound, drug | DNase I | AppliChem | A3778 | |
| Chemical compound, drug | glycerol 99% | Sigma | G7757 | |
| Chemical compound, drug | HCl | Merck Millipore | 1.00319.1000 | |
| Chemical compound, drug | HEPES | Sigma | H3375 | |
| Chemical compound, drug | Imidazole | Roth | X998.4 | |
| Chemical compound, drug | L-(+)-arabinose | Sigma | A3256 | |
| Chemical compound, drug | Leupeptin | AppliChem | A2183 | |
| Chemical compound, drug | Pepstatin | AppliChem | A2205 | |
| Chemical compound, drug | Valinomycin | Thermofischer Scientific | V1644 | |
| Chemical compound, drug | Calcimycin | Thermofischer Scientific | A1493 | |
| Chemical compound, drug | Ionomycin | Thermofischer Scientific | I24222 | |
| Chemical compound, drug | Fura2 | Thermofischer Scientific | F1200 | |
| Chemical compound, drug | Magnesium Green | Thermofischer Scientific | M3733 | |
| Chemical compound, drug | ACMA | Thermofischer Scientific | A1324 | |
| Chemical compound, drug | CCCP | Sigma | C2759 | |
| Chemical compound, drug | Calcein | Thermofischer Scientific | C481 | |
| Chemical compound, drug | Phosphate buffered saline | Sigma | D8537 | |
| Chemical compound, drug | PEG400 | Sigma | 91,893 | |
| Chemical compound, drug | Manganese acetate | Sigma | 330,825 | |
| Chemical compound, drug | Magnesium acetate | Fluka | 63,047 | |
| Chemical compound, drug | Calcium Chloride | Sigma | 223,506 | |
| Chemical compound, drug | Manganese Chloride | Fluka | 31,422 | |
| Chemical compound, drug | Magnesium Chloride | Fluka | 63,065 | |
| Chemical compound, drug | PMSF | Sigma | P7626 | |
| Chemical compound, drug | Potassium chloride | Sigma | 746,346 | |
| Chemical compound, drug | Sodium chloride | Sigma | 71,380 | |
| Chemical compound, drug | Terrific broth | Sigma | T9179 | |
| Commercial assay or kit | 4%–20% Mini-PROTEAN TGX Precast Protein Gels, 15-well, 15 µl | BioRad Laboratories | 4561096DC | |
| Commercial assay or kit | Amicon Ultra-4 Centrifugal Filters Ultracel 10 K, 4 ml | Merck Millipore | UFC801096 | |
| Commercial assay or kit | Amicon Ultra-4 Centrifugal Filters Ultracel 50 K, 4 ml | Merck Millipore | UFC805096 | |
| Commercial assay or kit | Amicon Ultra-4 Centrifugal Filters Ultracel 100 K, 4 ml | Merck Millipore | UFC810024 | |
| Commercial assay or kit | Biobeads SM-2 adsorbents | BioRad Laboratories | 152–3920 | |
| Commercial assay or kit | Avestin Extruder kit | Sigma | Cat#Z373400 | |
| Commercial assay or kit | 400 nm polycarbonate filters | Sigma | Cat#Z373435 | |
| Commercial assay or kit | 96-well black walled microplates | Thermofischer Scientific | Cat#M33089 | |
| Commercial assay or kit | Ni-NTA resin | ABT Agarose Bead Technologies | 6BCL-NTANi-X | |
| Commercial assay or kit | QuantiFoil R1.2/1.3 Au 200 mesh | Electron Microscopy Sciences | Q2100AR1.3 | |
| Commercial assay or kit | Superdex 200 10/300 GL | Cytiva | 17517501 | |
| Commercial assay or kit | Superdex 200 Increase 3.2/300 | Cytiva | 28990946 | |
| Commercial assay or kit | Superdex 200 Increase 5/150 GL | Cytiva | 28990945 | |
| Commercial assay or kit | Superdex 75 10/300 GL | Cytiva | 17517401 | |
| Other | BioQuantum Energy Filter | Gatan | NA | |
| Other | HPL6 | Maximator | NA | |
| Other | K3 Direct Detector | Gatan | NA | |
| Other | Titan Krios G3i | ThermoFisher Scientific | NA | |
| Other | Viber Fusion FX7 imaging system | Witec | NA | |
| Other | TECAN M1000 Infinite | TECAN | NA | |
| Other | Vitrobot Mark IV | ThermoFisher Scientific | NA | |
| Other | μDAWN MALS Detector | Wyatt Technology | NA | |
| Recombinant DNA reagent | gDNA Eggerthella lenta | DSMZ | 2,243 | |
| Recombinant DNA reagent | gDNA Eremococcus coleocola | DSMZ | 15,696 | |
| Recombinant DNA reagent | Bacterial expression vector with C-terminal 3 C cleavage site, GFP-tag and His-tag | Dutzler laboratory | NA | |
| Recombinant DNA reagent | Bacterial expression vector with N-terminal His-tag and 3 C cleavage site | Dutzler laboratory | NA | |
| Recombinant DNA reagent | Bacterial expression vector with N terminal pelB sequence, His-tag, MBP, 3 C cleavage site | Dutzler laboratory | NA | |
| Recombinant protein | HRV 3 C protease | Expressed (pET_3 C) and purified in Dutzler laboratory | NA | |
| Software, algorithm | 3DFSC | Tan et al., 2017 | https://3dfsc.salk.edu/ | |
| Software, algorithm | ASTRA7.2 | Wyatt Technology | https://www.wyatt.com/products/software/astra.html | RRID:SCR_016255 |
| Software, algorithm | Chimera v.1.15 | Pettersen et al., 2004 | https://www.cgl.ucsf.edu/chimera/ | RRID:SCR_004097 |
| Software, algorithm | ChimeraX v.1.1.1 | Pettersen et al., 2021 | https://www.rbvi.ucsf.edu/chimerax/ | RRID:SCR_015872 |
| Software, algorithm | Coot v.0.9.4 | Emsley et al., 2010 | https://www2.mrc-lmb.cam.ac.uk/personal/pemsley/coot/ | RRID:SCR_014222 |
| Software, algorithm | cryoSPARC v.3.0.1/v.3.2.0 | Structural Biotechnology Inc. | https://cryosparc.com/ | RRID:SCR_016501 |
| Software, algorithm | DINO | http://www.dino3d.org | RRID:SCR_013497 | |
| Software, algorithm | EPU2.9 | ThermoFisher Scientific | NA | |
| Software, algorithm | Phenix | Liebschner et al., 2019 | https://www.phenix-online.org/ | RRID:SCR_014224 |
| Software, algorithm | RELION 3.0.7 | Zivanov et al., 2018 | https://www3.mrc-lmb.cam.ac.uk/relion/ | RRID:SCR_016274 |
| Software, algorithm | JALVIEW | Waterhouse et al., 2009 | ||
| Software, algorithm | Muscle | Edgar, 2004 | ||
| Strain, strain background (E coli) | E. coli MC1061 | ThermoFisher Scientific | C66303 |
Additional files
-
Transparent reporting form
- https://cdn.elifesciences.org/articles/74589/elife-74589-transrepform1-v2.docx
-
Source data 1
Sequences, transport assays, ITC data, chromatograms, gels.
- https://cdn.elifesciences.org/articles/74589/elife-74589-supp1-v2.zip
Download links
A two-part list of links to download the article, or parts of the article, in various formats.
Downloads (link to download the article as PDF)
Open citations (links to open the citations from this article in various online reference manager services)
Cite this article (links to download the citations from this article in formats compatible with various reference manager tools)
Structural and functional properties of a magnesium transporter of the SLC11/NRAMP family
eLife 11:e74589.
https://doi.org/10.7554/eLife.74589


