Systematic analysis of membrane contact sites in Saccharomyces cerevisiae uncovers modulators of cellular lipid distribution
- Department of Molecular Genetics, Weizmann Institute of Science, Israel
- Centre for Molecular Medicine and Therapeutics, British Columbia Children’s Hospital Research Institute, University of British Columbia, Canada
- Department of Medical Genetics, University of British Columbia, Canada
- Laboratory for Molecular Cell Biology, University College London, United Kingdom
- Department of Biological Sciences, University of Calgary, Canada
- Medical Biochemistry and Molecular Biology, PZMS, Medical Faculty, Saarland University, Germany
- UCL Institute of Ophthalmology, University College London, United Kingdom
Figures
Figure 1 with 1 supplement
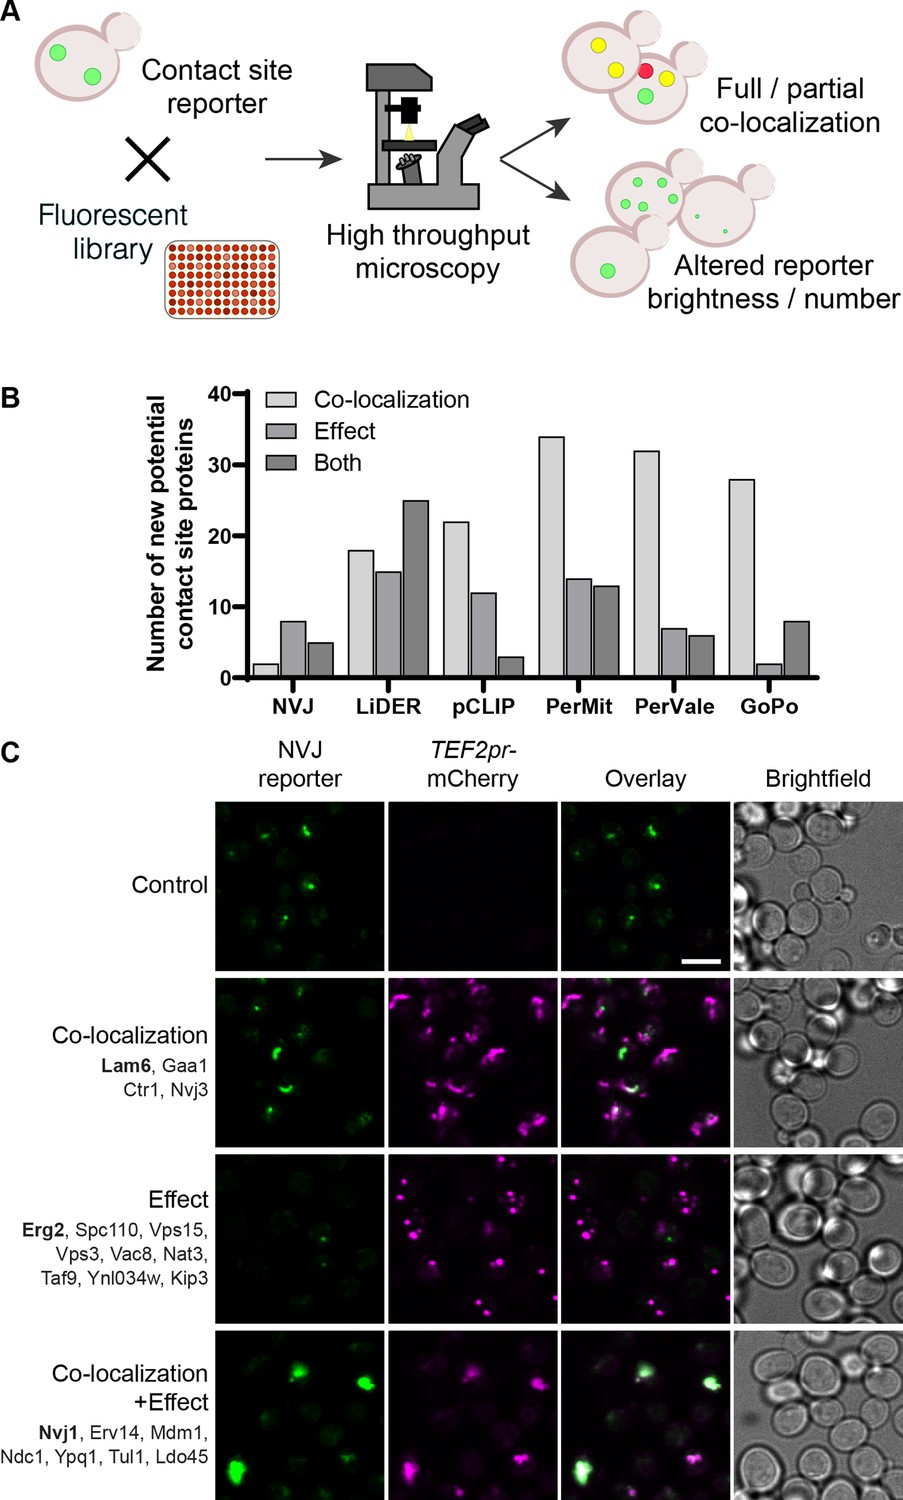
Systematic screens uncover new contact site residents and effectors in yeast.
(A) Schematic representation of the high-throughput screening approach used to identify new contact site residents and regulators. (B) Graphical representation of the number of newly suggested contact site residents and effectors (excluding known contact site residents), categorized based on co-localization with and/or effect on contact site reporter. (C) Summary results of the NVJ contact site screen. A total of 20 proteins were identified and characterized based on their co-localization with and/or effect on the contact site reporter. Individual hits are listed under each category, and example images are from proteins highlighted in bold. Scale bar, 5 µm; Images obtained using Micro 1 (For details of each microscope used see ‘Materials and methods’ section).
-
Figure 1—source data 1
Numerical values used for graph in B.
- https://cdn.elifesciences.org/articles/74602/elife-74602-fig1-data1-v1.xlsx
Figure 1—figure supplement 1
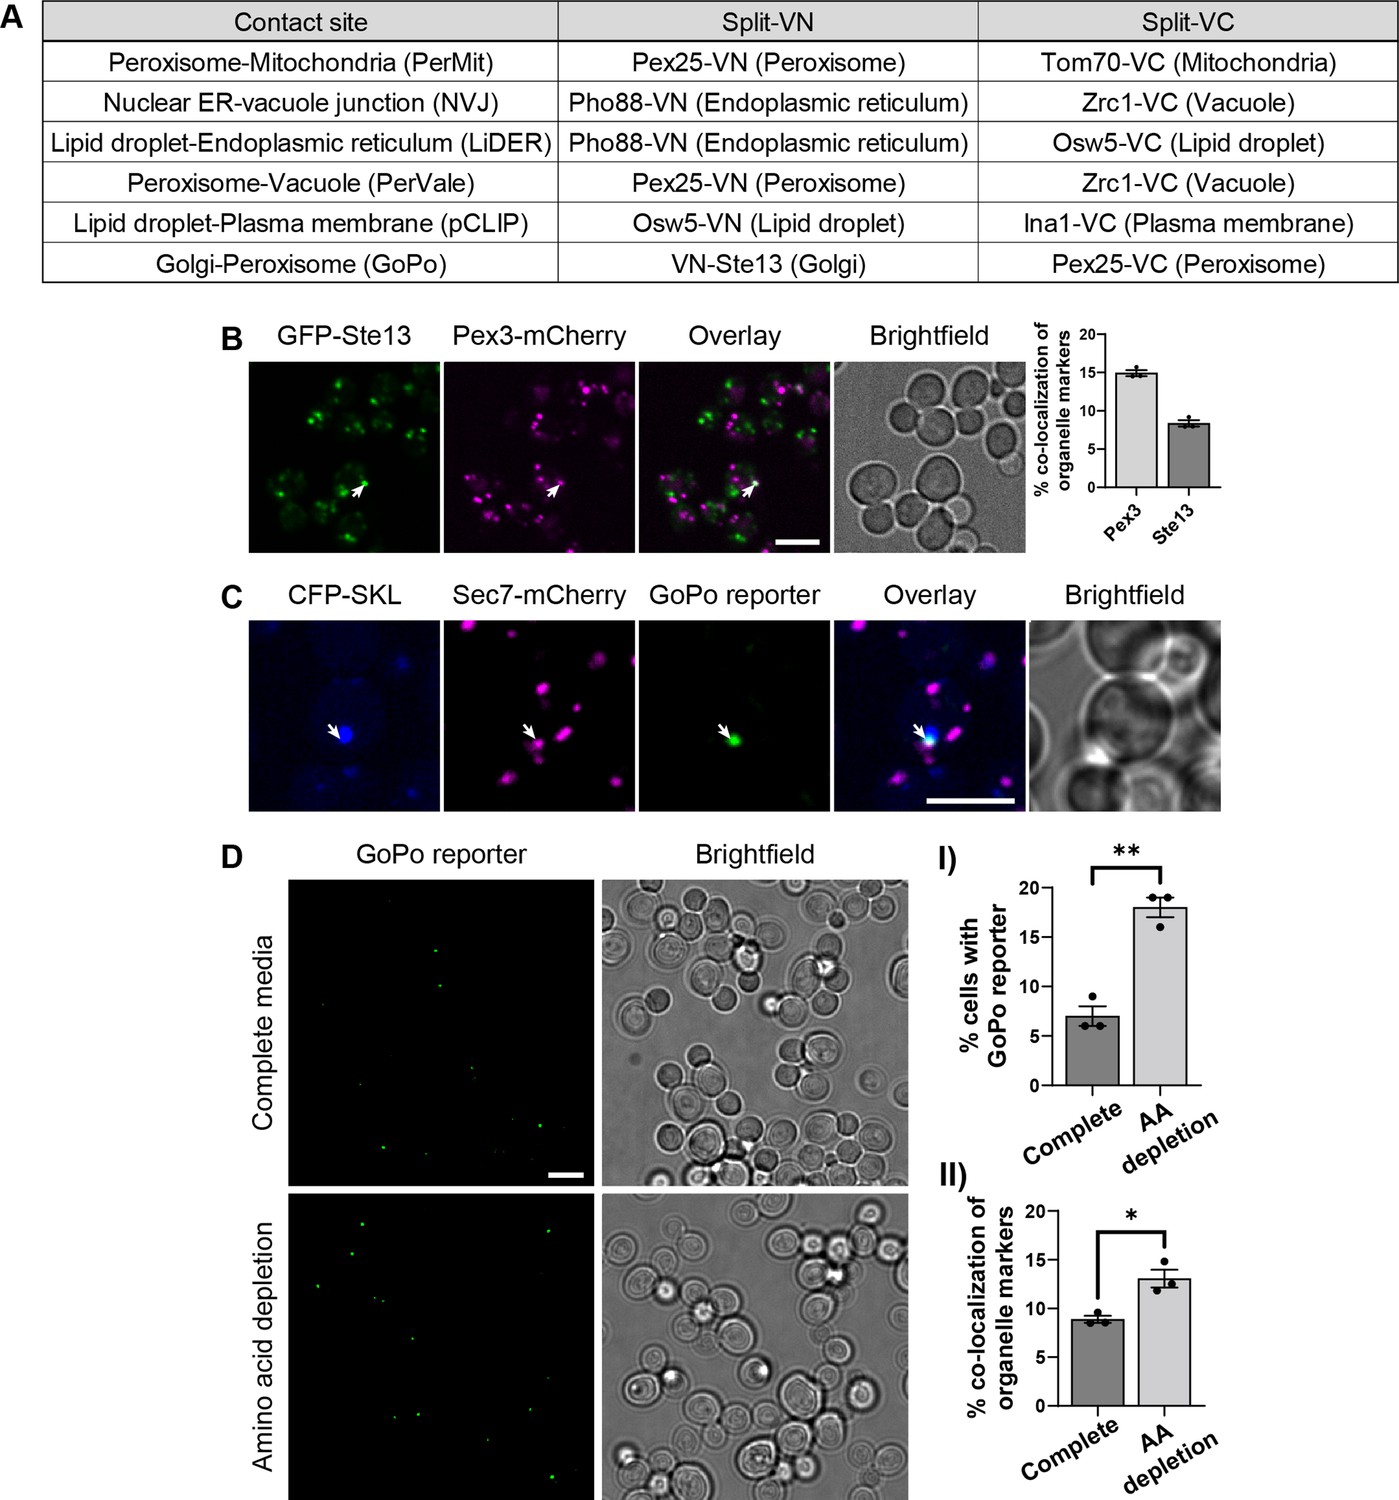
Contact site reporters and GoPo characterization.
(A) Table showing the pairs of tagged proteins used as reporters in each contact site screen, the Venus protein fragment with which they were fused, and the organelle in which they reside. (B) Co-localization between Golgi cisternae (GFP-Ste13) and peroxisomes (Pex3-mCherry) (white arrow). On the right, quantification of co-localization events between markers, as a percentage of total number of puncta for each marker (data are presented as mean ± SEM n=3). Scale bar, 5 µm; Images obtained using Micro 2. (C) The GoPo reporter localizes at the interface between peroxisomes (CFP-SKL) and Golgi cisternae (Sec7-mCherry). Scale bar, 5 µm; Images obtained using Micro 2. (D) Frequency of GoPo reporter in cells grown in SD medium with a complete set of amino acids in comparison to cells grown in SD medium with amino acid depletion. (I) Quantification of cells that have the GoPo reporter, which significantly increases upon amino acid depletion (data are presented as mean ± SEM n=3), analysis performed using an unpaired t-test. (** p≤0.01). (II) Quantification of co-localization events between organelle markers, as a percentage of total number of puncta for each marker, which significantly increases upon amino acid depletion (data are presented as mean ± SEM n=3), analysis performed using an unpaired t-test. (* p≤0.05).
-
Figure 1—figure supplement 1—source data 1
Numerical data used to generate graphs B, D (I) and (II).
- https://cdn.elifesciences.org/articles/74602/elife-74602-fig1-figsupp1-data1-v1.xlsx
Figure 2 with 3 supplements

The pCLIP screen reveals Vps13 homologs at multiple contacts.
(A) Summary results of the pCLIP (LD-PM) contact site screen. A total of 37 proteins were identified and characterized based on their co-localization with and/or effect on the contact site reporter. Individual hits are listed under each category, and example images are from proteins highlighted in bold. Scale bar, 5 µm; Images obtained using Micro 1. (B) Predicted structures of Hob1, Hob2, and Csf1 in comparison to Atg2. Structural predictions were created by the AlphaFold2 consortium for the full-length proteins Hob1/2 and Atg2. For Csf1, four overlapping regions were predicted separately using the AlphaFold2 Colab (Mirdita et al., 2021). Internal channel volumes were calculated with MOLE and are depicted in blue. (C) N-terminally mCherry-tagged Hob1, Hob2, and Csf1, under the strong TEF2 promoter, co-localize with the pCLIP contact site reporter. Scale bar, 5 µm; Images obtained using Micro 1.
Figure 2—figure supplement 1
pCLIP localization.
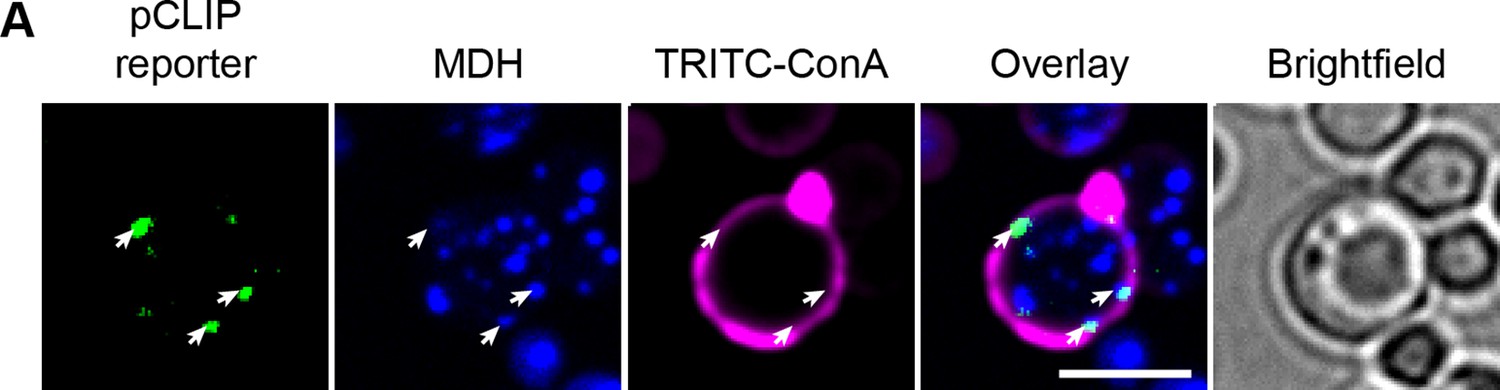
(A) pCLIP split-reporter (Osw5-VN and Ina1-VN) co-localizes with LDs at the cell periphery (white arrows). LD marker, MDH; cell periphery marker, TRITC-ConA. Scale bar, 5 µm; Images obtained using Micro 2.
Figure 2—figure supplement 2
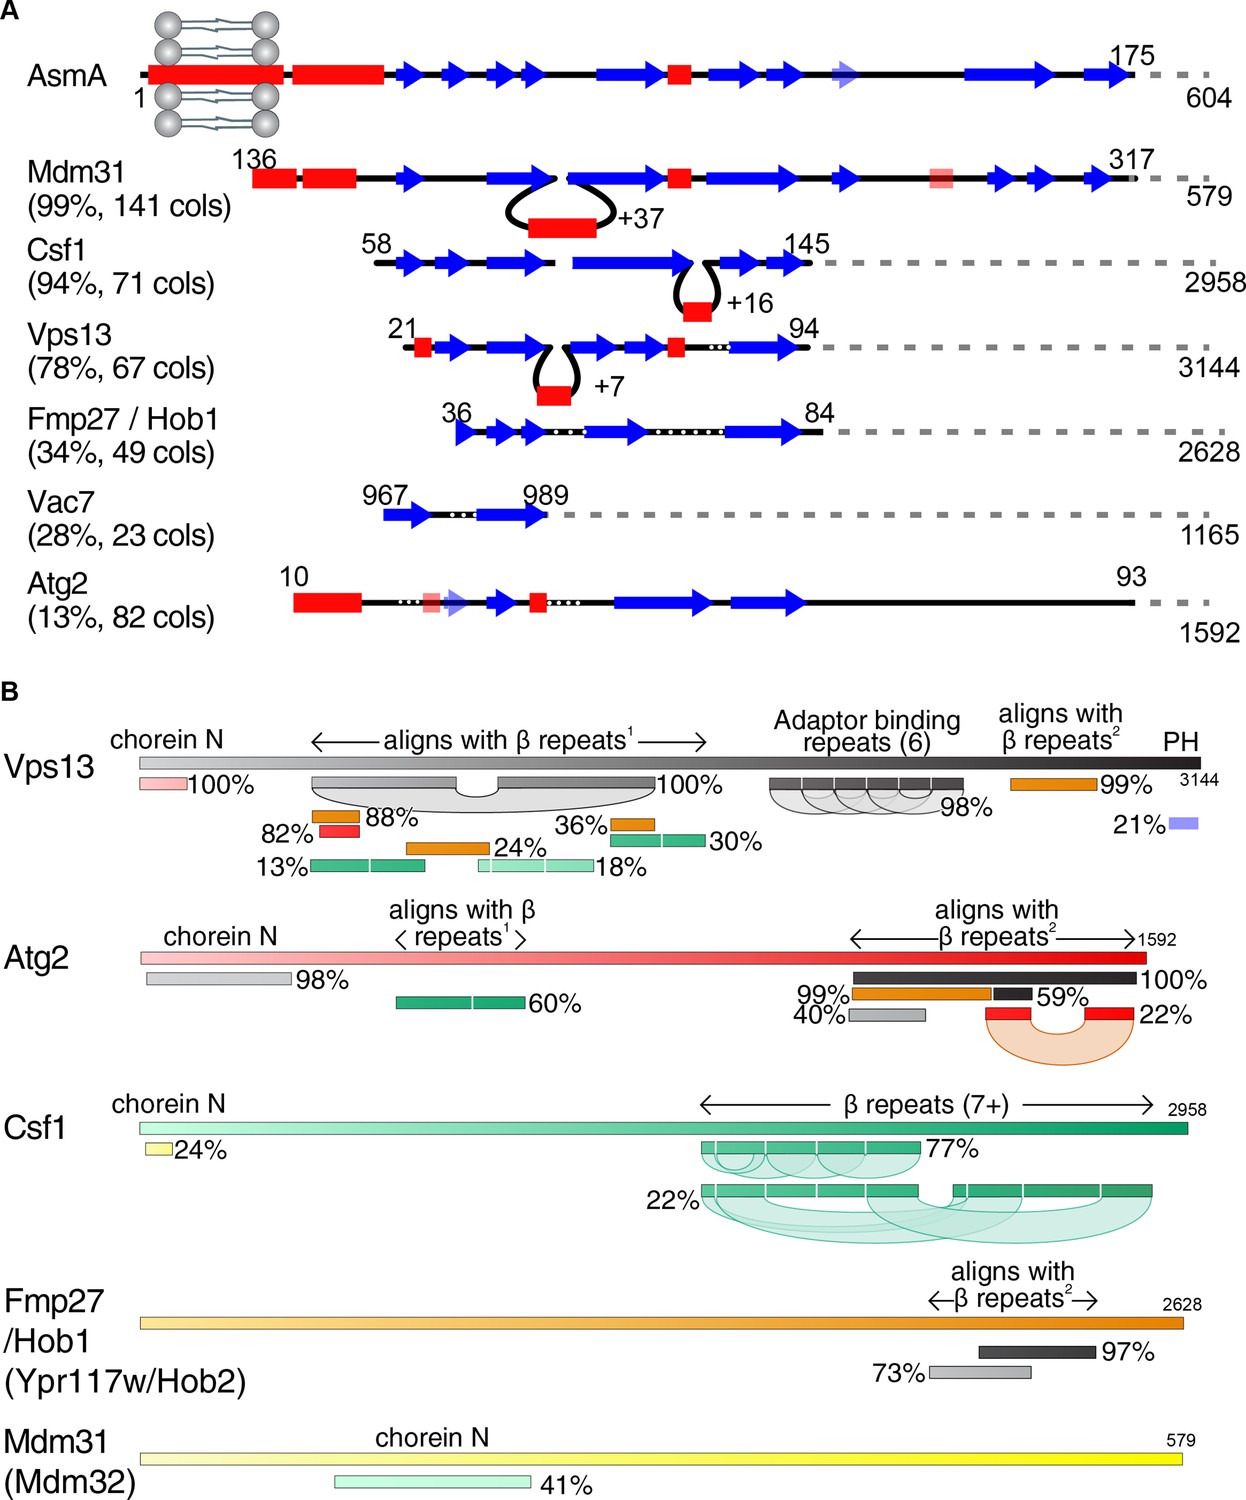
Vps13 superfamily protein domain structure and comparison.
(A) Csf1 and Hob1 are homologs of Vps13. The N-terminus of AsmA (E. coli), consisting of its transmembrane domain and N-chorein domain was used to seed an HHpred search for yeast homologs. Secondary structural elements are shown of the seed and all yeast hits that focus on the predicted β-strands with >15 columns matched. For each hit, the probability of the match being a true positive is shown together with the number of columns (cols) matched. Insertions in hits are indicated by loops, and gaps in hits are indicated by white dotted lines. Weakly predicted secondary structural elements are shown as faint and transparent. (B) Structural elements determined by HHpred in the superfamily of Vps13, Atg2, and their homologues Csf1, Hob1/2 (Fmp27/Ypr117w) and Mdm31/32. HHpred searches with each full-length protein produced alignments between proteins in the superfamily. In addition, self-alignments occurred in Vps13, Atg2 and Csf1, identifying three types of repeats, only one of which, the 6 Adaptor Binding repeats in the C-terminal half of Vps13, has been identified previously (Bean et al., 2018; Kumar et al., 2018). The most common type of repeat is a mainly-beta strand module of approx. 140 residues, which is repeated at least 7 times in the C-terminal half of Csf1. This region is homologous directly to regions in the N-terminal halves of Vps13 and Atg2, which in turn are homologous to regions near the C-termini of Vps13, Atg2, and Hob1/2. The final type of repeats consists of a pair of helices, which is repeated near the C-terminus of both Vps13 and Atg2, and has previously been named ‘Atg2_C’. Other domains (both identified previously) identified by homologies are: Chorein-N at the N-terminus of Vps13, Atg2, Csf1, and Mdm31/32, and the pleckstrin homology (PH) domain at the C-terminus of Vps13 only. Position along each protein is indicated in both seeds and hits by varying colors across different spectra. Hob2 (Ypr117w) and Mdm32 were merged with their paralogs as on this schematic level they are identical to their paralogs Hob1 (Fmp27) and Mdm31, respectively.
Figure 2—figure supplement 3
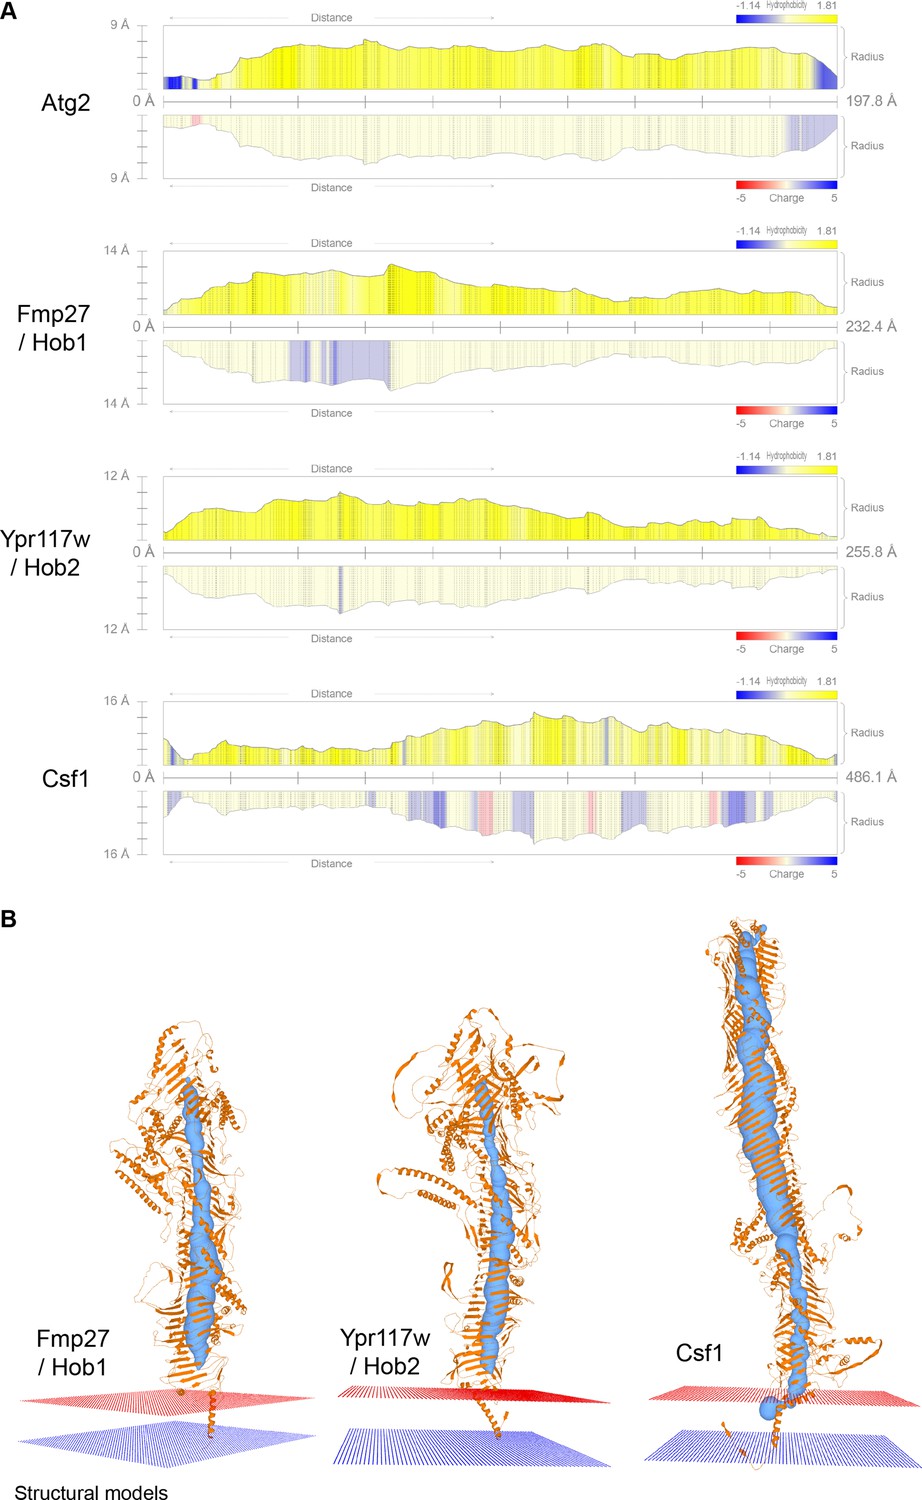
Vps13 superfamily protein channel comparison and membrane topology.
(A) Channel profiles obtained with MOLE for the different Vps13 superfamily proteins. The radius of the channel along the protein is depicted, together with its hydrophobicity and charge. (B) Predicted N-terminal transmembrane domains anchors for the Vsp13 family proteins analyzed with MOLE.
Figure 3 with 2 supplements
The LiDER screen reveals new residents and effectors.
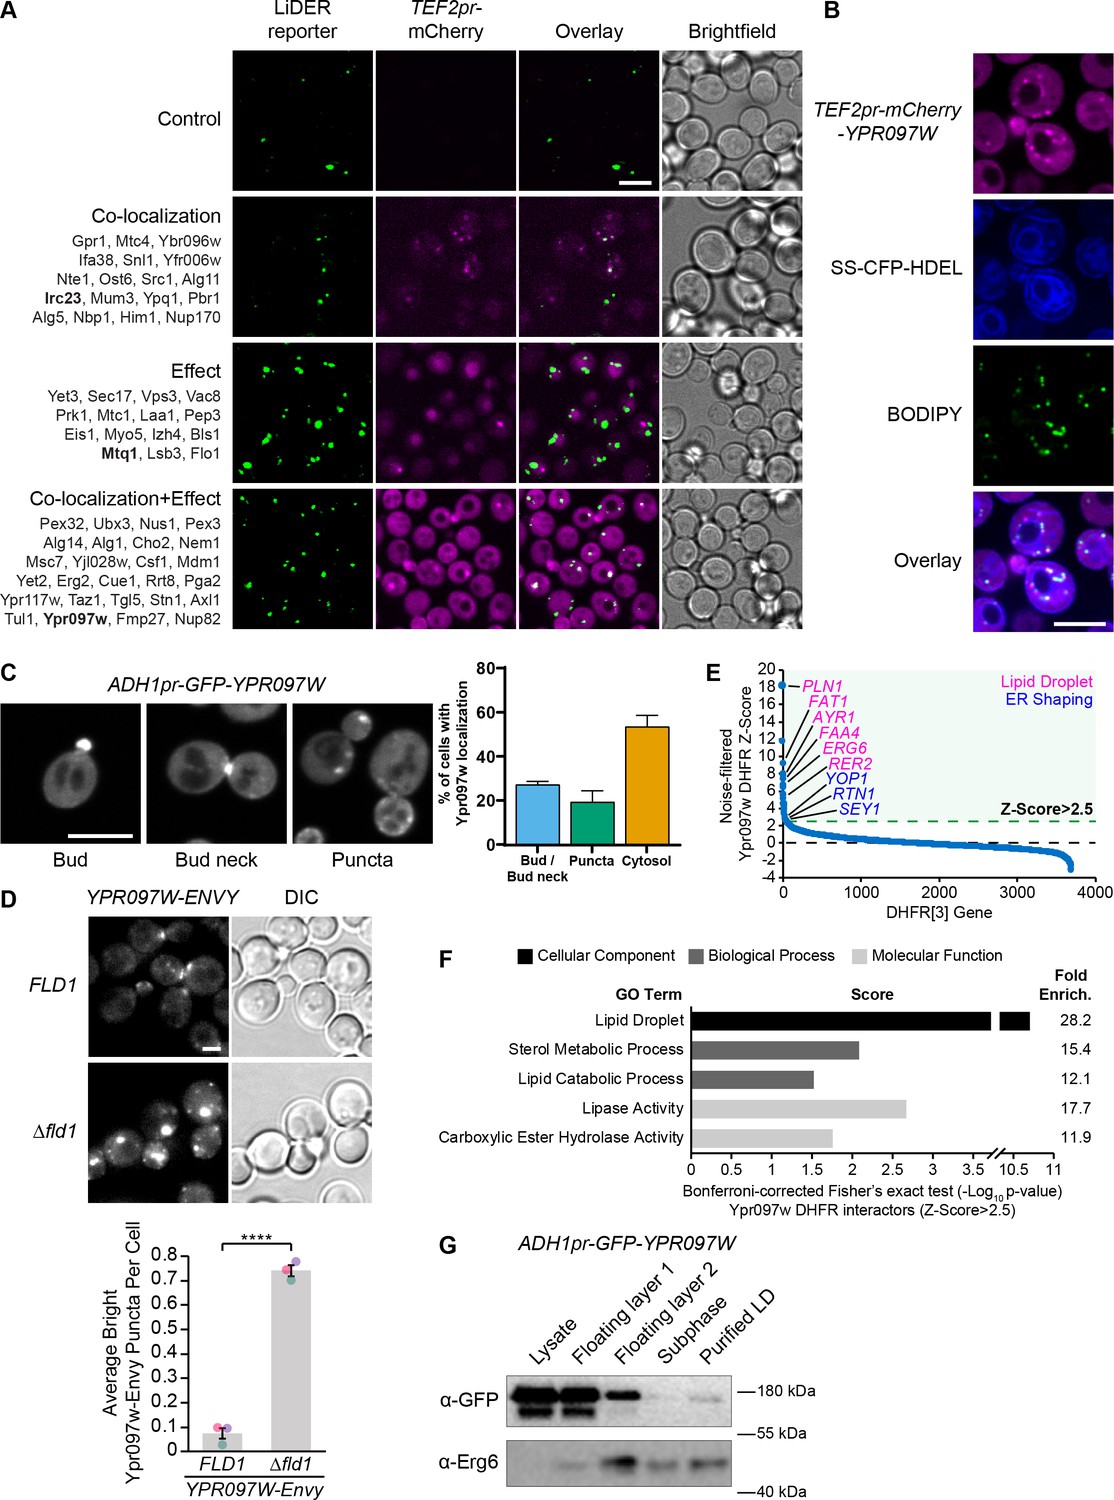
(A) Summary results of the LiDER contact site screen. A total of 59 proteins were identified and characterized based on their co-localization with and/or effect on the contact site reporter. Individual hits are listed under each category, and example images are from proteins highlighted in bold. Scale bar, 5 µm; Images obtained using Micro 1. (B) mCherry-Ypr097w, under control of the TEF2 promoter, localizes to LDs (BODIPY) in the periphery of the ER (SS-CFP-HDEL). Scale bar, 5 µm; Images obtained using Micro 2. (C) Cellular localization of ADH1pr-GFP-YPR097W during mid-logarithmic growth. Cells were categorized based on Ypr097w localization and quantified as shown in the graph (data are presented as mean ± SEM (n=3)). Scale bar, 5 µm; Images obtained using Micro 1. (D) Ypr097w-Envy accumulates at large, bright intracellular puncta in ∆fld1 mutants. Quantification of Ypr097w-Envy puncta per cell. Two tailed equal variance t test; n=3, cells/strain/replicate ≥2448; ****=p < 0.0001. Scale bar, 2 µm. Error bars report SEM. (E) Noise-filtered Z-Score distribution of colony area from a DHFR protein fragment complementation assay with endogenously expressed Ypr097w used as a bait. Filtering was used to remove prey strains that exhibited strong signal with a validated cytoplasmic DHFR reporter. An enrichment of proteins with reported LD subcellular localization patterns and proteins with roles in ER shaping was observed in prey strains with a Z-Score of >2.5. (F) Functional enrichment analysis of strong Ypr097w DHFR interactors (Z>2.5) using the Gene Ontology (GO) enrichment analysis tool (Ashburner et al., 2000; Mi et al., 2019; The Gene Ontology Consortium, 2019). GO terms are presented as the negative base 10 log of the associated p-value from a Bonferroni-corrected Fisher’s exact test. Lipid Droplet (GO:0005811); Sterol Metabolic Process (GO:0016125); Lipid Catabolic Process (GO:0016042); Lipase Activity (GO:0016298); Carboxylic Ester Hydrolase Activity (GO:0052689) are significantly enriched ontologies. (G) Cells expressing ADH1pr-GFP-YPR097W were collected and fractionated by centrifugation to obtain enriched LD fractions. Sequential fractions were run by SDS-page and analyzed by western blot. GFP-Ypr097w is present in the LD fraction. Erg6 was used as a LD marker.
-
Figure 3—source data 1
Numerical values used for graph C.
- https://cdn.elifesciences.org/articles/74602/elife-74602-fig3-data1-v1.xlsx
-
Figure 3—source data 2
Numerical values used for graph D.
- https://cdn.elifesciences.org/articles/74602/elife-74602-fig3-data2-v1.xlsx
-
Figure 3—source data 3
DHFR source data used for graphs E and F.
- https://cdn.elifesciences.org/articles/74602/elife-74602-fig3-data3-v1.xlsx
-
Figure 3—source data 4
Original and labeled raw unedited blots for G.
- https://cdn.elifesciences.org/articles/74602/elife-74602-fig3-data4-v1.zip
Figure 3—figure supplement 1
Ypr097w is dynamically relocalized in various conditions.
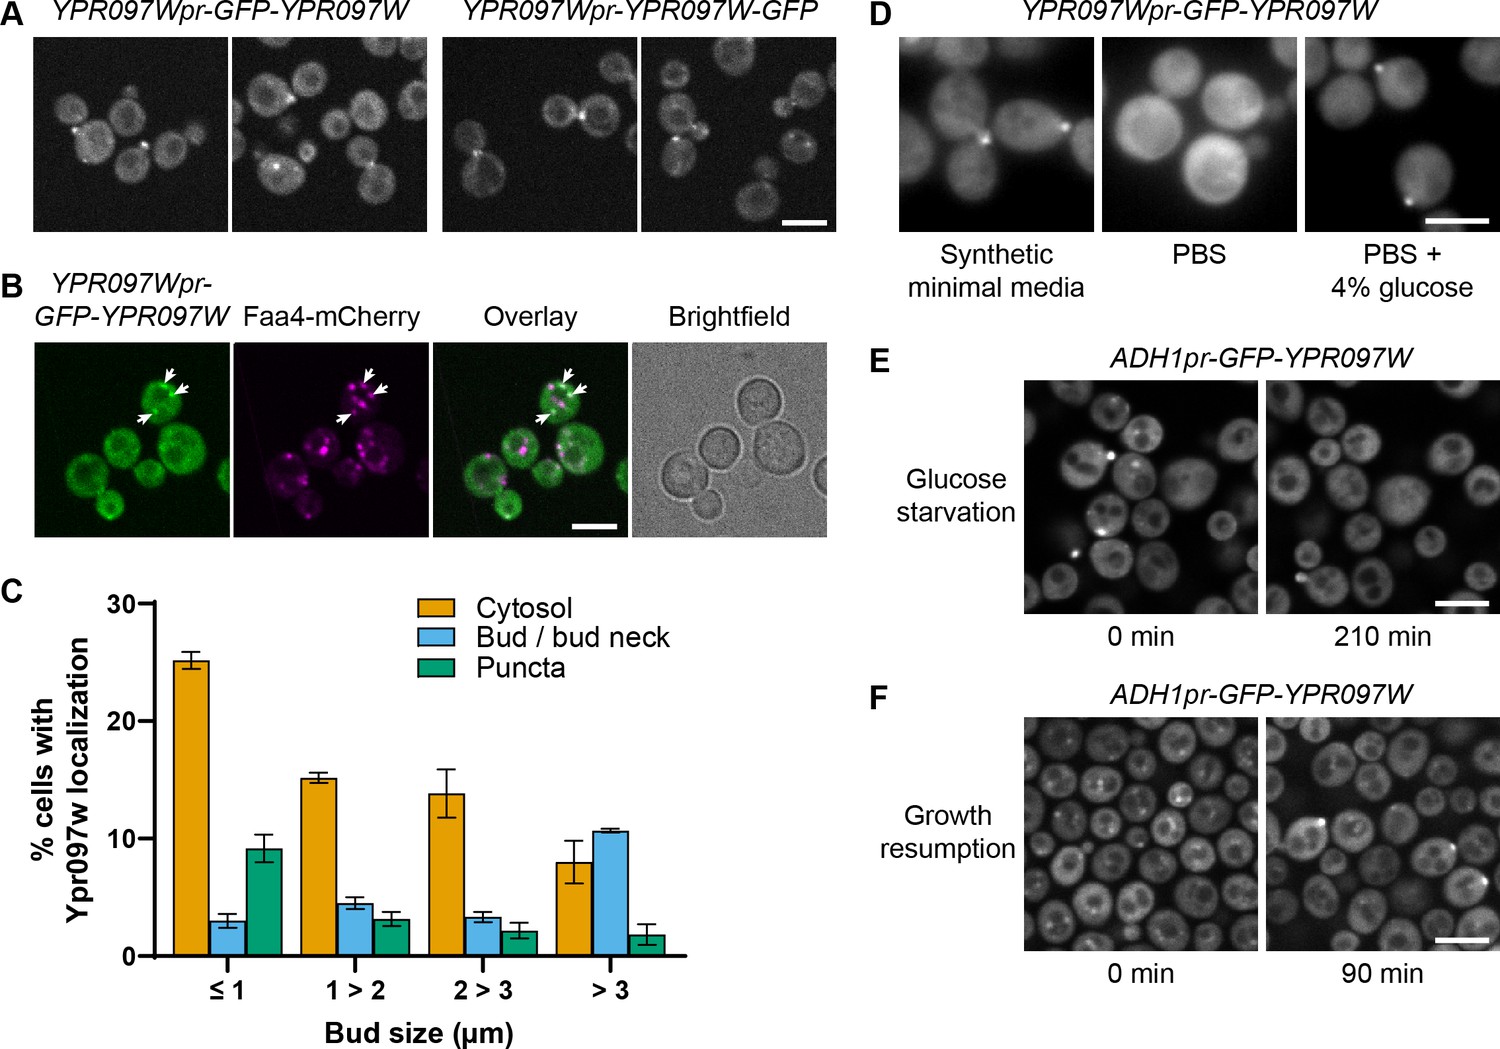
(A) Localization of endogenous Ypr097w, GFP-tagged at the N-terminus (2 left images) or C-terminus (2 right images). Scale bar, 5 µm; Images obtained using Micro 1. (B) Endogenously expressed GFP-tagged Ypr097w co-localizes with the LD marker Faa4-mCherry (white arrows). Scale bar, 5 µm; Images obtained using Micro 1. (C) Quantification of the cellular localization of ADH1pr-GFP-YPR097W during mid-logarithmic growth in relation to bud size (diameter) (data are presented as mean ± SEM (n=3)) (relative to Figure 3C). (D) Loss of bud and bud neck localization of endogenous GFP-Ypr097w when shifted from minimal synthetic media to PBS (<2 min). Bud and bud neck localization remains when PBS is supplemented with glucose. Scale bar, 5µm; Images obtained using Micro 3. (E) Loss of bud/bud neck and puncta localization of ADH1pr-GFP-YPR097W when shifted to synthetic media without glucose for 210 min. Scale bar, 5 µm; Images obtained using Micro 2. (F) Cellular localization of ADH1pr-GFP-YPR097W in stationary (left) and upon media replenishment for 90 min (growth resumption, right). GFP-Ypr097w re-localizes from a punctate pattern to a combination of punctate, bud/bud neck and cytosol. Scale bar, 5 µm; Images obtained using Micro 2.
-
Figure 3—figure supplement 1—source data 1
Numerical values used for graph C.
- https://cdn.elifesciences.org/articles/74602/elife-74602-fig3-figsupp1-data1-v1.xlsx
Figure 3—figure supplement 2
Effect of Ypr097w truncation or mutation on cellular localization.
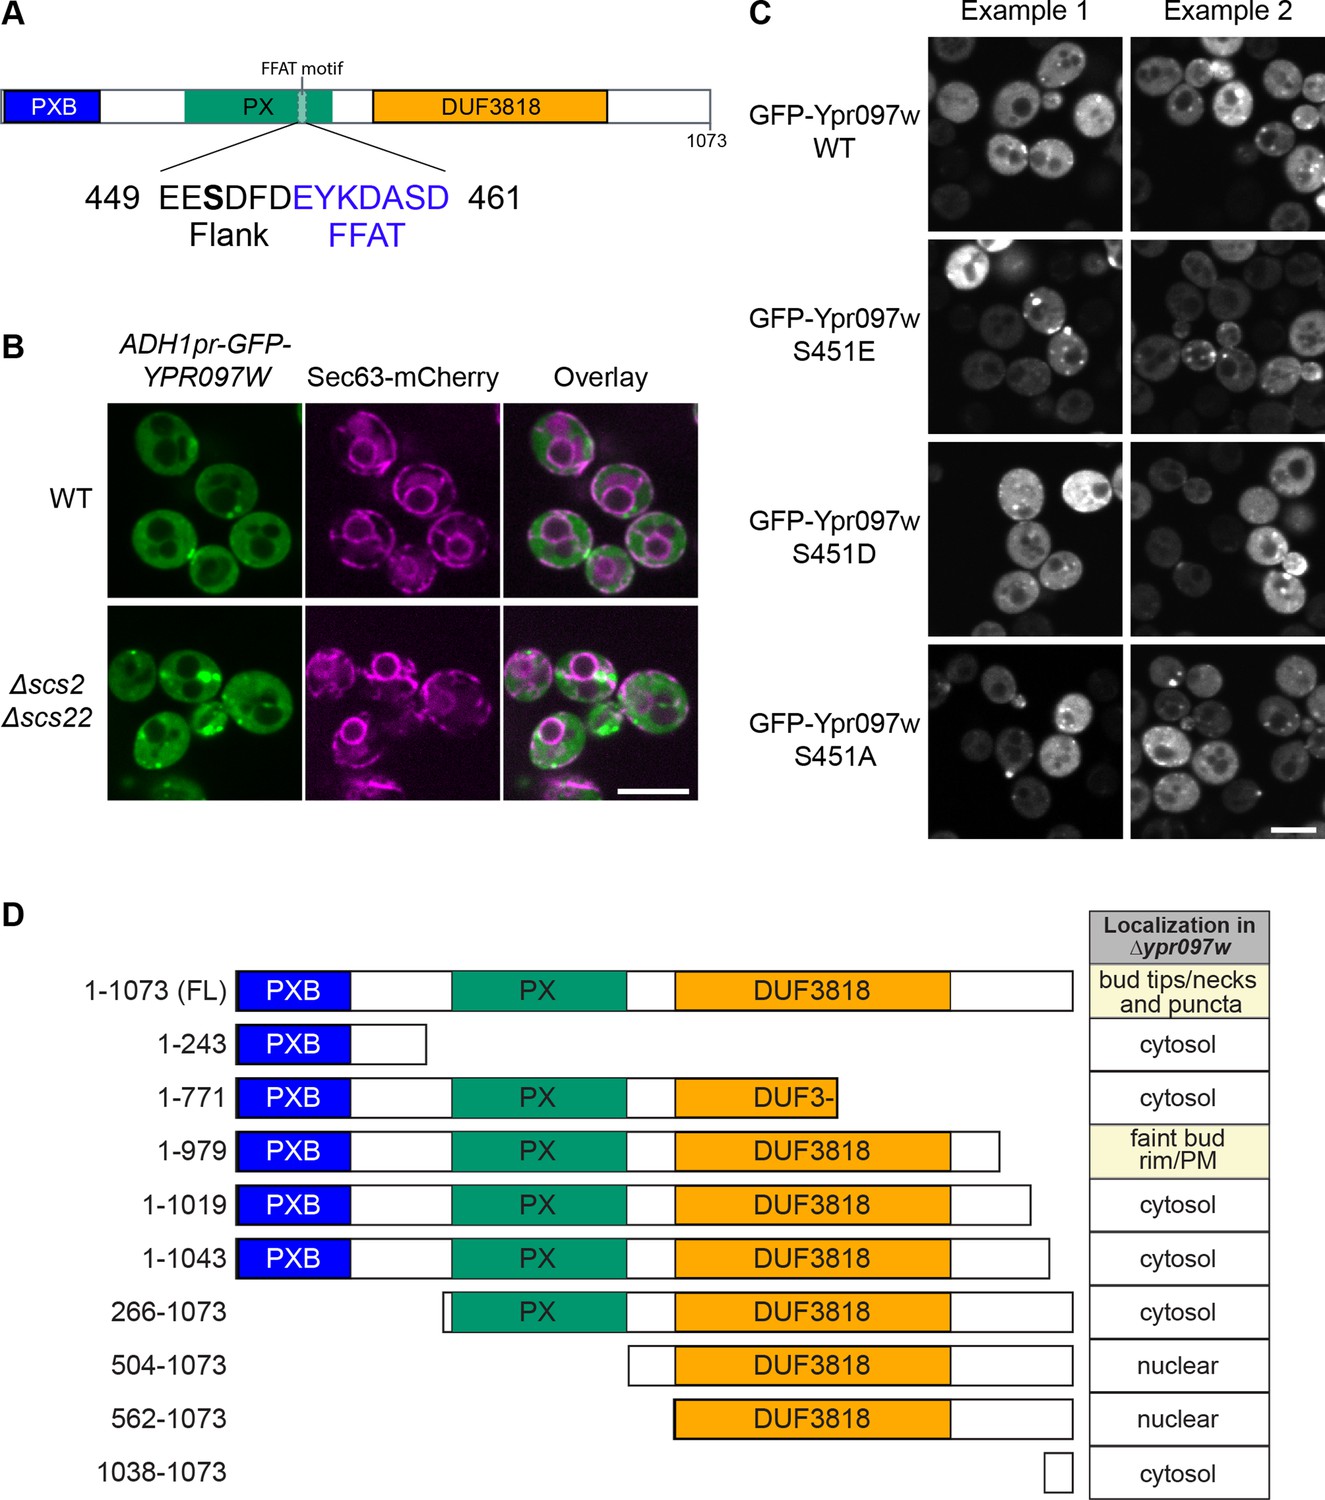
(A) Schematic representation of Ypr097w domains, with highlighted FFAT motif and previously detected phosphorylation site. 3 phosphomutants were generated by site directed mutagenesis of residue S451: phosphomimetic (S451E; S451D) and phospho-null (S451A). (B) Cellular localization of ADH1pr-GFP-YPR097W in control and Δscs2Δscs22 cells. GFP-Ypr097w localization shifts to a stronger punctate pattern in Δscs2Δscs22 cells. ER marker is Sec63-mCherry. Scale bar, 5 µm; Images obtained using Micro 2. (C) Cellular localization of GFP-Ypr097w WT and phosphomutants in Δypr097w cells. Plasmid expressed GFP-Ypr097w localizes to bud/bud neck and punctate pattern with different levels of expression. Two examples of each plasmid are shown to exemplify phenotype variability. Scale bar, 5 µm; Images obtained using Micro 2. (D) Summary of the cellular localization and schematic representation of the Ypr097w truncations examined by microscopy. Table indicates the localization of plasmid-borne C-terminally GFPenvy-tagged truncations in a Δypr097w strain.
Figure 4 with 2 supplements
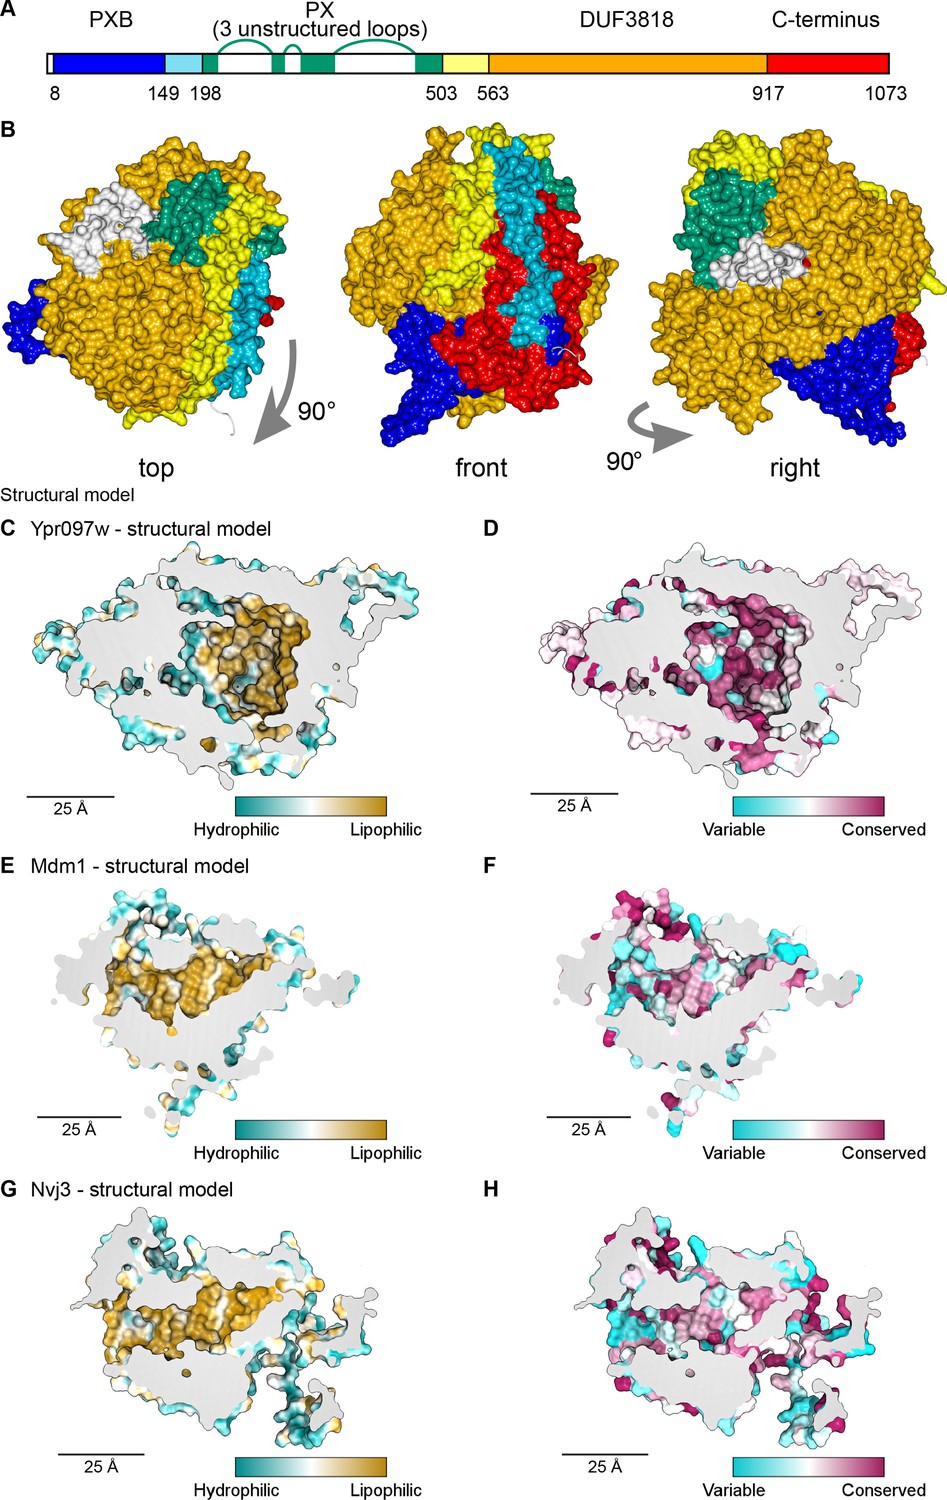
Structural bioinformatics predicts that Ypr097w forms a large spherical hydrophobic cavity.
(A) Domain map of Ypr097w based results from HHpred. The PX domain (shown in green) is extended more towards the N-terminus than shown previously through identifying residues 203–212 as its first strand. The extreme C-terminus (red) is as helical and as conserved as the preceding DUF3818 domain (orange). The PX domain contains three loops without strong structural predictions (white). (B) AlphaFold2 structure prediction for Ypr097w, colored by domain as in (A), omitting loops outside the protein core. Three views from different angles. Domains are intimately associated with each other, in particular the PXB (blue) and extreme C-terminus (red). (C–D) Representations of the cavity of Ypr097w predicted by AlphaFold2, with the lining colored by either hydrophobicity (C) or conservation (D). (E–F) Representations of the cavity of Mdm1 predicted by AlphaFold2, coloring as for C/D, respectively. (G–H) Representations of the cavity of Nvj3 predicted by AlphaFold2, coloring as for C/D, respectively.
Figure 4—figure supplement 1
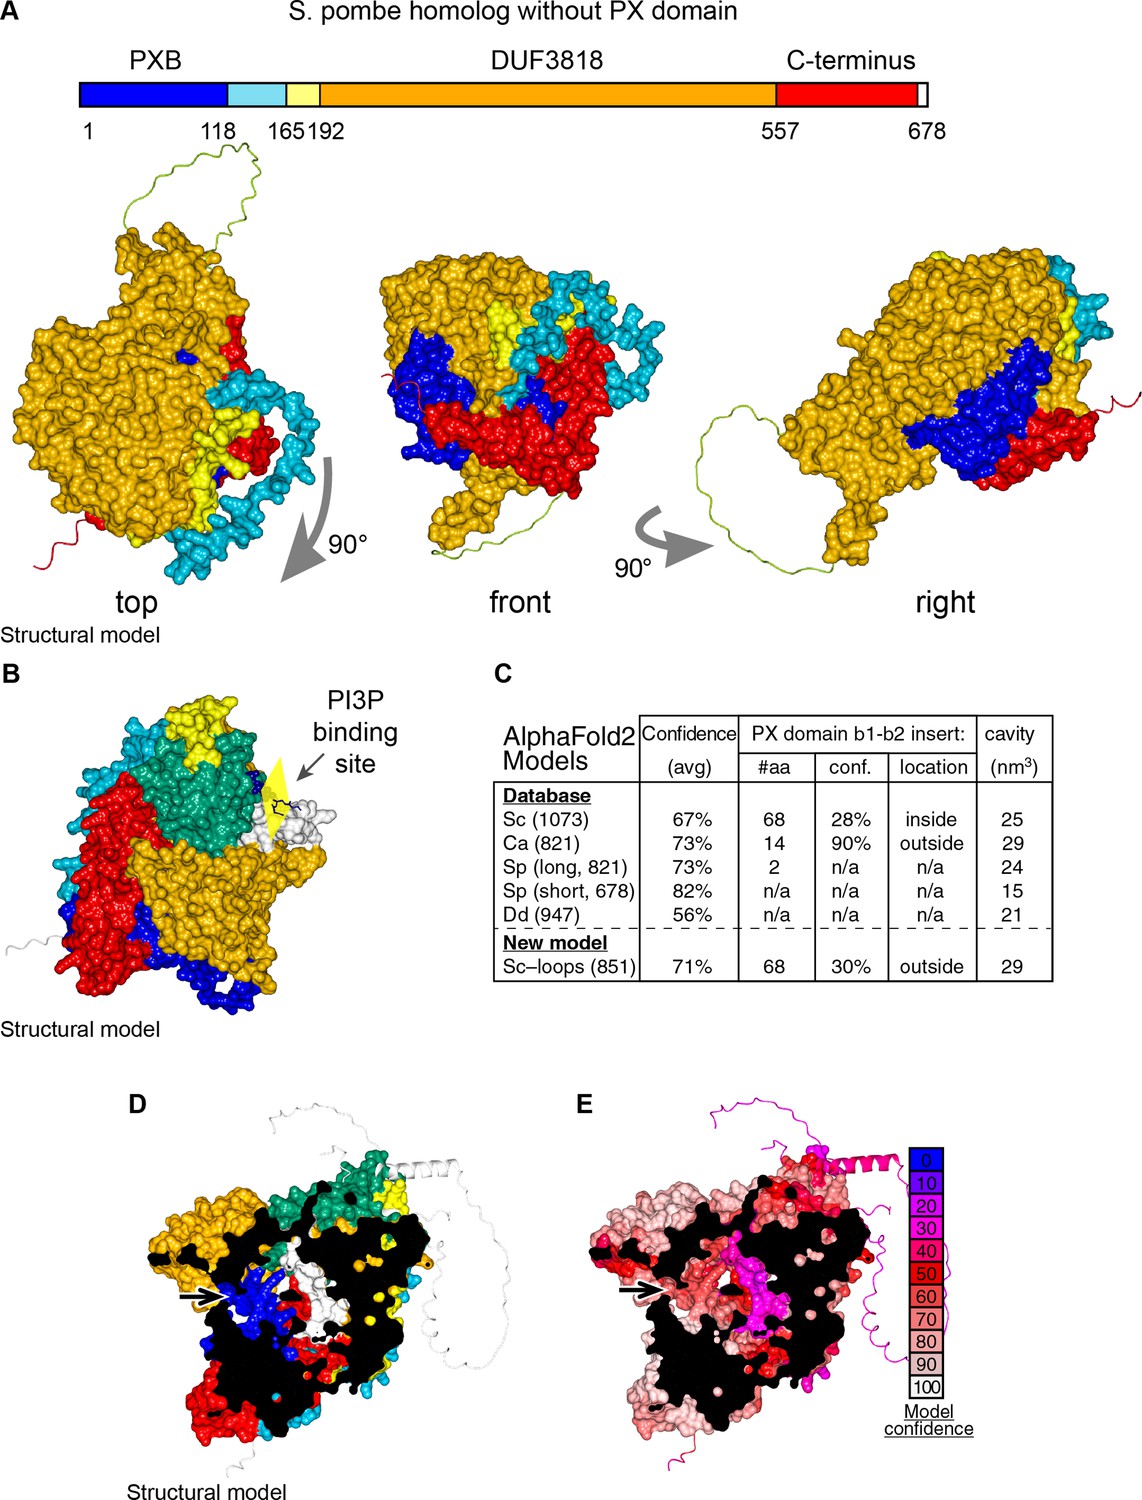
Details of AlphaFold2 structural predictions of Ypr097w in various species.
(A) Domain map and surface representations of SPCC663.15c, the short homolog of Ypr097w in S. pombe lacking a PX domain. Coloring as in Figure 4A–B. The domains are intimately intertwined, in particular the N-terminal PXB domain (blue) and extreme C-terminus (red). (B) Model of Ypr097w with super-posed headgroup of PI3P, by aligning the PX domain with that of p40phox (PDB 1H6H) (Bravo et al., 2001). (C) Key information about AlphaFold2 predictions for Ypr097w homologs. Data is from five pre-made AlphaFold2 models containing PXB and DUF3818: S. cerevisiae (Sc), C. albicans orf19.5621 (Ca), S. pombe SPCC1450.12 and SPCC663.15c (Sp 821 and 678 aa respectively) and D. discoideum (Dd) Q54JB8 (Jumper et al., 2021). Data shown: number of residues, overall confidence across the whole model (average pLDDT for all residues), details for the insert between strand 1 and strand 2 of the PX domain where S. cerevisiae Ypr097w uniquely has a loop with a local confidence score well below the 50% cut-off for useful interpretation (AlQuraishi, 2021), and estimated size of the internal cavity as calculated by MOLE. (D–E) AlphaFold2 prediction for the whole of Ypr097w, clipped to reveal the internal cavity, coloring either by domain (D, as in Figure 4A–B), or by conservation (E, as in the key). Residues 243–280 in the first loop run internally (white in D, purple in E). In parts D and E, arrows indicate potential tunnels linking the cavity to the cytosol.
Figure 4—figure supplement 2
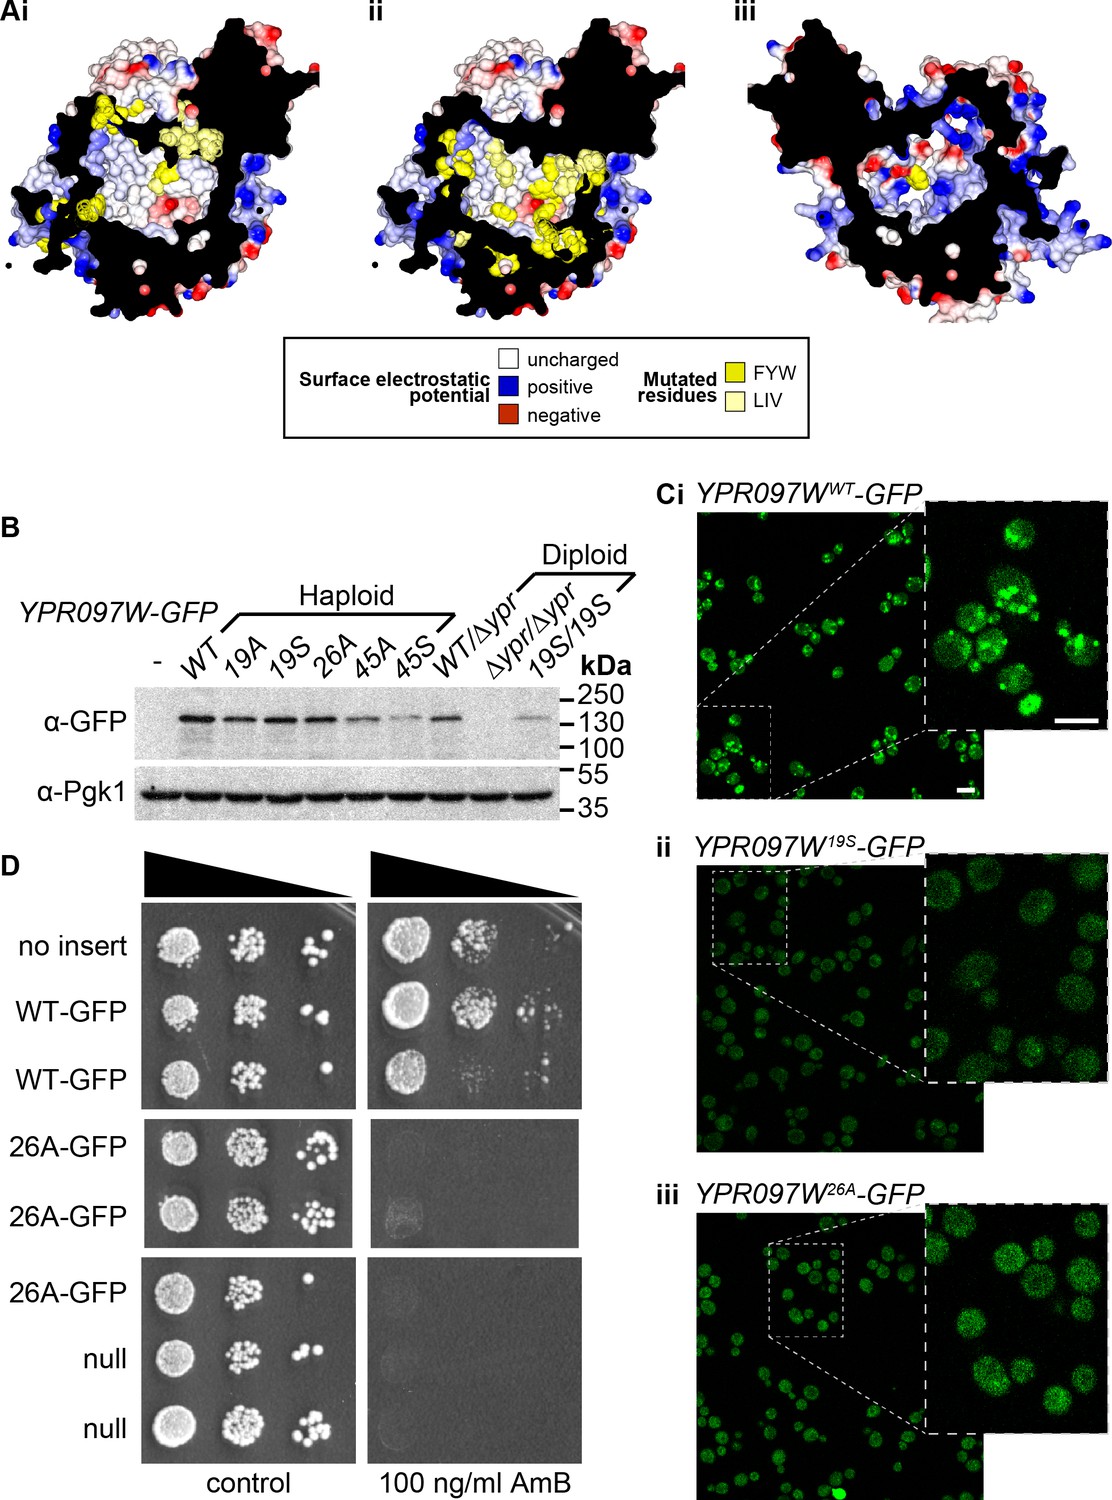
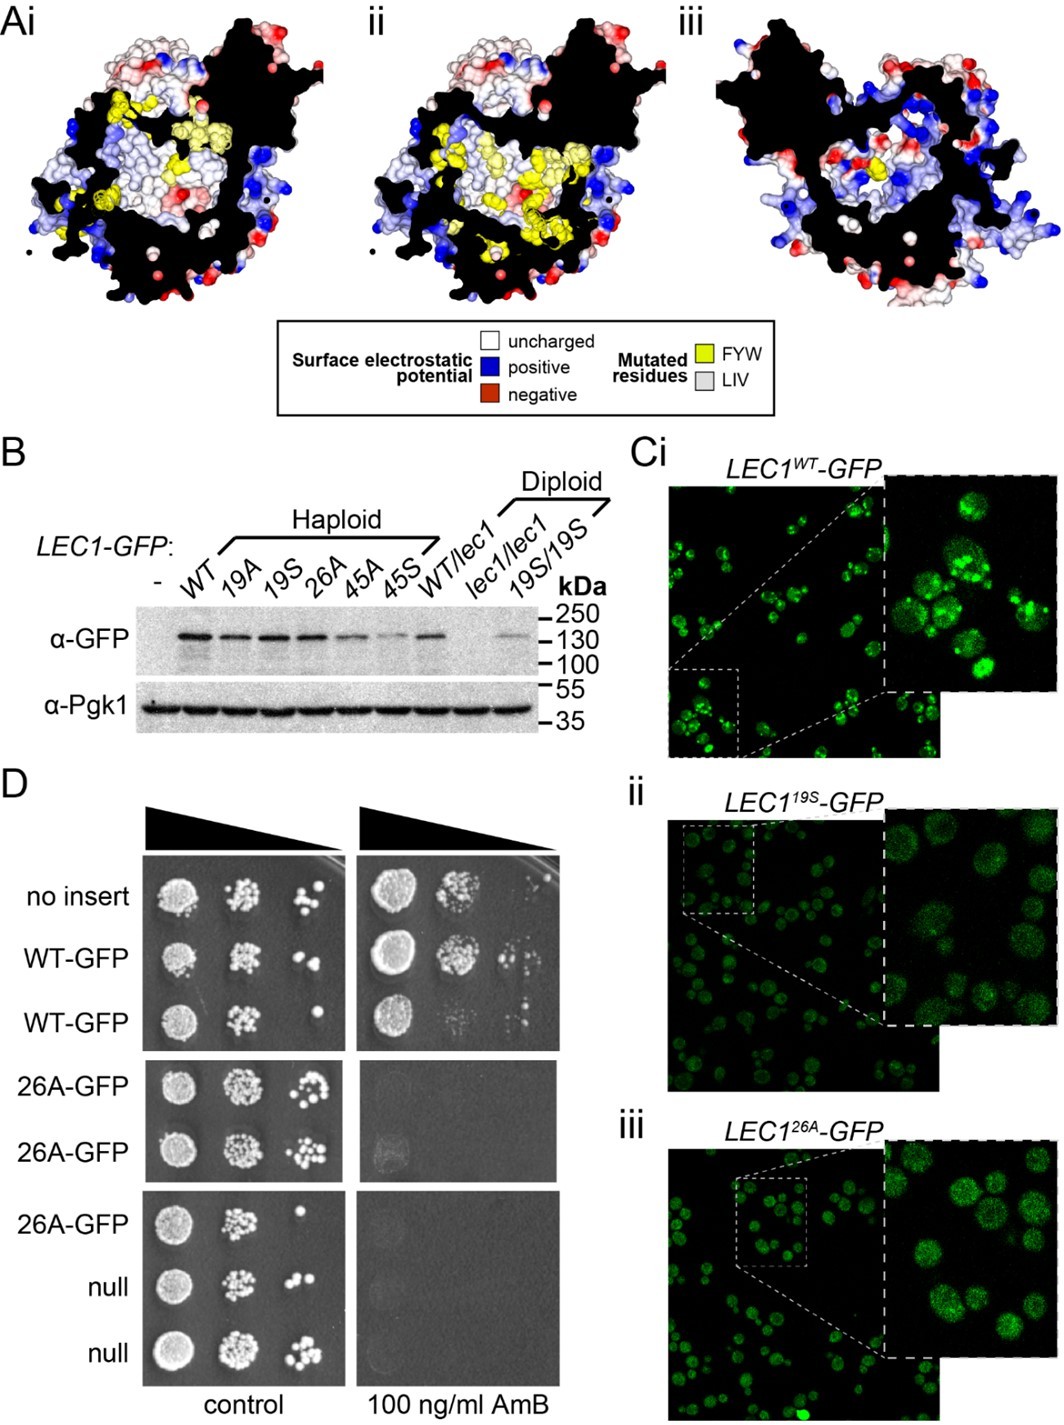
Mutagenesis analysis of Ypr097w hydrophobic cavity.
(A) Model of the internal surface of the cavity in Ypr097w (Alphafold2 prediction), either looking away from the largest opening (Ai/ii) or at it (Aiii). Mutations were made either in 19 residues in the N-terminal half (F42, L79, V82, I87, F90, L92, F103, W104, F111, F112, F115, F120, L139, V142, L145, L146, W250, F255, F274 in panel Ai) or 26 residues in the C-terminal half (F553, L567, V569, I571, F587, W590, Y594, L619, F648, F663, W807, I819, I823, F831, F843, F846, F885, F888, F901, F904, W907, I908, I911, F1005, L1007, F1024 in panels Aii/iii), either substituting all for alanine (19 A/S) or substituting all for serine (26 A/S). Surface and mutated residues are colored as in the key. All mutated side-chains are predicted to be situated in the portion of the cavity away from the opening, except F1024 in Aiii. Total residues mutated are 22Fs, 5Ws, 1Y, 8Ls, 6Is and 3Vs. (B) Western blot analysis of Ypr097w-GFP cavity mutant levels in haploid and diploid cells. Pgk1 serves as a loading control. (C) Confocal images of cells expressing endogenous Ypr097w-GFP either WT (Ci) or the indicated mutants (Cii/iii). Scale bar, 5 μm. (D) Cells with the indicated gene insertions, or no insert as a positive control (with empty URA3 plasmid), were diluted and spotted for 48 hr, either on standard minimal medium or with Amphotericin B at 100 ng/ml, a concentration that barely inhibits wild-type (WT) cells.
-
Figure 4—figure supplement 2—source data 1
Original and labeled raw unedited blots for B.
- https://cdn.elifesciences.org/articles/74602/elife-74602-fig4-figsupp2-data1-v1.zip
Figure 5 with 3 supplements
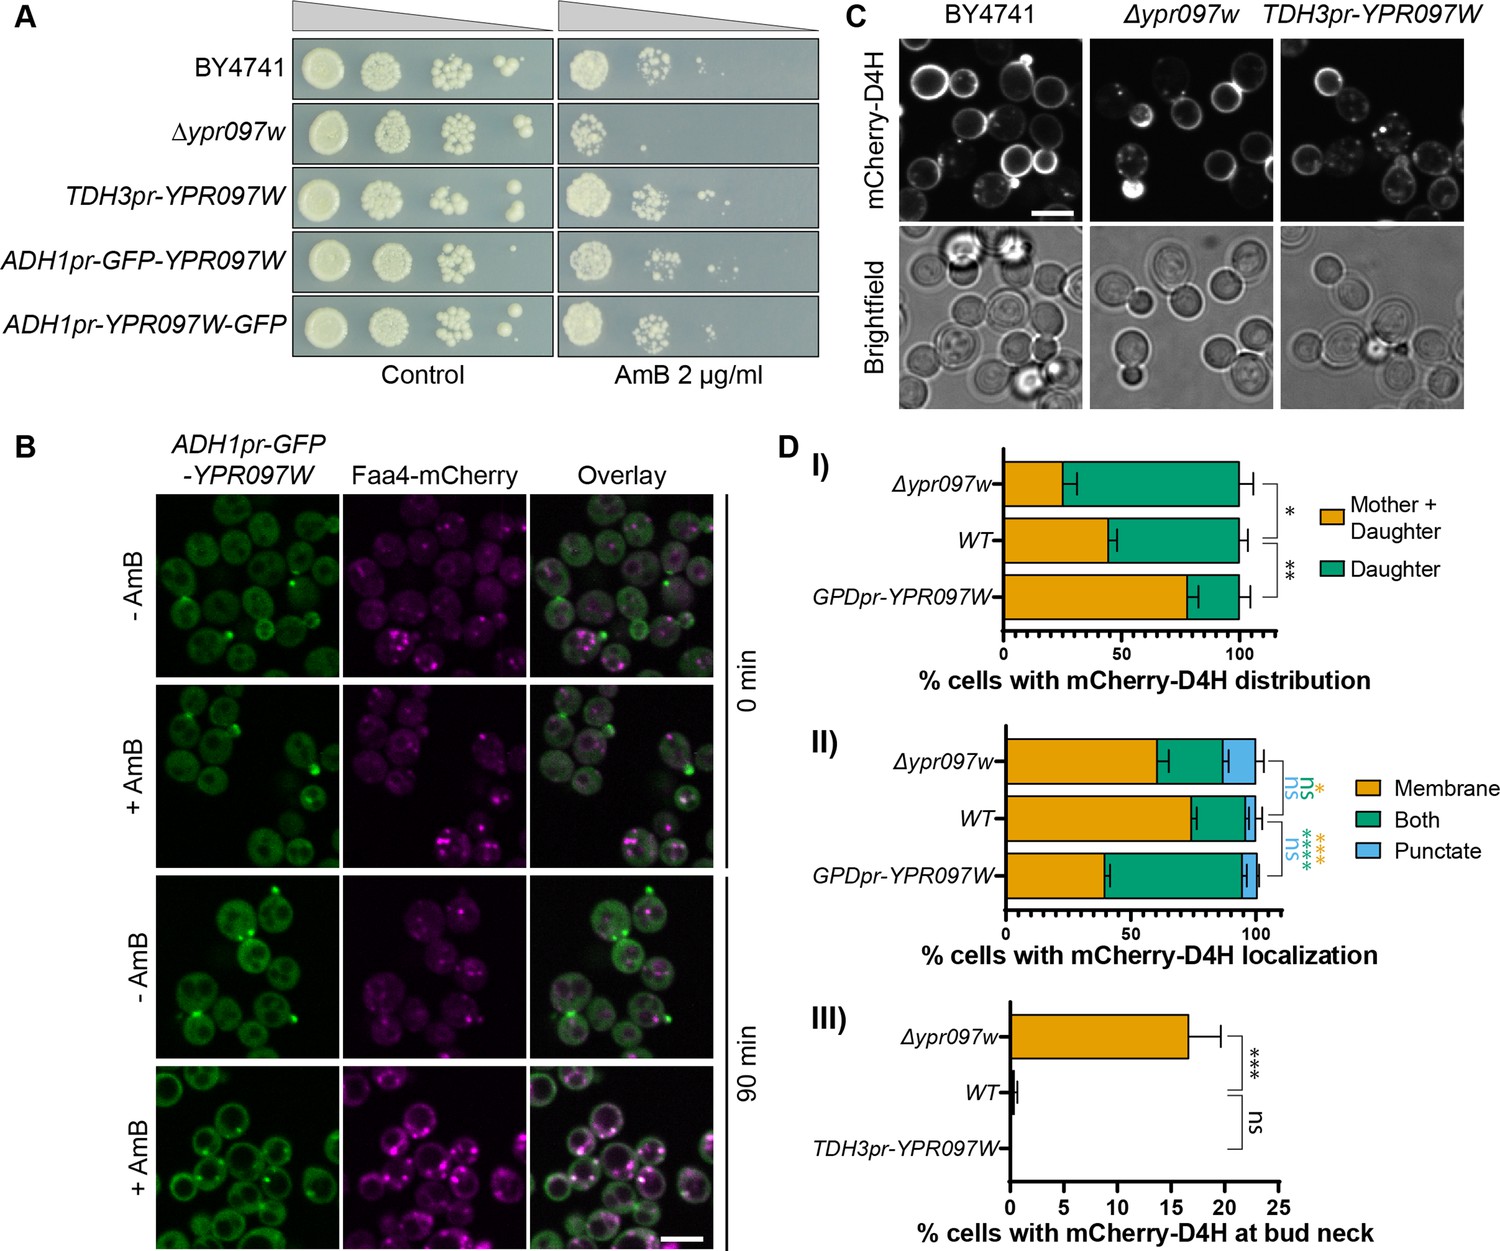
Ypr097w affects the cellular distribution of ergosterol.
(A) Serial dilution growth assay in the presence/absence of Amphotericin B (AmB) (2 µg/ml), after 3 days of growth. (B) Localization of ADH1pr-GFP-YPR097W in control (DMSO) and AmB treated cells (2 µg/ml), at 0 min and after 90 min continuous drug exposure. Scale bar, 5 µm; Images obtained using Micro 2. (C) Cellular localization of the free ergosterol marker mCherry-D4H in WT, Δypr097w and overexpression TDH3pr-YPR097W cells. Cells were categorized based on marker distribution (mother + daughter cells or daughter) and localization (membrane, puncta or both), as well as accumulation at the bud neck. Scale bar, 5 µm; Images obtained using Micro 2. (D) Quantification of three independent experiments relative to (C). Data are presented as mean ± SEM (n=3). Analysis performed using ordinary one-way ANOVA with Dunnett’s multiple comparison test. ns. not significant, * p≤0.05, ** p≤0.01, *** p≤0.001, **** p≤0.0001.
-
Figure 5—source data 1
Numerical values used for graphs D (I), (II), and (III).
- https://cdn.elifesciences.org/articles/74602/elife-74602-fig5-data1-v1.xlsx
Figure 5—figure supplement 1
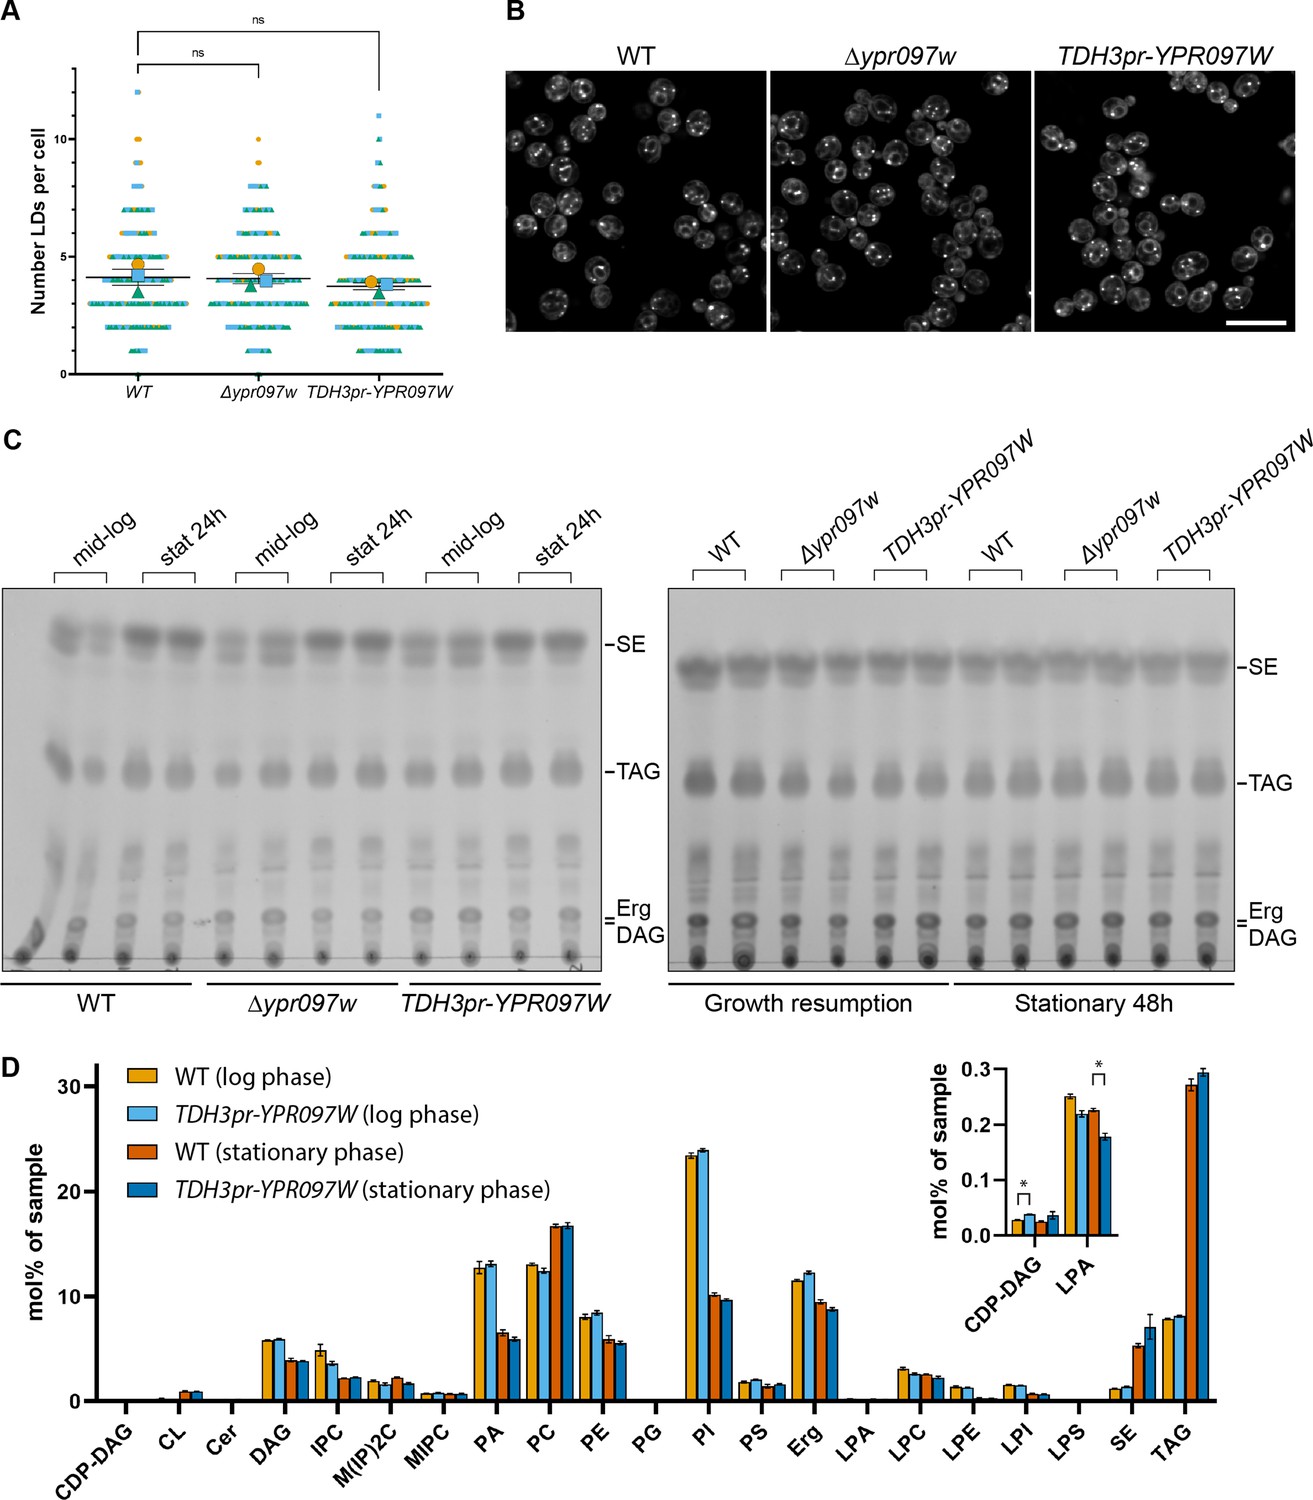
Ypr097w does not dramatically impact the total level of cellular lipids.
(A) Quantification of LD number in WT, Δypr097w and overexpression TDH3pr-YPR097W cells, using the LD marker BODIPY. SuperPlot representation of individual cells (small symbols) and respective means (large symbols), from three independent experiments (different colors). Data are presented as mean ± SEM (n=3). One-way ANOVA with Dunnett’s multiple comparison test shows no significant differences between strains. ns. not significant. (B) LD morphology and distribution in WT, Δypr097w and overexpression TDH3pr-YPR097W cells, using the LD marker BODIPY. Scale bar, 10 µm; Images obtained using Micro 2. (C) Thin layer chromatography of WT, Δypr097w and overexpression TDH3pr-YPR097W cells in mid-logarithmic growth, stationary 24 hr (left membrane), stationary 48 hr and growth resumption (right membrane). SE, sterol esters; TAG, triacylglycerol; Erg, ergosterol; DAG, diacylglycerol. (D) Lipidomics analysis of WT and overexpression TDH3pr-YPR097W cells in mid-logarithmic growth and stationary (48 hr). Data are presented as mean ± SEM (n=3), and statistical analysis was performed using multiple unpaired t-tests, assuming Gaussian distribution. Data was corrected for False Discovery Rate using the two-stage step-up method of Benjamini, Krieger and Yekutieli (Q=5%). Small significant differences were detected in the levels of CDP-DAG during mid-logarithmic phase and Lyso Phosphatidic Acid (LPA) in stationary cells (insert), but these should be considered with caution, as the overall levels of these lipid classes in the samples were very low (up to 32 pmol per sample) (Supplementary file 4). Acronyms as in (C) and CDP-DAG, cytidine diphosphate diacylglycerol; CL, cardiolipin; Cer, ceramide; IPC, inositolphosphorylceramide, M(IP)2 C, mannosyl-di- (inositolphosphoryl) ceramide; MIPC, mannosyl-inositolphosphorylceramide; PA, phosphatidic acid; PC, phosphatidylcholine; PE, phosphatidylethanolamine; PG, phosphatidylglycerol; PI, phosphatidylinositol; PS, phosphatidylserine; LPA, lyso-phosphatidate; LPC, lyso-phosphatidylcholine; LPE, lyso-phosphatidylethanolamine; LPI, lyso-phosphatidylinositol; LPS, lyso-phosphatidylserine.
-
Figure 5—figure supplement 1—source data 1
Numerical data used for graph A.
- https://cdn.elifesciences.org/articles/74602/elife-74602-fig5-figsupp1-data1-v1.xlsx
-
Figure 5—figure supplement 1—source data 2
Original and labeled raw unedited blots for C.
- https://cdn.elifesciences.org/articles/74602/elife-74602-fig5-figsupp1-data2-v1.zip
Figure 5—figure supplement 2
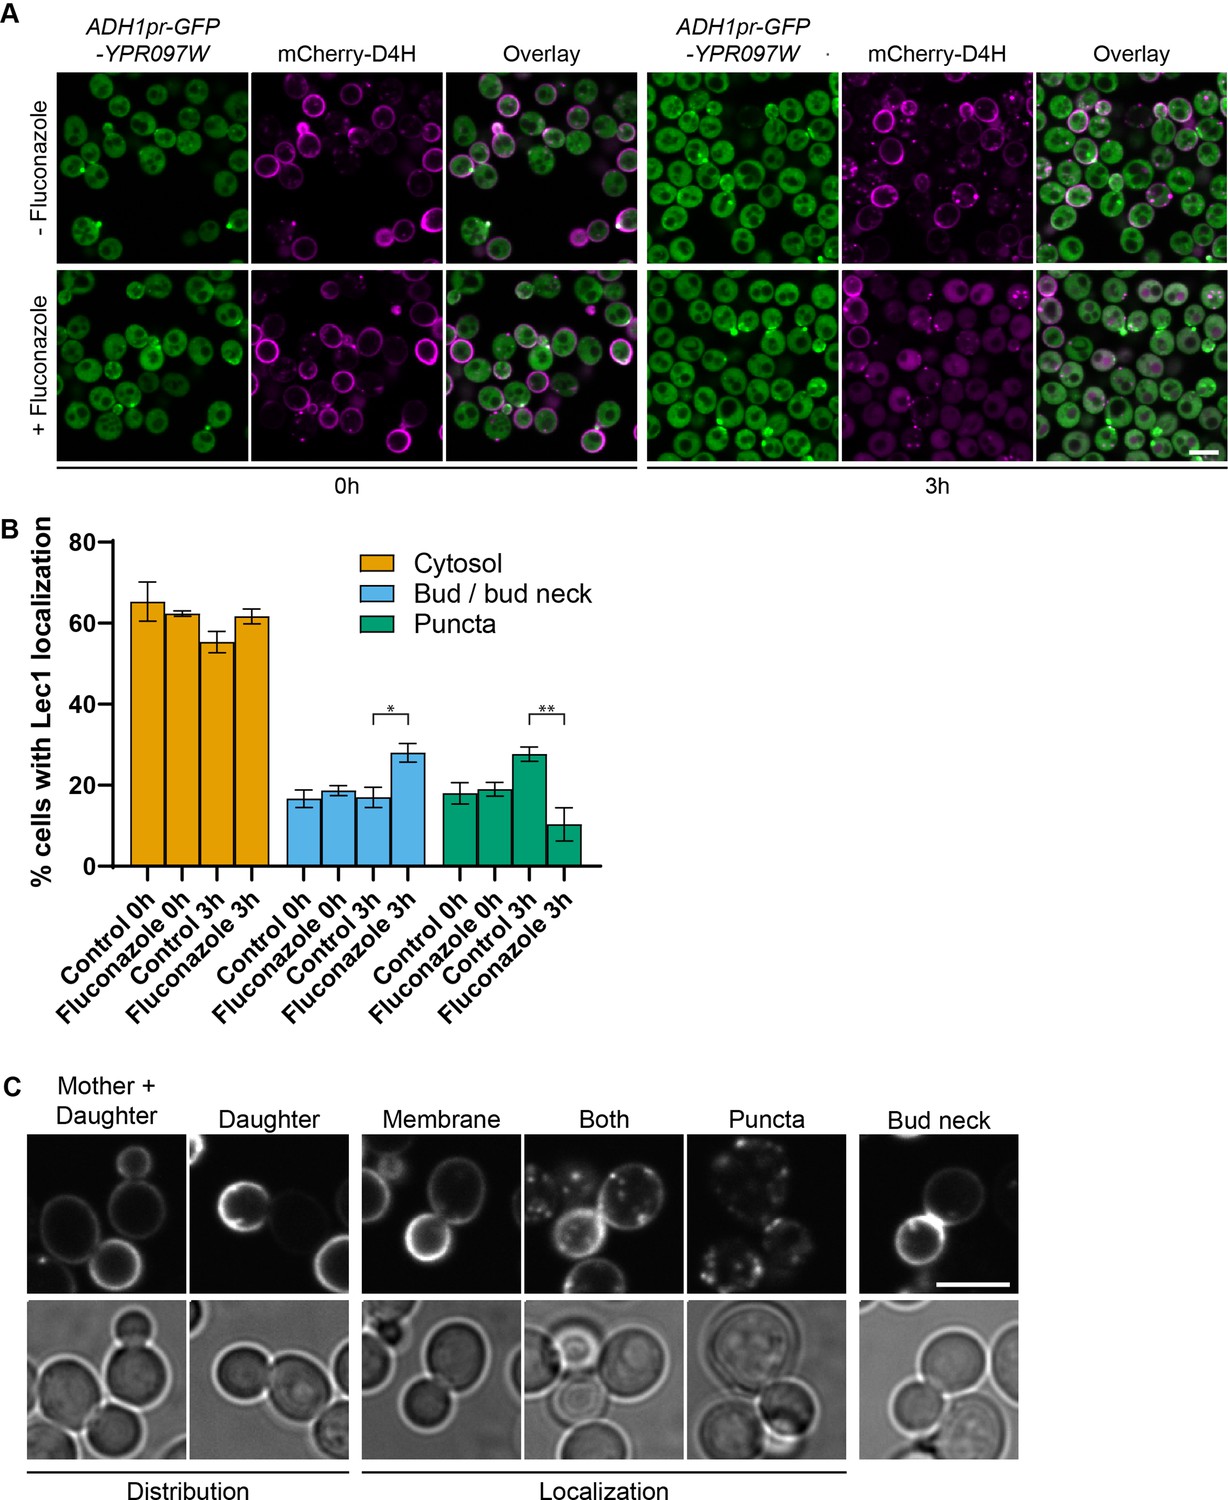
Ypr097w localization is affected by changes in free ergosterol.
(A) Localization of ADH1pr-GFP-YPR097W and mCherry-D4H in control and Fluconazole treated cells (40 µg/ml), at 0 min and after 3 hr continuous drug exposure. Scale bar, 5 µm; Images obtained using Micro 2. (B) Quantification of three independent experiments relative to (A). Data are presented as mean ± SEM (n=3). Analysis performed using ordinary one-way ANOVA with Tukey’s multiple comparison test. * p≤0.05, ** p≤0.01. (C) Examples of phenotypes used to quantify mCherry-D4H cellular distribution and localization. Scale bar, 5 μm; Images obtained using Micro 2.
-
Figure 5—figure supplement 2—source data 1
Numerical data used for graph B.
- https://cdn.elifesciences.org/articles/74602/elife-74602-fig5-figsupp2-data1-v1.xlsx
Figure 5—figure supplement 3

Changes in phosphatidylserine (PS) affect free ergosterol and Ypr097w distribution.
Yet, Ypr097w function does not regulate the distribution or levels of PS. (A) Localization of ADH1pr-GFP-YPR097W and mCherry-D4H in WT and Δosh6Δosh7 cells. Scale bar, 5 µm; Images obtained using Micro 2. (B) PS marker (GFP-Lact-C2) localization in WT, Δypr097w and TDH3pr-YPR097W cells. Scale bar, 5 µm; Images obtained using Micro 4. (C) Quantification of the relative GFP-Lact-C2 fluorescence intensity at the plasma membrane. Data are presented as mean ± SD (n=4, 100 cells per strain). Analysis performed using ordinary one-way ANOVA with Tukey’s multiple comparison test. ns, not significant. (D–G) Lipidomic analysis of PS (D) total levels, (E) species, (F) acyl chain saturation and (G) acyl chain length in WT and TDH3pr-YPR097W cells in mid-logarithmic growth. Data are presented as mean ± SD (n=3). Statistical analysis was performed using single or multiple unpaired t-tests, assuming Gaussian distribution. Data was corrected for False Discovery Rate using the two-stage step-up method of Benjamini, Krieger and Yekutieli (Q=5%). ns, not significant. (E–G) all statistical comparisons were not significant.
Author response image 1
Mutagenesis analysis of Ypr097w hydrophobic cavity.
(A) Internal surface of cavity in Ypr097w (Alphafold prediction), either looking away from the largest opening (Ai/ii) or at it (Aiii). Mutations were made either in 19 residues in the N-terminal half (F42, L79, V82, I87, F90, L92, F103, W104, F111, F112, F115, F120, L139, V142, L145, L146, W250, F255, F274 in panel Ai) or 26 residues in the C-terminal half (F553, L567, V569, I571, F587, W590, Y594, L619, F648, F663, W807, I819, I823, F831, F843, F846, F885, F888, F901, F904, W907, I908, I911, F1005, L1007, F1024 in panels Aii/iii), either substituting all for alanine (19A/S) or substituting all for serine (26A/S). Surface and mutated residues are colored as in the key. All mutated side-chains are predicted to be situated in the portion of the cavity away from the opening, except F1024 in Aiii. Total residues mutated are 22Fs, 5Ws, 1Y, 8Ls, 6Is and 3Vs. (B) Western blot analysis of Ypr097w-GFP cavity mutant levels in haploid and diploid cells. Pgk1 serves as a loading control. (C) Confocal images of cells expressing endogenous Ypr097w-GFP either WT (Ci) or the indicated mutants (Cii/iii). (D) Cells with the indicated gene insertions, or no insert as a positive control (with empty URA3 plasmid), were diluted and spotted for 48 hours, either on standard minimal medium or with Amphotericin B at 100 ng/ml, a concentration that barely inhibits wild-type cells.
Tables
Author response table 1
| Contact site | ORF | Gene | Phenotype – Effect | LD phenotype vs WT |
|---|---|---|---|---|
| LiDER | YDR495C | Vps3 | M/B | + |
| YBR110W | Alg1 | M/B | + | |
| YGR157W | Cho2 | M/B | 0 | |
| YHR039C | Msc7 | M/B | + | |
| YDL072C | Yet3 | M/B | 0 | |
| YMR031C | Eis1 | M/B | 0 | |
| YMR040W | Yet2 | M/B | + | |
| YMR109W | Myo5 | M/B | 0 | |
| YDL193W | Nus1 | M/B | + | |
| YJL028W | Yjl028w | M/B | 0 | |
| YBL050W | Sec17 | M/B | + | |
| YMR264W | Cue1 | M/B | + | |
| YJL123C | Mtc1 | M/B | + | |
| YJL061W | Nup82 | M/B | 0 | |
| YLR087C | Csf1 | M/B | 0 | |
| YNL063W | Mtq1 | M/B | + | |
| YJL207C | Laa1 | M/B | + | |
| YFR024C-A | Lsb3 | M/B | 0 | |
| YLR148W | Pep3 | M/B | 0 | |
| YAR050W | Flo1 | M/B | + | |
| YPR140W | Taz1 | M/B | 0 | |
| YOR081C | Tgl5 | M/B | + | |
| YDR082W | Stn1 | M/B | + | |
| YLR408C | Bls1 | M/B | 0 | |
| YPR122W | Axl1 | M/B | 0 | |
| YOL048C | Rrt8 | M/B | 0 | |
| YNL149C | Pga2 | M/B | 0 | |
| YPR097W | Lec1 | M/B | 0 | |
| pCLIP | YCL029C | Bik1 | M/B | + |
| YDR034C | Lys14 | M/B | + | |
| YHR201C | Ppx1 | M/B | 0 | |
| YIL056W | Vhr1 | M/B | 0 | |
| YER018C | Spc25 | M/B | + | |
| YJL062W-A | Coa3 | M/B | 0 |
Additional files
-
Supplementary file 1
List of strains in the “Puncta Library” collection.
List of the subset of strains from the SWAT TEF2pr-mCherry library selected for this work based on protein localization in cells.
- https://cdn.elifesciences.org/articles/74602/elife-74602-supp1-v1.xlsx
-
Supplementary file 2
Newly suggested contact site residents and regulators.
List of hits for each of the 6 screens performed and their phenotype based on co-localization with contact site reporter and/ effect over the contact site reporter.
- https://cdn.elifesciences.org/articles/74602/elife-74602-supp2-v1.xlsx
-
Supplementary file 3
Ypr097w DHFR Proximity Interactome.
List of noise-filtered Ypr097w DHFR interactors (Z-Score >2.5). Hits with reported lipid droplet localization (data from Huh et al., 2003; Weill et al., 2018) or membership in a validated LD proteome (data from Currie et al., 2014) are colored pink, while hits with reported ER localization that are not present in the validated LD proteome are colored blue.
- https://cdn.elifesciences.org/articles/74602/elife-74602-supp3-v1.xlsx
-
Supplementary file 4
Lipidomic analysis of WT and TDH3pr-YPR097W strains.
- https://cdn.elifesciences.org/articles/74602/elife-74602-supp4-v1.xlsx
-
Supplementary file 5
S. cerevisiae strains used in this study.
- https://cdn.elifesciences.org/articles/74602/elife-74602-supp5-v1.xlsx
-
Supplementary file 6
Plasmids used in this study.
- https://cdn.elifesciences.org/articles/74602/elife-74602-supp6-v1.xlsx
-
Supplementary file 7
Primers used in this study.
- https://cdn.elifesciences.org/articles/74602/elife-74602-supp7-v1.xlsx
-
Transparent reporting form
- https://cdn.elifesciences.org/articles/74602/elife-74602-transrepform1-v1.pdf
Download links
A two-part list of links to download the article, or parts of the article, in various formats.
Downloads (link to download the article as PDF)
Open citations (links to open the citations from this article in various online reference manager services)
Cite this article (links to download the citations from this article in formats compatible with various reference manager tools)
Systematic analysis of membrane contact sites in Saccharomyces cerevisiae uncovers modulators of cellular lipid distribution
eLife 11:e74602.
https://doi.org/10.7554/eLife.74602


