Strip1 regulates retinal ganglion cell survival by suppressing Jun-mediated apoptosis to promote retinal neural circuit formation
- Developmental Neurobiology Unit, Okinawa Institute of Science and Technology Graduate University, Japan
Figures
Figure 1 with 2 supplements
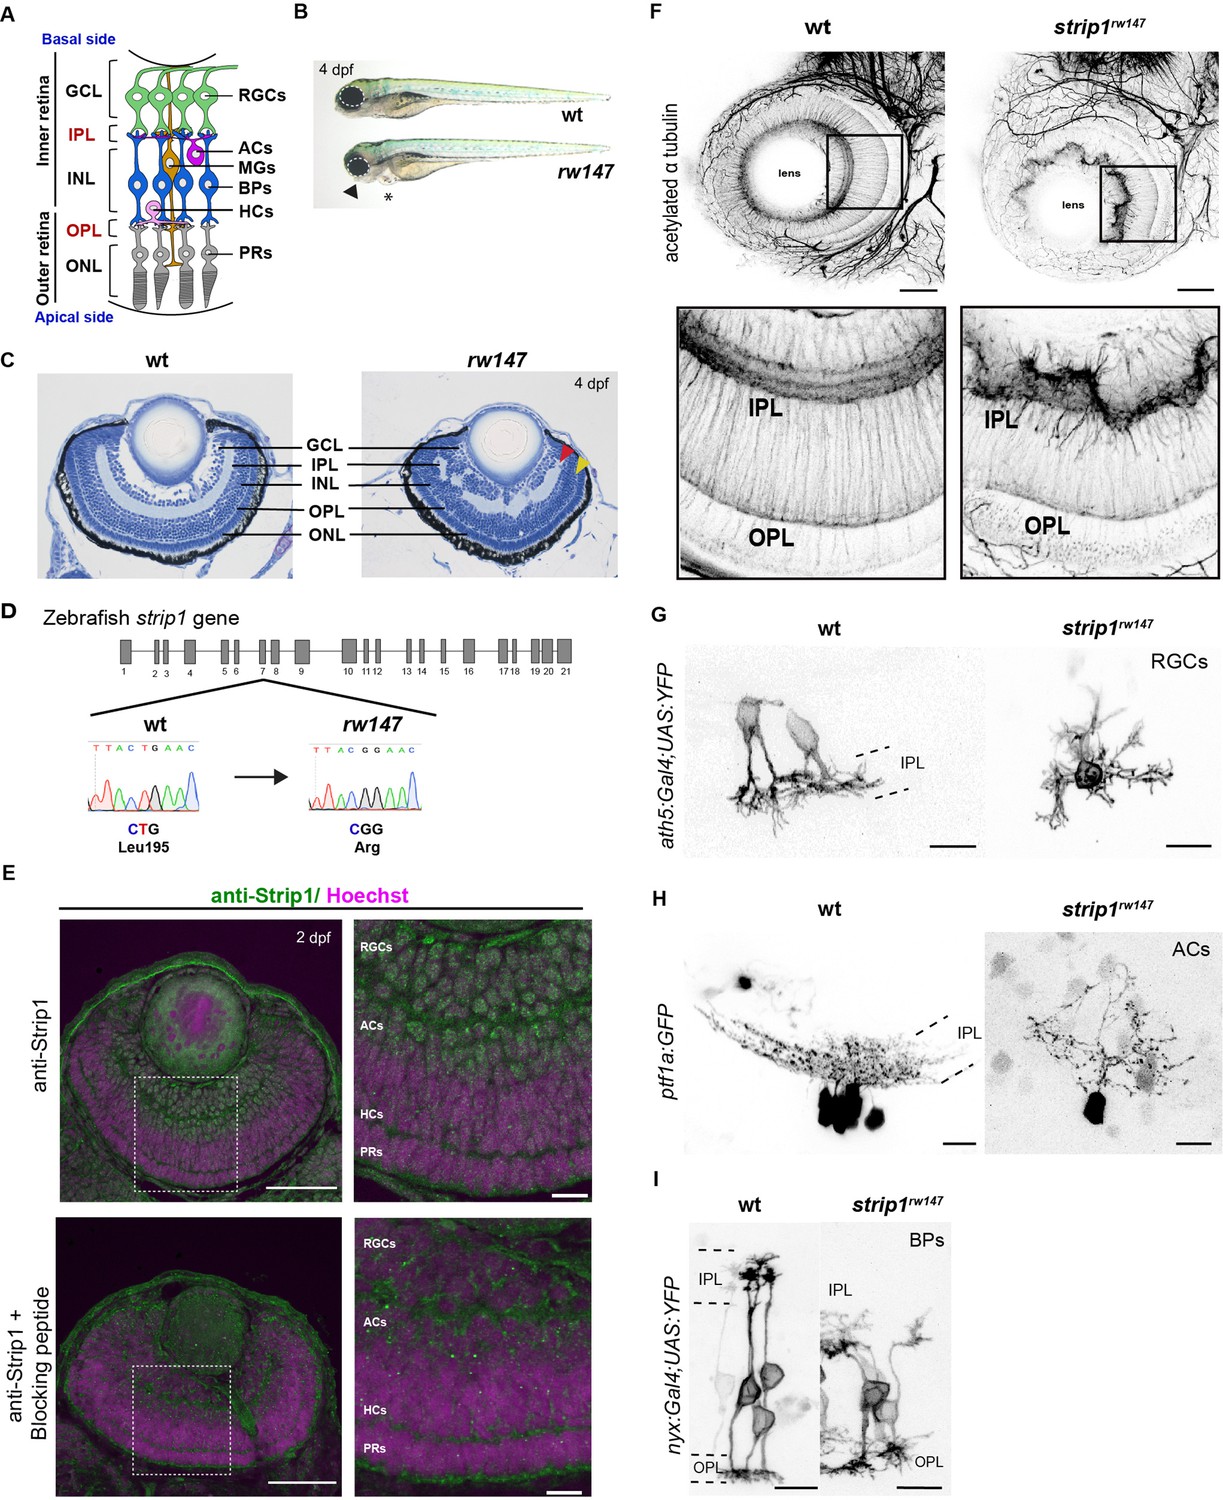
Striatin-interacting protein 1 (Strip1) is essential for inner retinal neural circuit development.
(A) Zebrafish retinal neural circuit showing retinal neurons and synaptic layers. GCL, ganglion cell layer; IPL, inner plexiform layer; INL, inner nuclear layer; OPL, outer plexiform layer; ONL, outer nuclear layer; RGCs, retinal ganglion cells; ACs, amacrine cells; BPs, bipolar cells; HCs, horizontal cells; PRs, photoreceptors; MGs, Müller glia. (B) Morphology of wild-type and rw147 embryos at 4 dpf. Dotted lines demarcate the eye. An arrowhead indicates abnormal lower jaw. An asterisk indicates heart edema. (C) Wild-type and rw147 mutant retinas at 4 dpf. Red and yellow arrowheads indicate the IPL and OPL, respectively. (D) A missense mutation occurs in strip1 gene of rw147 mutants leading to replacement of Leu195 with arginine. (E) Wild-type retinas labeled with anti-Strip1 antibody (upper panels) and anti-Strip1 plus Strip1-blocking peptide as a negative control (lower panels). Nuclei are stained with Hoechst. Scale bar, 50 μm. Right panels show higher magnification of outlined areas. Scale bar, 10 μm. (F) Whole-mount labeling of 3-dpf wild-type and strip1rw147 mutant retinas with anti-acetylated α-tubulin antibody. Bottom panels show higher magnification of outlined areas. Scale bar, 50 μm. (G) Projection images of single RGCs at 2 dpf expressing ath5:Gal4VP16; UAS:MYFP in wild-type and strip1rw147 mutants. Scale bar, 10 μm. (H) Projection images of single ACs at 3 dpf expressing ptf1a:GFP in wild-type and strip1rw147 mutants. Scale bar, 10 μm. (I) Projection images of single BPs at 3 dpf expressing nyx:Gal4VP16; UAS:MYFP in wild-type and strip1rw147 mutants. Scale bar, 10 μm.
Figure 1—figure supplement 1
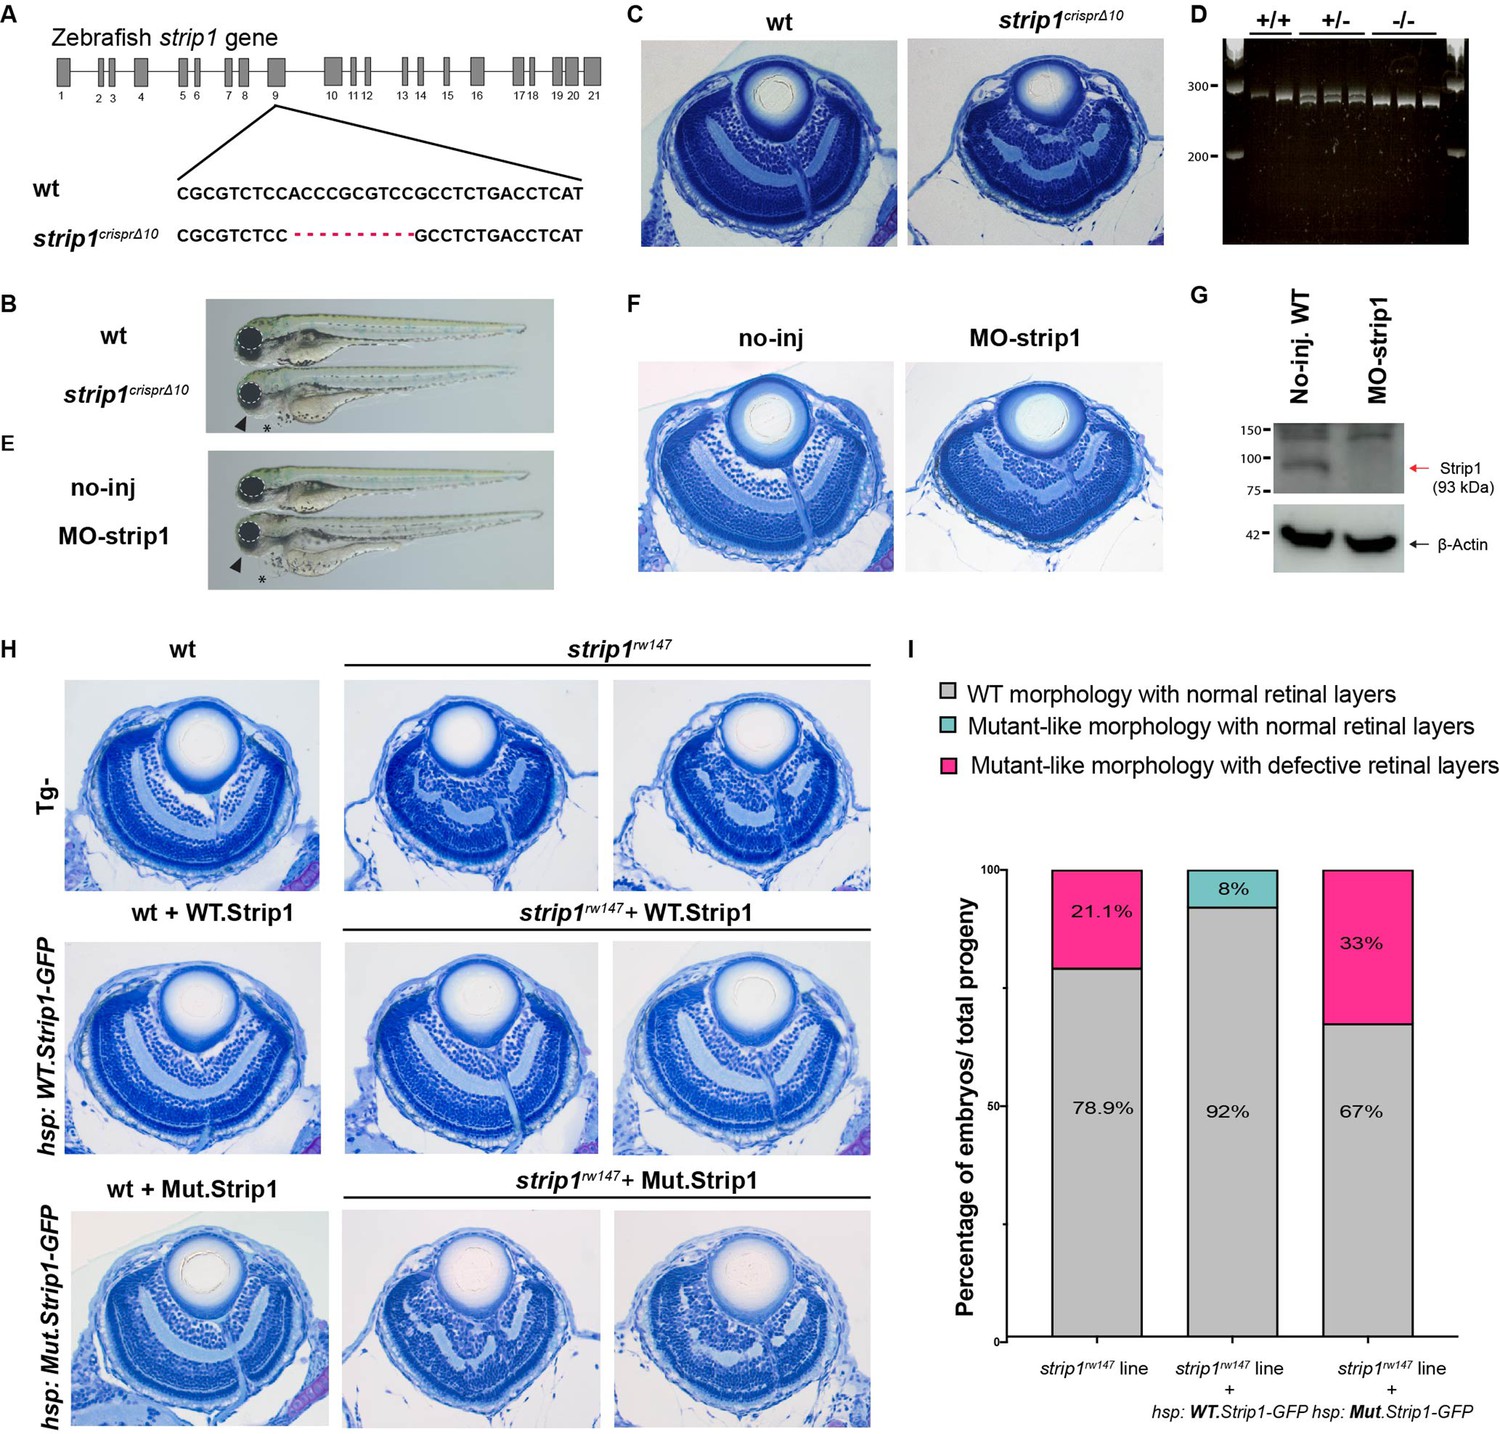
Retinal lamination defects in strip1rw147 mutants are phenocopied by either CRISPR- or MO-mediated knockdown of strip1 and rescued by overexpression of Strip1.
(A) CRISPR-mediated, targeted mutagenesis of zebrafish strip1 gene. A 10-bp deletion was introduced into exon 9, leading to a premature stop codon in strip1 gene. (B) Morphology of wild-type and strip1crisprΔ10 embryos at 4 dpf. Dotted lines demarcate the eye outline. The arrowhead indicates an abnormal lower jaw. An asterisk indicates heart edema. (C) Plastic sections of wild-type and strip1crisprΔ10 mutant retinas stained with toluidine blue at 4 dpf. (D) A polyacrylamide gel image showing PCR amplicons using primers that flank the 10-base deletion of strip1crisprΔ10. Wild-type and strip1crisprΔ10 mutant bands are expected to appear at 279 and 269 bps, respectively. Different band sizes were consistently obtained from progeny produced by pairwise crosses of strip1crisprΔ10 heterozygous mutant fish. (E) Morphology of non-injected and MO-strip1-injected wild-type embryos at 4 dpf. Dotted lines outline the eye. An arrowhead indicates the abnormal lower jaw. An asterisk indicates heart edema. (F) Retinal plastic sections of non-injected and MO-strip1-injected wild-type embryos at 4 dpf. (G) Western blotting of 2-dpf head lysates from non-injected and MO-strip1-injected wild-type embryos. Red and black arrows show expected band sizes for zebrafish Strip1 (93 kDa) and the loading control β-actin (42 kDa), respectively. (H) Plastic sections of 4 dpf wild-type and strip1rw147 mutant retinas without transgene (top panels), and with the transgenes Tg[hsp:WT.Strip1-GFP] (middle panels) or Tg[hsp:Mut.Strip1-GFP] (bottom panels) post heat shock treatment. Overexpression of Green Fluorescent Protein (GFP)-tagged wild-type Strip1 rescues retinal defects in strip1rw147 mutants, while the GFP-tagged mutant form fails to rescue. (I) A staggered bar graph, which represents the percentage of strip1rw147 mutants with a defective retina vs. mutants with a rescued retina in strip1rw147 mutants without transgenes, and with Tg[hsp:WT.Strip1-GFP] or Tg [hsp:Mut.Strip1-GFP].
-
Figure 1—figure supplement 1—source data 1
Data for Figure 1—figure supplement 1D.
- https://cdn.elifesciences.org/articles/74650/elife-74650-fig1-figsupp1-data1-v1.zip
-
Figure 1—figure supplement 1—source data 2
Data for Figure 1—figure supplement 1G.
- https://cdn.elifesciences.org/articles/74650/elife-74650-fig1-figsupp1-data2-v1.zip
-
Figure 1—figure supplement 1—source data 3
Data for Figure 1—figure supplement 1I.
- https://cdn.elifesciences.org/articles/74650/elife-74650-fig1-figsupp1-data3-v1.xlsx
Figure 1—figure supplement 2
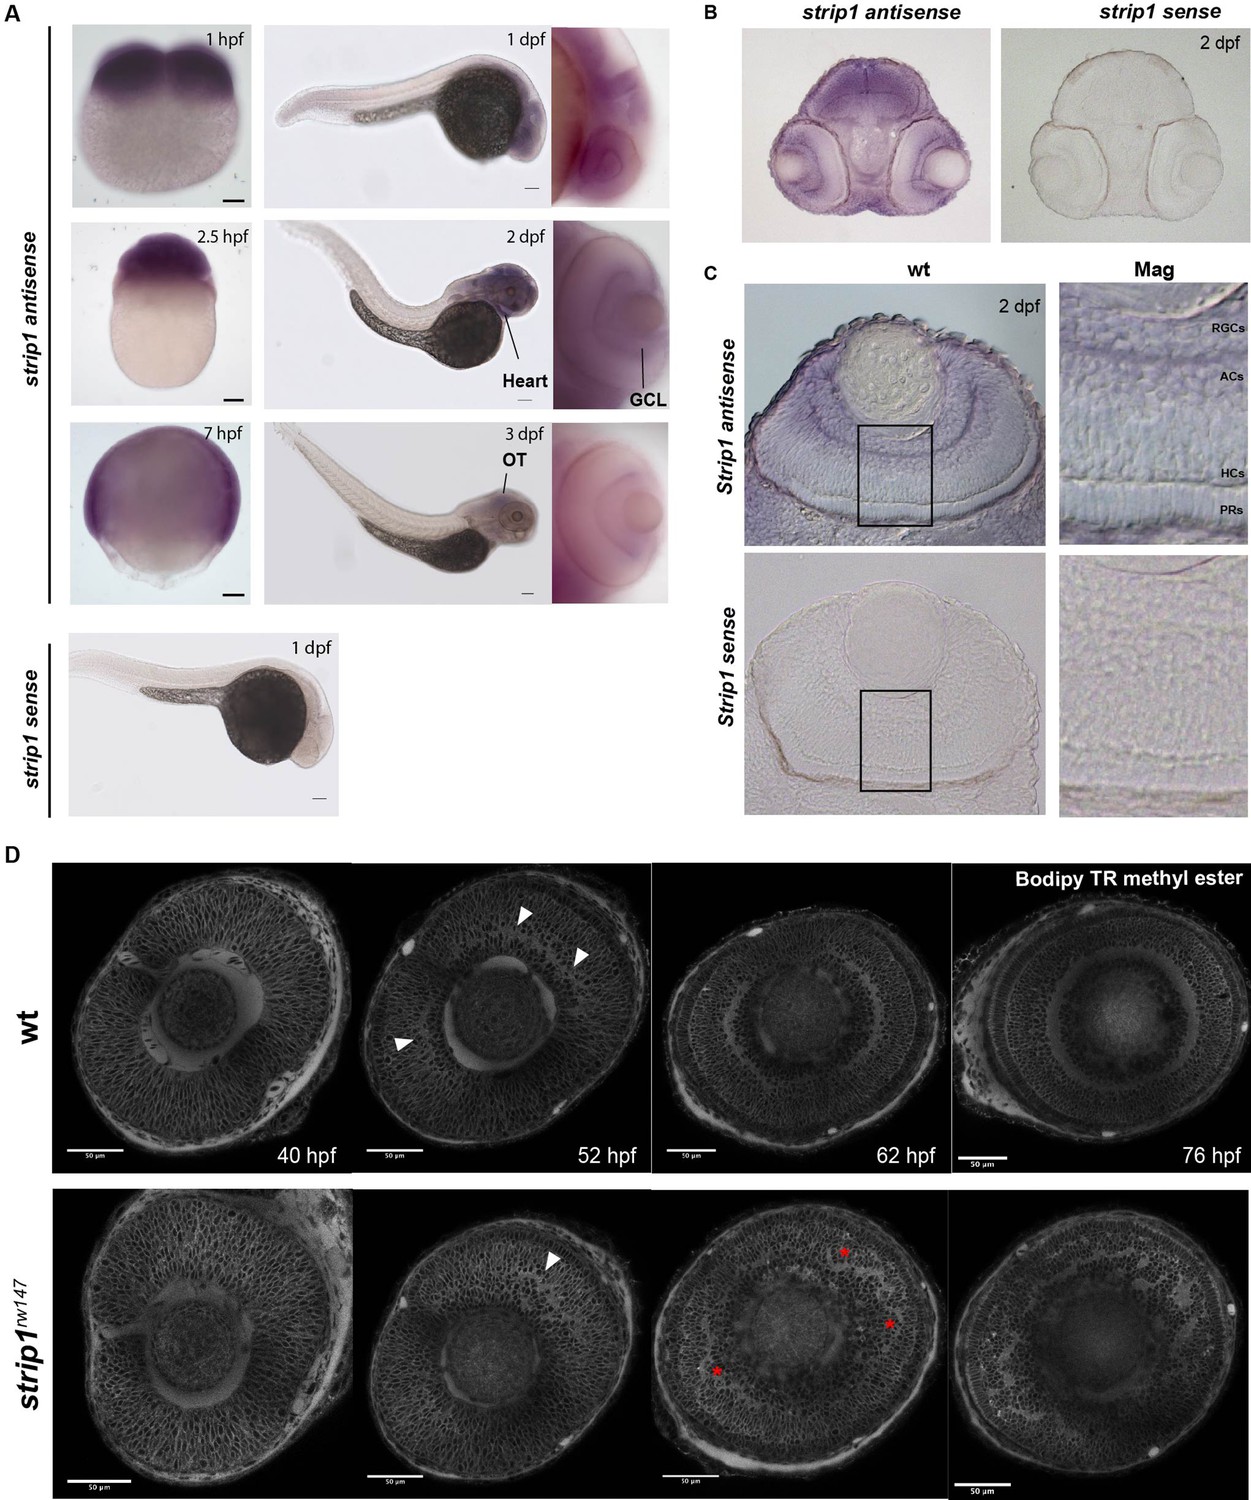
strip1 mRNA is expressed in developing retinas and is required for inner plexiform layer (IPL) formation.
(A) Expression patterns of strip1 mRNA during embryonic development. In situ hybridization using a strip1 antisense probe is shown at different developmental stages: 4 cell, blastula, 75% epiboly, 1, 2, and 3 dpf. In situ hybridization using the sense probe at 1 dpf is shown as a negative control. strip1 mRNA is ubiquitously expressed until gastrula stage. At 1–2 dpf, expression becomes restricted in the heart, optic tectum, and eyes. Ventral view of 2-dpf retina shows a stronger signal in GCL (left panels). OT, optic tectum; GCL, ganglion cell layer. Scale bar, 100 μm.(B) Frontal cryosections of 2-dpf heads following in situ hybridization show that strip1 mRNA is predominantly expressed in the inner retina and the optic tectum. (C) Retinal cryosections show higher expression in RGCs and ACs. Right panels show higher magnification of outlined areas. RGCs, retinal ganglion cells; ACs, amacrine cells; HCs, horizontal cells; PRs, photoreceptors. (D) Live confocal snapshots of the same wild-type and strip1rw147 mutant retinas at different developmental stages; 40, 52, 62, and 76 hpf stained with Bodipy TR. A primitive IPL is first observed in wild-type retinas as early as 52 hpf. However, it is not as prominent in strip1rw147 mutant retinas. By 62 hpf, strip1rw147 mutants display severe defects in IPL formation. Arrowheads indicate rudimentary IPL. Asterisks show IPL defects in strip1rw147 mutants. Scale bar, 50 μm.
Figure 2 with 2 supplements
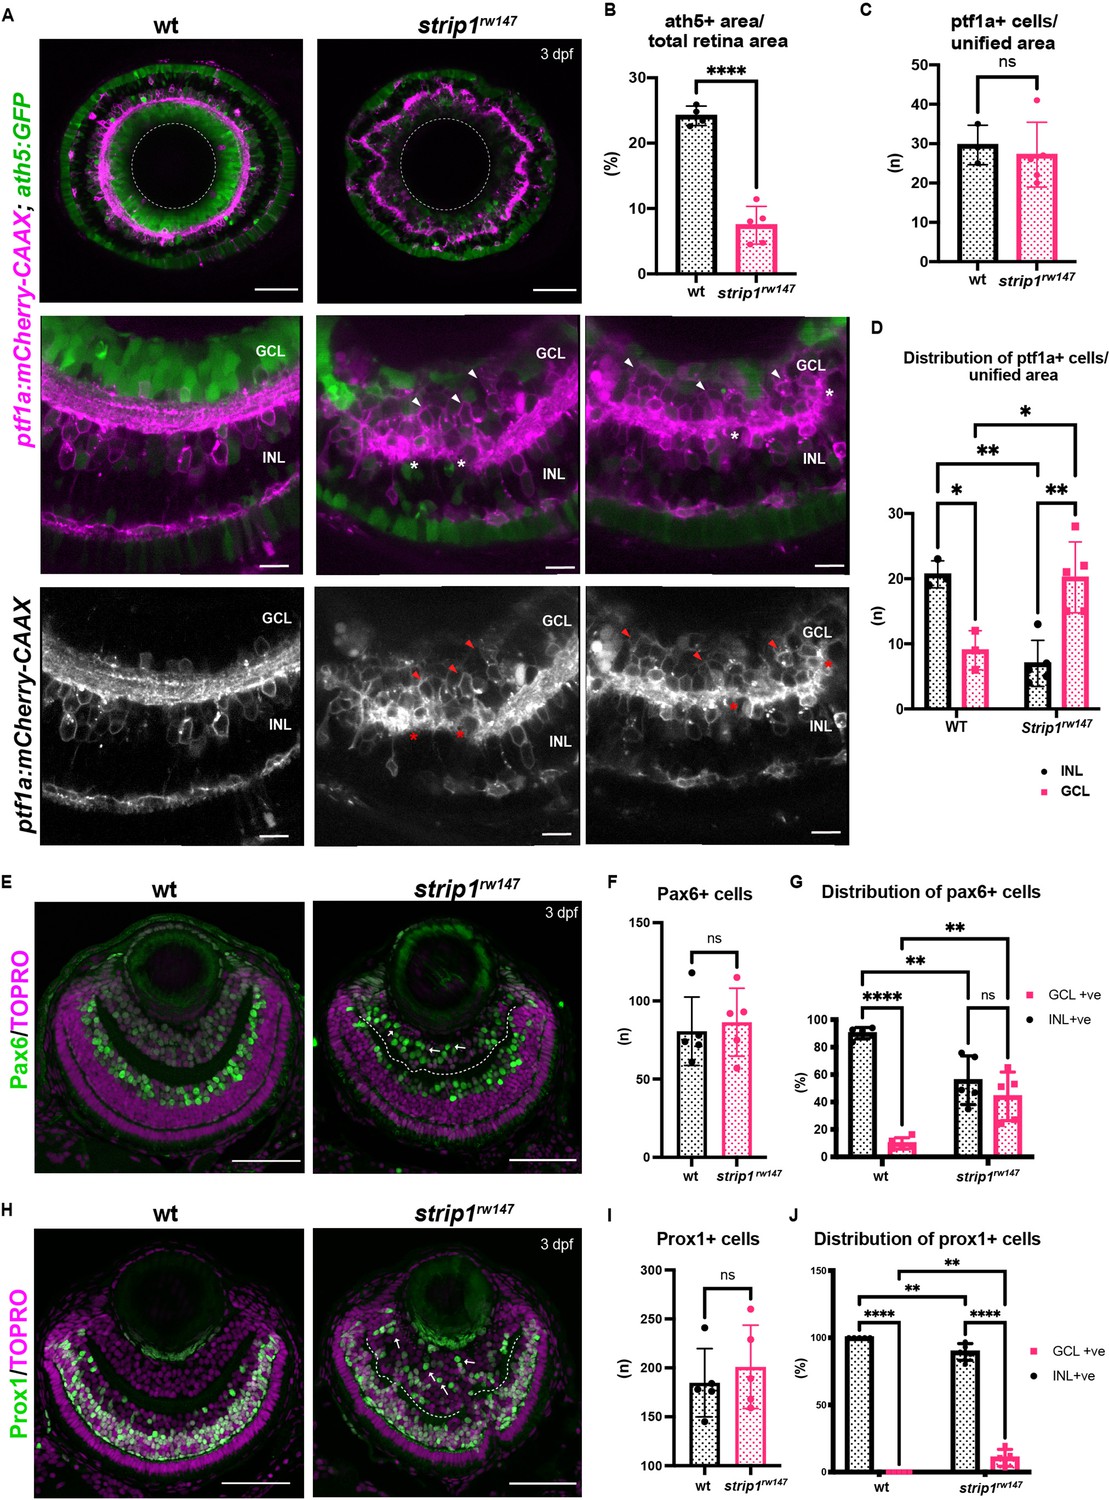
Retinal ganglion cells (RGCs) are reduced and INL cells infiltrate the GCL in strip1 mutants.
(A) Confocal sections of wild-type and strip1rw147 mutant retinas combined with the transgenic line Tg[ath5:GFP; ptf1a:mCherry-CAAX] to label RGCs and amacrine cells (ACs). Middle panels represent higher magnification. Lower panels show the magenta channel. Arrowheads indicate abnormal positioning of ptf1a+ ACs in the GCL. Asterisks show AC dendritic patterning defects. INL, inner nuclear layer; GCL, retinal ganglion cell layer. Scale bars, 50 μm (upper panels) and 10 μm (middle and lower panels). (B) Percentage of ath5+ area relative to total retinal area. Student’s t-test with Welch’s correction, n ≥ 4. (C) AC numbers per unified retinal area (8500 μm2). Student’s t-test with Welch’s correction, n ≥ 3. (D) Distribution of ACs (GCL or INL) per unified retinal area (8500 μm2). Two-way analysis of variance (ANOVA) with the Tukey multiple comparison test, n ≥ 3. (E) Wild-type and strip1rw147 mutant retinas at 3 dpf labeled with anti-Pax6 antibody which strongly labels ACs. Arrows indicate strong Pax6+ cells that infiltrate the GCL. Nuclei are stained with TOPRO3. Scale bar, 50 μm. (F) The number of strong Pax6+ cells per retina. Student’s t-test with Welch’s correction, n = 5. (G) Percentage of strong Pax6+ cells (GCL+ or INL+) to the total number of strong Pax6+ cells. Two-way ANOVA with the Tukey multiple comparison test, n = 5. (H) Wild-type and strip1rw147 mutant retinas at 3 dpf labeled with anti-Prox1 antibody. Arrows indicate Prox1+ cells that infiltrate the GCL. Nuclei are stained with TOPRO3. Scale bar, 50 μm. (I) The number of Prox1+ cells per retina. Student’s t-test with Welch’s correction, n = 5. (J) Percentage of Prox1+ cells (GCL+ or INL+) to the total number of Prox1+ cells. Two-way ANOVA with the Tukey multiple comparison test, n = 5. For all graphs, data are represented as means ± standard deviation (SD). ns, not significant, *p < 0.05, **p < 0.01, and ****p < 0.0001.
-
Figure 2—source data 1
Data for Figure 2BCDFGIJ.
- https://cdn.elifesciences.org/articles/74650/elife-74650-fig2-data1-v1.xlsx
Figure 2—figure supplement 1
Amacrine cells (ACs) are abnormally positioned at the basal side of the inner plexiform layer (IPL) in strip1 mutants and ath5 morphants.
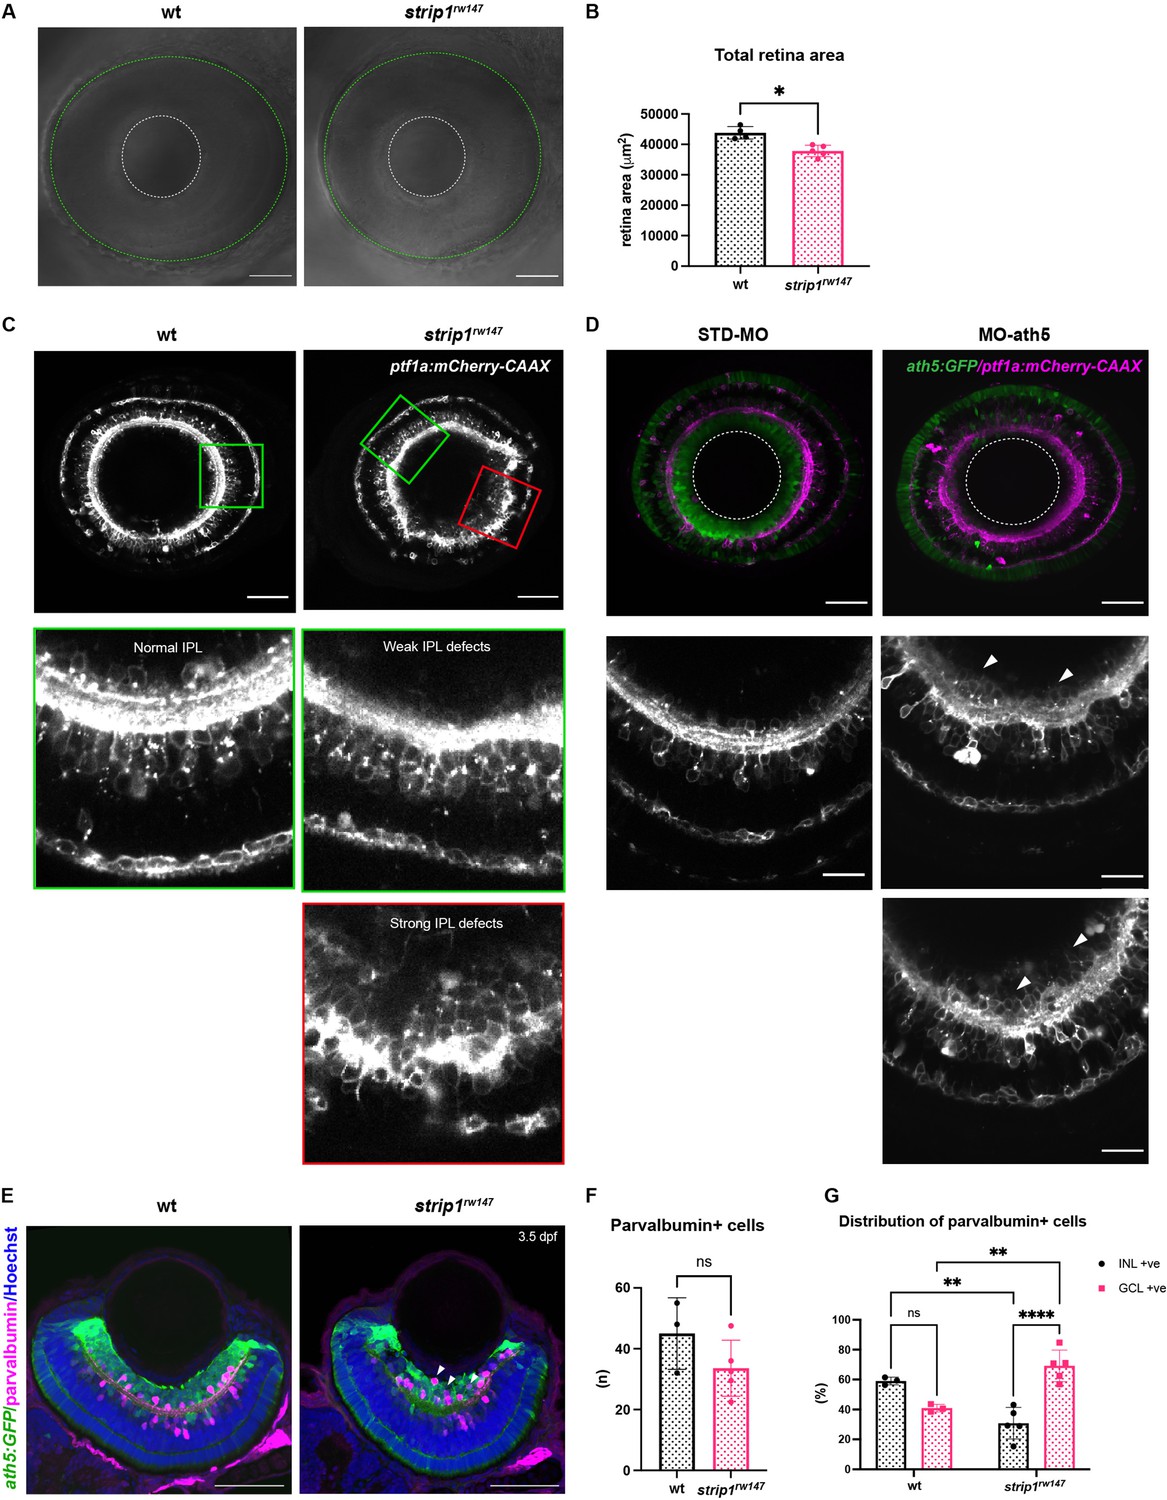
(A) Differential interference contrast images showing lateral view of wild-type and strip1rw147 mutant retinas. White dashed lines depict lens outline. Green dashed lines depict eye outline. Retina area is the area calculated between them. Scale bar, 50 μm. (B) Quantification of total retina area in wild-type and strip1rw147 mutants. Retina area is slightly but significantly reduced in mutants, compared to wild-type siblings. Mann–Whitney U-test, n ≥ 4. (C) Live confocal images of wild-type and strip1rw147 mutant retinas at 3 dpf combined with the transgenic line Tg[ptf1a:mCherry-CAAX], which labels ACs. Middle and lower panels show higher magnification of outlined areas. Abnormal positioning of ACs in the ganglion cell layer (GCL) is more prominent in areas of strong IPL defects than in areas of weak lamination defects. Scale bar, 50 μm. (D) Live confocal images of retinas of STD-MO and MO-ath5-injected wild-type embryos combined with the transgenic line Tg[ath5:GFP; ptf1a:mCherry-CAAX], which labels RGCs and ACs. Middle and bottom panels show higher magnification images to show abnormal localization of ACs in GCL (arrowheads) and disrupted IPL. Scale bars, 50 μm (upper panels) and 20 μm (middle and lower panels). (E) Wild-type and strip1rw147 mutant retinas at 3.5 dpf labeled with anti-parvalbumin which labels subsets of ACs. Arrows indicate abnormal positioning of ACs in the GCL. Nuclei are stained with Hoechst. Scale bar, 50 μm. (F) The number of parvalbumin+ cells per retina. Student’s t test with Welch’s correction, n ≥ 3. (G) Percentage of parvalbumin+ cells (GCL+ or INL+) to the total number of parvalbumin+ cells. Two-way analysis of variance (ANOVA) with the Tukey multiple comparison test, n ≥ 3. For all graphs, data are represented as means ± standard deviation (SD). ns, not significant, *p < 0.05, **p < 0.01, and ****p < 0.0001.
-
Figure 2—figure supplement 1—source data 1
Data for Figure 2—figure supplement 1B,F,G.
- https://cdn.elifesciences.org/articles/74650/elife-74650-fig2-figsupp1-data1-v1.xlsx
Figure 2—figure supplement 2

Photoreceptors, Müller glia, and ciliary marginal zone (CMZ) are not grossly affected by strip1 mutation.
Labeling of wild-type and strip1rw147 mutant retinas at 4 dpf with zpr3 (A), zpr1 (B), anti-glutamine synthetase (GS) (C), and at 3 dpf with anti-PCNA (D) antibodies, which visualize rod photoreceptors, double-cone photoreceptors, Müller glia, and proliferative cells in the CMZ, respectively. Both rods and cones are in outer nuclear layer (ONL) and are mostly intact in strip1rw147 mutants. Müller glia genesis and retinal stem cells and progenitor cells in the CMZ appear to be unaffected in strip1rw147 mutants. Scale bar, 50 μm.
Figure 3 with 2 supplements
Strip1 cell autonomously promotes retinal ganglion cell (RGC) survival.
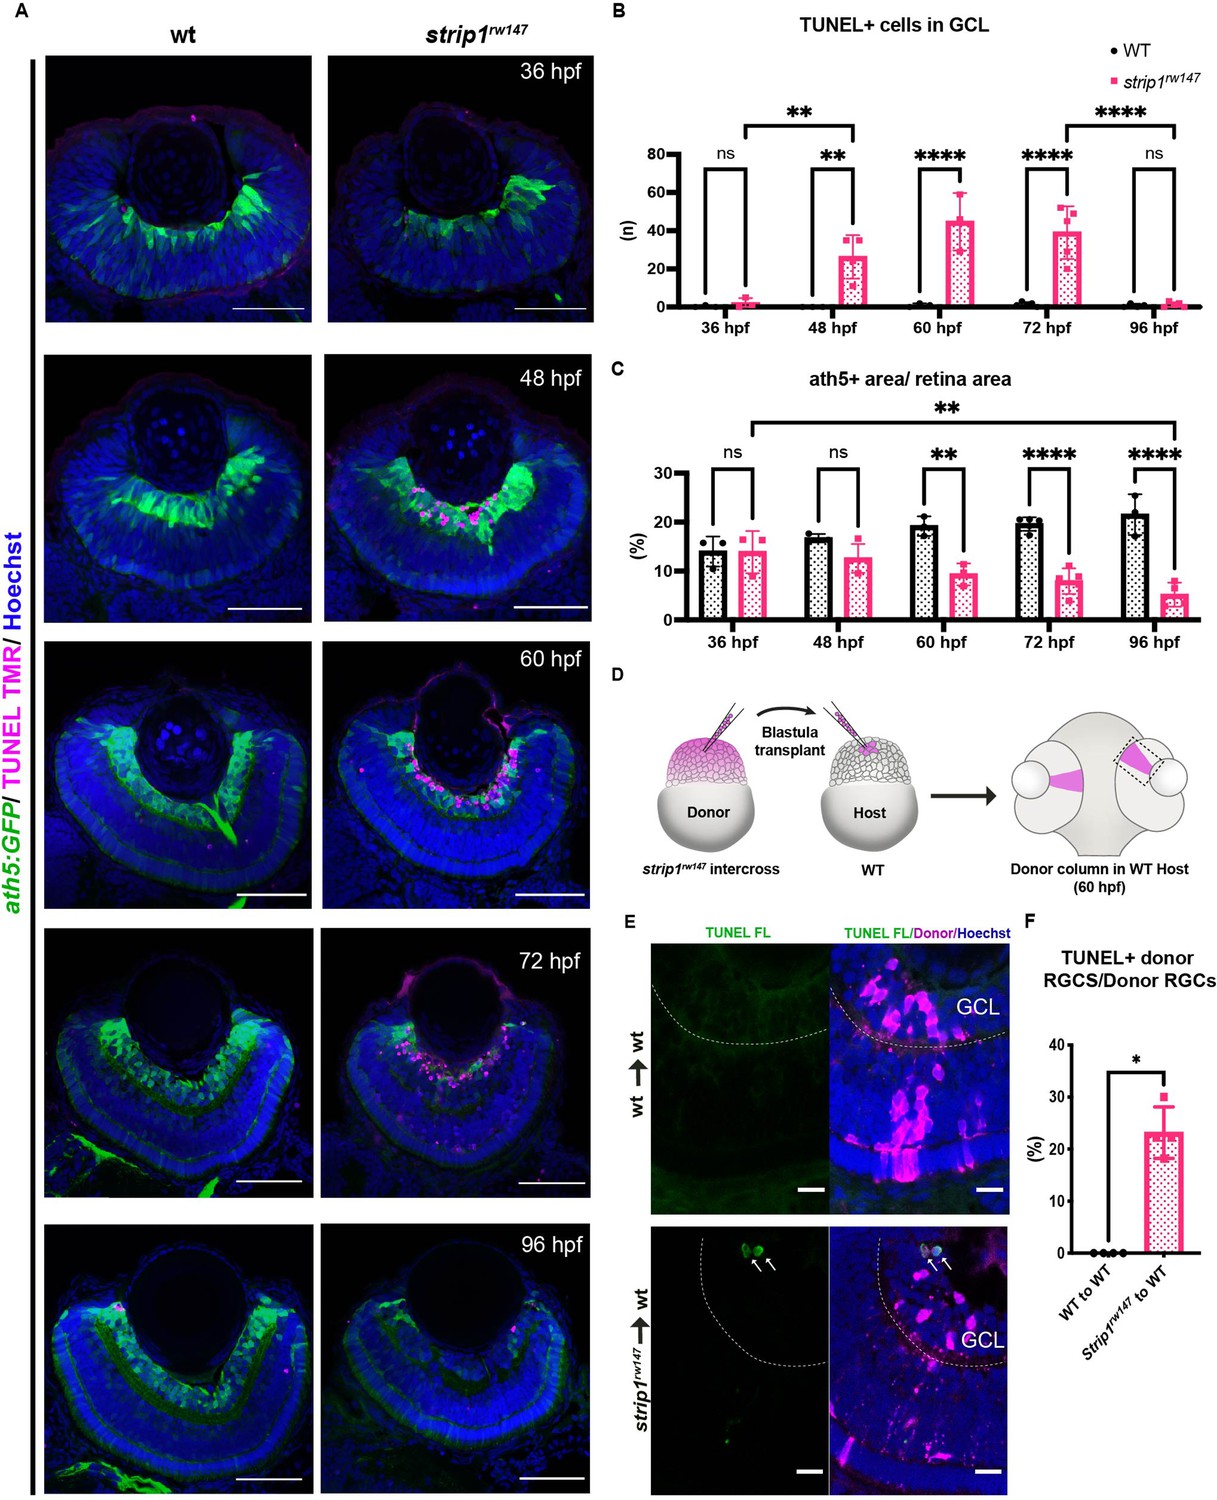
(A) Transferase dUTP nick end labeling (TUNEL) of wild-type and strip1rw147 mutant retinas carrying the transgene Tg[ath5:GFP] to label RGCs. Nuclei are stained with Hoechst. Scale bar, 50 μm. (B) The number of TUNEL+ cells in ganglion cell layer (GCL). Two-way analysis of variance (ANOVA) with the Tukey multiple comparison test, n ≥ 3. (C) Percentage of ath5+ area relative to total retinal area. Two-way ANOVA with the Tukey multiple comparison test, n ≥ 3. (D) Cell transplantation design to evaluate the cell autonomy of Strip1 in RGC survival. Donor embryos from a strip1rw147 mutant background are labeled with dextran rhodamine and transplanted into host wild-type embryos. Hosts that show transplanted retinal columns at 60 hpf were subjected to TUNEL. (E) 60-hpf host retinas stained with TUNEL FL to visualize apoptotic cells in wild type to wild type (upper panel) or strip1rw147 mutant to wild type (lower panel). Arrows indicate the presence of apoptotic donor cells. Scale bar, 10 μm. (F) Percentage of TUNEL+ donor RGCs relative to total donor RGCs. Mann–Whitney U-test, n = 4. For all graphs, data are represented as means ± SD. *p < 0.05, **p < 0.01, and ****p < 0.0001.
-
Figure 3—source data 1
Data for Figure 3B,C,F.
- https://cdn.elifesciences.org/articles/74650/elife-74650-fig3-data1-v1.xlsx
Figure 3—figure supplement 1
strip1 mutants show apoptosis in retinal ganglion cells (RGCs) and optic tectum, and elongation defects in retinal axons.
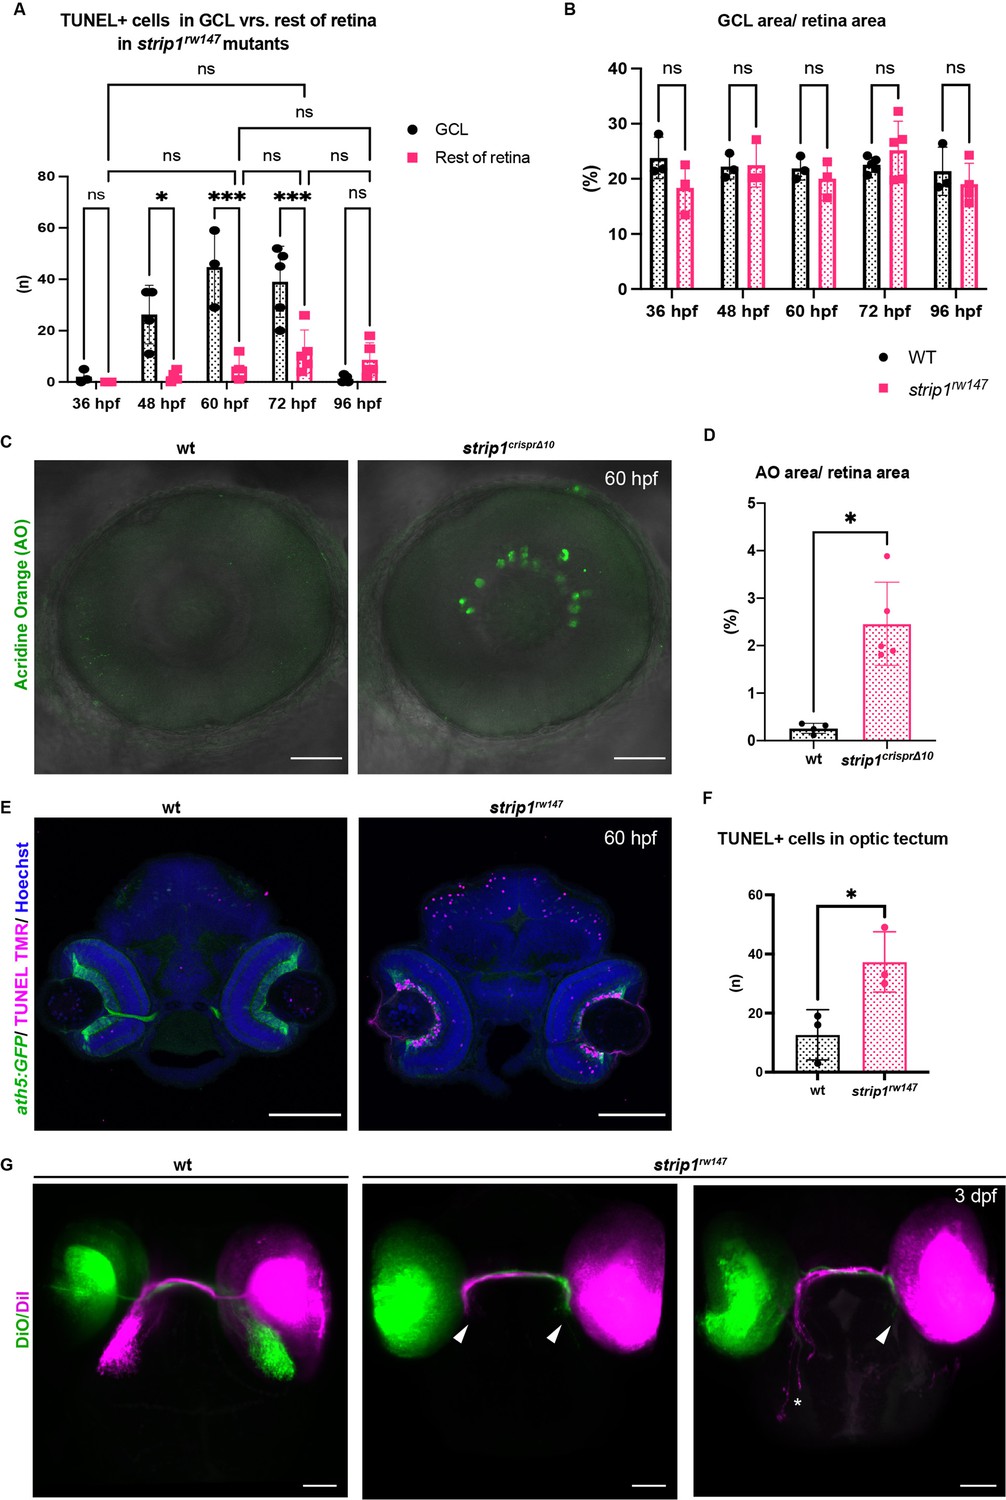
(A) The number of transferase dUTP nick end labeling (TUNEL+) in the ganglion cell layer (GCL) compared to the rest of the retina at 36, 48, 60, 72, and 96 hpf in strip1rw147 mutant retinas, for experiments shown in Figure 3A. Apoptosis gradually increases to reach its peak at 72 hpf in other retinal areas, but its number at 72 hpf is significantly lower than that of the GCL at 72 hpf. In addition, there is no significant difference in apoptotic cell number of other retinal areas between 72 hpf and other time points (36, 60, and 96 hpf). Two-way analysis of variance (ANOVA) with the Tukey multiple comparison test, n ≥ 3. (B) Percentage of GCL area (area between the lens and inner plexiform layer [IPL]) relative to the total retinal area in wild-type and strip1rw147 mutant retinas at 36, 48, 60, 72, and 96 hpf, for experiments shown in Figure 3A. There is no significant difference between wild-type siblings and strip1rw147 mutants at any stage. Two-way ANOVA with the Tukey multiple comparison test, n ≥ 3. (C) Live confocal images of wild-type and strip1crisprΔ10 mutant retinas stained with acridine orange (AO) to label apoptotic cells at 60 hpf. Scale bar, 50 μm. (D) Percentage of AO area relative to total retina area in 60 hpf wild-type and strip1crisprΔ10 mutant retinas. Mann–Whitney U-test, n = 5. (E) TUNEL of 60 hpf wild-type and strip1rw147 mutant heads combined with Tg[ath5:GFP] to label RGCs. All nuclei are counterstained with Hoechst. Apoptosis occurs markedly in RGCs and optic tectum in strip1rw147 mutants. Scale bar, 100 μm. (F) The number of TUNEL+ in the optic tectum of wild-type and strip1rw147 mutants at 60 hpf. The number of TUNEL+ cells is significantly higher in strip1rw147 mutants than in wild-type siblings. Student’s t-test with Welch’s correction, n = 3. (G) Dorsal view of the optic tectum of 3-dpf wild-type and strip1rw147 mutants. RGC axons are labeled using intraretinal injections of DiO or DiI. Axons of strip1rw147 appear to exit the optic disc normally and the optic chiasm is formed. However, the optic nerve is thinner in strip1rw147 mutants than in wild-type siblings. In addition, most axons fail to elongate properly and do not arborize within the optic tectum (arrowheads) or very few axons elongate poorly to reach more posterior arborization fields within the optic tectum (asterisk). Scale bar, 50 μm. For all graphs, data are represented as means ± standard deviation (SD). ns, not significant, *p < 0.05, and ***p < 0.001.
-
Figure 3—figure supplement 1—source data 1
Data for Figure 3—figure supplement 1A,B,D,F.
- https://cdn.elifesciences.org/articles/74650/elife-74650-fig3-figsupp1-data1-v1.xlsx
Figure 3—figure supplement 2
Strip1 is cell autonomously required to promote retinal ganglion cell (RGC) dendritic patterning.
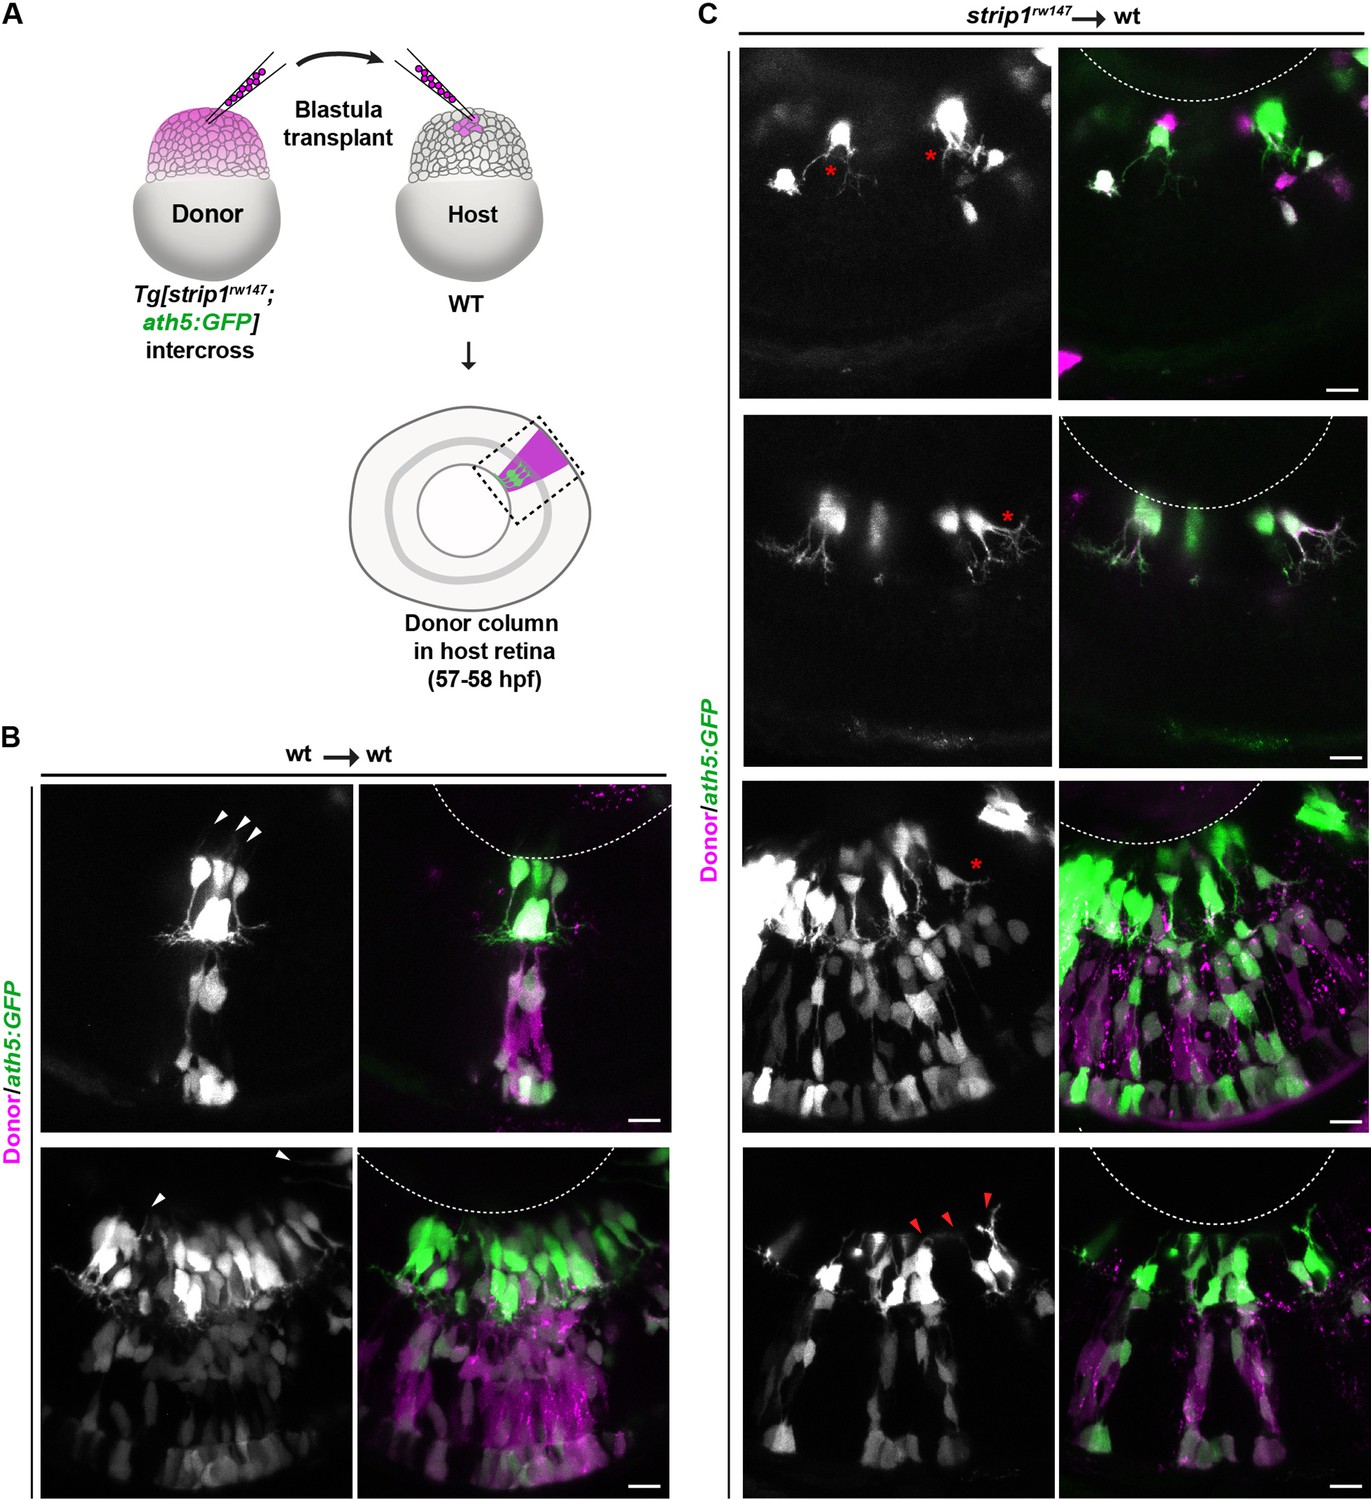
(A) Schematic drawings of cell transplantation design to evaluate cell autonomy of Strip1 in RGC dendritic patterning. Donor cells from strip1rw147 heterozygous intercross carrying the transgene ath5:GFP (green) are labeled with dextran rhodamine (magenta) and transplanted into wild-type host embryos. (B) Maximum projection images of wild-type donor cells transplanted into wild-type host retinas as outlined in (A), arrowheads depict RGC axons. Scale bar, 10 μm. (C) Maximum projection images of strip1rw147 mutant donor cells transplanted into wild-type host retina. Asterisks show dendritic projection defects, red arrowheads depict RGC axon defects. Scale bar, 10 μm.
Figure 4 with 3 supplements
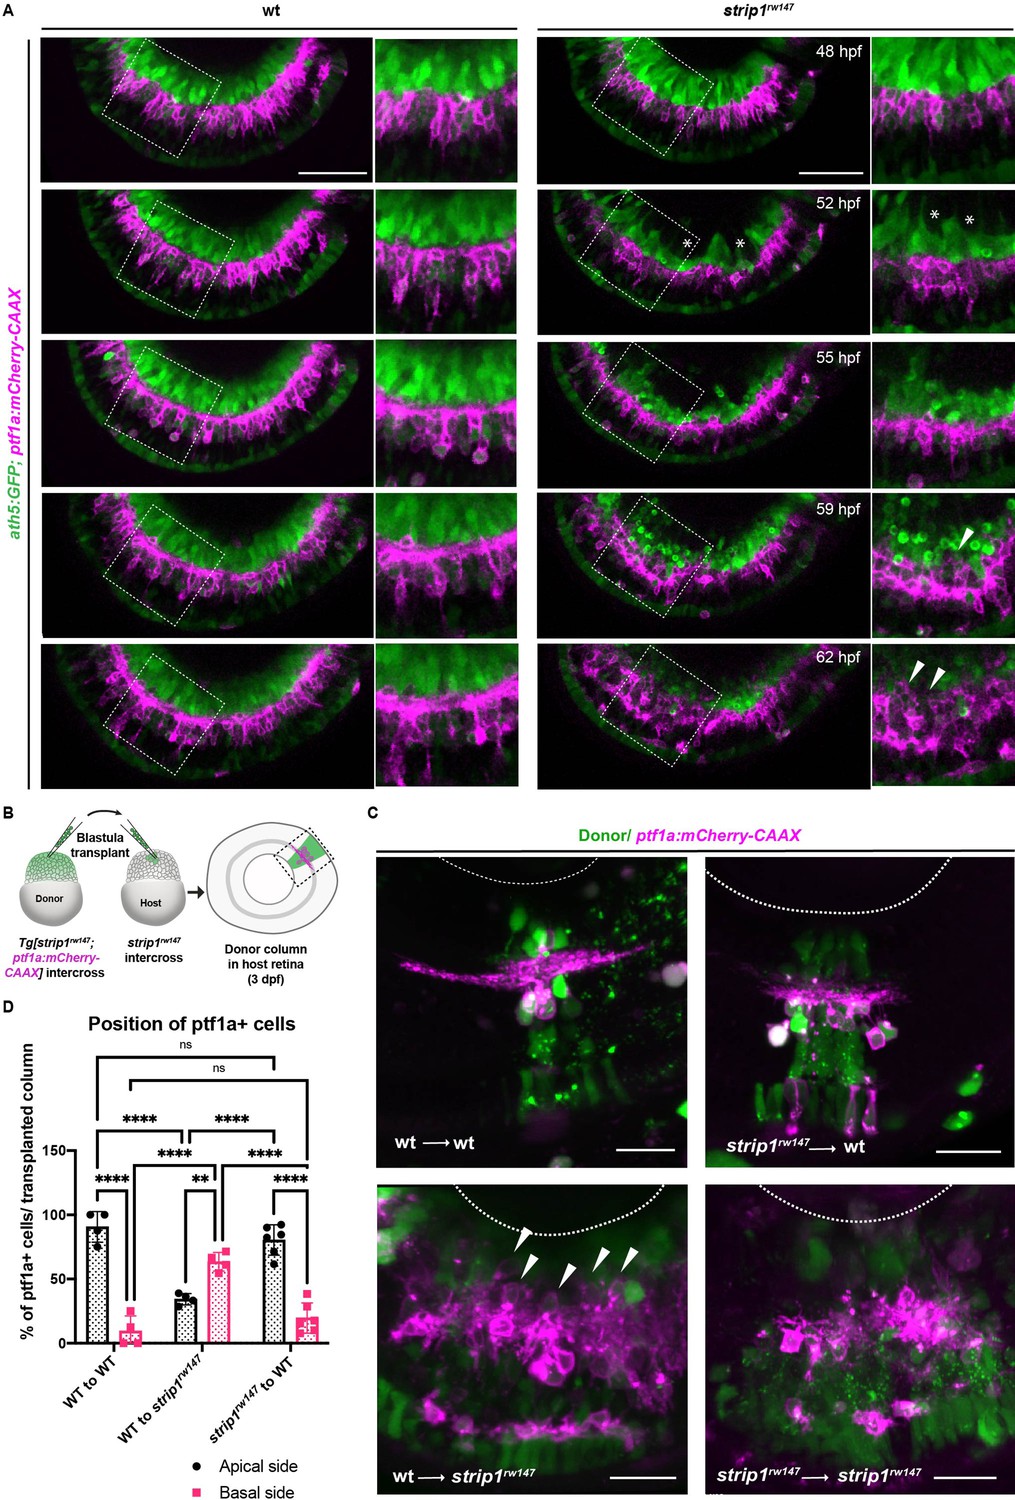
Retinal ganglion cell (RGC) death triggers abnormal positioning of amacrine cells (ACs) leading to inner plexiform layer (IPL) disruption.
(A) Time-lapse imaging of wild-type and strip1rw147 mutant retinas combined with the transgenic line Tg[ath5:GFP; ptf1a:mCherry-CAAX] to track ACs and RGCs during IPL formation. Asterisks denote empty areas in the ganglion cell layer (GCL). Arrowheads represent infiltration of ACs into empty spaces in the GCL. Panels on the right show higher magnification of outlined areas. Scale bar, 50 μm. (B) Cell transplantation design to evaluate the cell autonomy of Strip1 in AC-mediated IPL formation. Donor embryos are from intercross of strip1rw147 heterozygous fish combined with Tg[ptf1a:mCherry-CAAX] to label ACs. Host embryos are generated by nontransgenic intercross of strip1rw147 heterozygous fish. Donor cells are labeled with dextran Alexa-488 and transplanted into host embryos to make chimeric host retinas with donor-derived retinal columns. (C) Confocal images of four combinations of transplantation outcomes: wild type to wild type, wild type to mutant, mutant to wild type, and mutant to mutant. Arrowheads indicate abnormal positioning of ACs in basal side of IPL. Scale bar, 20 μm. (D) Percentage of ACs (either at the apical or the basal side of the IPL) relative to the total number of ACs within a transplanted column. Two-way analysis of variance (ANOVA) with the Tukey multiple comparison test, n ≥ 4. Data are represented as means ± standard deviation (SD). **p < 0.01 and ****p < 0.0001.
-
Figure 4—source data 1
Data for Figure 4D.
- https://cdn.elifesciences.org/articles/74650/elife-74650-fig4-data1-v1.xlsx
Figure 4—figure supplement 1
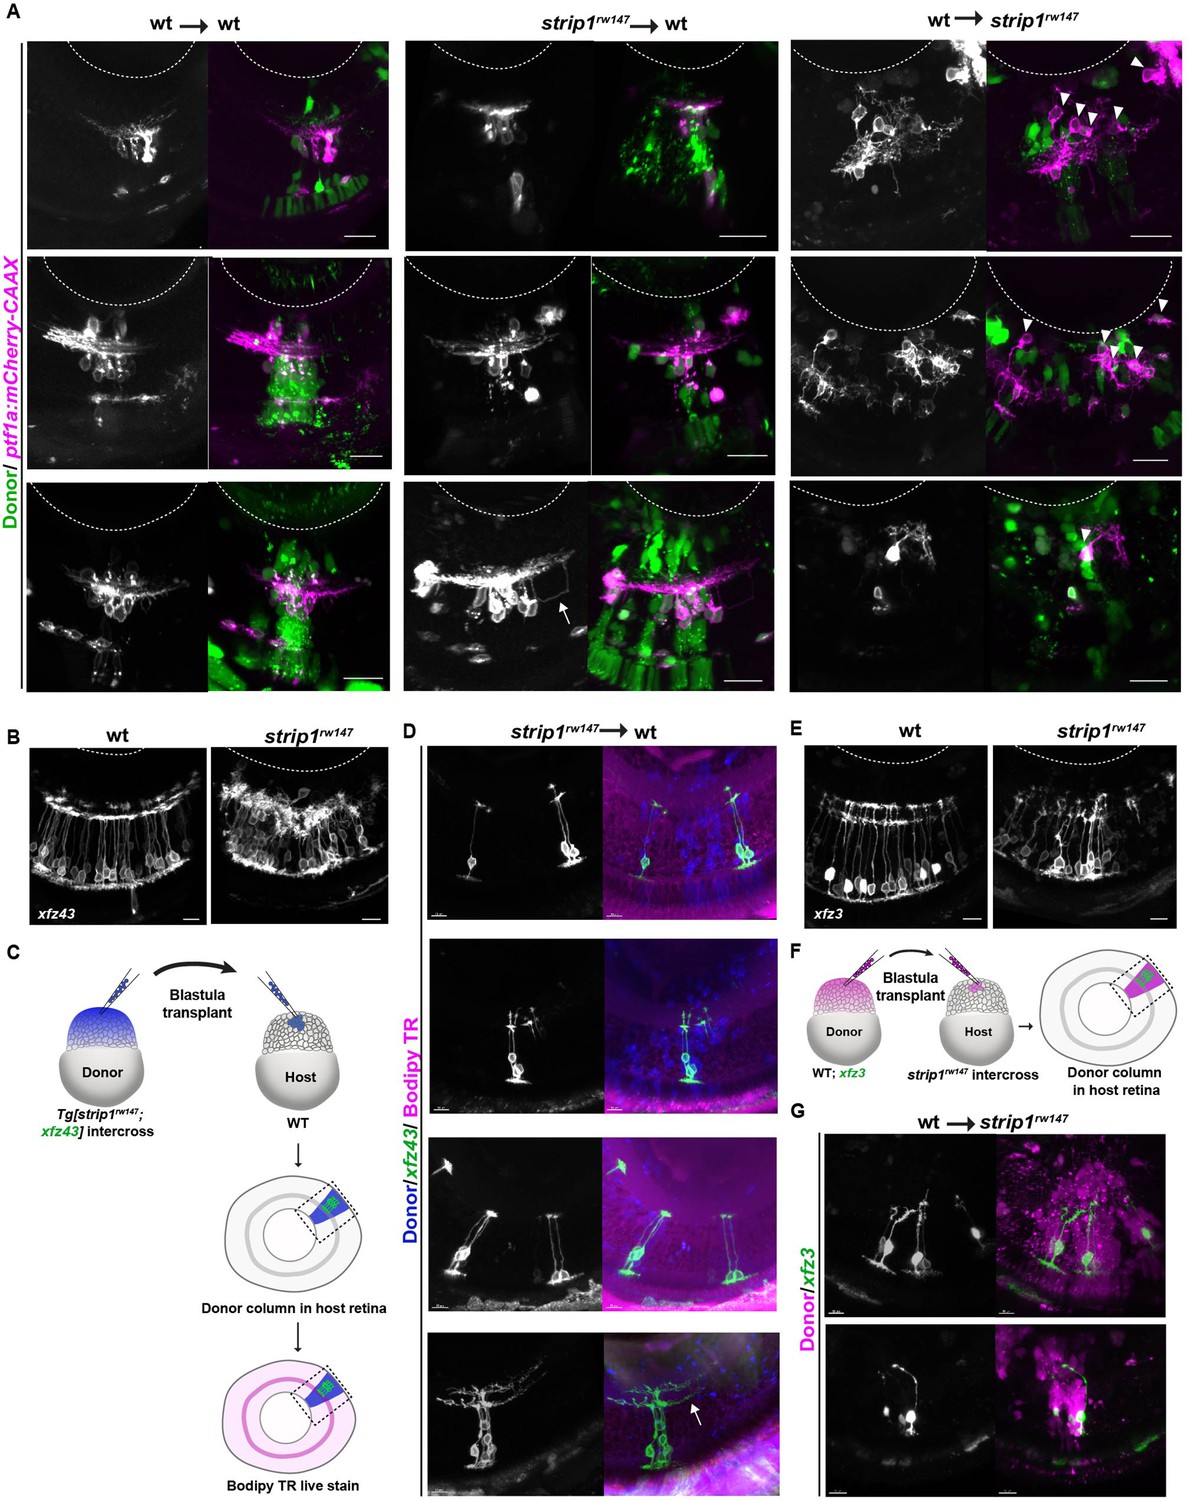
Strip1 is not required in amacrine cells (ACs) and bipolar cells (BPs) for their neurite projections to the inner plexiform layer (IPL).
(A) 3D confocal live images showing neurite projection of ACs to the IPL in transplantation assays outlined in Figure 4B, C. Panels represent three combinations of transplantation experiments: from wild-type donor to wild-type host (left columns), from strip1rw147 mutant donor to wild-type host (middle columns), and from wild-type donor to strip1rw147 mutant host (right columns). Donor cells are labeled with dextran-Alexa-488 in green and ACs are labeled with ptf1a:mCherry-CAAX in magenta. Mutant donor ACs show a normal dendritic pattern and normal projection to the IPL in wild-type host retina, although on rare occasion we observed that mutant ACs display two dendritic trees (arrow in the bottom middle panel), but still contribute to a normal IPL. On the other hand, wild-type donor ACs transplanted into mutant host retinas show abnormal projection patterns and infiltrate the ganglion cell layer (GCL; arrowheads in the right panels). Scale bar, 20 μm. (B) Confocal image of 3-dpf live wild-type and strip1rw147 mutant retinas combined with the transgenic line, xfz43, to label subsets of BPs. Scale bar, 10 μm. (C) Schematic drawings of cell transplantation design to evaluate cell autonomy of Strip1’s role in BP development. strip1rw147 mutant donor cells carrying the transgene xfz43 (green) are labeled with dextran-cascade blue or dextran-Alexa-flour 647 (blue) and transplanted into wild-type host embryos at blastula stage, leading to chimeric wild-type retina with strip1rw147 mutant retinal columns. Retinal lamination of the host retina is visualized with Bodipy TR (magenta). (D) 3D confocal live images of four wild-type host retinas with strip1rw147 mutant donor retinal columns outlined in (C). strip1rw147 mutant donor BPs show normal neurite projection patterns to the IPL in wild-type host retina. Occasionally, bipolar axon terminals are abnormally extended laterally (arrow in the bottom panel); however, such defects are confined to a seemingly normal IPL. Scale bar, 10 μm. (E) Confocal image of 3-dpf live wild-type and strip1rw147 mutant retinas combined with the transgenic line, xfz3, to label subsets of BPs. Scale bar, 10 μm. (F) Schematic drawings of cell transplantation design to evaluate the cell autonomy of Strip1’s role in BP development. Wild-type donor cells carrying the transgene xfz3 (green) are labeled with dextran rhodamine (magenta) and transplanted into strip1rw14 mutant host embryos at blastula stage, leading to chimeric strip1rw147 mutant retinas with wild-type retinal columns. (G) 3D confocal live images of two different strip1rw147 mutant host retinas with wild-type donor retinal columns outlined in (F). Wild-type donor BPs show misguided neurite projections. Scale bar, 10 μm.
Figure 4—video 1
Development of amacrine cells (ACs) and inner plexiform layer (IPL) formation in wild-type sibling retina.
Time-lapse movie to track the development of ACs and retinal ganglion cells (RGCs) in wild-type sibling combined with the transgenic line Tg[ath5:GFP; ptf1a:mCherry-CAAX] to label RGCs in green and ACs in magenta. Acquisition started ~48 hpf. Movie on the right represents outlined areas for ptf1a:mCherry-CAAX channel.
Figure 4—video 2
Development of amacrine cells (ACs) and inner plexiform layer (IPL) formation in strip1rw147 mutant retina.
Time-lapse movie to track the development of ACs and retinal ganglion cells (RGCs) in a strip1rw147 mutant combined with the transgenic line Tg[ath5:GFP; ptf1a:mCherry-CAAX] to label RGCs in green and ACs in magenta. Acquisition started ~48 hpf. The movie on the right represents outlined areas for the ptf1a:mCherry-CAAX channel. Asterisks depict the onset of severe RGC loss and arrows show areas of ectopic migration of ACs into the ganglion cell layer (GCL).
Figure 5 with 2 supplements
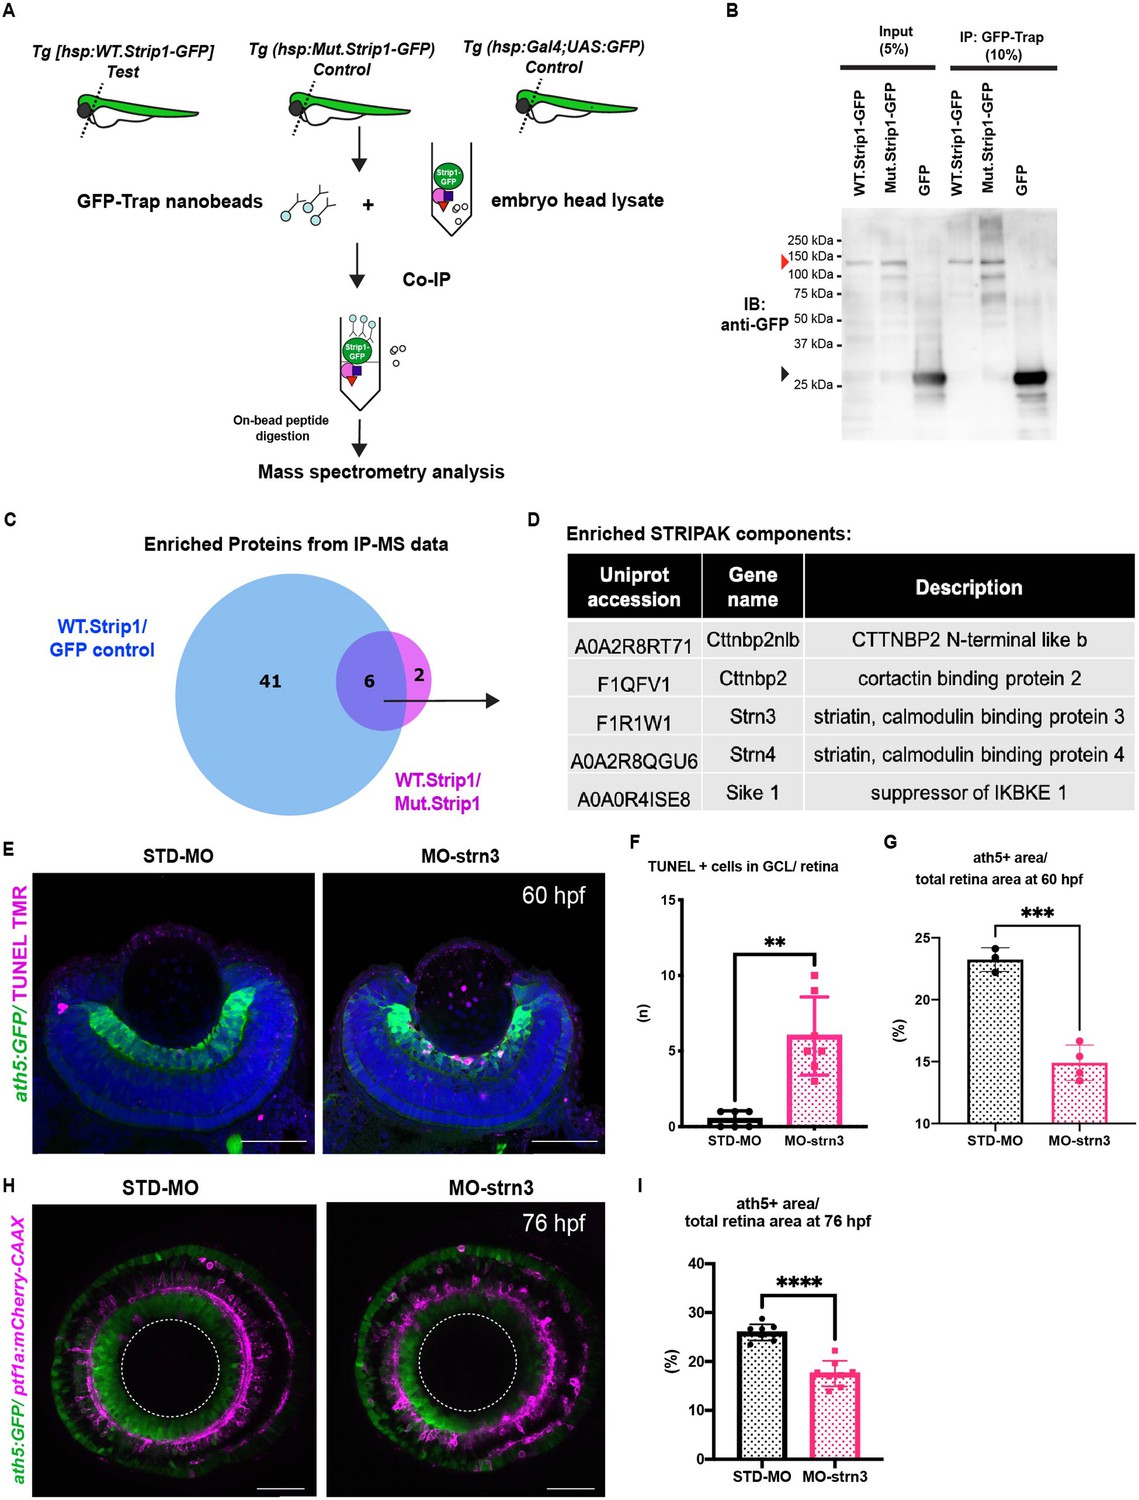
Strn3 is a Strip1-interacting partner that promotes retinal ganglion cell (RGC) survival.
(A) Design of co-immunoprecipitation coupled with mass spectrometry (Co-IP/MS) to identify zebrafish Strip1-interacting partners. Embryos carrying the transgenes Tg[hsp:WT.Strip1-GFP], Tg[hsp:Mut.Strip1-GFP], or Tg[hsp:Gal4;UAS:GFP] were used to pull-down wild-type GFP-tagged Strip1, mutant GFP-tagged Strip1 or only GFP, respectively. Head lysates from 2-dpf zebrafish embryos were subjected to immunoprecipitation using GFP-Trap beads. Immunoprecipitates were digested and analyzed by mass spectrometry (MS). (B) Western blotting of whole head lysates (input) and immunoprecipitates (IP) using anti-GFP antibody. Red and black arrowheads indicate the expected band sizes for Strip1-GFP (120 kDa) and GFP (26 kDa), respectively. (C) Venn diagram comparing proteins significantly enriched in WT.Strip1-GFP relative to Control GFP (blue) and WT.Strip1-GFP relative to Mut.Strip1-GFP (magenta). Six proteins are commonly enriched in both groups, FC >2, p < 0.05. n = 3 for WT.Strip1-GFP and Mut. Strip1-GFP and n = 2 for GFP-control. (D) Five components of the STRIPAK complex found from six proteins commonly enriched in (C). (E) Transferase dUTP nick end labeling (TUNEL) of 60-hpf retinas of Tg[ath5:GFP] transgenic embryos injected with standard MO and MO-strn3. RGCs and apoptotic cells are labeled with ath5:GFP and TUNEL, respectively. Nuclei are stained with Hoechst (blue). (F) The number of TUNEL+ cells in ganglion cell layer (GCL). Mann–Whitney U-test, n ≥ 6. (G) Percentage of ath5+ area relative to total retinal area. Student’s t-test with Welch’s correction, n ≥ 3.(H) Confocal images of retinas of 76-hpf Tg[ath5:GFP; ptf1a:mCherry-CAAX] transgenic embryos injected with standard MO and MO-strn3. ath5:GFP and ptf1a:mCherry-CAAX label RGCs and amacrine cells (ACs), respectively. (I) Percentage of ath5+ area relative to total retinal area. Student’s t-test with Welch’s correction, n = 8. Scale bar, 50 μm (E, H). For all graphs, data are represented as means ± standard deviation (SD). **p < 0.01, ***p < 0.001, and ****p < 0.0001.
-
Figure 5—source data 1
Data for Figure 5B.
- https://cdn.elifesciences.org/articles/74650/elife-74650-fig5-data1-v1.zip
-
Figure 5—source data 2
Data for Figure 5C.
- https://cdn.elifesciences.org/articles/74650/elife-74650-fig5-data2-v1.xlsx
-
Figure 5—source data 3
Data for Figure 5F,G,I.
- https://cdn.elifesciences.org/articles/74650/elife-74650-fig5-data3-v1.xlsx
Figure 5—figure supplement 1
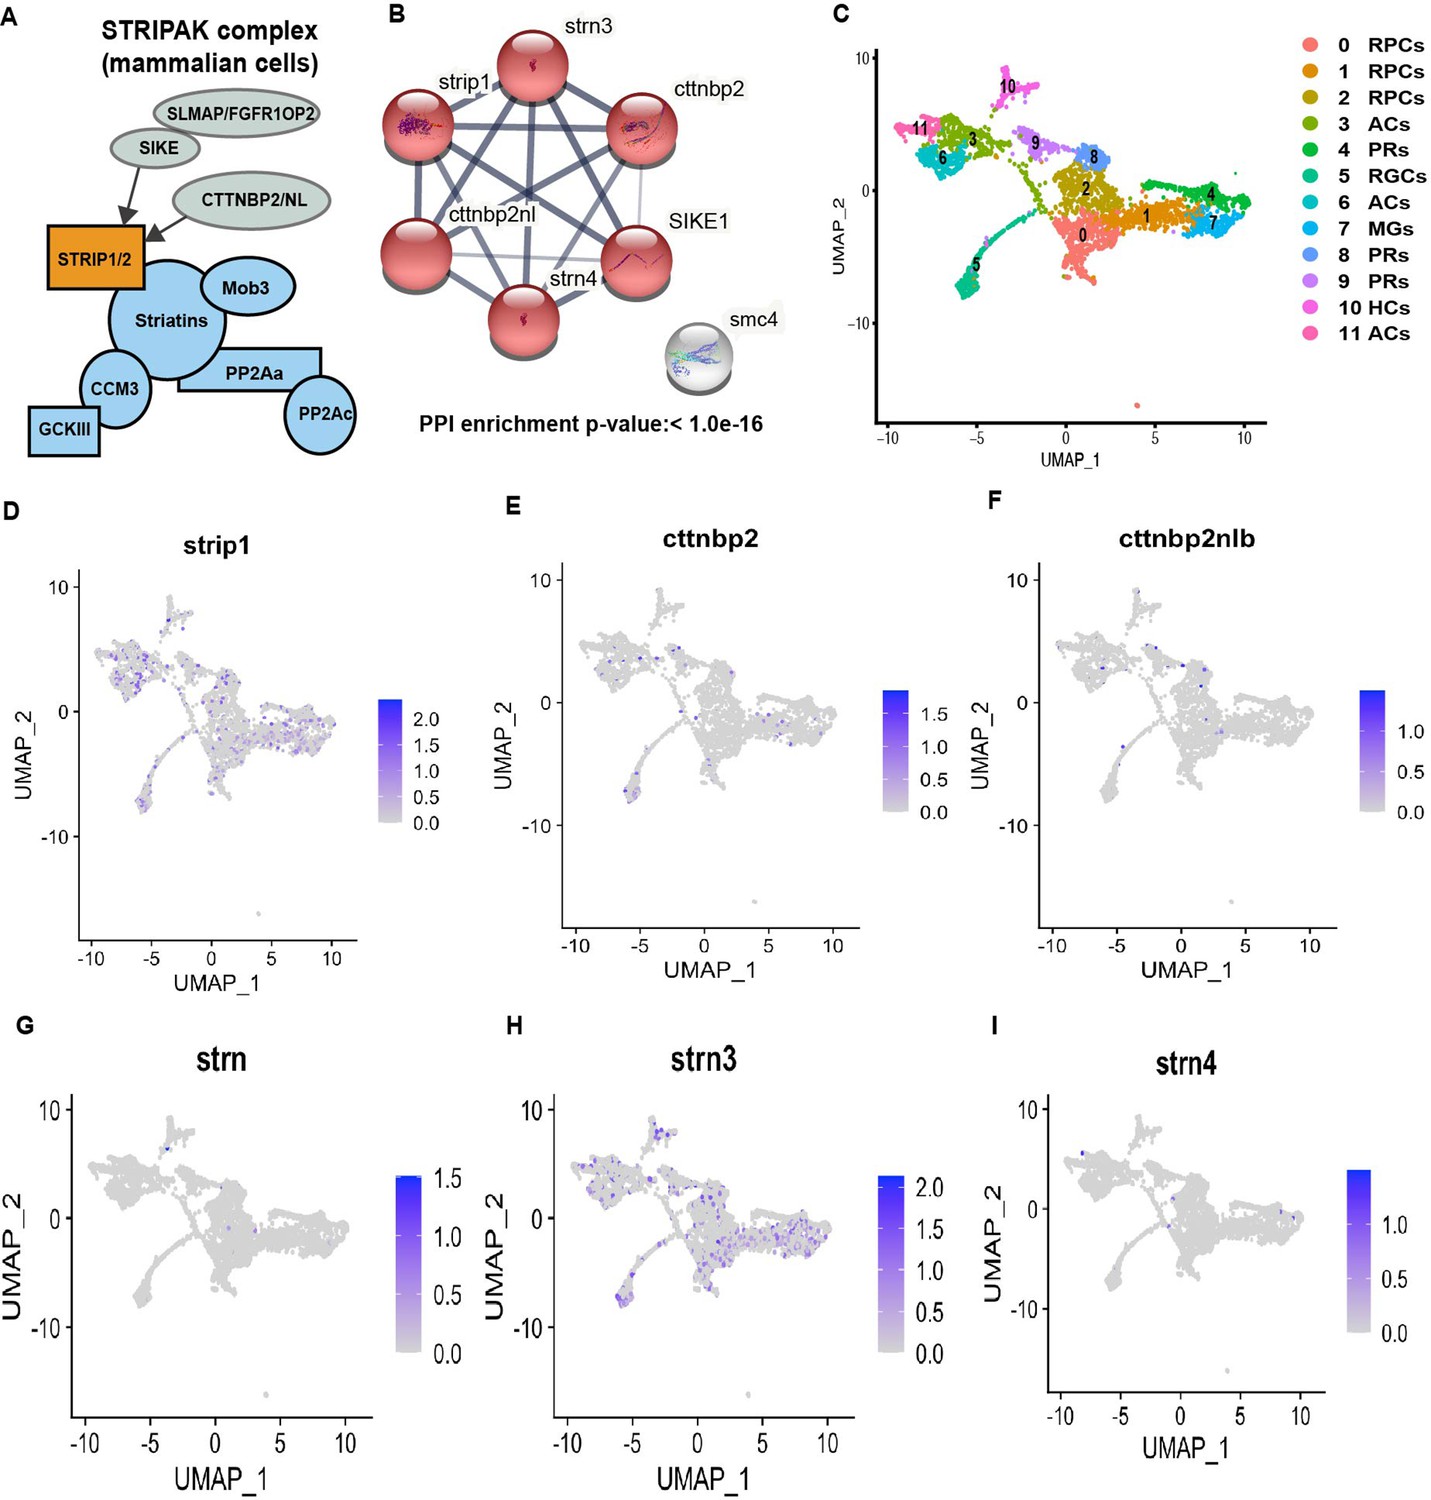
Components of the STRIPAK complex are highly enriched in the interactome of zebrafish Strip1 and their retinal expression, according to published scRNA-seq data.
(A) Schematic diagram showing the core components of the mammalian STRIPAK complex and some of its accessory molecules. Core STRIPAK components include serine/threonine-protein phosphatase catalytic subunit known as PP2Ac and the scaffolding subunit PP2Aa, together with striatins (STRN, STRN3, and STRN4), Mob3, STRIP1, or STRIP2, and a germinal center kinase, GCKIII kinase, bound via cerebral cavernous malformation 3 (Ccm3). Some molecules bind in a mutually exclusive pattern to the core components. Arrows show that sarcolemmal membrane-associated protein (SLMAP) and the suppressor of IKKe (SIKE) are not detected in STRIPAK complexes containing cortactin-binding proteins (CTTNBP2/NL) and vice versa. (A has been adapted from Figure 3 in Hwang and Pallas, 2014). (B) STRING protein–protein interaction (PPI) network analysis of six zebrafish Strip1-interacting partners significantly enriched from IP-MS analysis highlighted in Figure 5C. Network edges represent known and/or predicted functional interactions in the STRING database. Edge thickness reflects the combined STRING evidence score for each binary relationship. Thicker edges represent increased interaction evidence. PPI enrichment p value <1.0e−16. (C) Uniform Manifold Approximation and Projection (UMAP) plots showing different clusters of retinal cells at 48 hpf analyzed with Seuret R pipeline using data published by Xu B. et al. (2020). Twelve clusters are identified and categorized to different retinal cell types or subtypes. RPCs, retinal progenitor cells; RGCs, retinal ganglion cells; ACs, amacrine cells; BPs, bipolar cells; HCs, horizontal cells; PRs, photoreceptors; MGs, Müller glia. UMAP plots showing retinal mRNA expression patterns of strip1 (D) and its interacting STRIPAK components, identified from Co-IP/MS; cttnbp2 (E), ttnbp2nlb (F), strn (G), strn3 (H), and strn4 (I). Only strip1 and strn3 show high retinal expression levels at 48 hpf compared to other partners.
Figure 5—figure supplement 2
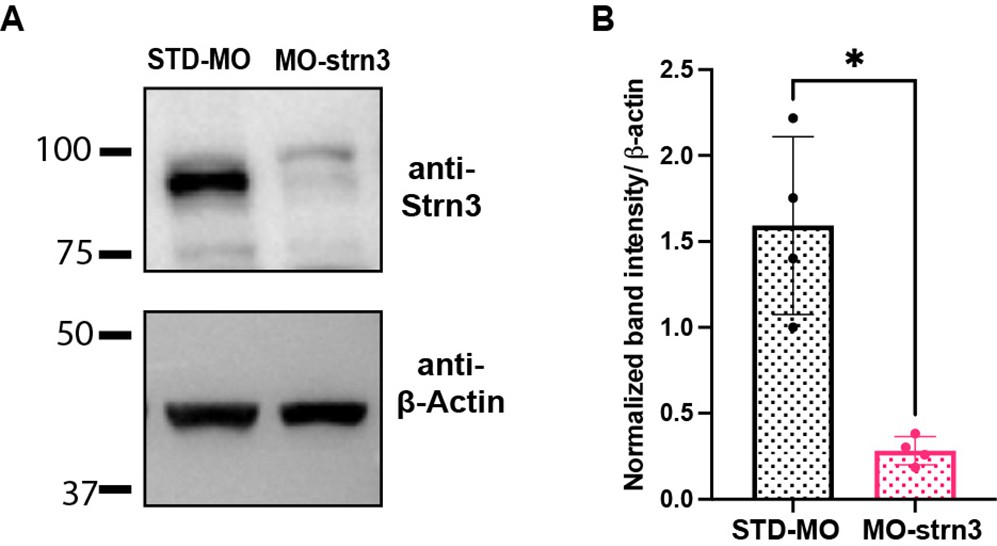
Efficient and specific knockdown of zebrafish Strn3 using morpholinos.
(A) Western blotting of 2-dpf head lysates from STD-MO-injected and MO-strn3-injected wild-type embryos. A ~90 kDa band corresponding to zebrafish Strn3 is reduced in the morphants. (B) Quantification of Strn3 protein level relative to loading control protein, β-actin. Mann–Whitney U-test, n = 4. Data are represented as means ± standard deviation (SD). *p < 0.05.
-
Figure 5—figure supplement 2—source data 1
Data for Figure 5—figure supplement 2A.
- https://cdn.elifesciences.org/articles/74650/elife-74650-fig5-figsupp2-data1-v1.zip
-
Figure 5—figure supplement 2—source data 2
Data for Figure 5—figure supplement 2B.
- https://cdn.elifesciences.org/articles/74650/elife-74650-fig5-figsupp2-data2-v1.xlsx
Figure 6 with 2 supplements

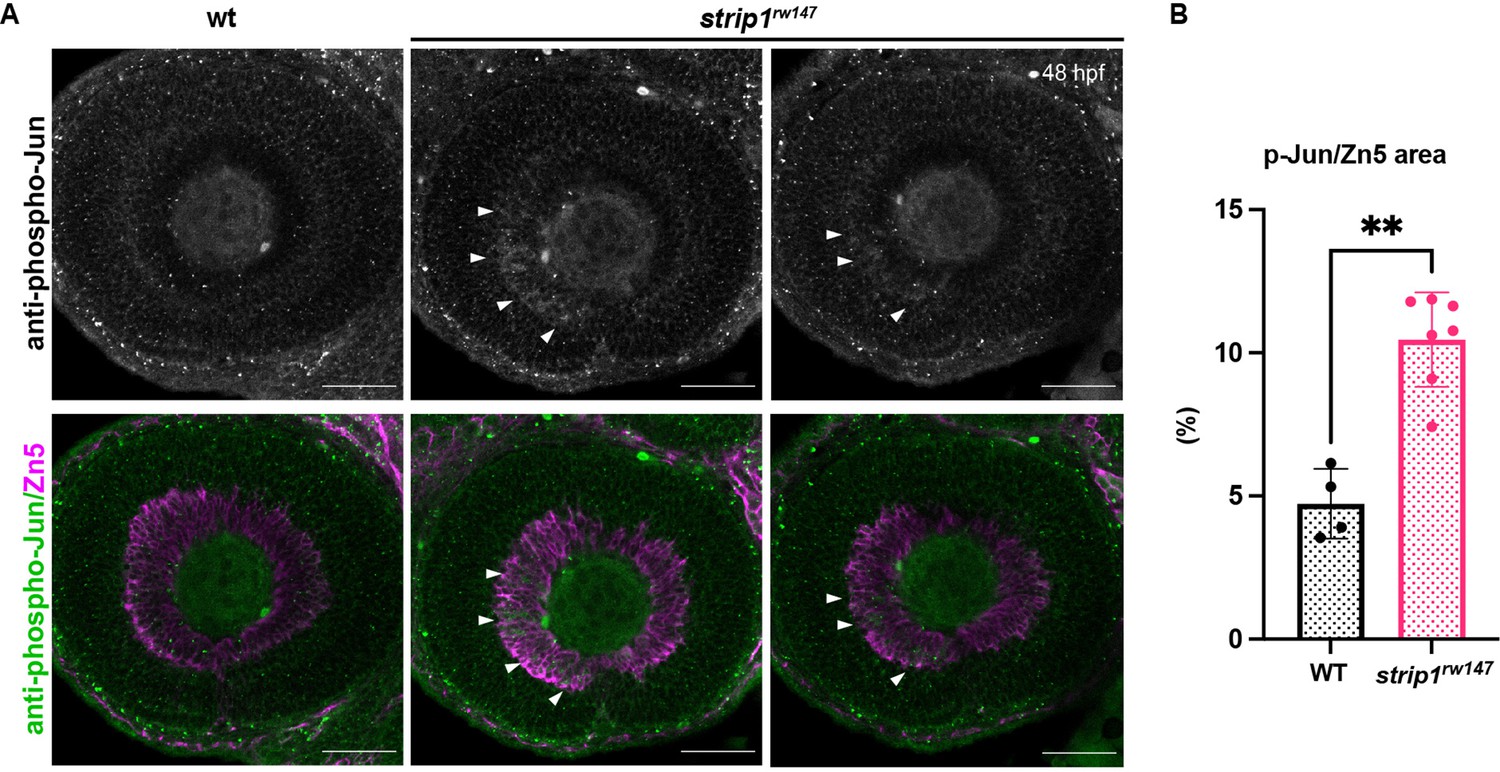
Jun is a key mediator of retinal ganglion cell (RGC) death in the absence of Strip1.
(A) Volcano plot showing differentially expressed genes (DEGs) in strip1rw147 mutants compared to wild-type siblings. Colored points represent genes that are significantly upregulated (131 genes, red) or downregulated (75 genes, blue). Data are obtained from four independent collections of 62-hpf embryo eye cups. FDR < 0.05, log2 FC > |1|. (B) Heatmap of expression values (z-score) representing selected DEGs in strip1rw147 mutants compared to wild-type siblings. (C) Whole-mount labeling of 54-hpf wild-type and strip1rw147 mutant retinas with anti-phospho-Jun antibody and zn5 antibody, which label active Jun and RGCs, respectively. (D) Percentage of phospho-Jun area relative to zn5 area at 54–58 hpf. Student’s t-test with Welch’s correction, n = 6. (E) Whole-mount labeling of 49-hpf wild-type embryos injected with standard MO or MO-strn3 with anti-phospho-Jun antibody and zn5 antibody, respectively. (F) Percentage of phospho-Jun area relative to zn5 area at 49 hpf. Student’s t-test with Welch’s correction, n = 5. (G) Transferase dUTP nick end labeling (TUNEL) and zn5 antibody labeling of 60-hpf wild-type and strip1rw147 mutant retinas injected with standard MO and MO-Jun. Nuclei are stained with Hoechst. (H) The number of TUNEL+ cells in GCL per retina. Two-way analysis of variance (ANOVA) with the Tukey multiple comparison test, n = 6. (I) Confocal images of 76-hpf wild-type and strip1rw147 mutant retinas injected with standard-MO and MO-Jun. Embryos carry the transgene Tg[ath5:GFP] to label RGCs and are stained with bodipy TR methyl ester to visualize retinal layers. (J) Percentage of ath5+ area relative to total retinal area. Two-way ANOVA with the Tukey multiple comparison test, n ≥ 3. Scale bar, 50 μm (C, E, G, I). For all graphs, data are represented as means ± SD. ns, not significant, *p < 0.05, **p < 0.01, and ****p < 0.0001.
-
Figure 6—source data 1
Data for Figure 6A.
- https://cdn.elifesciences.org/articles/74650/elife-74650-fig6-data1-v1.xlsx
-
Figure 6—source data 2
Data for Figure 6D,F,J,H.
- https://cdn.elifesciences.org/articles/74650/elife-74650-fig6-data2-v1.xlsx
Figure 6—figure supplement 1

Gene ontology (GO) enrichment analysis of differentially expressed genes (DEGs) from RNA-seq of strip1 mutants and comparison between upregulated DEGs in strip1 mutant transcriptomes vs. transcriptomes of zebrafish retinal ganglion cells (RGCs) under stress.
List of enriched GO terms in DEGs downregulated (A) and upregulated (B) in strip1rw147 mutant relative to wild-type siblings as analyzed with Metascape, FDR < 0.05 and log2 FC > |1|. Downregulated genes show many GO terms related to the nervous system, RGCs, embryo morphogenesis, synaptic development, and transmission. Upregulated genes show terms related to stress response, cell death and MAPK signaling. (C) Venn diagram showing overlap of upregulated DEGs in RNA sequencing datasets of strip1rw147 mutant relative to wild-type (FDR < 0.05 and FC > 1.5) in comparison with published upregulated DEGs in microarray data of adult zebrafish RGCs at 3 days post-optic nerve injury (ONI) (Veldman et al., 2007) and adult zebrafish eyes at 4 days post-optic nerve crush (ONX) (McCurley and Callard, 2010).
Figure 6—figure supplement 2
Jun is activated in retinal ganglion cells (RGCs) of strip1 mutants at 48 hpf.
(A) Whole-mount labeling of 48-hpf wild-type and strip1rw147 mutant retinas with anti-phospho-Jun (p-Jun) antibody and zn5 antibody, which label active Jun and RGCs, respectively. Arrowheads show RGCs expressing phospho-Jun in the ventronasal region. Scale bar, 50 μm. (B) Percentage of phospho-Jun area relative to zn5 area at 48 hpf. Mann–Whitney U-test, n ≥ 4. Data are represented as means ± standard deviation (SD). **p < 0.01.
-
Figure 6—figure supplement 2—source data 1
Data for Figure 6—figure supplement 2B.
- https://cdn.elifesciences.org/articles/74650/elife-74650-fig6-figsupp2-data1-v1.xlsx
Figure 7
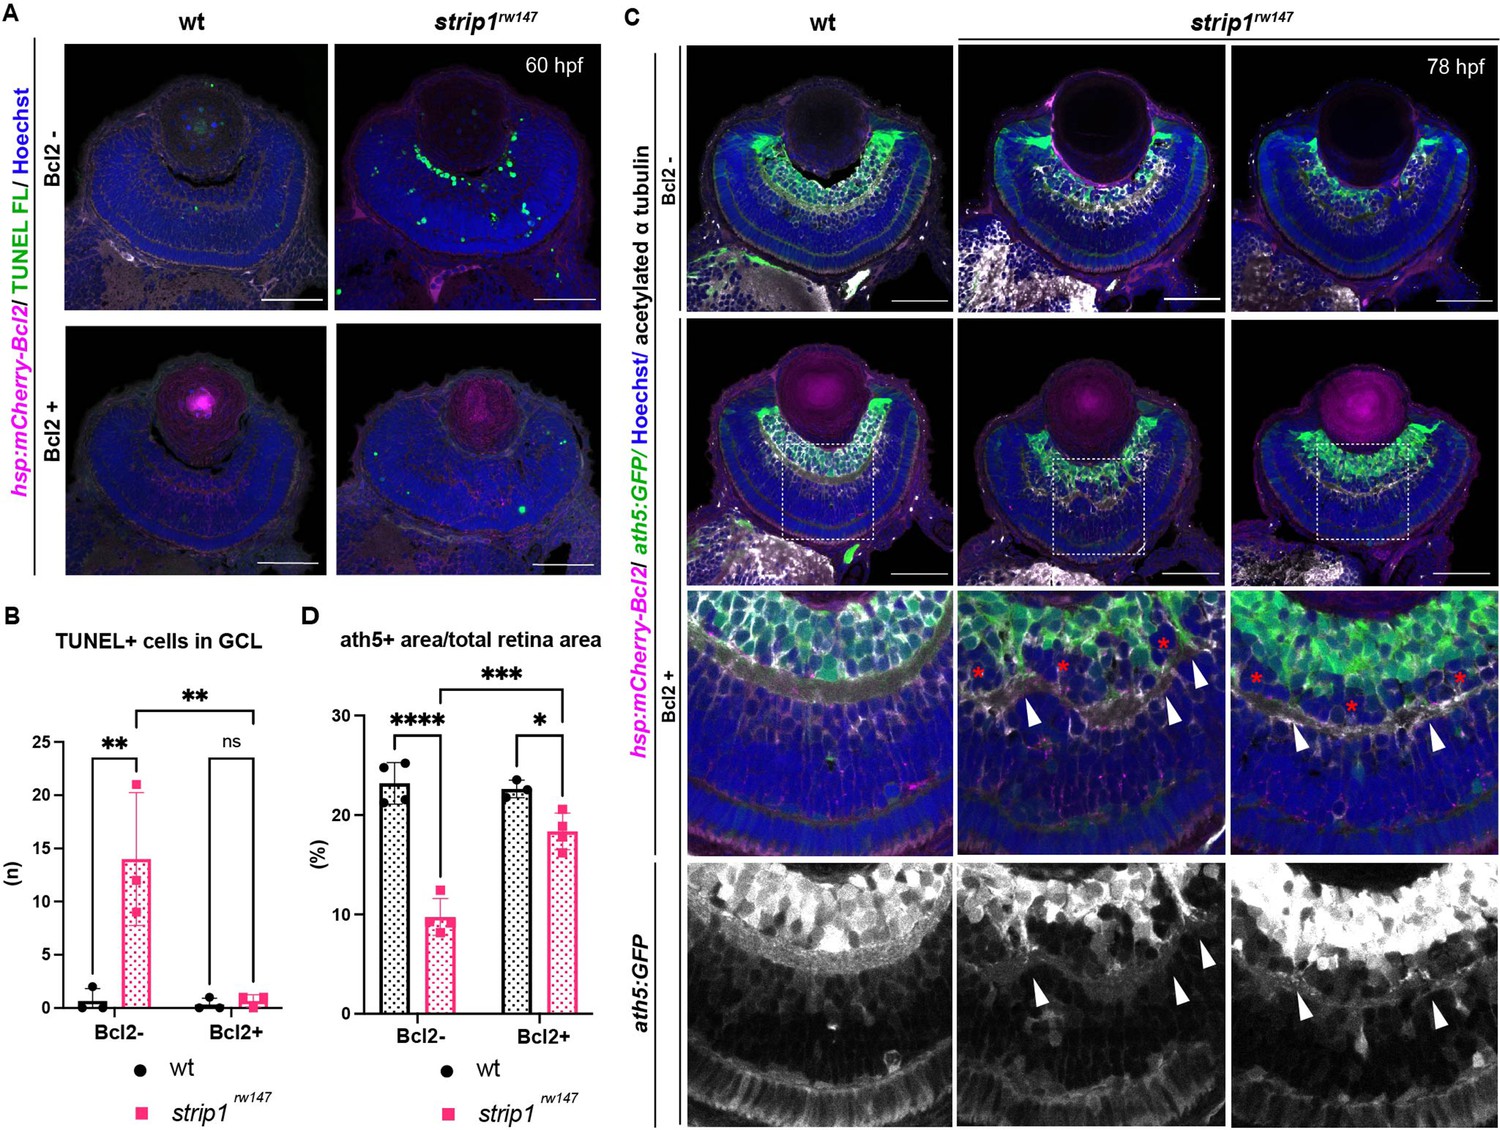
Bcl2 rescues retinal ganglion cell (RGC) death in strip1 mutants, but surviving RGCs do not project their dendrites to the inner plexiform layer (IPL).
(A) 60-hpf wild-type and strip1rw147 mutants combined with the transgenic line Tg[hsp:mCherry-Bcl2]. Nontransgenic embryos (Bcl2−, top panels) are compared to transgenic embryos (Bcl2+, bottom panels) after heat shock treatment. Apoptotic cells are visualized by transferase dUTP nick end labeling (TUNEL) FL and fluorescent signals from mCherry-Bcl2 are shown. Nuclei are stained with Hoechst. (B) The number of TUNEL+ cells in ganglion cell layer (GCL). Two-way analysis of variance (ANOVA) with the Tukey multiple comparison test, n = 3. (C) 78-hpf wild-type and strip1rw147 mutant retinas combined with the transgenic lines, Tg[ath5:GFP] and Tg[hsp:mCherry-Bcl2]. Nontransgenic embryos (Bcl2−, top panels) are compared to transgenic embryos (Bcl2+, bottom panels) after heat shock treatment. RGCs are labeled with ath5:GFP and fluorescent signals from mCherry-Bcl2 are shown. Anti-acetylated α-tubulin labels the IPL. Nuclei are stained with Hoechst. Arrowheads represent areas where RGC dendrites contribute to the IPL. Asterisks denote areas where RGC dendrites fail to project to the forming IPL and a fraction of presumptive amacrine cells is located between them. (D) Percentage of ath5+ area relative to retinal area. Two-way ANOVA with the Tukey multiple comparison test, n ≥ 3. Scale bar, 50 μm (A, C). For all graphs, data are represented as means ± standard deviation (SD). ns, not significant, *p < 0.05, **p < 0.01, ***p < 0.001, and ****p < 0.0001.
-
Figure 7—source data 1
Data for Figure 7B,D.
- https://cdn.elifesciences.org/articles/74650/elife-74650-fig7-data1-v1.xlsx
Figure 8
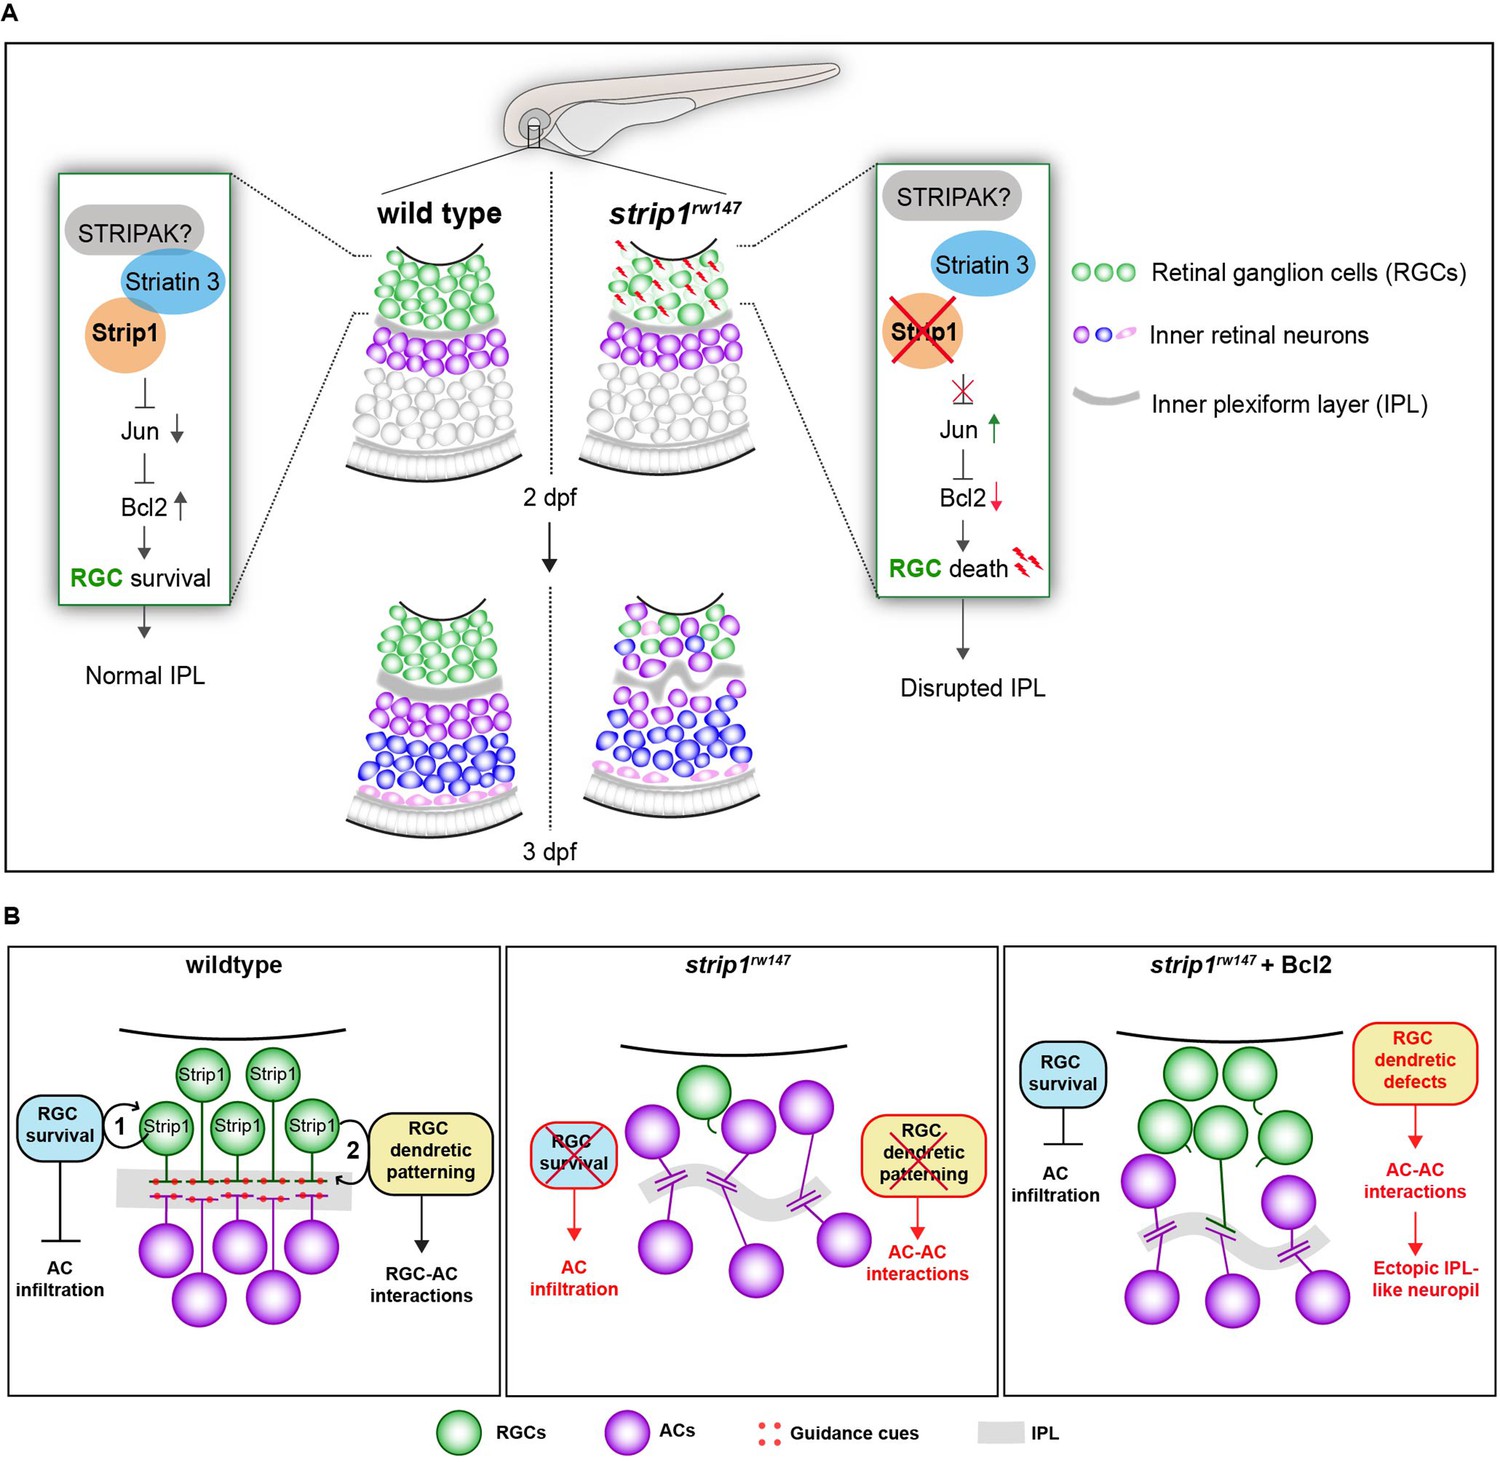
Summary of developmental and molecular events that underlie Strip1 function in inner retinal circuit formation.
(A) In wild-type retina, Strip1 suppresses Jun-mediated proapoptotic signals, probably through the STRIPAK complex, to maintain retinal ganglion cells (RGCs) during development. In the absence of Strip1, Jun is activated in RGCs leading to severe degeneration of RGCs as early as 2 dpf. Subsequently, cells in the inner nuclear layer (INL) abnormally infiltrate the ganglion cell layer (GCL) leading to a disrupted inner plexiform layer (IPL). (B) Proposed model for Strip1’s role within RGCs to regulate amacrine cell (AC) positioning and IPL formation. In wild type, Strip1 regulates (1) RGC survival to prevent AC infiltration, and (2) RGC dendritic patterning to promote RGC–AC interactions. In strip1rw147 mutants, both mechanisms are perturbed, leading to AC infiltration, increased AC–AC interactions, and IPL defects. In Bcl2-rescued strip1rw147 mutants, survived RGCs prevent AC infiltration. However, RGC dendritic defects lead to increased AC–AC interactions and ectopic IPL formation.
Tables
Appendix 1—key resources table
| Reagent type (species) or resource | Designation | Source or reference | Identifiers | Additional information |
|---|---|---|---|---|
| Genetic reagent (Danio rerio) | Tg[hsp:gal4]kca4 | PMID: 11850174 | ZDB-ALT-020918-6 | Reugels/Campos-Ortega lab (Köln University) |
| Genetic reagent (Danio rerio) | Tg[UAS:EGFP] | PMID: 11336499 | N/A | |
| Genetic reagent (Danio rerio) | Tg[UAS:MYFP] | PMID: 1702063 | N/A | |
| Genetic reagent (Danio rerio) | Tg[ath5:GFP] rw021 | PMID: 12702661 | N/A | |
| Genetic reagent (Danio rerio) | Tg[ptf1a:mCherry-CAAX]oki067 | This paper | N/A | See ‘Materials and methods’ |
| Genetic reagent (Danio rerio) | Tg[Gal4-VP16,UAS:EGFP]xfz43 or xfz43 | PMID: 19712466 | ZDB-ALT-100201-1 | ZIRC |
| Genetic reagent (Danio rerio) | Tg[Gal4-VP16,UAS:EGFP]xfz3 or xfz3 | PMID: 19712466 | ZDB-ALT-100201-2 | ZIRC |
| Genetic reagent (Danio rerio) | Tg[hs:mCherry-tagged Bcl2]oki029 | PMID: 33060680 | ZDB-ALT-210524-5 | |
| Genetic reagent (Danio rerio) | Tg[hsp:WT.Strip1-GFP] oki068 | This paper | N/A | See ‘Materials and methods’ |
| Genetic reagent (Danio rerio) | Tg[hsp:Mut.Strip1-GFP] oki069 | This paper | N/A | See ‘Materials and methods’ |
| Genetic reagent (Danio rerio) | strip1rw147 | This paper | N/A | See ‘Materials and methods’ |
| Genetic reagent (Danio rerio) | strip1crisprΔ10 or strip1oki8 | This paper | N/A | See ‘Materials and methods’ |
| Genetic reagent (Danio rerio) | roy | PMID: 28760346 | ZDB-GENE-040426-1168 | |
| Antibody | anti-acetylated α-tubulin (mouse monoclonal) | Sigma-Aldrich | T6793 | IF: 1:1000 |
| Antibody | anti-Pax6 (rabbit polyclonal) | BioLegned | 901,301 | IF: 1:500 |
| Antibody | anti-Prox1 (rabbit polyclonal) | Genetex | GTX128354 | IF: 1:500 |
| Antibody | anti-PCNA (mouse monoclonal) | Sigma-Aldrich | P8825 | IF: 1:200 |
| Antibody | Zpr1 (mouse monoclonal) | ZIRC | ZDB-ATB-081002-43 | IF: 1:100 |
| Antibody | Zpr3 (mouse monoclonal) | ZIRC | ZDB-ATB-081002-45 | IF: 1:100 |
| Antibody | anti-glutamine synthetase (mouse monoclonal) | Sigma-Aldrich | MAB302 | IF: 1:150 |
| Antibody | Zn5 (mouse monoclonal) | ZIRC | ZDB-ATB-081002-19 | IF: 1:50 |
| Antibody | anti-parvalbumin (mouse monoclonal) | Merck Millipore | MAB1572 | IF: 1:500 |
| Antibody | anti-p-Jun (rabbit polyclonal) | Cell Signaling | 9164S | IF: 1:100 |
| Antibody | anti-Strip1 (rabbit polyclonal) | This paper | N/A | See ‘Materials and methods’IF: 1:1000WB: 1:500 |
| Antibody | anti-rabbit Alexa 488 secondary antibody (goat polyclonal) | Life Technologies | A11034 | IF: 1:500 |
| Antibody | anti-mouse Alexa 488 secondary antibody (goat polyclonal) | Life Technologies | A11029 | IF: 1:500 |
| Antibody | anti-mouse Alexa 546 secondary antibody (goat polyclonal) | Life Technologies | A11030 | IF: 1:500 |
| Antibody | anti-mouse Alexa 647 secondary antibody (goat polyclonal) | Life Technologies | A21236 | IF: 1:500 |
| Antibody | anti-rabbit IgG, HRP-linked Antibody (goat polyclonal) | Cell Signaling | 7074 | WB: 1:5000 |
| Antibody | anti-GFP (rabbit polyclonal) | Thermo Fisher Scientific | A11122 | WB: 1:500 |
| Antibody | anti-Strn3 (rabbit polyclonal) | Thermo Fisher Scientific | PA5-31368 | WB: 1:1000 |
| Antibody | anti β-actin (mouse monoclonal) | Merck Millipore | A5441 | WB: 1:5000 |
| Antibody | anti β-actin (rabbit polyclonal) | Abcam | AB8227 | WB: 1:5000 |
| Recombinant DNA reagent | pTol2[ptf1a:mCherry-CAAX](plasmid) | This paper | N/A | See ‘Materials and methods’ |
| Recombinant DNA reagent | pG1[ptf1a:GFP](plasmid) | PMID: 23035102 | N/A | Francesco Argenton Laboratory (University of Padova) |
| Recombinant DNA reagent | pTol2[hsp:WT.Strip1-GFP](plasmid) | This paper | N/A | See ‘Materials and methods’ |
| Recombinant DNA reagent | pTol2[hsp:Mut.Strip1-GFP](plasmid) | This paper | N/A | See ‘Materials and methods’ |
| Recombinant DNA reagent | pBluescript SK (+)(plasmid) | Stratagene | N/A | |
| Recombinant DNA reagent | pT2AL200R150G(plasmid) | PMID: 16959904 | N/A | Dr. Koichi Kawakami (Institute of Genetics) |
| Recombinant DNA reagent | pB[ath5:Gal4-VP16](plasmid) | This paper | N/A | See ‘Materials and methods’ |
| Recombinant DNA reagent | pZNYX-Gal4VP16(plasmid) | PMID: 17020638 | N/A | Rachel Wong Laboratory(University of Washington) |
| Sequence-based reagent | Standard control MO (STD-MO) | GeneTools | N/A | 5′-CCTCTTACCTCAGTTACAATTTATA-3′Same concentration for each MO experiment |
| Sequence-based reagent | Strip1 morpholino (MO-strip1) | GeneTools | N/A | 5′- TAGCACATAAACCGACACCGTCCAT-3′250 μM |
| Sequence-based reagent | Ath5 morpholino (MO-ath5) | GeneTools | ZDB-MRPHLNO-100405-2 | 5′-TTCATGGCTCTTCAAAAAAGTCTCC-3′250 μM |
| Sequence-based reagent | Striatin3 morpholino (MO-strn3) | GeneTools | N/A | 5′- CCTGCTAGAAGTCGCCGATTGTTAC -3′250 μM |
| Sequence-based reagent | Jun morpholino (MO-jun) | GeneTools | ZDB-MRPHLNO-080908-1 | 5′- CTTGGTAGACATAGAAGGCAAAGCG -3′125 μM |
| Peptide, recombinant protein | Cas9 protein | FASMAC | GE-006-S | |
| Commercial assay or kit | JB-4 Embedding Kit | Polysciences | 00226-1 | |
| Commercial assay or kit | In Situ Cell Death Detection Kit, TMR Red | Roche | 12156792910 | |
| Commercial assay or kit | In Situ Cell Death Detection Kit, Fluorescein | Roche | 11684795910 | |
| Commercial assay or kit | DIG RNA Labeling Kit | Roche | 11277073910 | |
| Commercial assay or kit | GFP Trap Agarose | Chromotek | gta-20 | |
| Commercial assay or kit | Arcturus PicoPure RNA Isolation Kit | Thermo Fisher Scientific | KIT0204 | |
| Commercial assay or kit | NEB Next Ultra II Directional RNA Library Prep Kit | New England BioLabs | E7760L | |
| Chemical compound, drug | Acridine Orange (AO) | Nacalai tesque | 1B-307 | 5 μg/ml |
| Chemical compound, drug | CellTrace BODIPY TR Methyl Ester | Thermo Fisher Scientific | C34556 | 100 nM |
| Chemical compound, drug | Ethyl-3-aminobenzoate de methanesulfonate (Tricaine, MS-222) | Nacalai tesque | 14805-82 | 0.02% |
| Chemical compound, drug | PTU (N-Phenylthiourea) | Nacalai tesque | 27429-22 | 0.003% |
| Chemical compound, drug | Fast DiO solid | Thermo Fisher Scientific | D3898 | 2 mg/ml |
| Chemical compound, drug | Fast DiI solid | Thermo Fisher Scientific | D7756 | 2 mg/ml |
| Chemical compound, drug | TO-PRO-3 Iodide (642/661) | Thermo Fisher Scientific | T3605 | 1 nM |
| Chemical compound, drug | Hoechst 33,342 | Wako | 346-07951 | 1 ng/ml |
| Chemical compound, drug | Toluidine Blue | Nacalai tesque | 1B-481 | |
| Chemical compound, drug | Dextran, Tetramethylrhodamine | Thermo Fisher Scientific | D1817 LTJ | |
| Chemical compound, drug | Dextran, Alexa Flour-488 | Thermo Fisher Scientific | D22910 | |
| Chemical compound, drug | Dextran, Alexa Flour-647 | Thermo Fisher Scientific | D22914 | |
| Chemical compound, drug | Dextran, Cascade Blue | Thermo Fisher Scientific | D1976 | |
| Software, algorithm | chopchop | chopchop | https://chopchop.cbu.uib.no | |
| Software, algorithm | ImageJ (Fiji) | PMID: 22930834 | https://imagej.nih.gov/ij/; RRID: SCR_003070 | |
| Software, algorithm | Imaris | Bitplane | http://www.bitplane.com/imaris; RRID: SCR_007370 | |
| Software, algorithm | Proteome Discoverer | Thermo | https://www.thermofisher.com/store/products/OPTON-30945#/OPTON-30945 | |
| Software, algorithm | STRING | PMID: 27924014 | https://string-db.org | |
| Software, algorithm | Metascape | PMID: 30944313 | https://metascape.org | |
| Software, algorithm | BioVenn | PMID: 18925949 | http://www.biovenn.nl/ | |
| Software, algorithm | GraphPad Prism v9.1.0. | GraphPad Prism | https://www.graphpad.com/scientific-software/prism/ |
Additional files
Download links
A two-part list of links to download the article, or parts of the article, in various formats.
Downloads (link to download the article as PDF)
Open citations (links to open the citations from this article in various online reference manager services)
Cite this article (links to download the citations from this article in formats compatible with various reference manager tools)
Strip1 regulates retinal ganglion cell survival by suppressing Jun-mediated apoptosis to promote retinal neural circuit formation
eLife 11:e74650.
https://doi.org/10.7554/eLife.74650


