Metformin abrogates pathological TNF-α-producing B cells through mTOR-dependent metabolic reprogramming in polycystic ovary syndrome
- Institute of Reproductive and Stem Cell Engineering, School of Basic Medical Science, Central South University, China
- National Engineering and Research Center of Human Stem Cells, China
- Hunan Guangxiu Hi-tech Life Technology Co. Ltd, China
- Guangxiu Hospital, Hunan Normal University, China
- Clinical Research Center for Reproduction and Genetics in Hunan Province, Reproductive and Genetic Hospital of CITIC-Xiangya, China
- NHC Key Laboratory of Human Stem Cell and Reproductive Engineering, Central South University, China
Figures
Figure 1
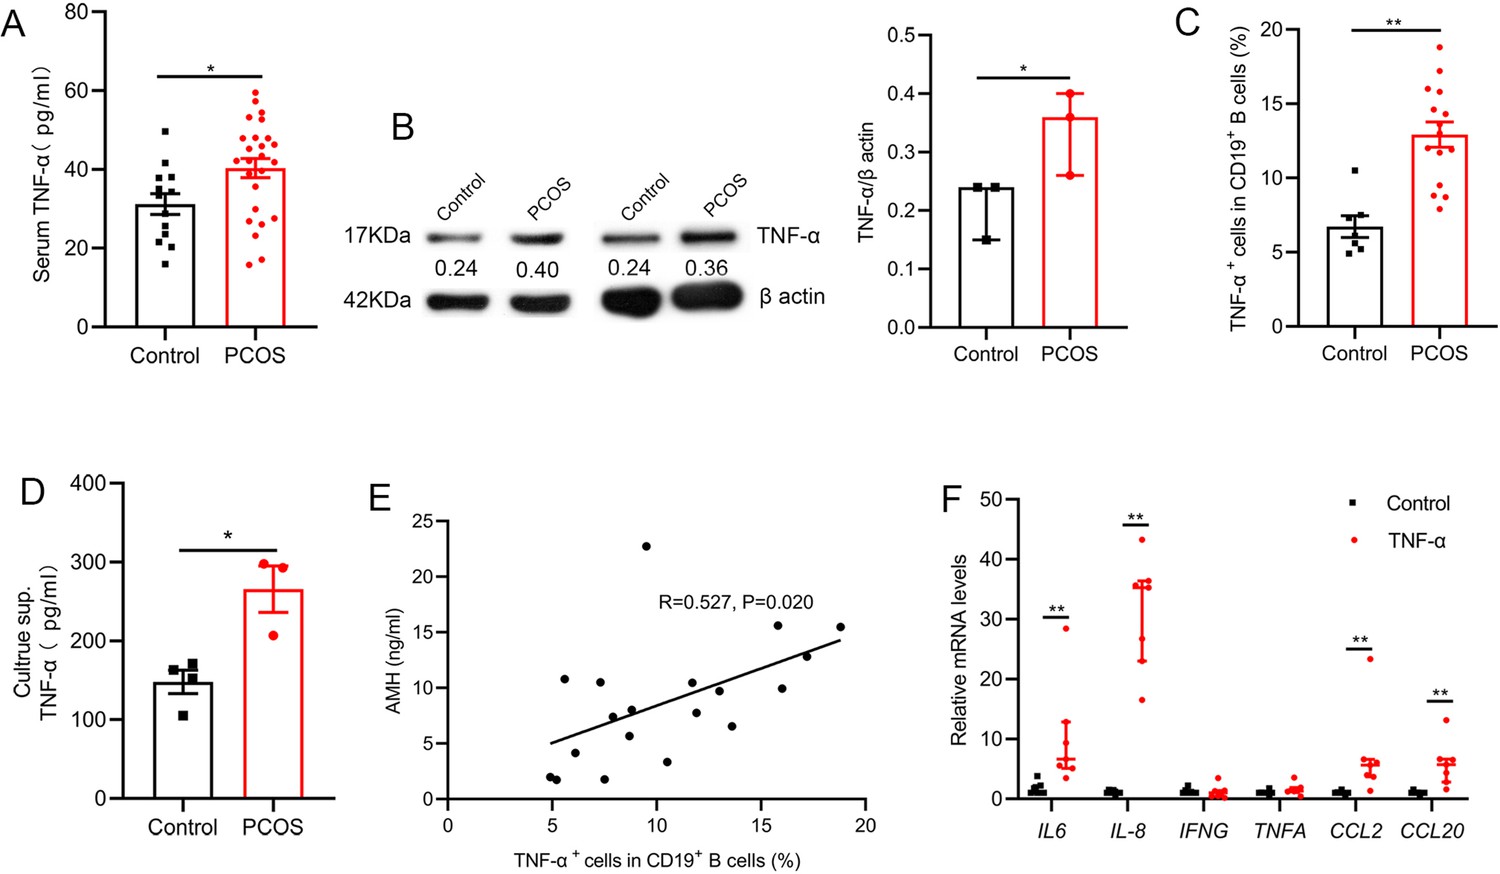
Tumor necrosis factor-alpha (TNF-α) production by pathological B cells in women with polycystic ovary syndrome (PCOS).
(A) Serum TNF-α concentration was assessed with multiplex assays (n=13 [control] and 25 [PCOS]). (B) TNF-α expression in CD19+ B cells was determined by Western blot. Shown are representative images and quantification analysis of the ratio of TNF-α/β actin (n=3 per group). (C) Percentage of TNF-α+ cells in CD19+ B cells from peripheral blood (PB) stimulated with CpG, CD40L plus anti-IgM/IgA/IgG (n=7 [control] and 15 [PCOS]) was assessed by flow cytometric analysis. (D) TNF-α in the culture supernatants (sup.) was assessed by ELISA (n=3–4 per group). (E) The correlation between the percentage of TNF-α+ cells in CD19+ B cells and serum AMH levels by Pearson’s correlation analyses (n=19). (F) Interleukin-6 (IL-6), IL-8, IFNG, TNFA, CCL2, and CCL20 mRNAs expression levels in granulosa cells were measured by qPCR (n=7 per group). For (A), (C), and (D), p values were determined by two-tailed Student’s t-test and data are presented as means ± SEM. For (B) and (F), p values were determined by two-tailed Mann-Whitney U-test and data are presented as medians with interquartile ranges. *p<0.05; **p<0.01.
-
Figure 1—source data 1
Data points for graphs in Figure 1.
- https://cdn.elifesciences.org/articles/74713/elife-74713-fig1-data1-v2.pdf
Figure 2 with 1 supplement

Metformin inhibits tumor necrosis factor-alpha (TNF-α) production by pathological B cells in polycystic ovary syndrome (PCOS).
(A–C) B cells isolated from peripheral blood (PB) of women with PCOS were cultured in RPMI-1640 medium supplemented with B cell-targeted activator (CD40L, CpG plus anti-IgM/IgA/IgG) with or without metformin (12.5 mM, Met) for 48 hr in vitro. (A) TNF-α expression in CD19+ B cells by Western blot. Shown are representative images and quantification analysis of the ratio of TNF-α/β actin (n=4 per group). (B) Percentage of TNF-α+ cells in CD19+ B cells by flow cytometric analysis (n=6 per group). (C) TNFA mRNA expression levels in B cells (n=6 per group). (D) Percentage of TNF-α+ cells in CD19+ B cells from women with PCOS, before (pre) and after (post) treatment with metformin for 1 month (n=3 per group). For (A), (B), and (C), p values were determined by two-tailed Student’s t-test and data are presented as means ± SEM. For (D), p values were determined by two-tailed Mann-Whitney U-test and data are presented as medians with interquartile ranges. *p<0.05; **p<0.01.
-
Figure 2—source data 1
Data points for graphs in Figure 2 and its supplements.
- https://cdn.elifesciences.org/articles/74713/elife-74713-fig2-data1-v2.pdf
Figure 2—figure supplement 1
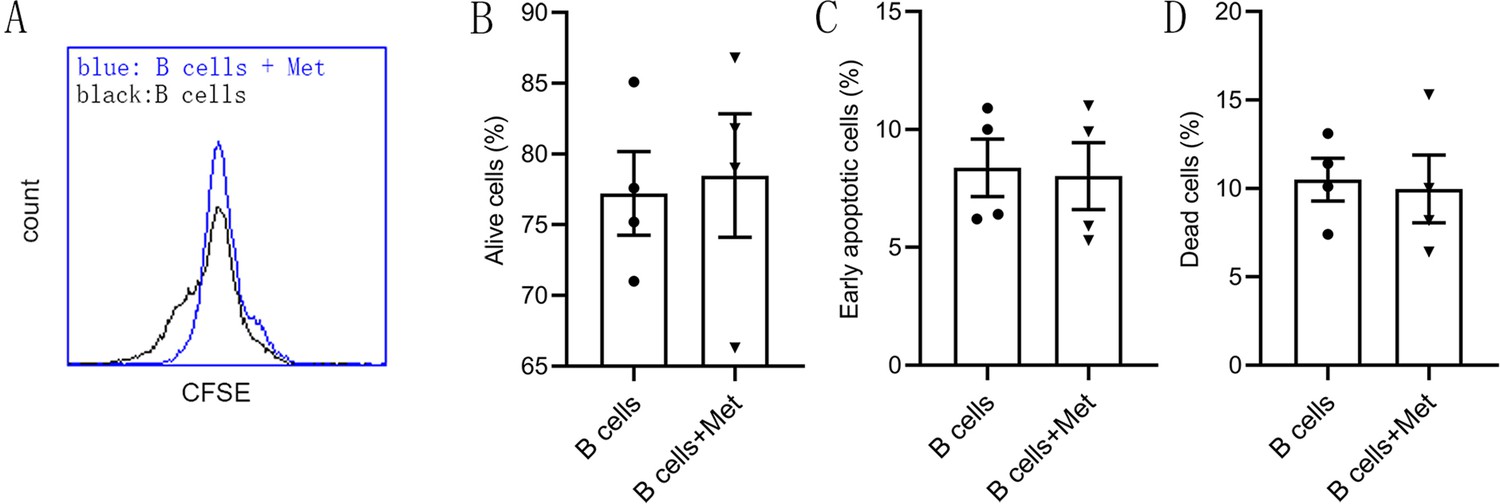
Metformin does not affect B cell proliferation and apoptosis.
(A–D) B cells isolated from peripheral blood (PB) of women with PCOS were cultured in RPMI-1640 medium supplemented B cell-targeted activator (CD40L, CpG plus anti-IgM/IgA/IgG) with or without metformin (12.5 mM, Met) for 48 hr in vitro. (A) Representative images of cell proliferation by CFSE staining. (B–D) The ratios of alive, early apoptotic and dead cells in B cells by flow cytometry (n=4 per group). For (B), (C), and (D), p values were determined by two-tailed Student’s t-test and data are presented as means ± SEM.
Figure 3

Metformin inhibits mechanistic target of rapamycin (mTOR) phosphorylation in pathological B cells.
(A–D) Western blot of representative images and quantification analysis of the ratios of phosphorylated (P-) AMPK (S487)/AMPK, P-PI3K p85 (Tyr458)/PI3K p85, and P-mTOR (S2481)/mTOR in B cells isolated from peripheral blood (PB) of women with polycystic ovary syndrome (PCOS) (n=3 per group). (E–H) Western blot of representative images and quantification analysis of the ratios of P-AMPK (S487)/AMPK, P-PI3K p85 (Tyr458)/PI3K p85, and P-mTOR (S2481)/mTOR in stimulated peripheral blood B cells from women with PCOS (n=3 per group) with or without metformin (12.5 mM, Met) for 48 hr in vitro. (I–J) Western blot of representative images and quantification analysis of the ratio of P-mTOR (S2481)/mTOR in B cells isolated from PB of women with PCOS, before (pre) and after (post) treatment with metformin for one month (n=3 per group). p values were determined by two-tailed Student’s t-test and data are presented as means ± SEM. *p<0.05; **p<0.01.
-
Figure 3—source data 1
Data points for graphs in Figure 3.
- https://cdn.elifesciences.org/articles/74713/elife-74713-fig3-data1-v2.pdf
Figure 4
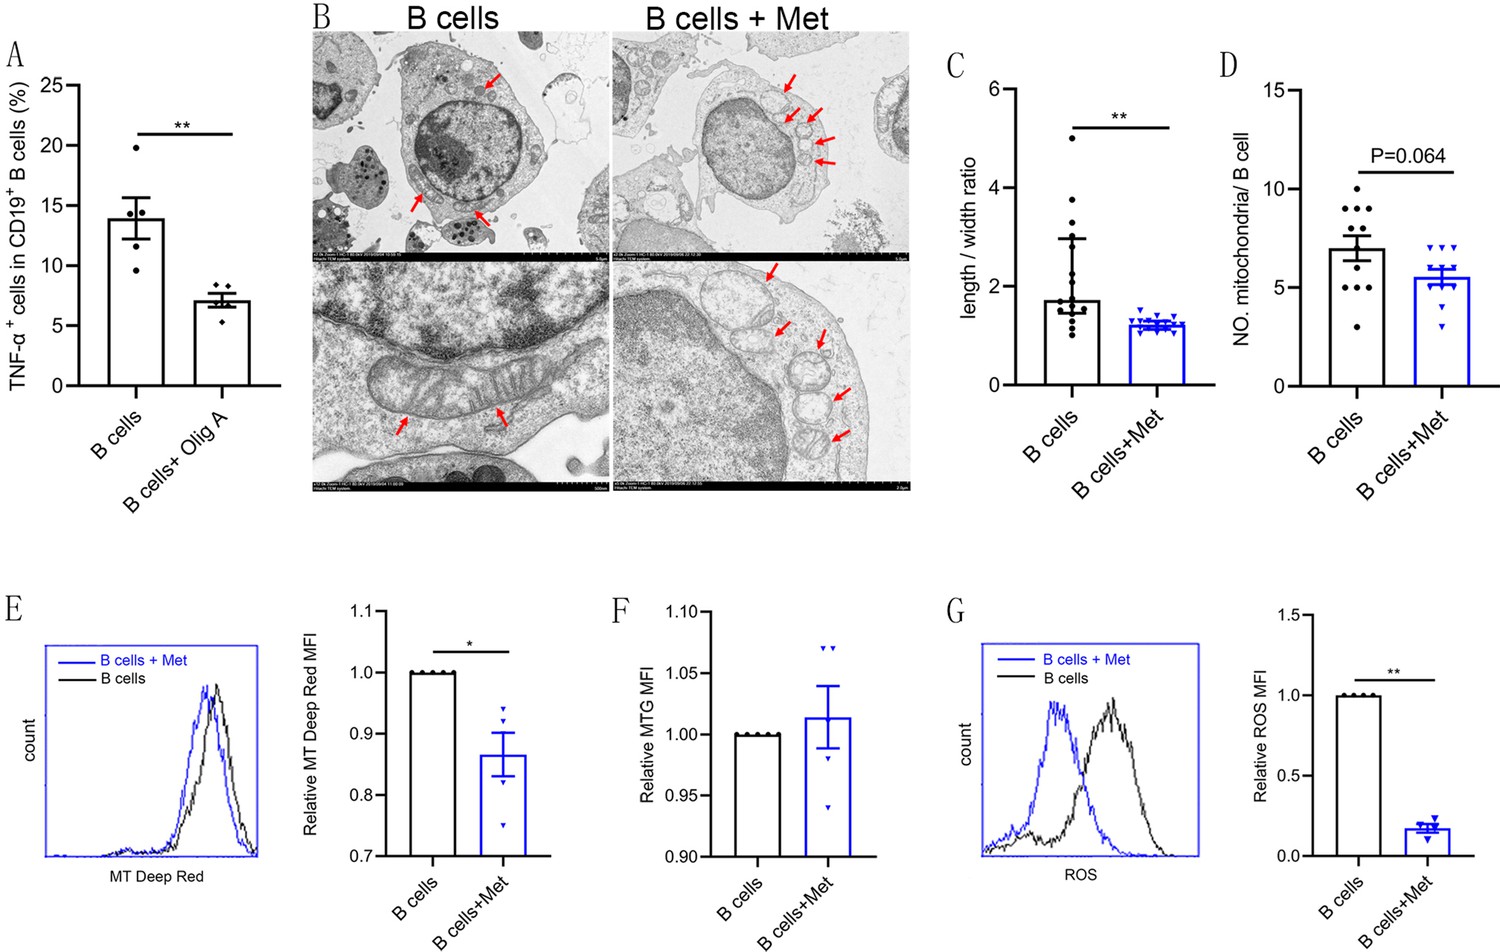
Metformin induces mitochondrial remodeling in pathological B cells.
(A) Percentage of tumor necrosis factor-alpha plus (TNF-α+) cells in CD19+ B cells from women with polycystic ovary syndrome (PCOS) stimulated with B cell-targeted activator with or without oligomycin A (100 nM, Olig A) for 48 hr (n=5 per group). (B-G) B cells isolated from peripheral blood (PB) of women with PCOS were cultured in RPMI-1640 medium supplemented B cell-targeted activator with or without metformin (12.5 mM, Met) for 48 hr in vitro. (B) Representative transmission electron microscopy images. Up: scale bar, 5 μm; down: scale bar, 500 nm. Red arrows indicate mitochondria. (C) The length/width ratio of per mitochondria in B cells (n=16 per group). (D) The numbers of mitochondria in per B cell (n=11 per group). (E) Mitochondrial membrane potential (MMP) was measured using MitoTracker (MT) Deep Red by flow cytometric analysis. Shown are representative images and quantification analysis of the MT Deep Red (n=5 per group). (F) Mitochondrial mass was measured using MitoTracker Green (MTG) by flow cytometric analysis (n=5 per group). (G) ROS was measured by flow cytometric analysis. Shown are representative images and quantification analysis of the ROS level (n=4 per group). For (A) and (D), p values were determined by two-tailed Student’s t-test and data are presented as means ± SEM. For (C), p values were determined by two-tailed Mann-Whitney U-test and data are presented as medians with interquartile ranges. For (E), (F), and (G), p values were determined by two-tailed paired-samples t-test and data are presented as means ± SEM. *p<0.05; **p<0.01.
-
Figure 4—source data 1
Data points for graphs in Figure 4.
- https://cdn.elifesciences.org/articles/74713/elife-74713-fig4-data1-v2.pdf
Figure 5
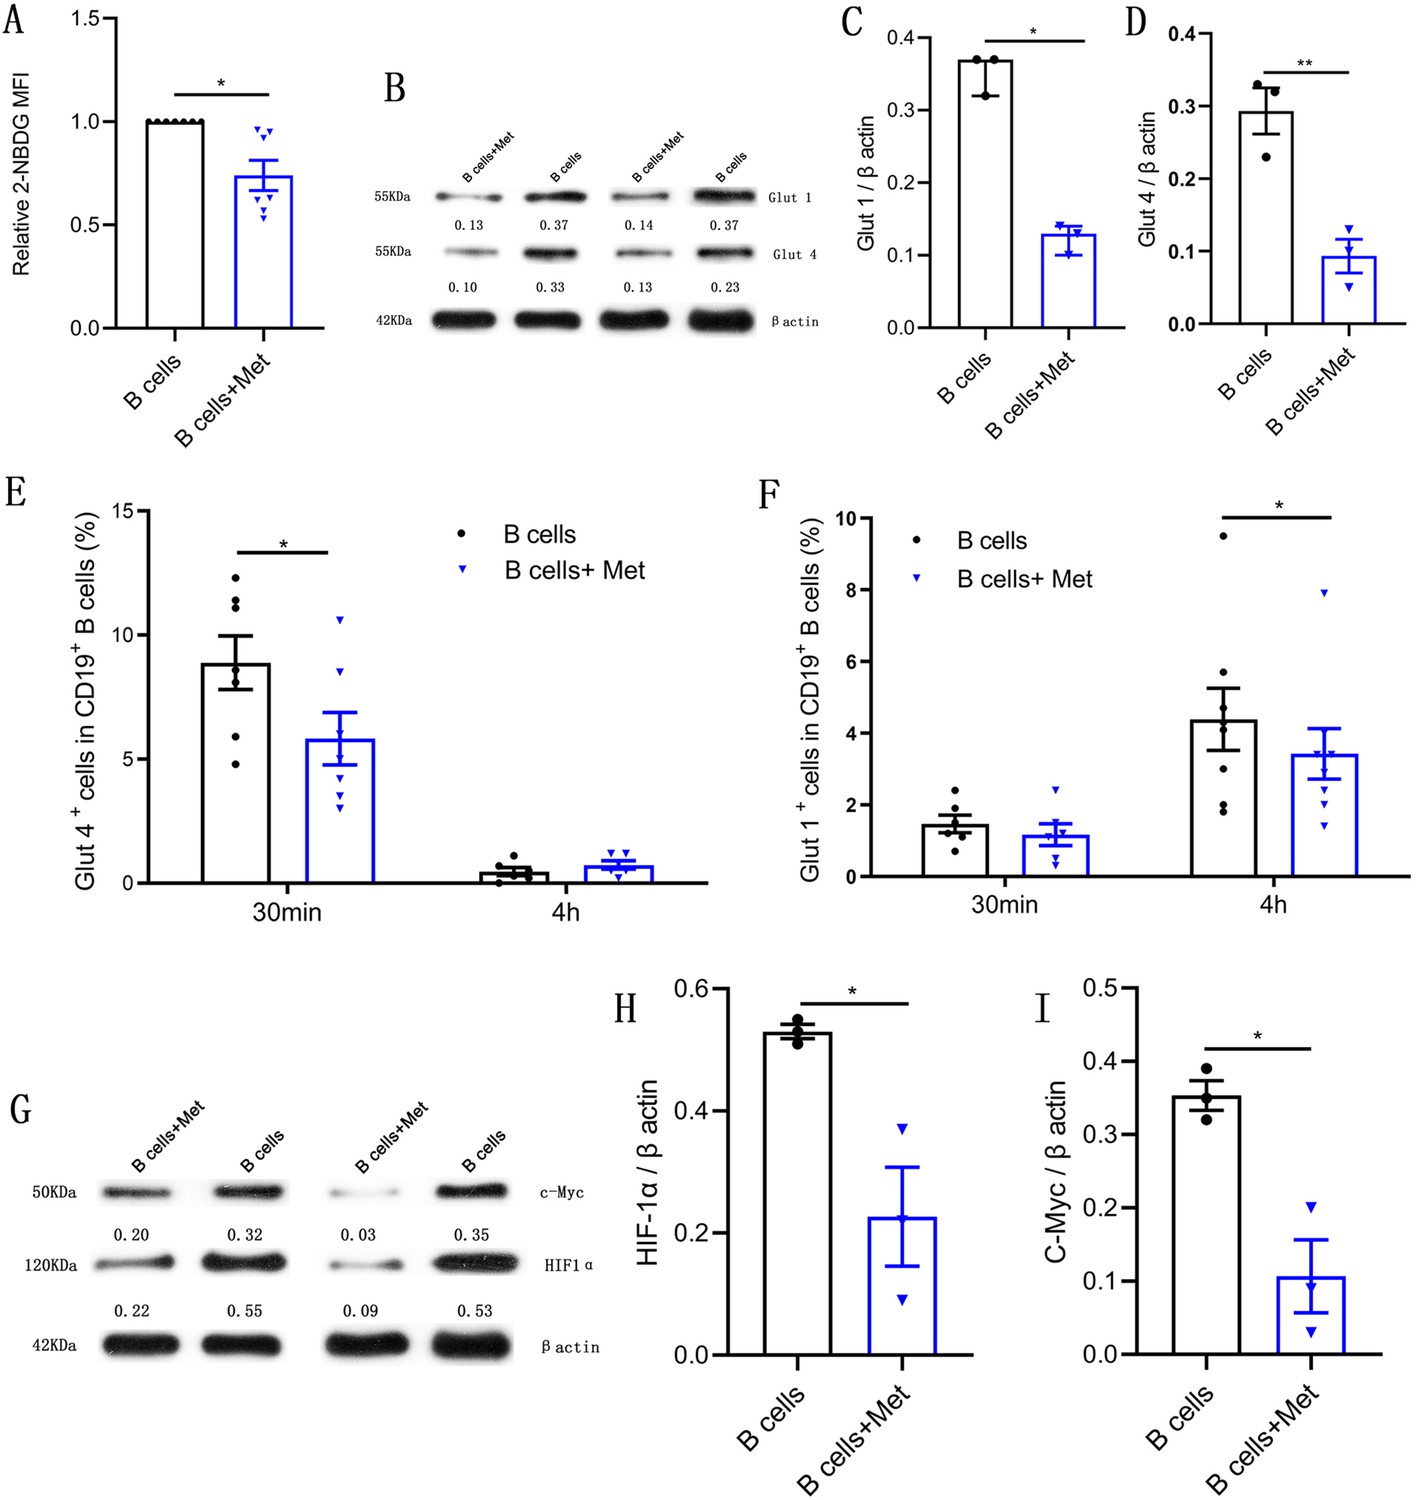
Metformin reduces glucose uptake in pathological B cells.
(A-D) and (G-I) B cells isolated from peripheral blood (PB) of women with polycystic ovary syndrome (PCOS) were cultured in RPMI-1640 medium supplemented with B cell-targeted activator with or without metformin (12.5 mM, Met) for 48 hr in vitro. (A) Glucose uptake was measured using 2-NBDG by flow cytometric analysis (n=7 per group). (B-D) Glut 1 and Glut 4 expression in CD19+ B cells by Western blot. Shown are representative images and quantification analysis of ratios of Glut 1/β actin (C) and Glut 4/β actin (D) (n=3 per group). (E-F) Percentage of Glut 1+ cells and Glut 4+ cells in CD19+ B cells from women with PCOS were cultured in B cell culture medium with or without metformin (12.5 mM, Met) for 30 min and 4 hr (n=6–8 per group). (G-I) HIF1α and c-Myc expression in CD19+ B cells by Western blot. Shown are representative images and quantification analysis of ratios of HIF1α /β actin (H) and c-Myc /β actin (I) (n=3 per group). For (A), (E), (F), and (J), p values were determined by two-tailed paired-samples t-test and data are presented as means ± SEM. For (C), p values were determined by two-tailed Mann-Whitney U-test and data are presented as medians with interquartile ranges. For (D), (H), and (I), p values were determined by two-tailed Student’s t-test and data are presented as means ± SEM. *p<0.05; **p<0.01.
-
Figure 5—source data 1
Data points for graphs in Figure 5.
- https://cdn.elifesciences.org/articles/74713/elife-74713-fig5-data1-v2.pdf
Figure 6

Rapamycin inhibits tumor necrosis factor-alpha (TNF-α) production, induces mitochondrial remodeling, and reduces glucose uptake in pathological B cells.
(A) Percentage of TNF-α+ cells in CD19+ B cells from women with polycystic ovary syndrome (PCOS) stimulated with B cell-targeted activator with or without rapamycin (5 μM, Rapa) for 24 hr or 48 hr (n=3–6 per group). (B–E) B cells isolated from peripheral blood (PB) of women with PCOS were cultured in RPMI-1640 medium supplemented B cell-targeted activator with or without rapamycin (5μΜ, Rapa) for 48 hr and rapamycin was added to the culture medium on the first day (24 hr). (B) Mitochondrial membrane potential measured using Mito Tracker (MT) Deep Red by flow cytometric analysis (n=3 per group). (C) Mitochondrial mass measured using MitoTracker Green (MTG) by flow cytometric analysis (n=3 per group). (D) ROS measured by flow cytometric analysis (n=3 per group). (E) 2-NBDG measured by flow cytometric analysis (n=3 per group). For (A), p values were determined by two-tailed Student’s t-test and data are presented as means ± SEM. For (B), (C), (D), and (E), p values were determined by two-tailed paired-samples t-test and data are presented as means ± SEM. *p<0.05; **p<0.01.
-
Figure 6—source data 1
Data points for graphs in Figure 6.
- https://cdn.elifesciences.org/articles/74713/elife-74713-fig6-data1-v2.pdf
Figure 7
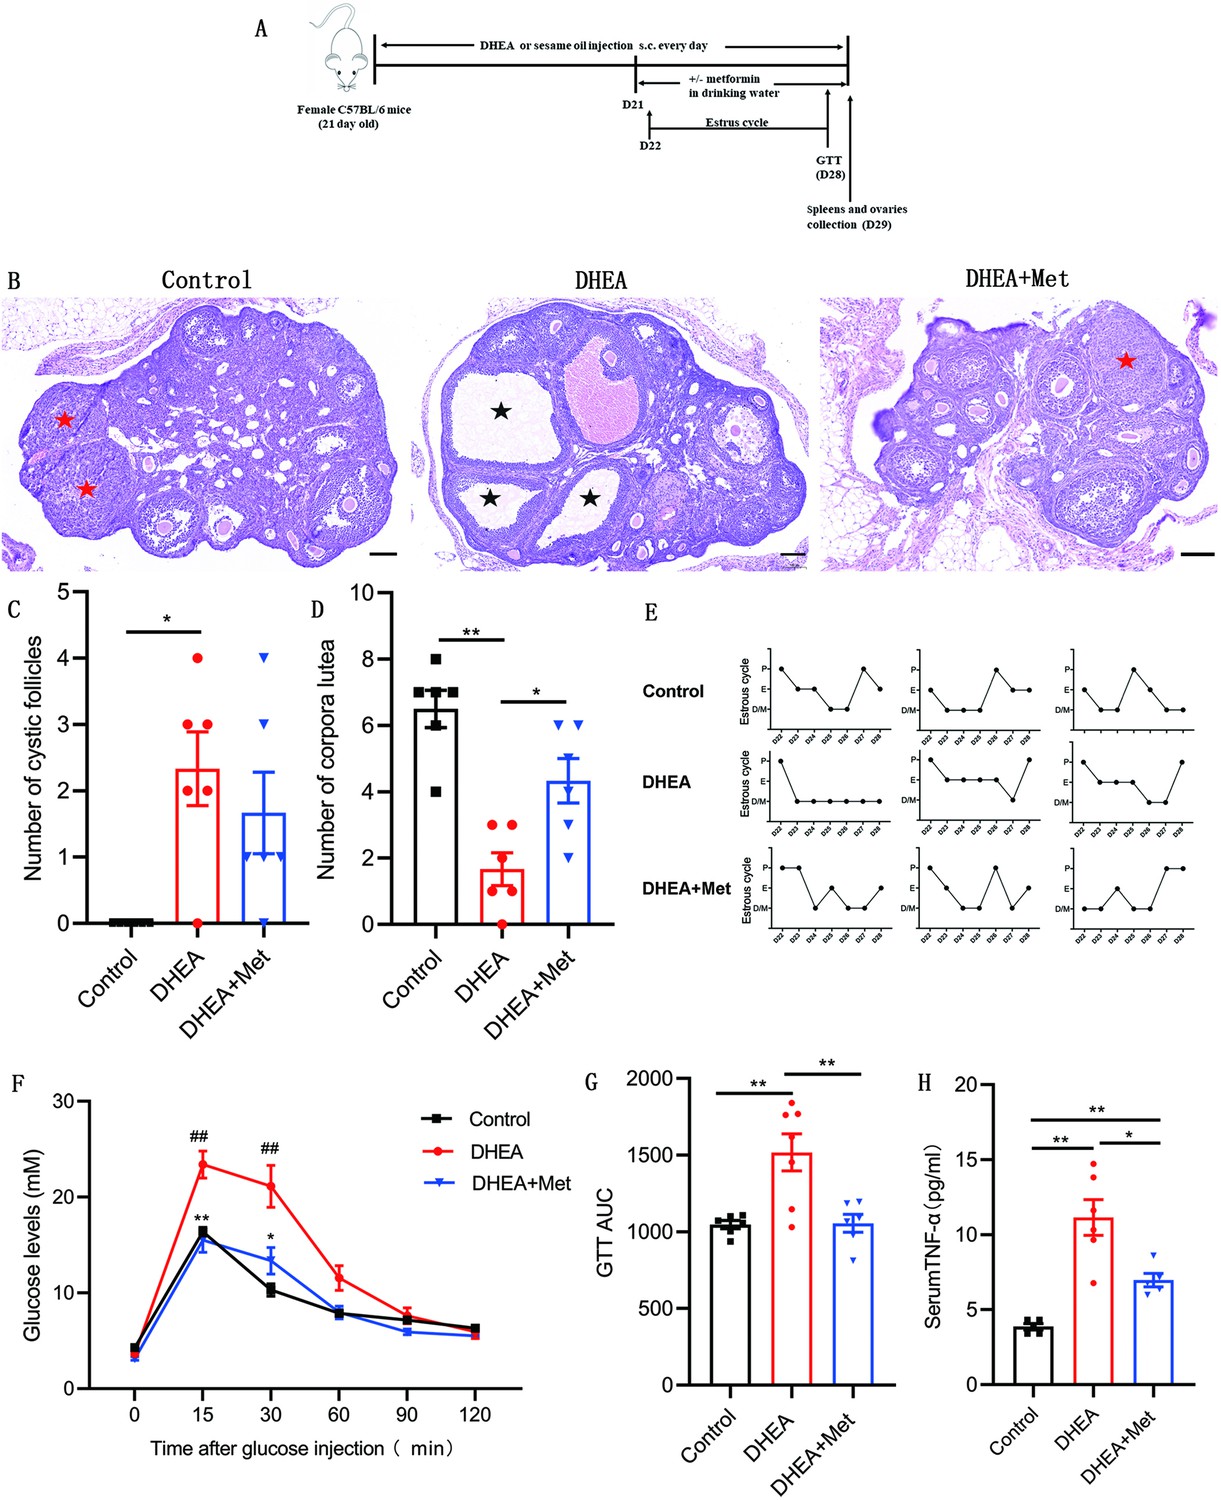
Metformin treatment improves the polycystic ovary syndrome (PCOS) pathological phenotypes in dehydroepiandrosterone (DHEA)-induced mice.
(A) Schematic diagram of the experimental protocols for metformin in the treatment of DHEA-induced PCOS mice. (B) Representative ovary sections with Hematoxylin and eosin staining. Black asterisks indicate cystic follicles, and red asterisks indicate corpora lutea. Scale bar: 100 μm. (C) Quantitative analysis of cystic follicles (n=4–6 mice per group). (D) Quantitative analysis of corpora lutea (n=4–6 mice per group). (E) Representative estrous cycles. (F) Glucose tolerance test (GTT) (n=4–6 mice per group). (G) GTT area under the curve (GTT AUC) (n=4–6 mice per group). (H) Serum tumor necrosis factor-alpha (TNF-α) concentrations were assessed with multiplex assays (n=4–6 mice per group). p values were determined by one-way ANOVA with Bonferroni’s multiple comparison post-hoc test and data are presented as means ± SEM. *p<0.05; **p<0.01. For F, *p<0.05; **p<0.01 DHEA + metformin (Met) versus DHEA. #p<0.05; ##p<0.01 DHEA versus the control.
-
Figure 7—source data 1
Data points for graphs in Figure 7.
- https://cdn.elifesciences.org/articles/74713/elife-74713-fig7-data1-v2.pdf
Figure 8
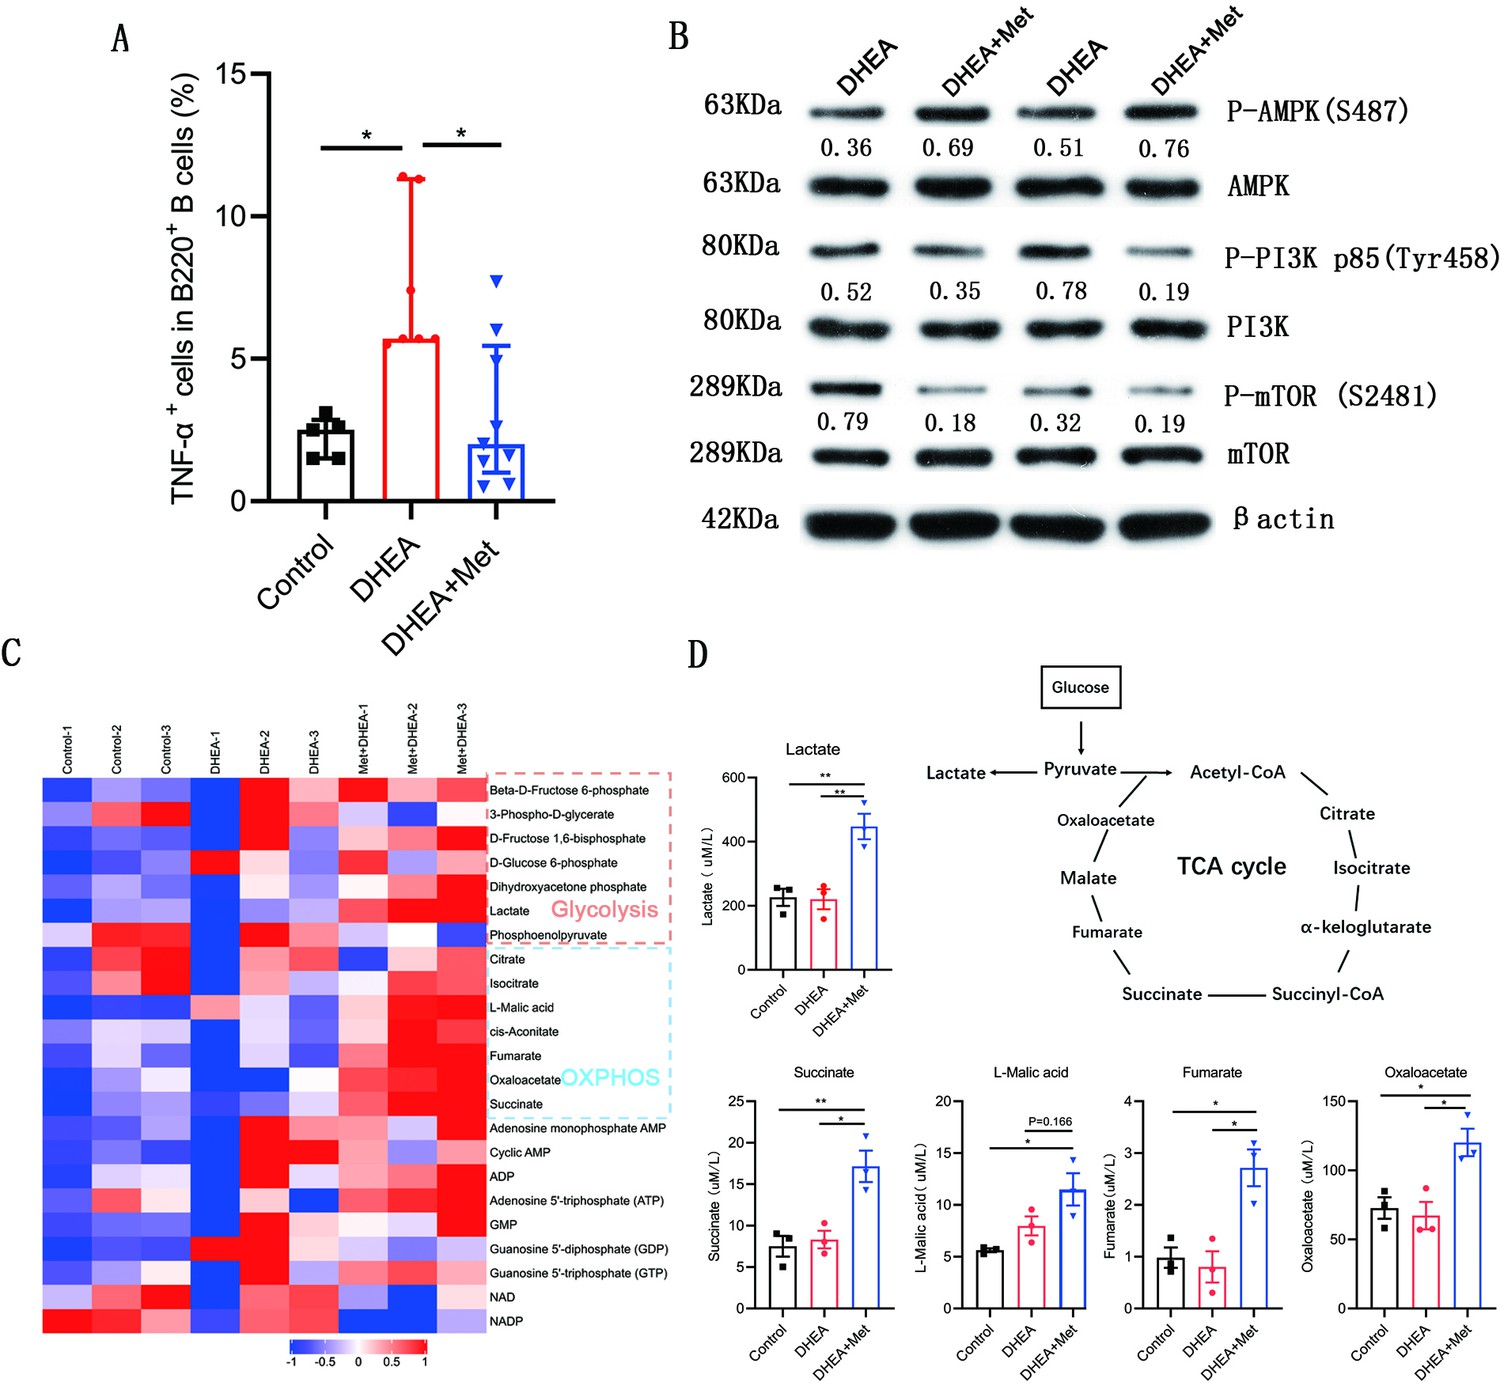
Metformin inhibits tumor necrosis factor-alpha (TNF-α) production, alters AMPK/PI3K/mTOR phosphorylation and induces metabolic reprogramming in pathological B cells from dehydroepiandrosterone (DHEA)-induced polycystic ovary syndrome (PCOS) mice.
(A) Percentage of TNF-α+ cells in splenic CD19+ B cells by flow cytometric analysis (n=5–9 mice per group). (B) Western blot of representative images and quantification analysis of the ratios of phosphorylated (P-) AMPK (S487)/AMPK, P-PI3K p85 (Tyr458)/PI3K p85, and P-mTOR (S2481)/mTOR in splenic B cells from DHEA-induced PCOS mice (n=2 mice per group). (C) The heat-map analysis of energy metabolites in splenic B cells was analyzed by mass spectrometry (n=3 mice per group). (D) Differential energy metabolites were quantitatively analyzed by mass spectrometry (n=3 mice per group). For (A), p values were determined by Kruskal-Wallis test followed by Dunn’s post-hoc test and data are presented as medians with interquartile ranges. For (D), p values were determined by one-way ANOVA with Bonferroni’s multiple comparison post-hoc test and data are presented as means ± SEM. *p<0.05; **p<0.01.
-
Figure 8—source data 1
Data points for graphs in Figure 8.
- https://cdn.elifesciences.org/articles/74713/elife-74713-fig8-data1-v2.pdf
Figure 9
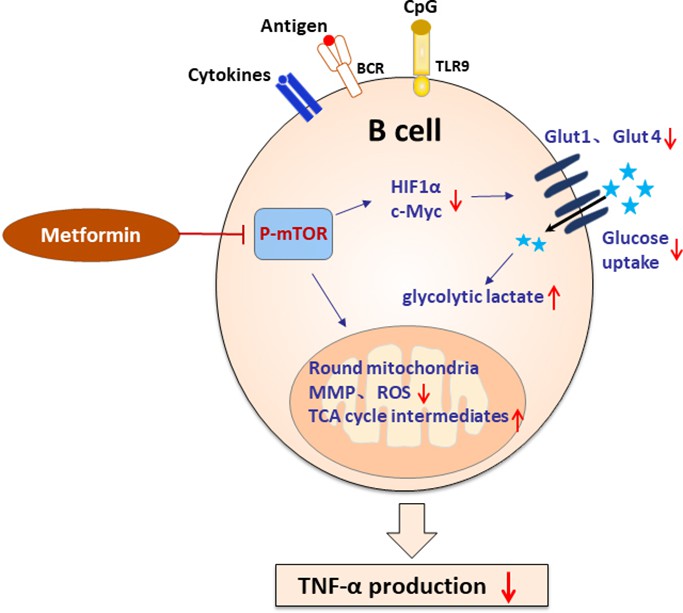
Schematic diagram of the effect of metformin on tumor necrosis factor-alpha (TNF-α)-producing B cells in polycystic ovary syndrome (PCOS).
In peripheral blood B cells from women with PCOS, metformin inhibits mechanistic target of rapamycin (mTOR) phosphorylation; reduces glucose uptake by downregulation of Glut 1 and Glut 4 expression, and the upstream transcription factors HIF1α and c-Myc; alters the mitochondrial morphology; decreases the mitochondrial membrane potential (MMP) and ROS levels. In splenic B cells from dehydroepiandrosterone (DHEA)-induced PCOS mice, metformin inhibits mTOR phosphorylation; stimulates glycolytic lactate and TCA cycle intermediates accumulation. These alterations ultimately result in the decrease of TNF-α production by pathological B cells in PCOS.
Author response image 1
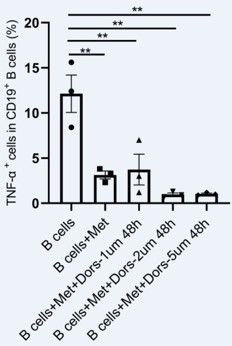
AMPK inhibitor dorsomorphin did not reverse the inhibitory effect of metformin on TNF-α production in pathological B cells from women with PCOS.
Additional files
Download links
A two-part list of links to download the article, or parts of the article, in various formats.
Downloads (link to download the article as PDF)
Open citations (links to open the citations from this article in various online reference manager services)
Cite this article (links to download the citations from this article in formats compatible with various reference manager tools)
Metformin abrogates pathological TNF-α-producing B cells through mTOR-dependent metabolic reprogramming in polycystic ovary syndrome
eLife 11:e74713.
https://doi.org/10.7554/eLife.74713


