MAF1, a repressor of RNA polymerase III-dependent transcription, regulates bone mass
- Department of Molecular and Cellular Biology, Baylor College of Medicine, United States
- Departments of Medicine and Pharmacological Sciences and Center for translational Medicine and Pharmacology, Icahn School of Medicine at Mount Sinai, United States
- Molecular Genomics Core, Eunice Kennedy Shriver National Institute of Child Health and Human Development, National Institutes of Health, United States
- Center for Clinical and Translational Research, Maine Medical Center Research Institute, United States
- Departments of Biochemistry and Systems and Computational Biology, Albert Einstein College of Medicine, United States
Figures
Figure 1 with 4 supplements
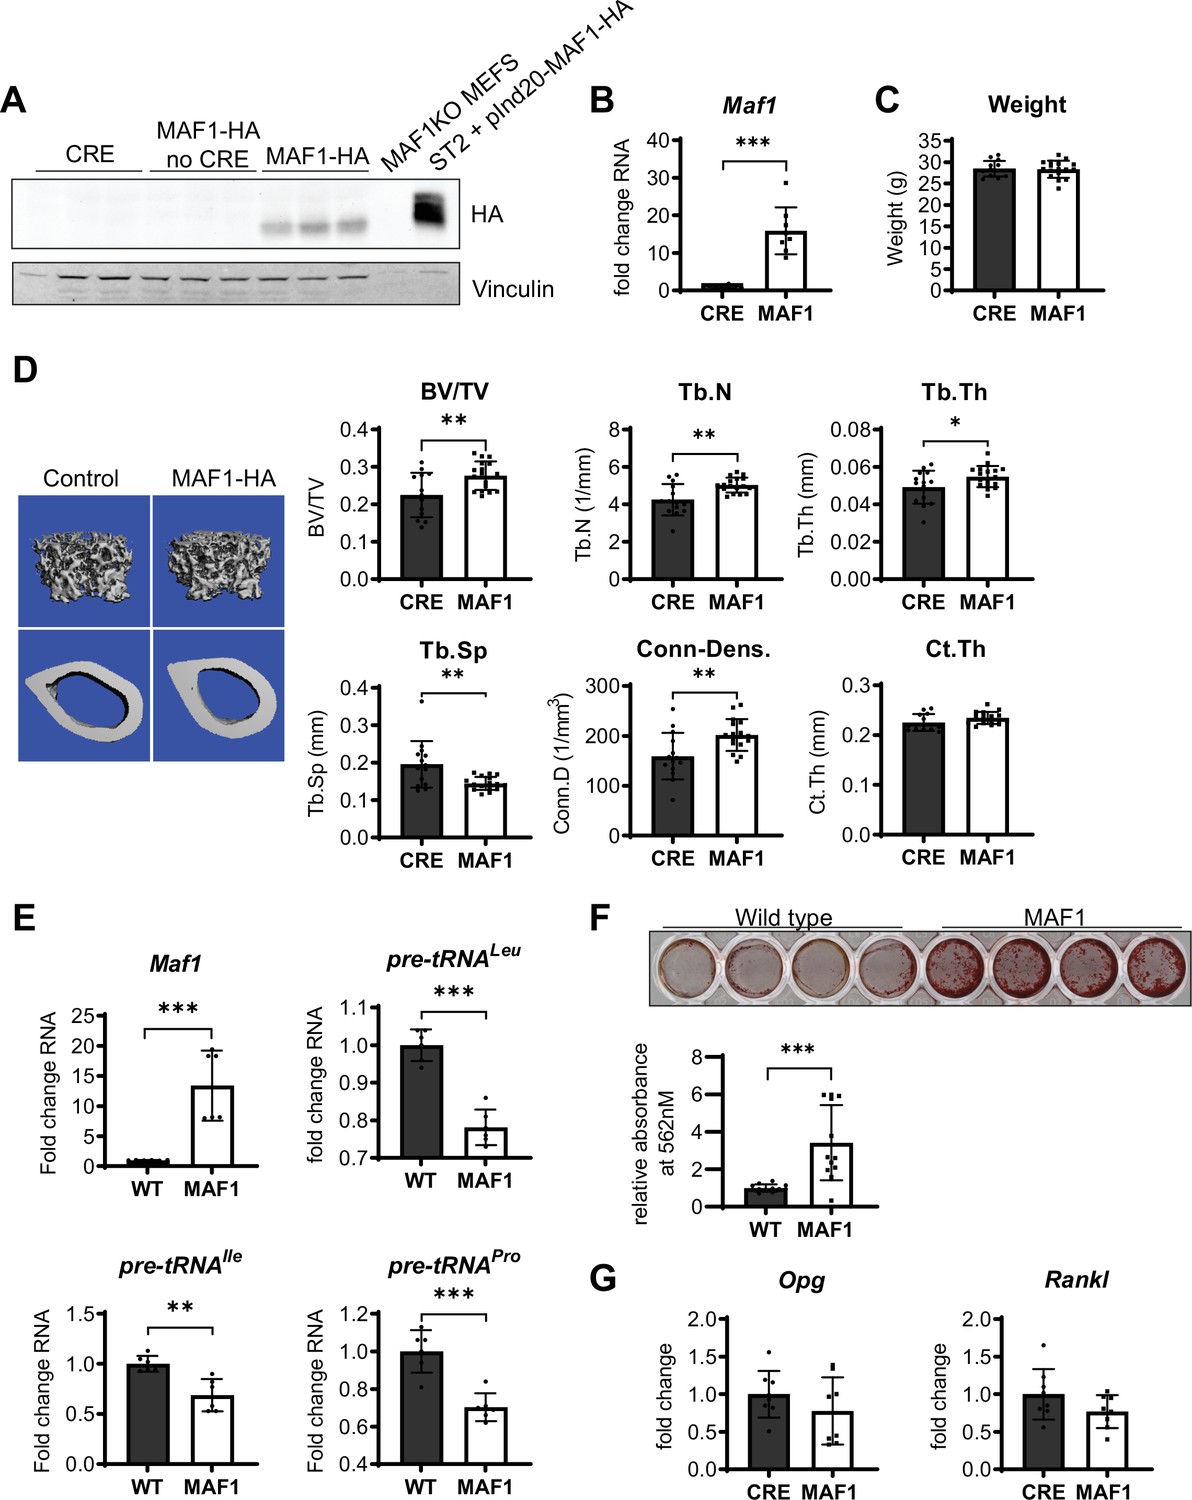
Bone-specific overexpression of MAF1-HA increases bone volume in mice.
(A) Western blot of HA expression in the femur of 12-week-old male Prx1-Cre MAF1-HA mice compared to Prx1-Cre-WT and WT-MAF1-HA mice. (B) qRT-PCR analysis showing MAF1 RNA in femurs from Prx1-Cre-MAF1 mice and control Prx1-Cre mice (n=8). (C) Weights in gram of 12-week-old Prx1-Cre or Prx1-Cre-MAF1 mice. (D) Left, representative images of µCT of femoral bone. Right, quantification of µCT analysis: bone volume/total volume (BV/TV), trabecular number (Tb.N), trabecular thickness (Tb.Th), trabecular separation (Tb.Sp), connectivity density (Conn-Dens.), and cortical thickness (Ct.Th). n=13 for Prx1-Cre and n=17 for MAF1 mice. (E) qRT-PCR of MAF1 and pre-tRNAs in primary stromal cells isolated from 6- to 8-week old WT or MAF1 overexpressing mice (n=6). (F) Representative plate of Alizarin red-labeled mineralization of WT and MAF1-HA primary stromal cells (top). Quantification of Alizarin red after destaining with 10% CPC. (G) qRT-PCR of Opg and Rankl in Prx1-Cre and MAF1 overexpressing femurs at 12 weeks (n=8). Results represent means ± SD, *p<0.05, **p<0.01, ***p<0.001 determined by Student’s t-test. Figure 1—source data 1 contains uncropped images of western blots.
-
Figure 1—source data 1
Immunoblot analysis 1.
- https://cdn.elifesciences.org/articles/74740/elife-74740-fig1-data1-v2.zip
Figure 1—figure supplement 1
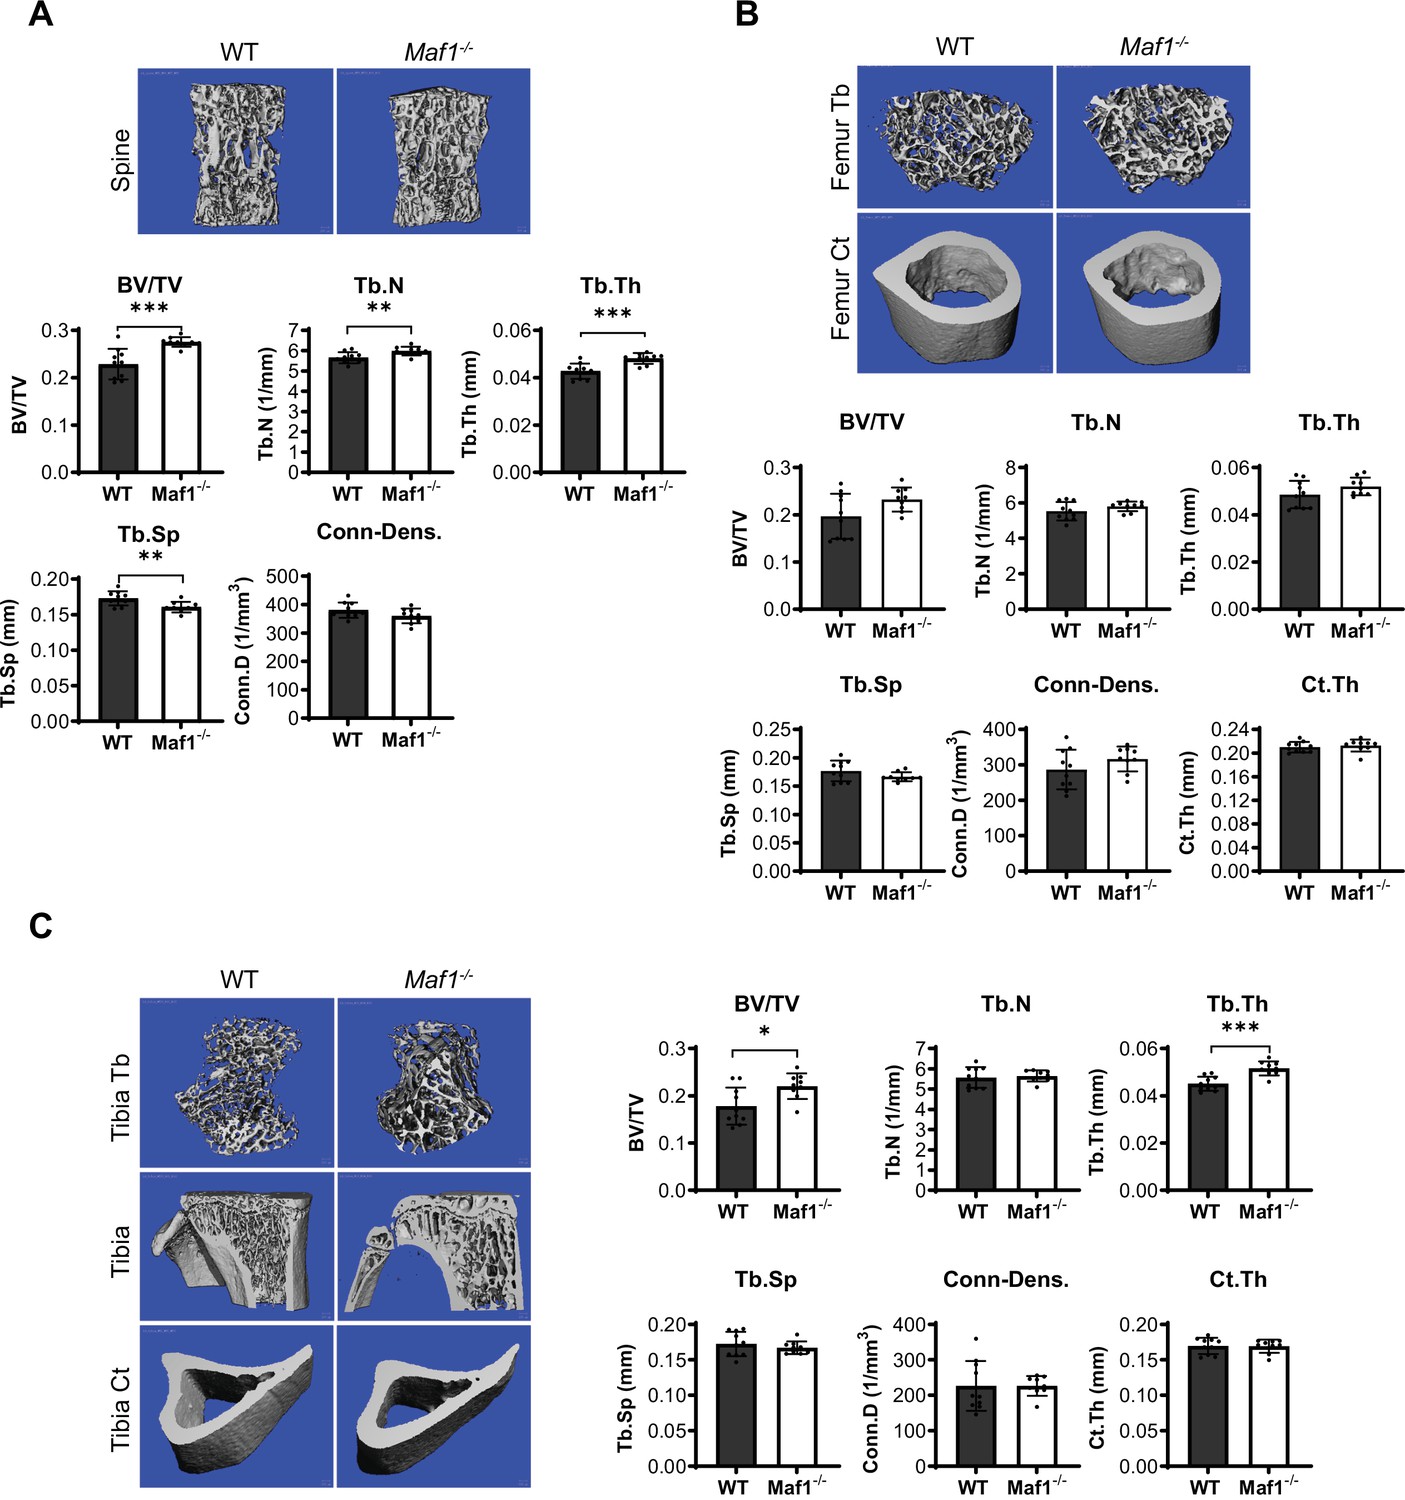
Maf1-/- mice show increased bone mass in the spine.
Spines, femurs, and tibiae were taken from 12-week-old male Maf1-/- mice or their WT counterparts. µCT measurements from the spine (A), the femoral bone (B), or the tibia (C). Representative images of µCT of the spine (top) (A), femur (top) (B), or tibia (left) (C). Quantification of µCT analysis bottom for spine (A), femur (B), or right (C): bone volume/total volume (BV/TV), trabecular number (Tb.N), trabecular thickness (Tb.Th), trabecular separation (Tb.Sp), connectivity density (Conn-Dens.), and cortical thickness (Ct.Th). WT n=10 Maf1-/- n=9. Results represent means ± SD, *p<0.05, **p<0.01, ***p<0.001 determined by Student’s t-test.
Figure 1—figure supplement 2
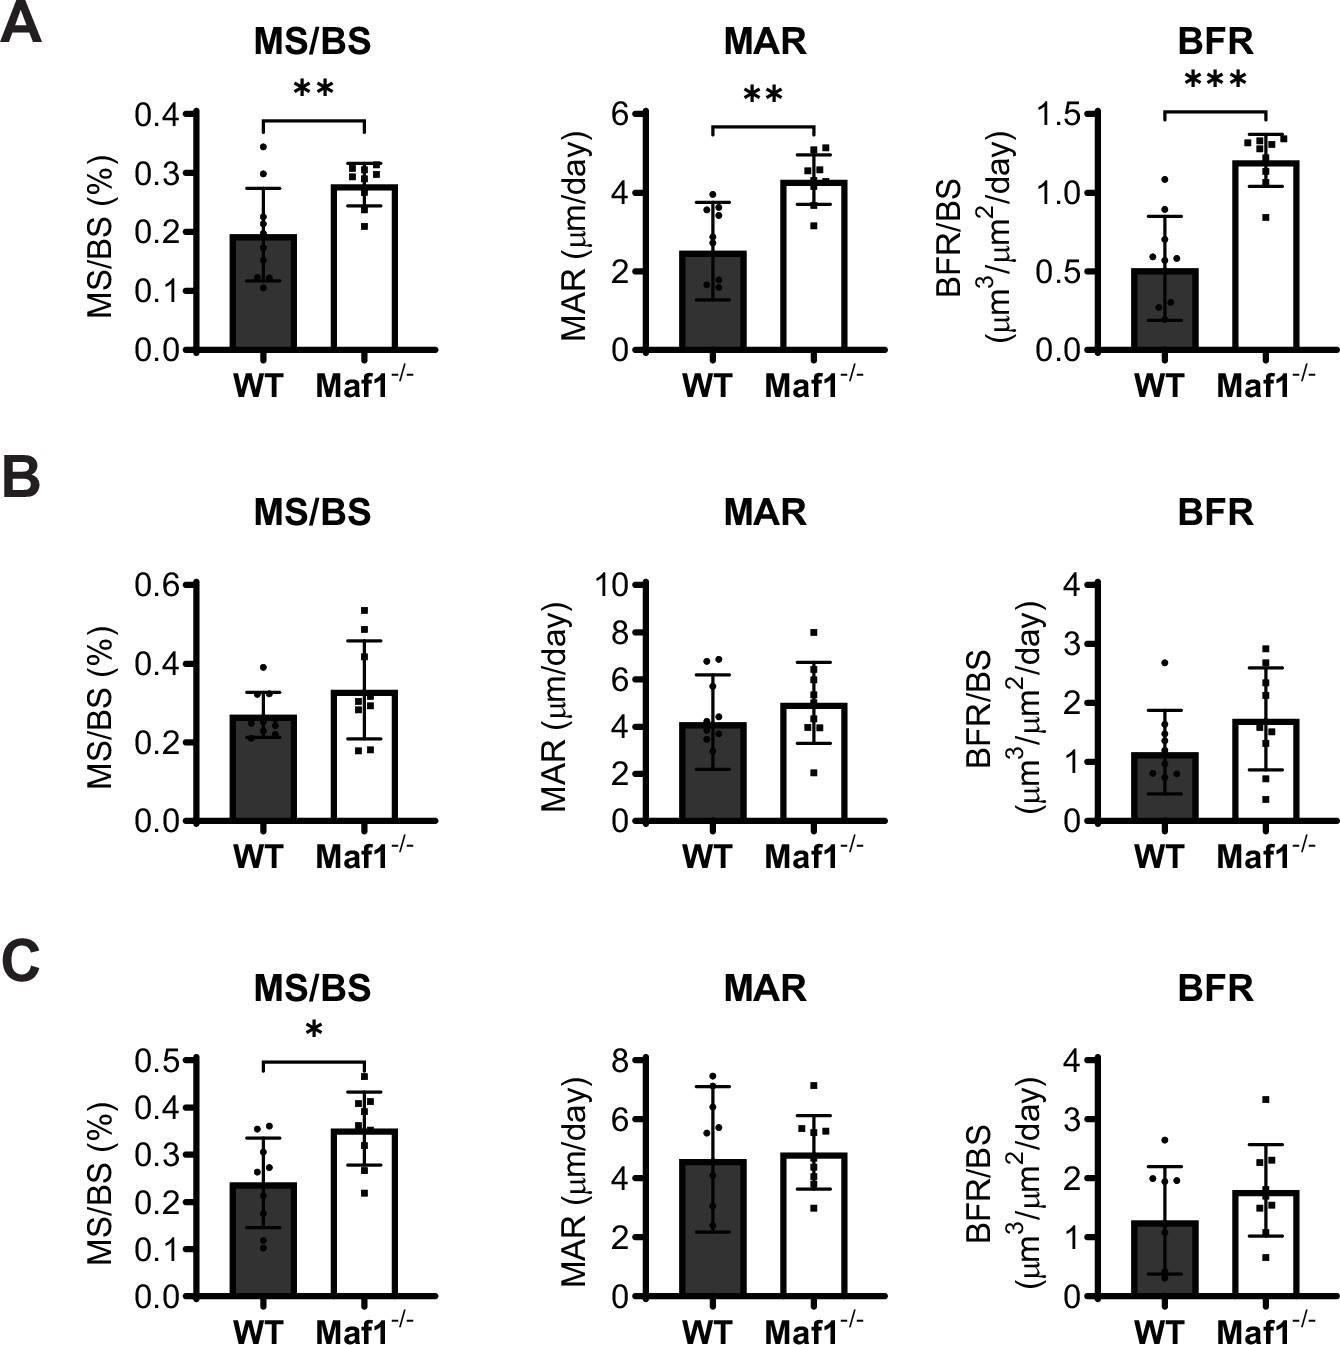
Maf1-/- mice show increased bone formation in the spine.
(A) Dynamic histomorphometry of 12-week-old spines from WT (n=10) and Maf1-/- (n=9) (B) dynamic histomorphometry of femoral samples from WT (n=10) and Maf1-/- (n=9) mice. (C) Dynamic histomorphometry data from 12-week-old tibiae WT (n=9) and Maf1-/- (n=9). Mineralizing surface/bone surface (MS/BS), mineral apposition rate (MAR), and bone formation rate (BFR). Results represent means ± SD, *p<0.05, **p<0.01, ***p<0.001, determined by Student’s t-test.
Figure 1—figure supplement 3
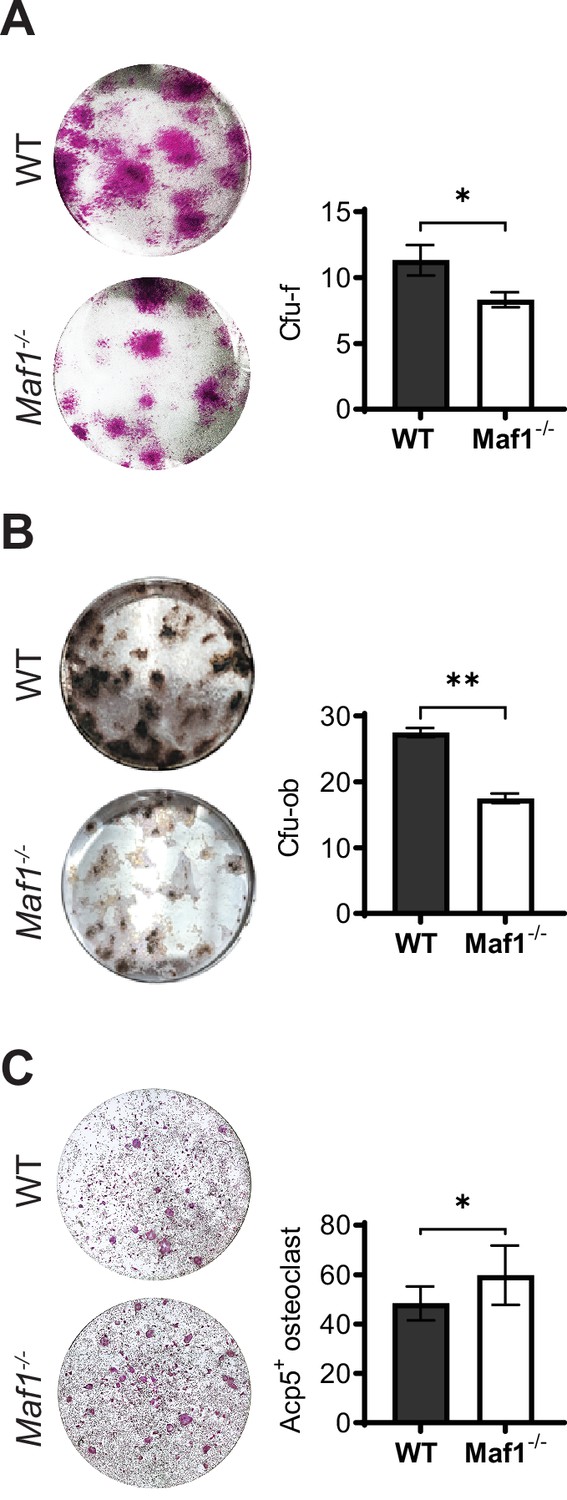
Ex vivo analysis Maf1-/- cells show decreased osteoblast differentiation and increased osteoclast formation.
(A) Representative image (left) and quantification (right) of alkaline phosphatase-labeled colony-forming units-fibroblastoids (Cfu-F), right quantification. (B) Representative image (left) and quantification (right) of Von Kossa-labeled colony-forming units-osteoblastoid (Cfu-ob). (C) Representative image (left) and quantification (right) of Acp5+ cells after osteoclast differentiation using 100 ng/mL rank-l. Results represent means ± SD, *p<0.05, **p<0.01 determined by Student’s t-test.
Figure 1—figure supplement 4
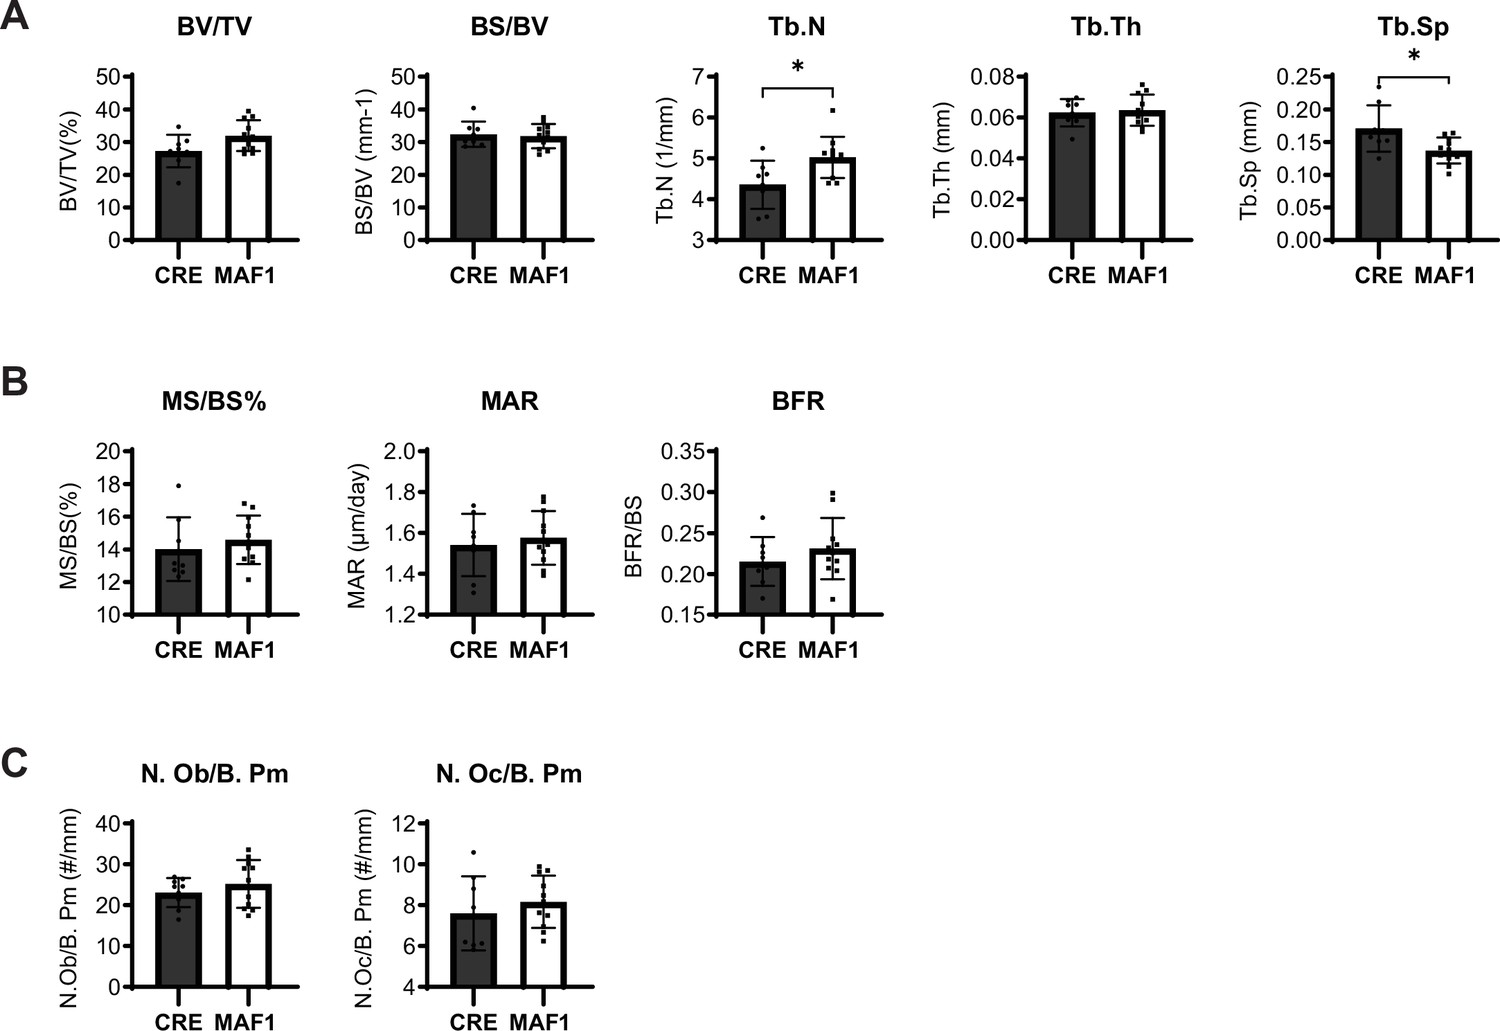
Histomorphometric analysis of Prx1-Cre-MAF1-HA mice.
(A) Static histomorphometric measurements of 12-week-old femurs from Prx1-Cre and Prx1-Cre-MAF1-HA mice. Bone volume/total volume (BV/TV), bone surface/ total volume (BS/BV), trabecular thickness (Tb.Th), trabecular number (Tb.N), and trabecular separation (Tb.Sp). (B) Dynamic histomorphometry results. Mineralizing surface/bone surface (MS/BS), mineral apposition rate (MAR), and bone formation rate (BFR). (C) Osteoblast and osteoclast values in femurs. Number of osteoblast/bone perimeter (N. Ob./B. Pm), Number of osteoclast/bone perimeter (N. Oc./B. Pm), n=8 for Prx1-Cre and n=11 for Prx1-Cre-MAF1-HA. Results represent means ± SD, *p<0.05 determined by two-tailed Student’s t-test.
Figure 2 with 1 supplement
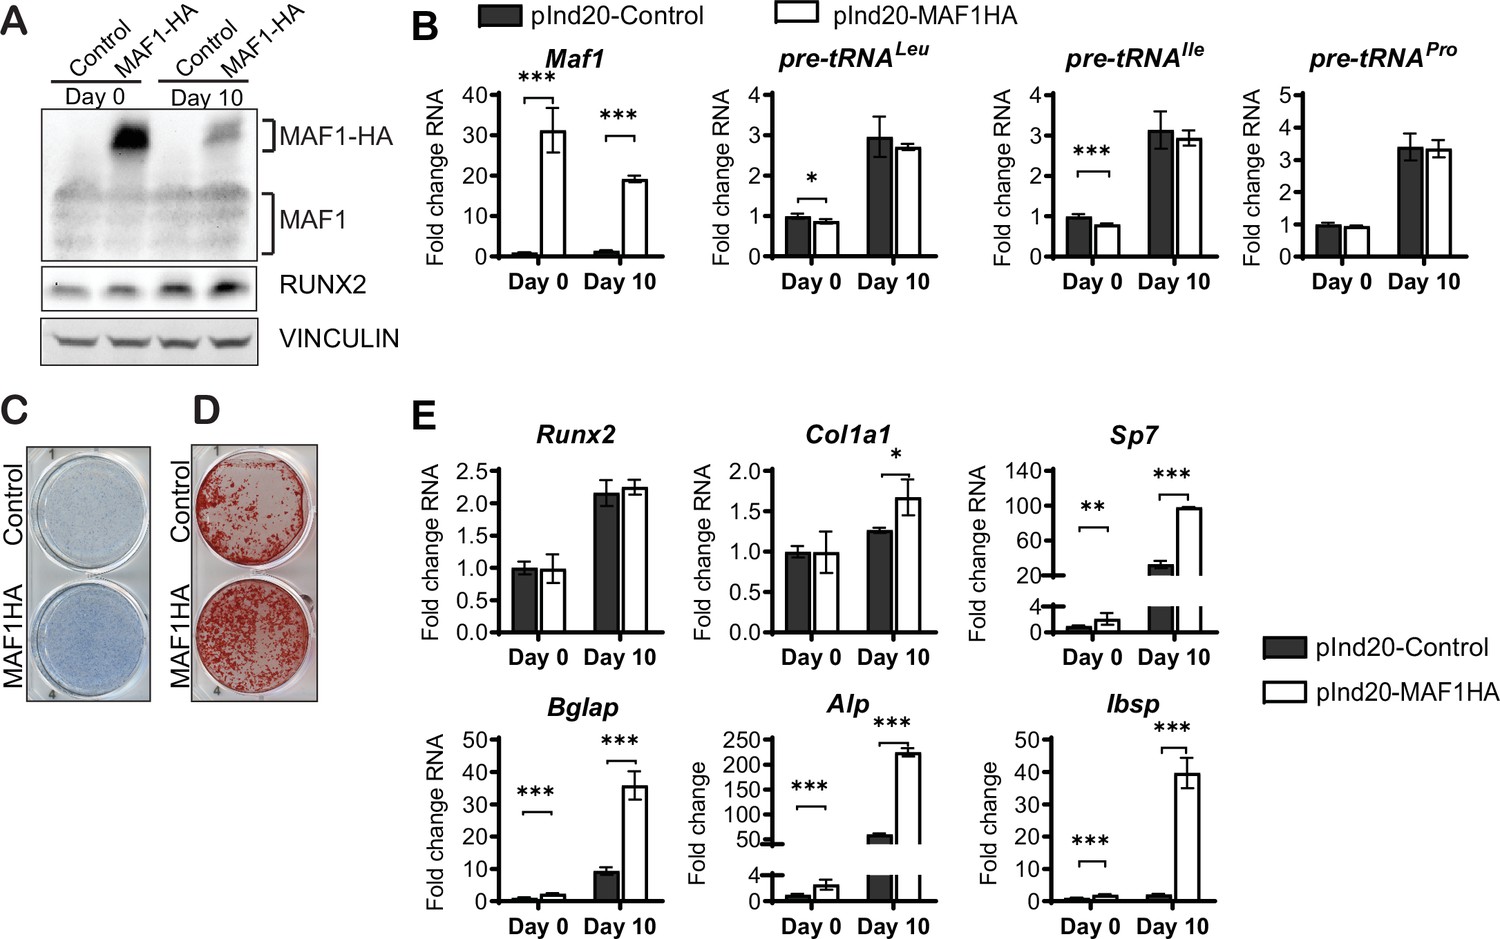
MAF1 increases in vitro osteoblast differentiation and mineralization.
ST2 cells were infected with a doxycycline (Dox)-inducible pInd20-MAF1HA or control construct. Cells were treated with 1 µM Dox starting 1 day before differentiation was started. (A) Western blot analysis showing MAF1, Runx2, and Vinculin in ST2 cells differentiated into osteoblast on day 0 and day 10. (B) qRT-PCR analysis showing MAF1 and pre-tRNA expression in ST2 cells pre- and during osteoblast differentiation. (C) Representative image of alkaline phosphatase (Alp) staining of control and MAF1-HA expressing cells. (D) Representative image of alizarin red analysis of ST2 cells overexpressing control or MAF1-HA after culture in osteoblast differentiation medium. (E) qRT-PCR analysis showing relative expression of Runx2, Col1α, Sp7 (Osterix), Alp, and Bone sialoprotein before and 10 days after the addition of osteoblast differentiation medium. Results represent means ± SD of three independent replicates, *p<0.05, **p<0.01, ***p<0.001 determined by Student’s t-test with Holm correction. Figure 2—source data 1 contains uncropped western blot images, Figure 2—source data 2 contains uncropped images of stained plates.
-
Figure 2—source data 1
Immunoblot analysis 2.
- https://cdn.elifesciences.org/articles/74740/elife-74740-fig2-data1-v2.zip
-
Figure 2—source data 2
Immunoblot analysis 2.
- https://cdn.elifesciences.org/articles/74740/elife-74740-fig2-data2-v2.zip
Figure 2—figure supplement 1
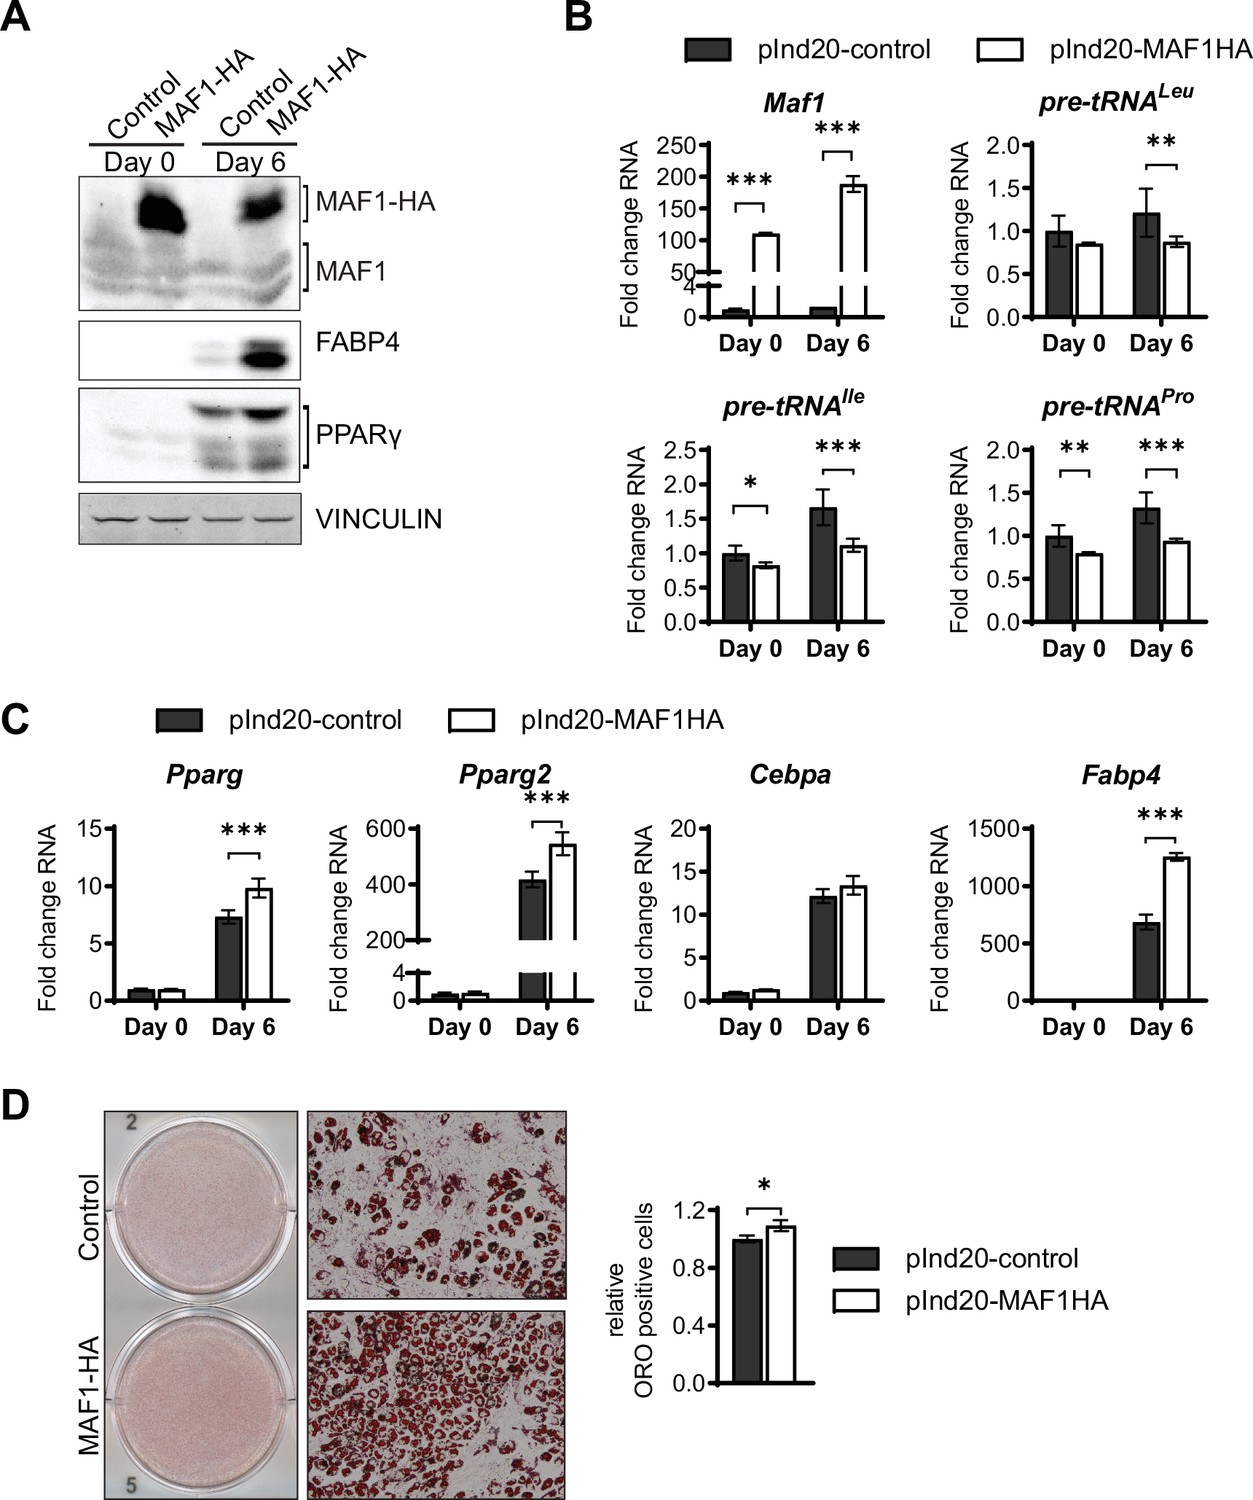
MAF1 overexpression enhances adipogenesis in ST2 cells.
MAF1 or a control vector were expressed in ST2 cells and cells were subsequently differentiated into adipocytes as described in Materials and methods. (A) Western blot analysis shows MAF1, Fabp4, Pparγ, and Vinculin expression on day 0 and day 6 of adipocyte differentiation. (B) qRT-PCR analysis of MAF1 and pre-tRNAs in control and MAF1 overexpressing ST2 cells before and during adipocyte differentiation. (C) qRT-PCR of Pparγ, Pparγ2, C/ebpα, and Fabp4 of ST2 cells expressing a control or MAF1-HA vector before and after adipocyte differentiation. (D) Representative images of Oil red O staining of adipocytes differentiated from ST2 cells expressing control or MAF1-HA (left), 10× images (middle) quantification of Oil red O positive cells (right). Results represent means ± SD of three independent replicates, *p<0.05, **p<0.01, ***p<0.001 determined by Student’s t-test with Holm correction. Figure 2—figure supplement 1—source data 1 contains uncropped images of western blot analysis. Figure 2—figure supplement 1—source data 2 contains uncropped images of the Oil red O-stained cells, additional 10× images and stitched images at 4× used for analysis.
-
Figure 2—figure supplement 1—source data 1
Immunoblot analysis 3.
- https://cdn.elifesciences.org/articles/74740/elife-74740-fig2-figsupp1-data1-v2.zip
-
Figure 2—figure supplement 1—source data 2
Immunoblot analysis and differentiation assays.
- https://cdn.elifesciences.org/articles/74740/elife-74740-fig2-figsupp1-data2-v2.zip
Figure 3 with 1 supplement
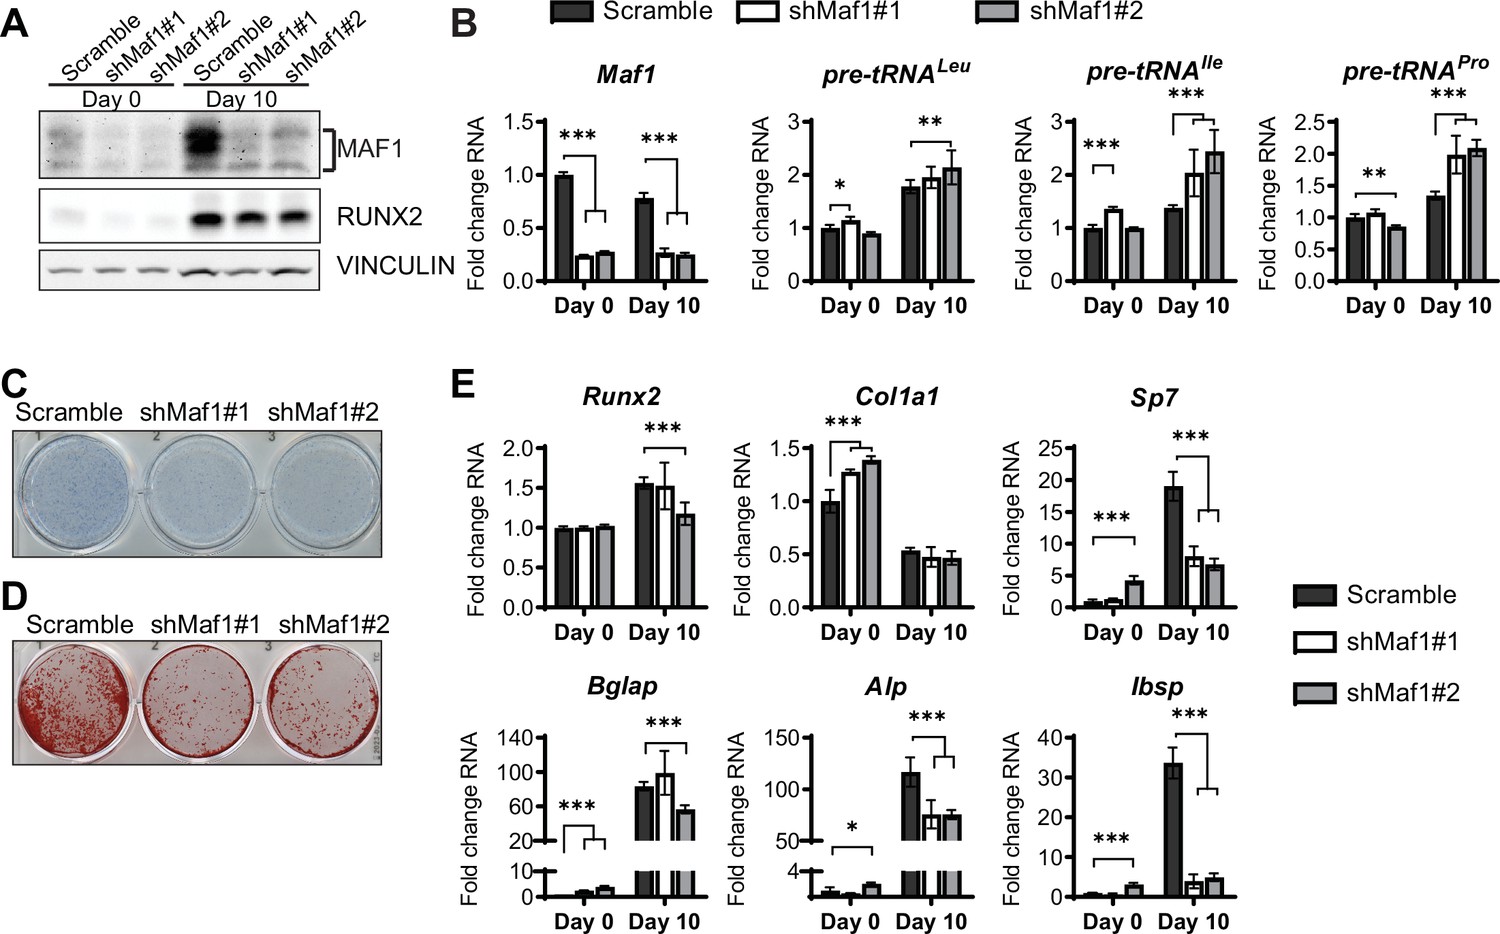
MAF1 knockdown decreases osteoblast differentiation of ST2 cells.
(A) Western blot analysis showing MAF1, Runx2, and Vinculin expression in cells infected with a Scramble construct or MAF1 shRNA before, or 10 days after adding osteoblast differentiation medium. (B) qRT-PCR analysis of MAF1 and pre-tRNAs of ST2 cells expressing Scramble of shMaf1 before and on day after adding osteoblast differentiation medium. (C) Alkaline phosphatase staining of ST2 cells expressing scramble or lentiviral MAF1 shRNA after culture in osteoblast differentiation medium. (D) Alizarin red analysis of cells with scramble or MAF1 shRNA after culture in osteoblast differentiation medium. (E) qRT-PCR analysis showing relative expression of Runx2, Col1α, Sp7, Alp, and Bone sialoprotein before, and 10 days after addition of osteoblast differentiation medium. Results represent means ± SD of three independent replicates, *p<0.05, **p<0.01, ***p<0.001 determined by Student’s t-test with Holm correction. Figure 3—source data 1 contains uncropped western blot images, Figure 3—source data 2 contains uncropped images of stained plates.
-
Figure 3—source data 1
Adipogenesis assays.
- https://cdn.elifesciences.org/articles/74740/elife-74740-fig3-data1-v2.zip
-
Figure 3—source data 2
Immunoblot analysis 3.
- https://cdn.elifesciences.org/articles/74740/elife-74740-fig3-data2-v2.zip
Figure 3—figure supplement 1
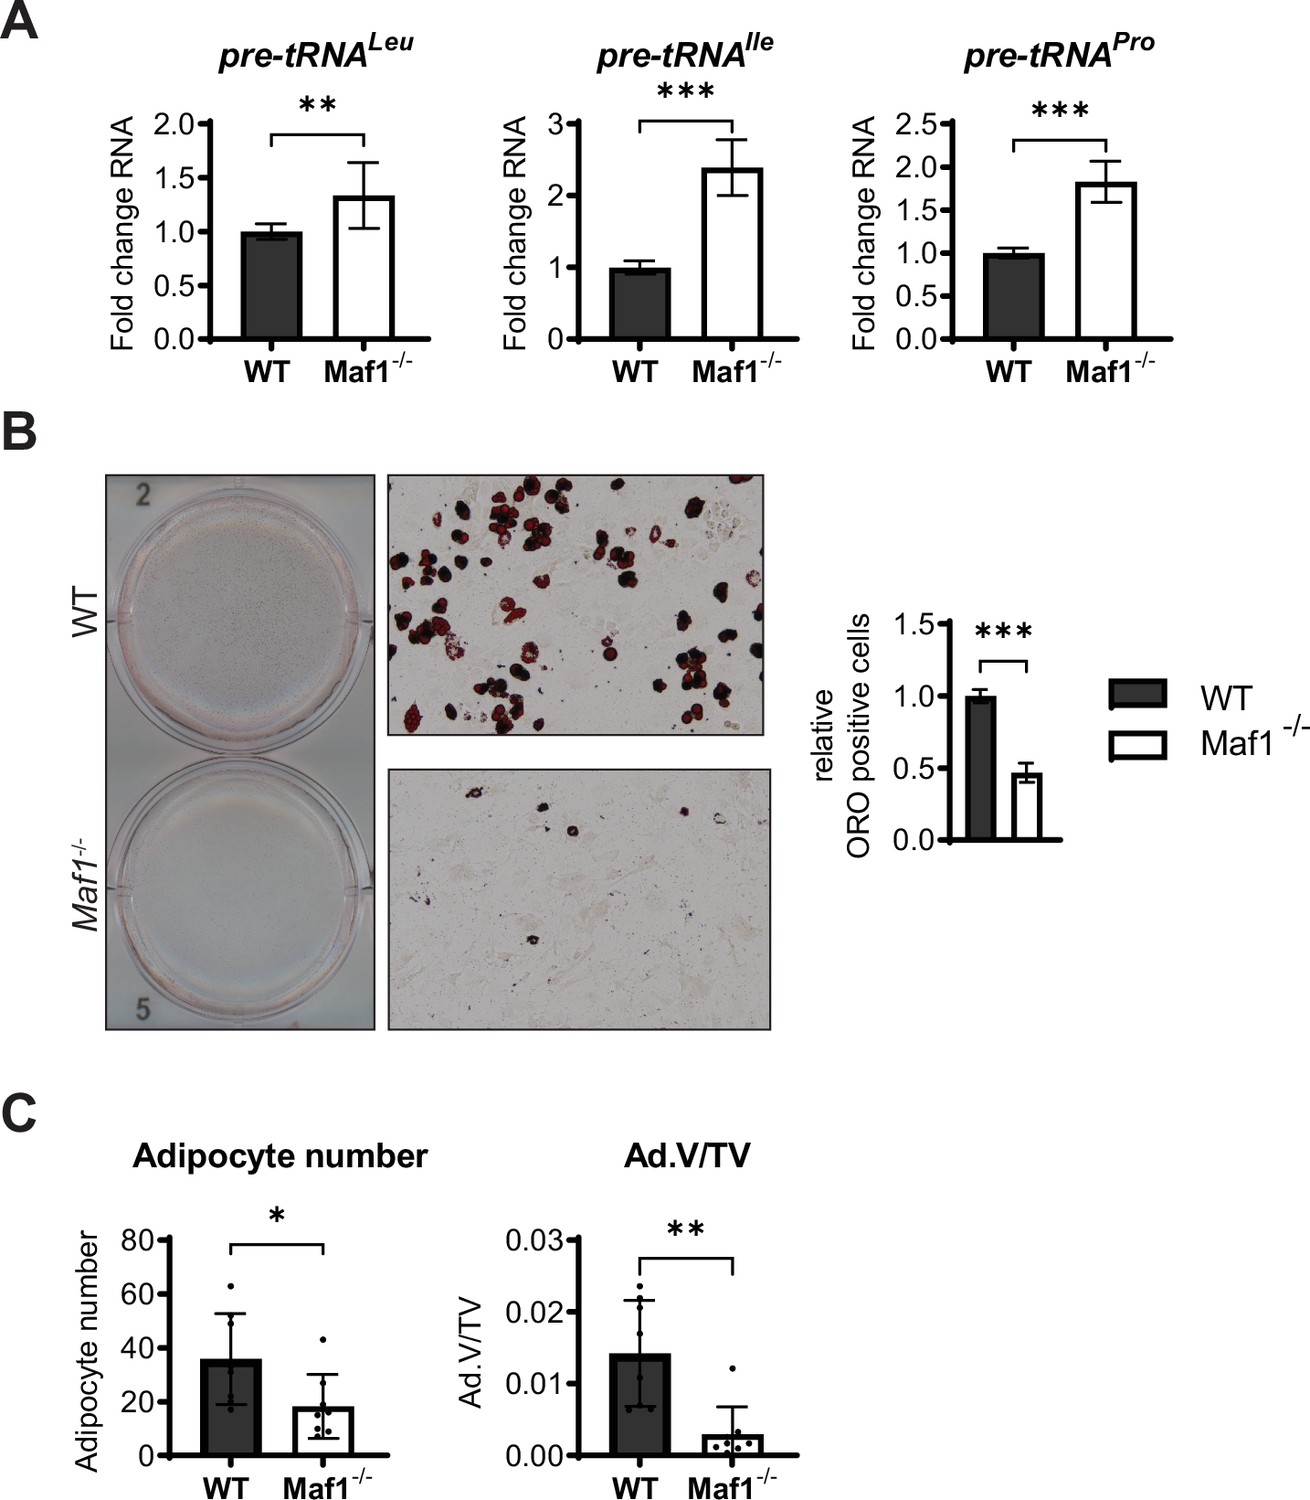
MAF1 deficiency decreases adipocyte differentiation in vitro and bone marrow adipocytes in vivo.
Primary stromal cells isolated from femurs of 6- to 8-week-old Maf1-/- or WT male mice. (A) qRT-PCR analysis of pre-tRNAs in WT or Maf1-/- cells. Results from 12 independent replicates. (B) Oil Red O staining of WT and Maf1-/- cells differentiated into adipocytes for 9 days. Representative image (left), 10× images (middle) quantification of Oil red O positive cells (right). Results of three independent replicates. (C) Histological analysis of 12-week-old femurs of WT and Maf1-/- mice. Adipocyte number and adipocyte volume/ total volume (Ad.V/TV). n=8 for WT and n=8 for Maf1-/- mice femurs. Results represent means ± SD, *p<0.05, **p<0.01, ***p<0.001 determined by Student’s t-test. Figure 3—figure supplement 1—source data 1 contains uncropped images of the Oil red O-stained cells, additional 10× images, and stitched images at 4× used for analysis.
-
Figure 3—figure supplement 1—source data 1
Adipogenesis assay 2.
- https://cdn.elifesciences.org/articles/74740/elife-74740-fig3-figsupp1-data1-v2.zip
Figure 4 with 2 supplements
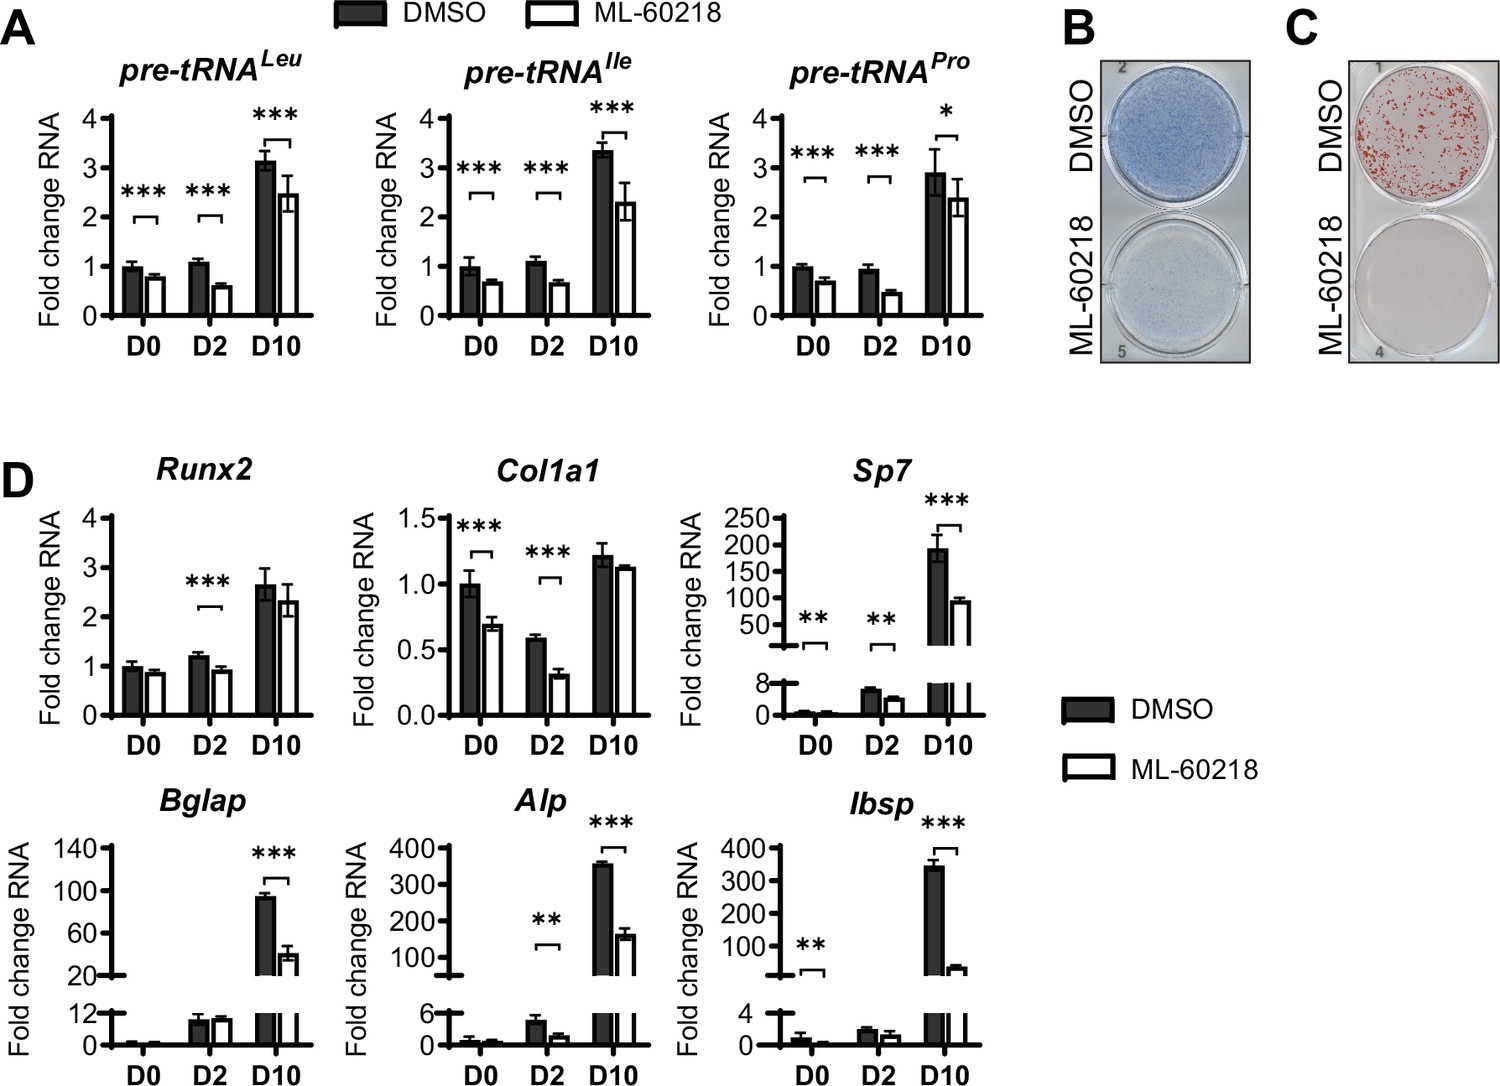
inhibition of RNA pol III-dependent transcription by ML-60218 decreases osteoblast differentiation and mineralization.
ST2 cells were treated with 40 µM ML-60218 for 3 days, starting on day –1 and differentiated into osteoblasts by addition of osteoblast differentiation medium on day 0. (A) qRT-PCR analysis of pre-tRNAs before and during differentiation after ML-60218 or DMSO treatment of ST2 cells. (B) Representative image of alkaline phosphatase (Alp) staining of ST2 cells after osteoblast differentiation in DMSO or ML60218 treated cells. (C) Representative image of alizarin red analysis of ST2 cells after osteoblast differentiation and ML-60218 or DMSO treatment. (D) qRT-PCR analysis of Runx2, Col1α, Sp7, Osteocalcin, Alp and Bone Sialoprotein in ST2 cells on day 0, day 2 and day 10 during osteoblast differentiation. Results represent means ± SD of three independent replicates. *p<0.05, **p<0.01, ***p<0.001 determined by Student’s t-test with Holm correction. Figure 4—source data 1 contains uncropped images of stained plates.
-
Figure 4—source data 1
Osteoblast and adipocyte assays.
- https://cdn.elifesciences.org/articles/74740/elife-74740-fig4-data1-v2.zip
Figure 4—figure supplement 1
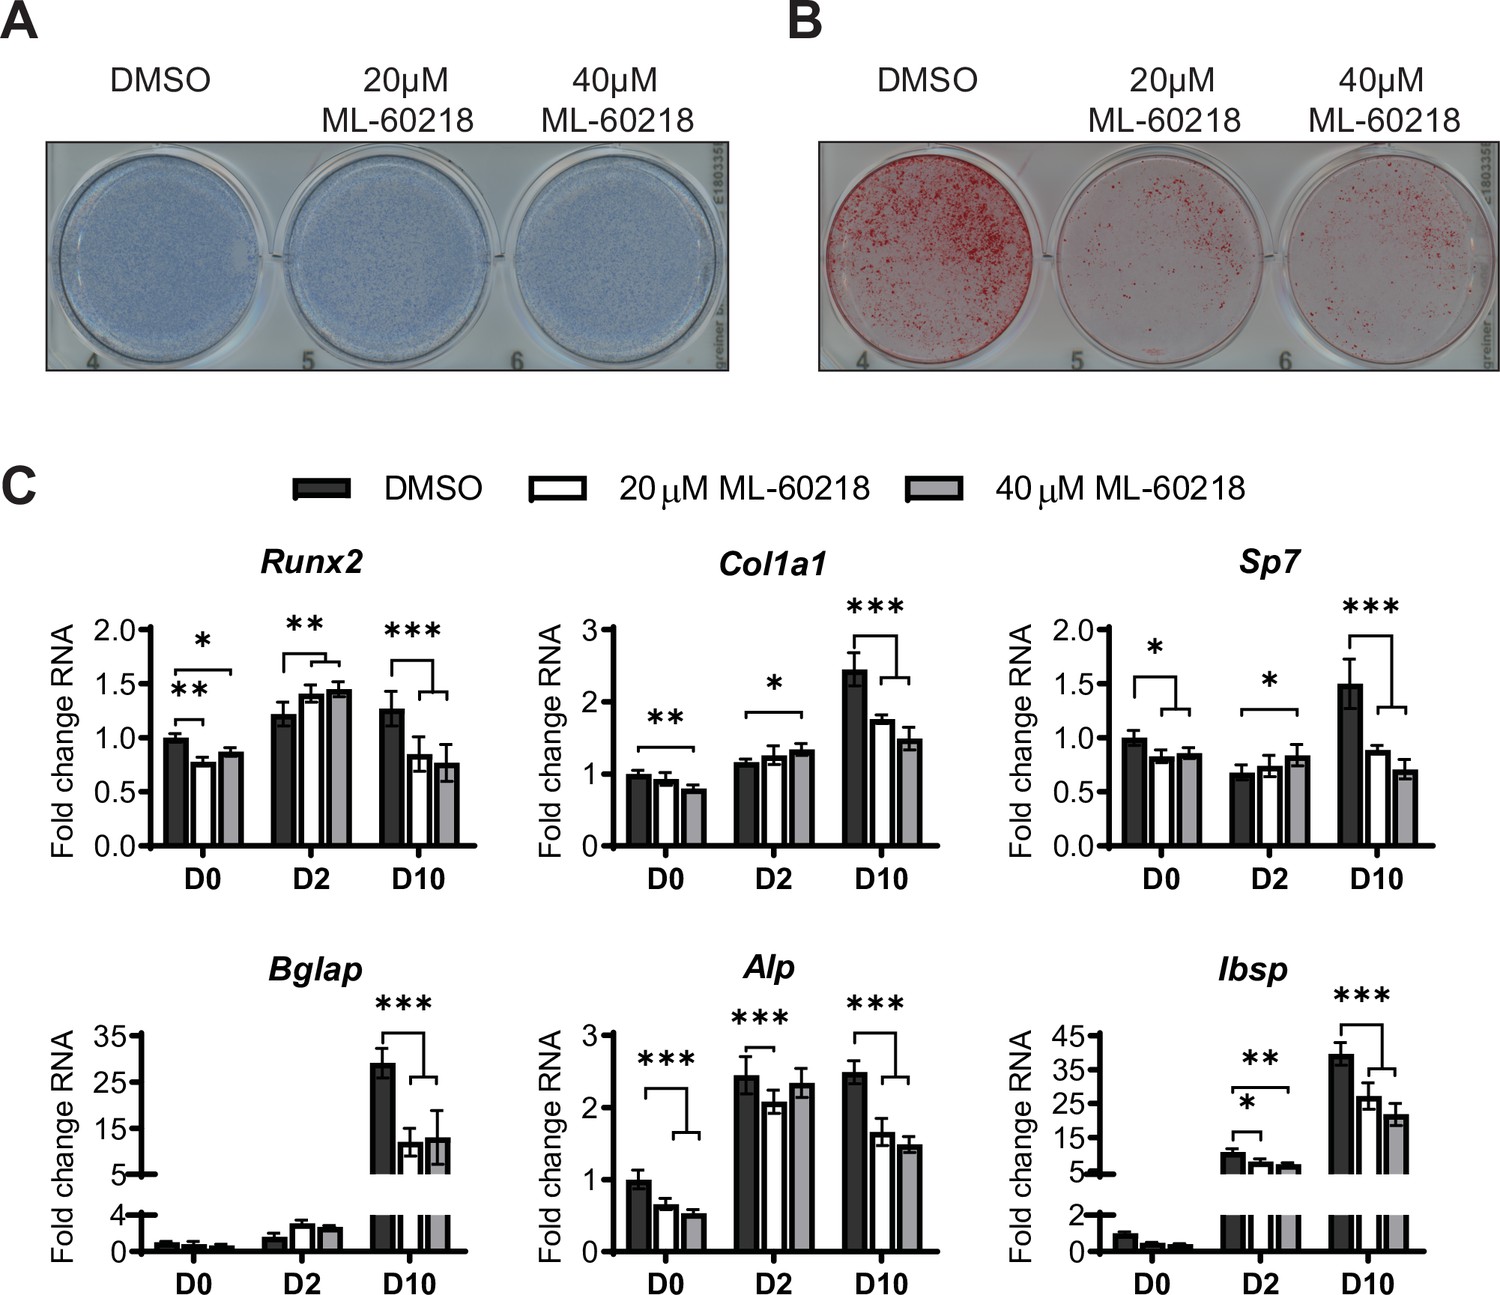
ML-60216 treatment decreases osteoblast differentiation of primary stromal cells.
Primary stromal cells isolated from 6–8 week-old C57BL/6 WT mice were treated with ML-60218 for 3 days before, and during differentiation into osteoblasts by addition of osteoblast differentiation medium on day 0. (A) Representative image of Alp staining of ST2 cells after osteoblast differentiation of DMSO or ML60218 treated cells. (B) Representative image of alizarin red analysis of ST2 cells after osteoblast differentiation and ML-60218 or DMSO treatment. (C) qRT-PCR analysis of Runx2, Col1α, Sp7, Osteocalcin, Alp and bone sialoprotein expression relative to β-actin in primary stromal cells on day 0, day 2, and day 10 during osteoblast differentiation. Results represent means ± SD of three independent replicates, *p<0.05, **p<0.01, ***p<0.001 determined by Student’s t-test with Holm correction. Figure 4—figure supplement 1—source data 1 contains uncropped images of stained plates.
-
Figure 4—figure supplement 1—source data 1
Immunoblot analysis 4.
- https://cdn.elifesciences.org/articles/74740/elife-74740-fig4-figsupp1-data1-v2.zip
Figure 4—figure supplement 2
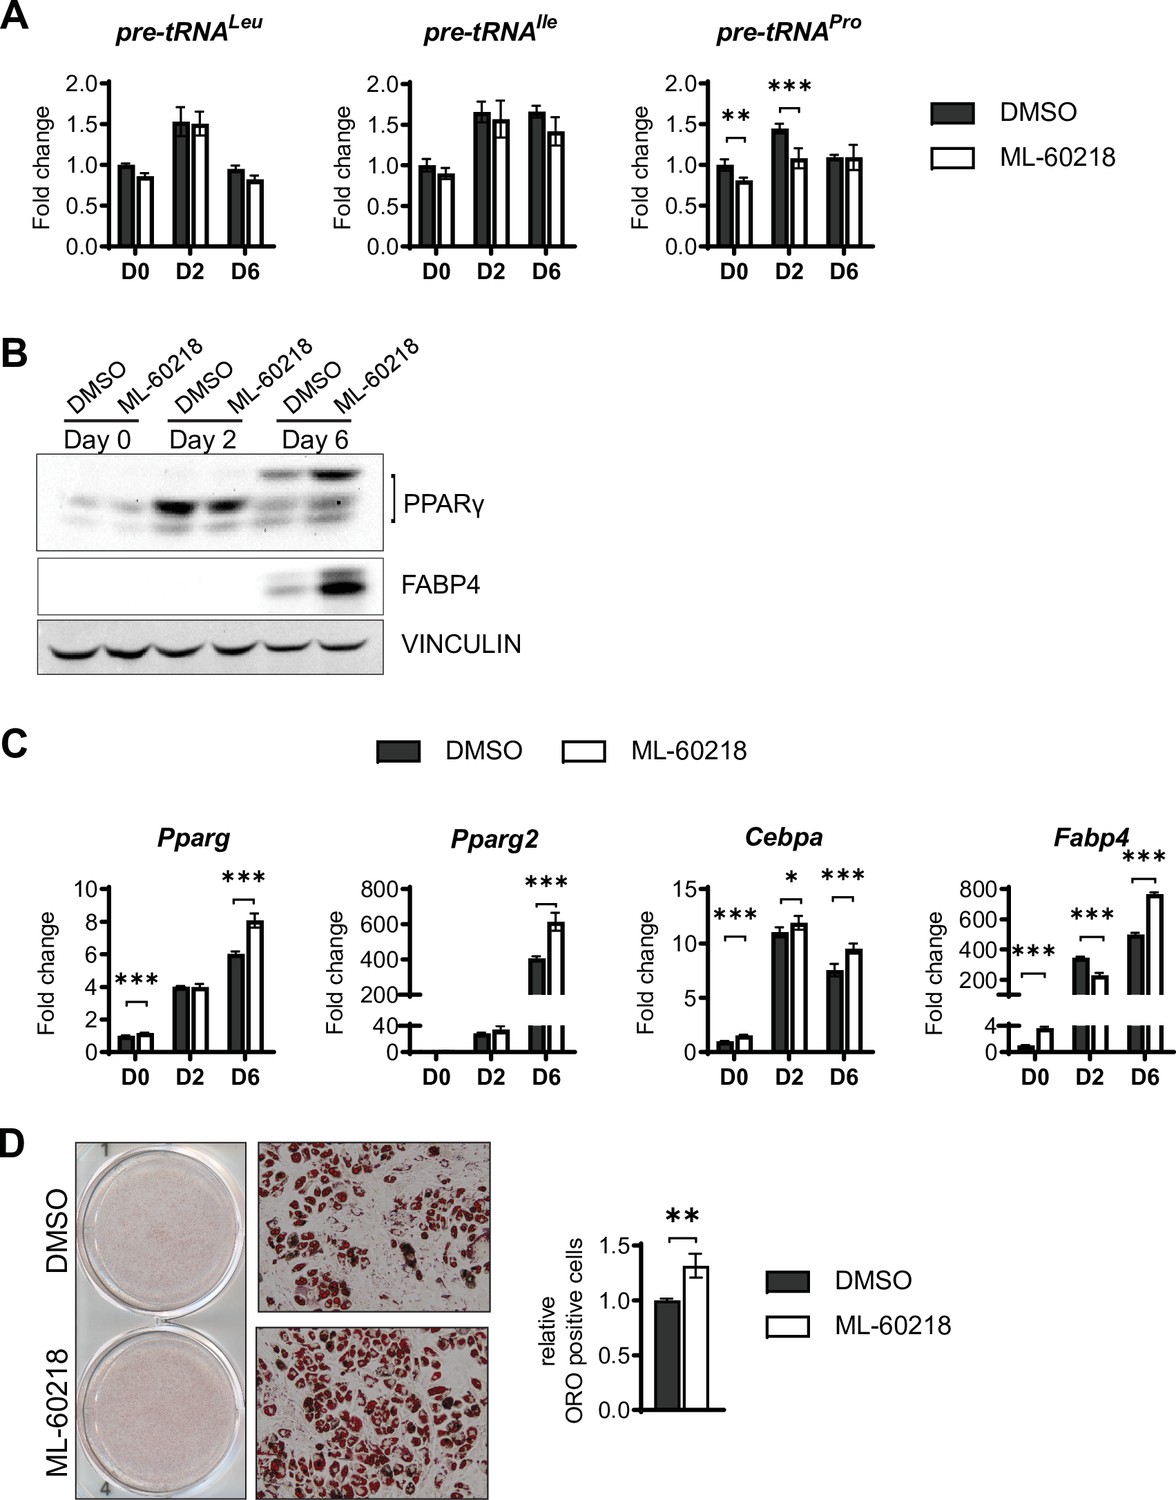
ML-60218 treatment enhances adipogenesis of ST2 cells.
ST2 cells were treated for 3 days with 40 µM ML-60218 or DMSO between day –1 and day 2 of adipocyte differentiation. (A) qRT-PCR analysis of pre-tRNA expression before and during adipocyte differentiation. (B) Western blot analysis of Pparγ, Fabp4, and Vinculin. (C) qRT-PCR analysis of adipocyte markers Pparγ, Pparγ2, C/ebpα and Fabp4. (D) Oil red O staining of adipocytes on day 8 of adipocyte differentiation. Representative wells (left), representative 10× microscope image (middle), relative Oil red O positive cells as determined by citation 5 scanning of 3 wells (right). *p<0.05, **p<0.01, ***p<0.001 determined by Student’s t-test with Holm correction. Figure 4—figure supplement 2—source data 1 contains uncropped images of western blot analysis. Figure 4—figure supplement 2—source data 2 contains uncropped images of the Oil red O-stained cells, additional 10× images and stitched images at 4× used for analysis.
-
Figure 4—figure supplement 2—source data 1
Immunoblot assays and differentiation assays.
- https://cdn.elifesciences.org/articles/74740/elife-74740-fig4-figsupp2-data1-v2.zip
-
Figure 4—figure supplement 2—source data 2
Immunoblot analysis 4.
- https://cdn.elifesciences.org/articles/74740/elife-74740-fig4-figsupp2-data2-v2.zip
Figure 5 with 1 supplement
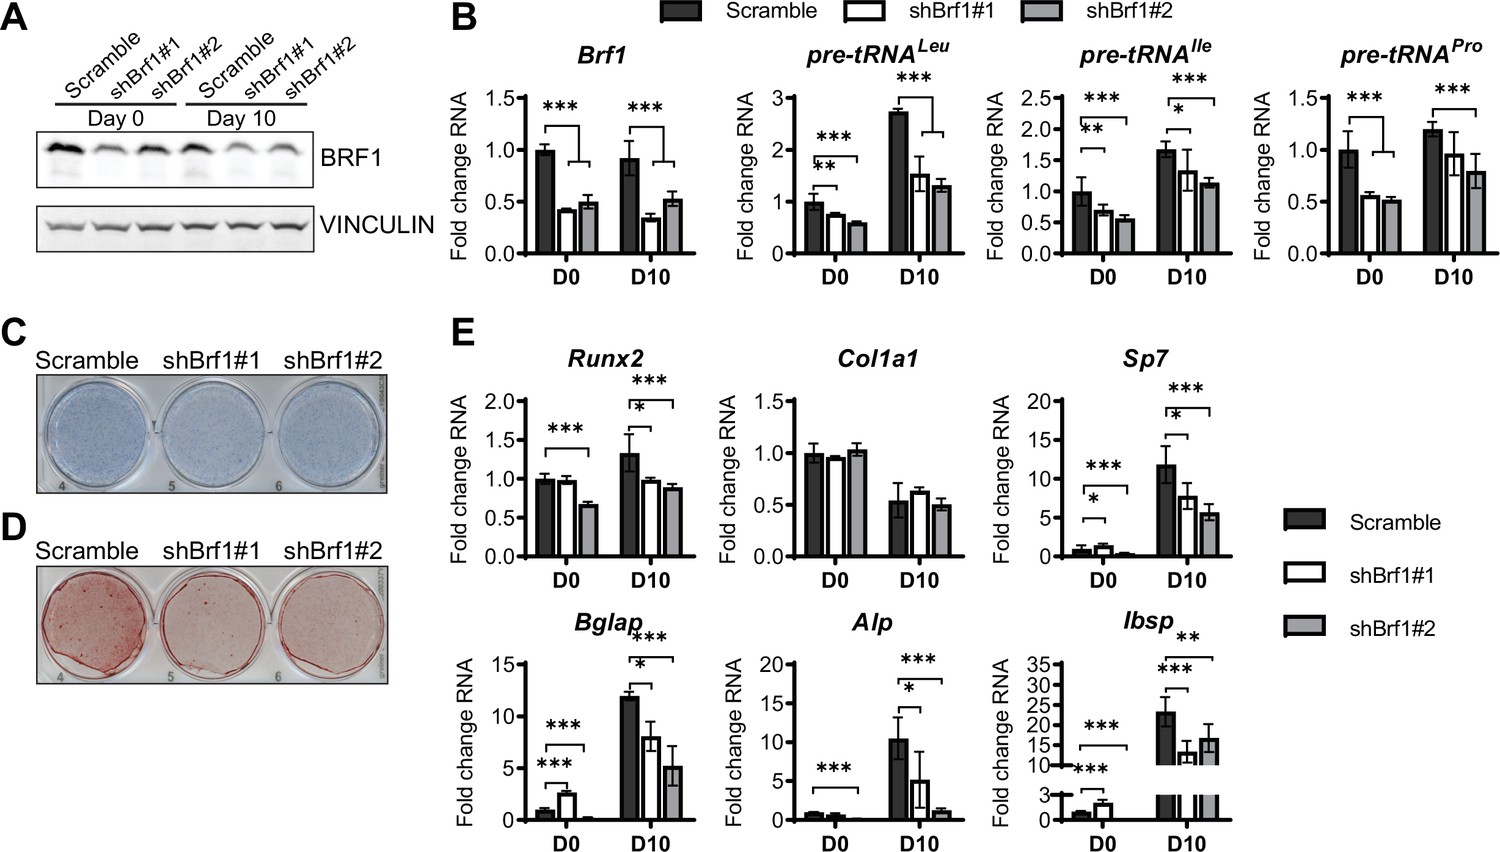
Inhibition of RNA pol III-dependent transcription Brf1 knockdown decreases osteoblast differentiation and mineralization.
ST2 cells were stably infected with scramble or Brf1 shRNA lentivirus and differentiated into osteoblasts by addition of osteoblast differentiation medium on day 0. (A) Western blot analysis showing Brf1 and Vinculin expression in cells infected with a scramble construct Brf1 shRNA before or 10 days after adding osteoblast differentiation medium. (B) qRT-PCR analysis of Brf1 and pre-tRNAs of ST2 cells expressing Scramble of shBrf1 before and on day after adding osteoblast differentiation medium. (C) Representative image of alkaline phosphatase (Alp) staining of ST2 cells expressing scramble or lentiviral Brf1 shRNA after culture in osteoblast differentiation medium. (D) Representative image of alizarin red analysis of cells with Scramble or Brf1 shRNA after culture in osteoblast differentiation medium. (E) qRT-PCR analysis showing relative expression of Runx2, Col1α, Sp7 (Osterix), Alp, and Bone sialoprotein before and 10 days after the addition of osteoblast differentiation medium. Results represent means ± SD of three independent replicates, *p<0.05, **p<0.01, ***p<0.001 determined by Student’s t-test with Holm correction. Figure 5—source data 1 contains uncropped western blot images, Figure 5—source data 2 contains uncropped images of stained plates.
-
Figure 5—source data 1
Immunoblot analysis and adipocyte differentiation assays.
- https://cdn.elifesciences.org/articles/74740/elife-74740-fig5-data1-v2.zip
-
Figure 5—source data 2
Differentiation analysis 1.
- https://cdn.elifesciences.org/articles/74740/elife-74740-fig5-data2-v2.zip
Figure 5—figure supplement 1
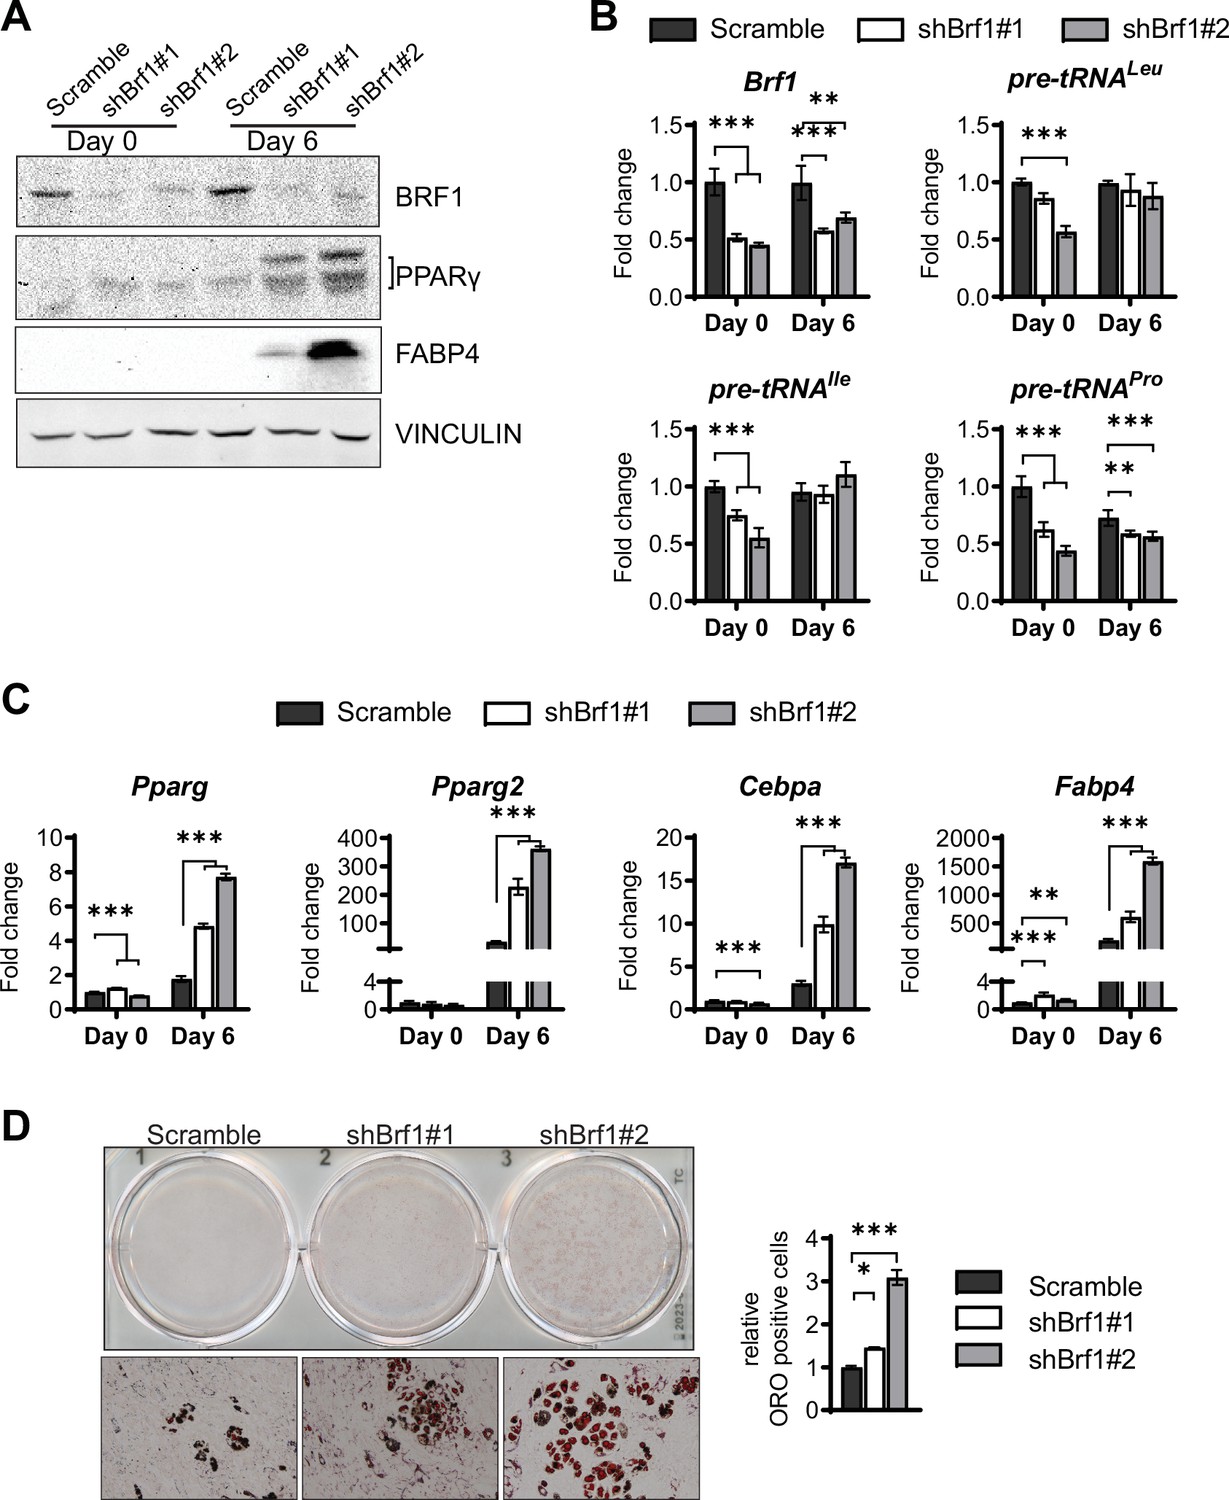
Brf1 knockdown enhances adipogenesis in ST2 cells.
ST2 cells were stably infected with scramble or two different shBrf1 constructs and differentiated into adipocytes as described in ‘Materials and methods’. (A) Western blot analysis of Brf1, Pparγ, Fabp4, and Vinculin expression on day 0 and day 6 of adipocyte differentiation. (B) qRT-PCR analysis of Brf1, and pre-tRNA expression during adipocyte differentiation. (C) qRT-PCR analysis of adipocyte markers Pparγ, Pparγ2, C/ebpα, and Fabp4. (D) Oil red O staining of adipocytes on day 8 of adipocyte differentiation. Representative wells (top), representative10× microscope image (bottom), relative Oil red O-positive cells as determined by citation 5 scanning of two wells (right). *p<0.05, **p<0.01, ***p<0.001 determined by Student’s t-test with Holm correction. Figure 5—figure supplement 1—source data 1 contains uncropped images of western blot analysis. Figure 5—figure supplement 1—source data 2 contains uncropped images of the Oil red O-stained cells, additional 10× images and stitched images at 4× used for analysis.
-
Figure 5—figure supplement 1—source data 1
GEO data from RNA sequencing analysis.
- https://cdn.elifesciences.org/articles/74740/elife-74740-fig5-figsupp1-data1-v2.zip
-
Figure 5—figure supplement 1—source data 2
GEO dataset analysis.
- https://cdn.elifesciences.org/articles/74740/elife-74740-fig5-figsupp1-data2-v2.zip
Figure 6 with 5 supplements
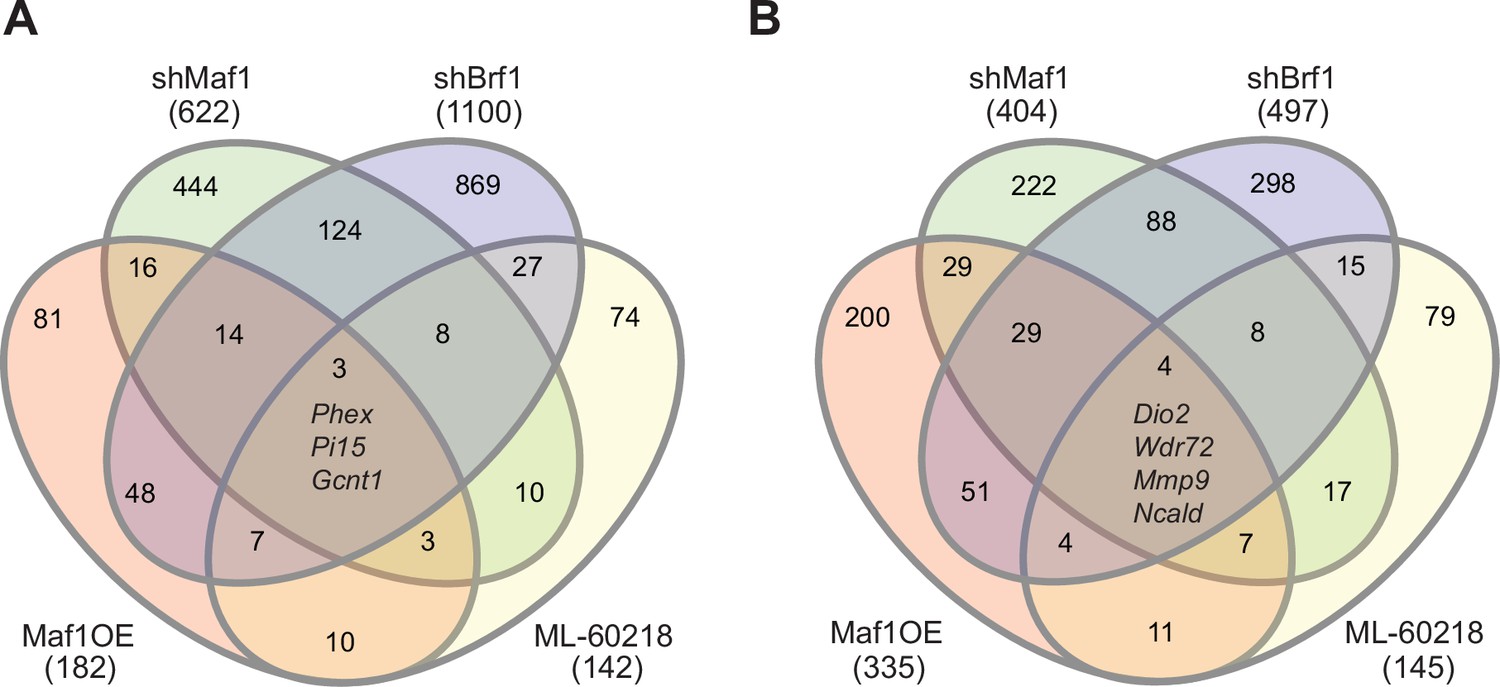
Manipulating RNA pol III in different manners results in distinct gene pools.
Changes in gene expression were determined by padj<0.05 and foldchange >|log2 0.7|. Venn diagram showing overlap in gene changes (either increased or decreased) on day 0 (A) or (B) day 4 (B). Genes that were changed in all groups are denoted. MAF1OE genes changes between pInd20-MAF1 and Pind20-Control; shMAF1 was compared to scramble control, shBrf1 was compared to scramble control; ML-60218 was compared to DMSO control. Figure 6—source data 1 contains excel files with all differentially expressed genes.
-
Figure 6—source data 1
GEO analysis from RNA sequencing analysis 2.
- https://cdn.elifesciences.org/articles/74740/elife-74740-fig6-data1-v2.zip
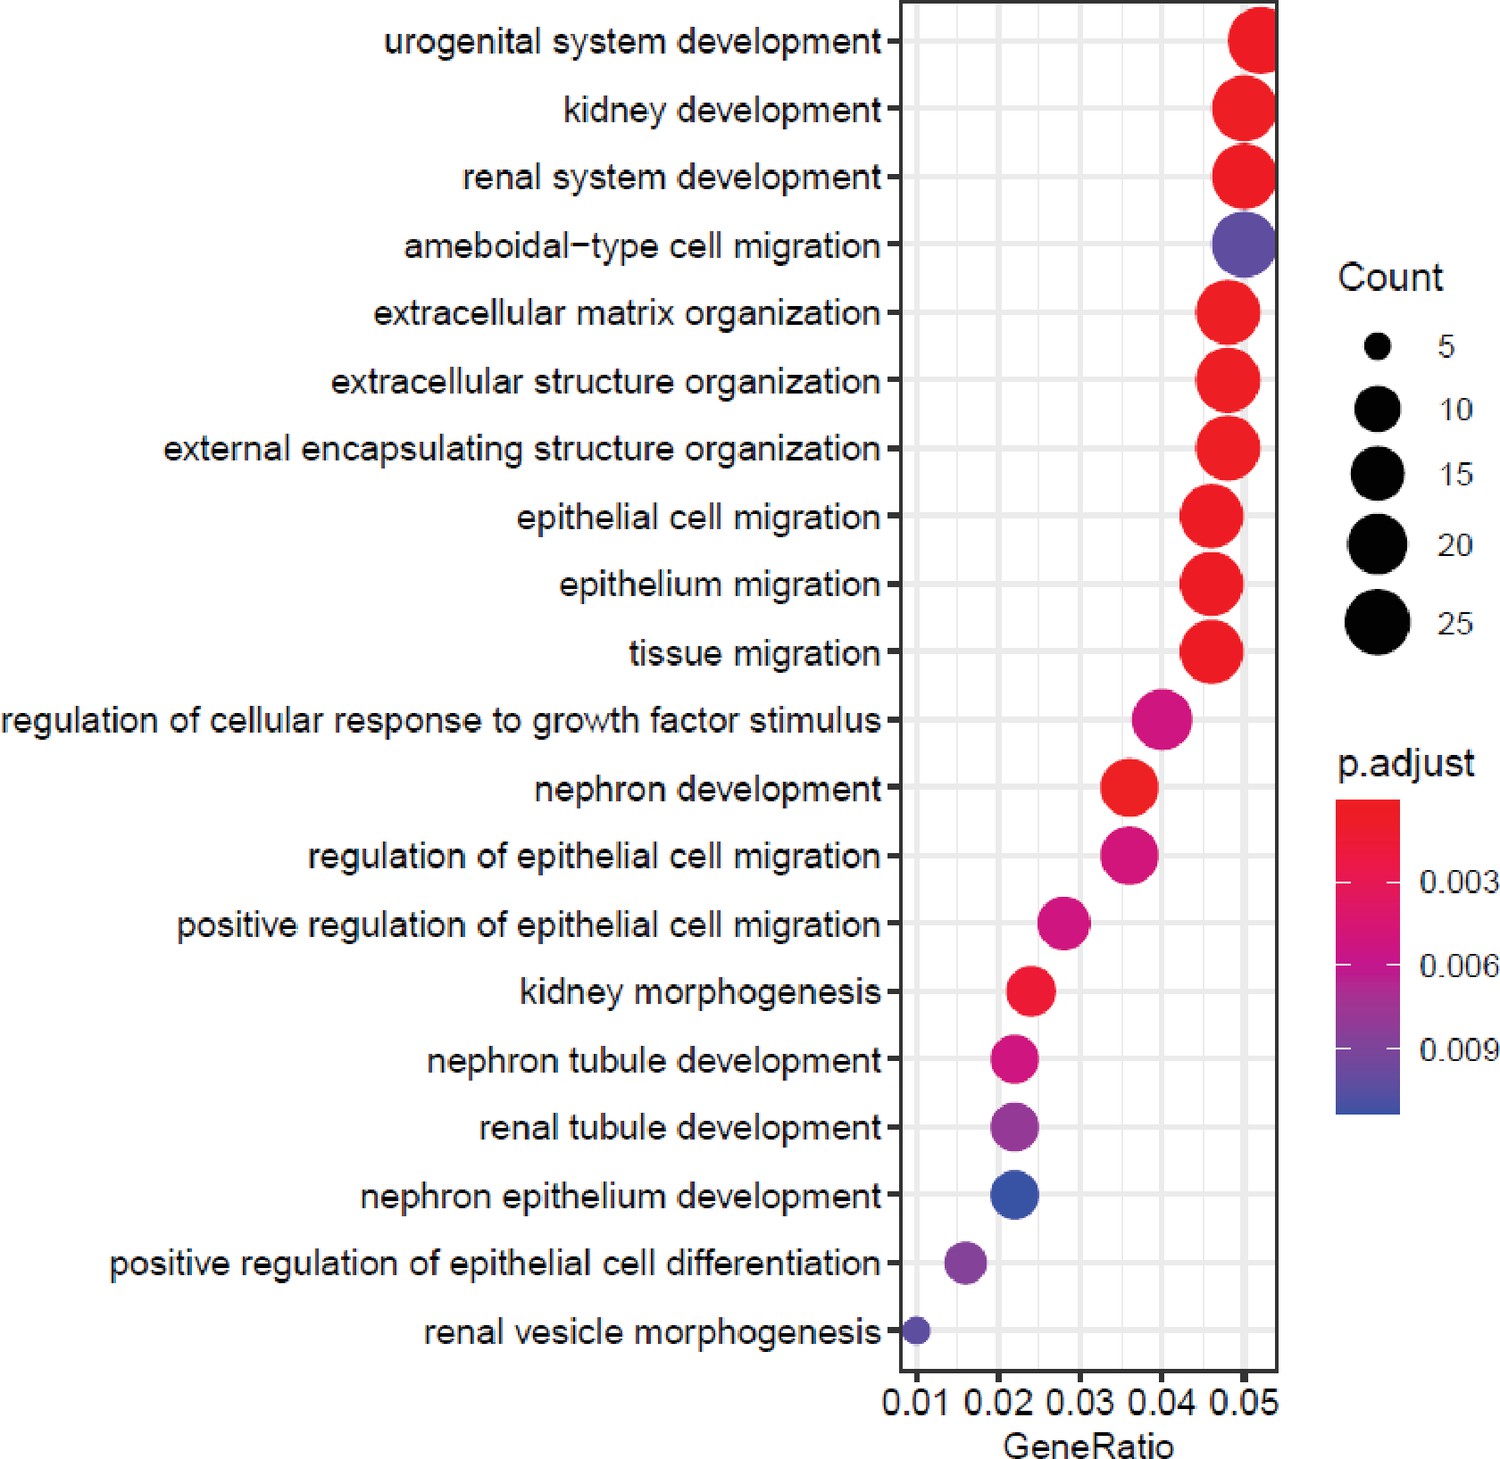
Figure 6—figure supplement 1
MAF1 overexpression results enrichment for terms related to bone biology.
Top 20 biological process-related gene ontology (GO) enrichment terms of genes changed by MAF1 overexpression on day 0. Genes with padj<0.05 and log2fold>0.7 in either direction, were used for analysis.
Figure 6—figure supplement 2
MAF1 knockdown causes enrichment for terms related to bone and renal biology.
Top 20 biological process-related gene ontology (GO) enrichment terms of genes changed by MAF1 knockdown on day 0. Genes with padj<0.05 and log2fold>0.7 in either direction, were used for analysis.
Figure 6—figure supplement 3
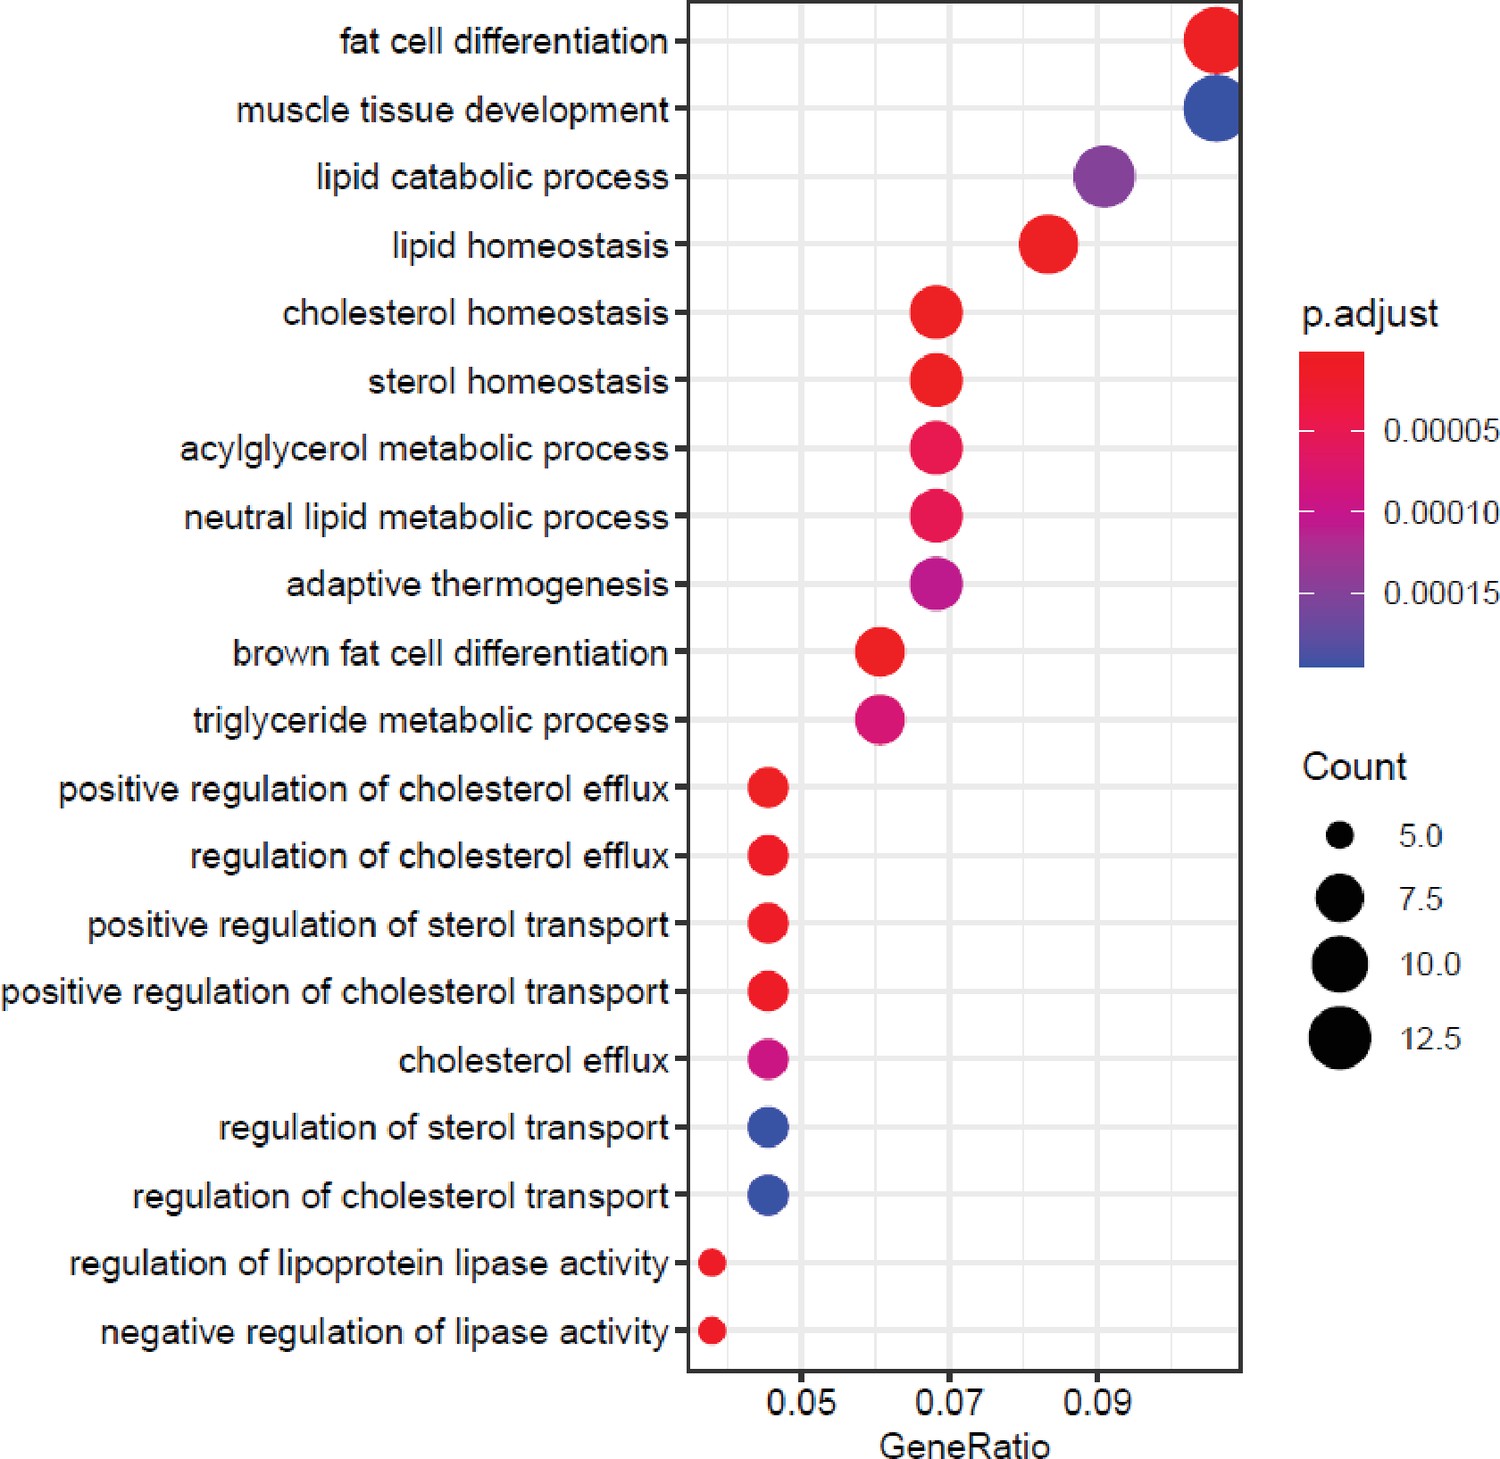
ML-60218 treatment results in enrichment in gene ontology (GO) terms related to lipid metabolism.
Top 20 biological process-related GO enrichment terms of genes changed by ML-60218 treatment on day 0. Genes with padj<0.05 and log2fold>0.7 in either direction, were used for analysis.
Figure 6—figure supplement 4
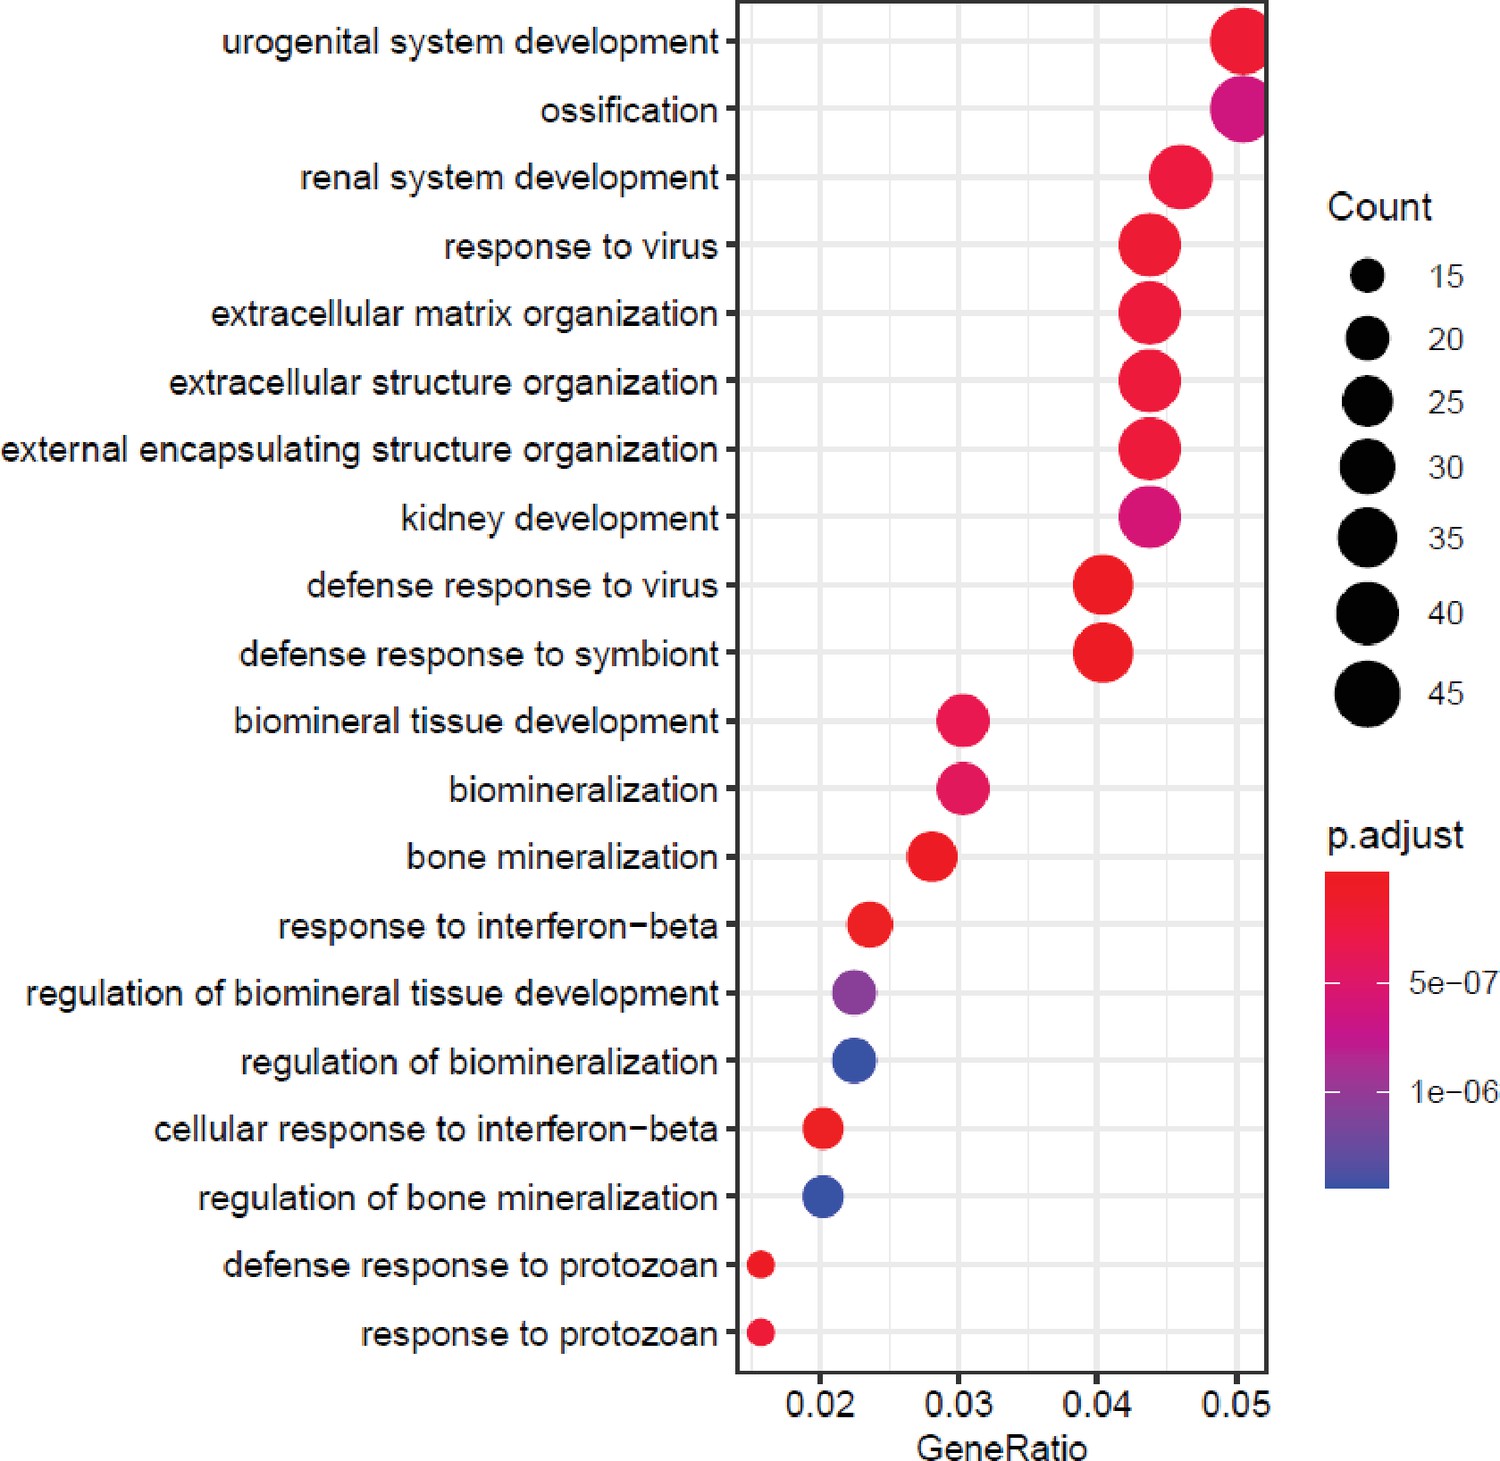
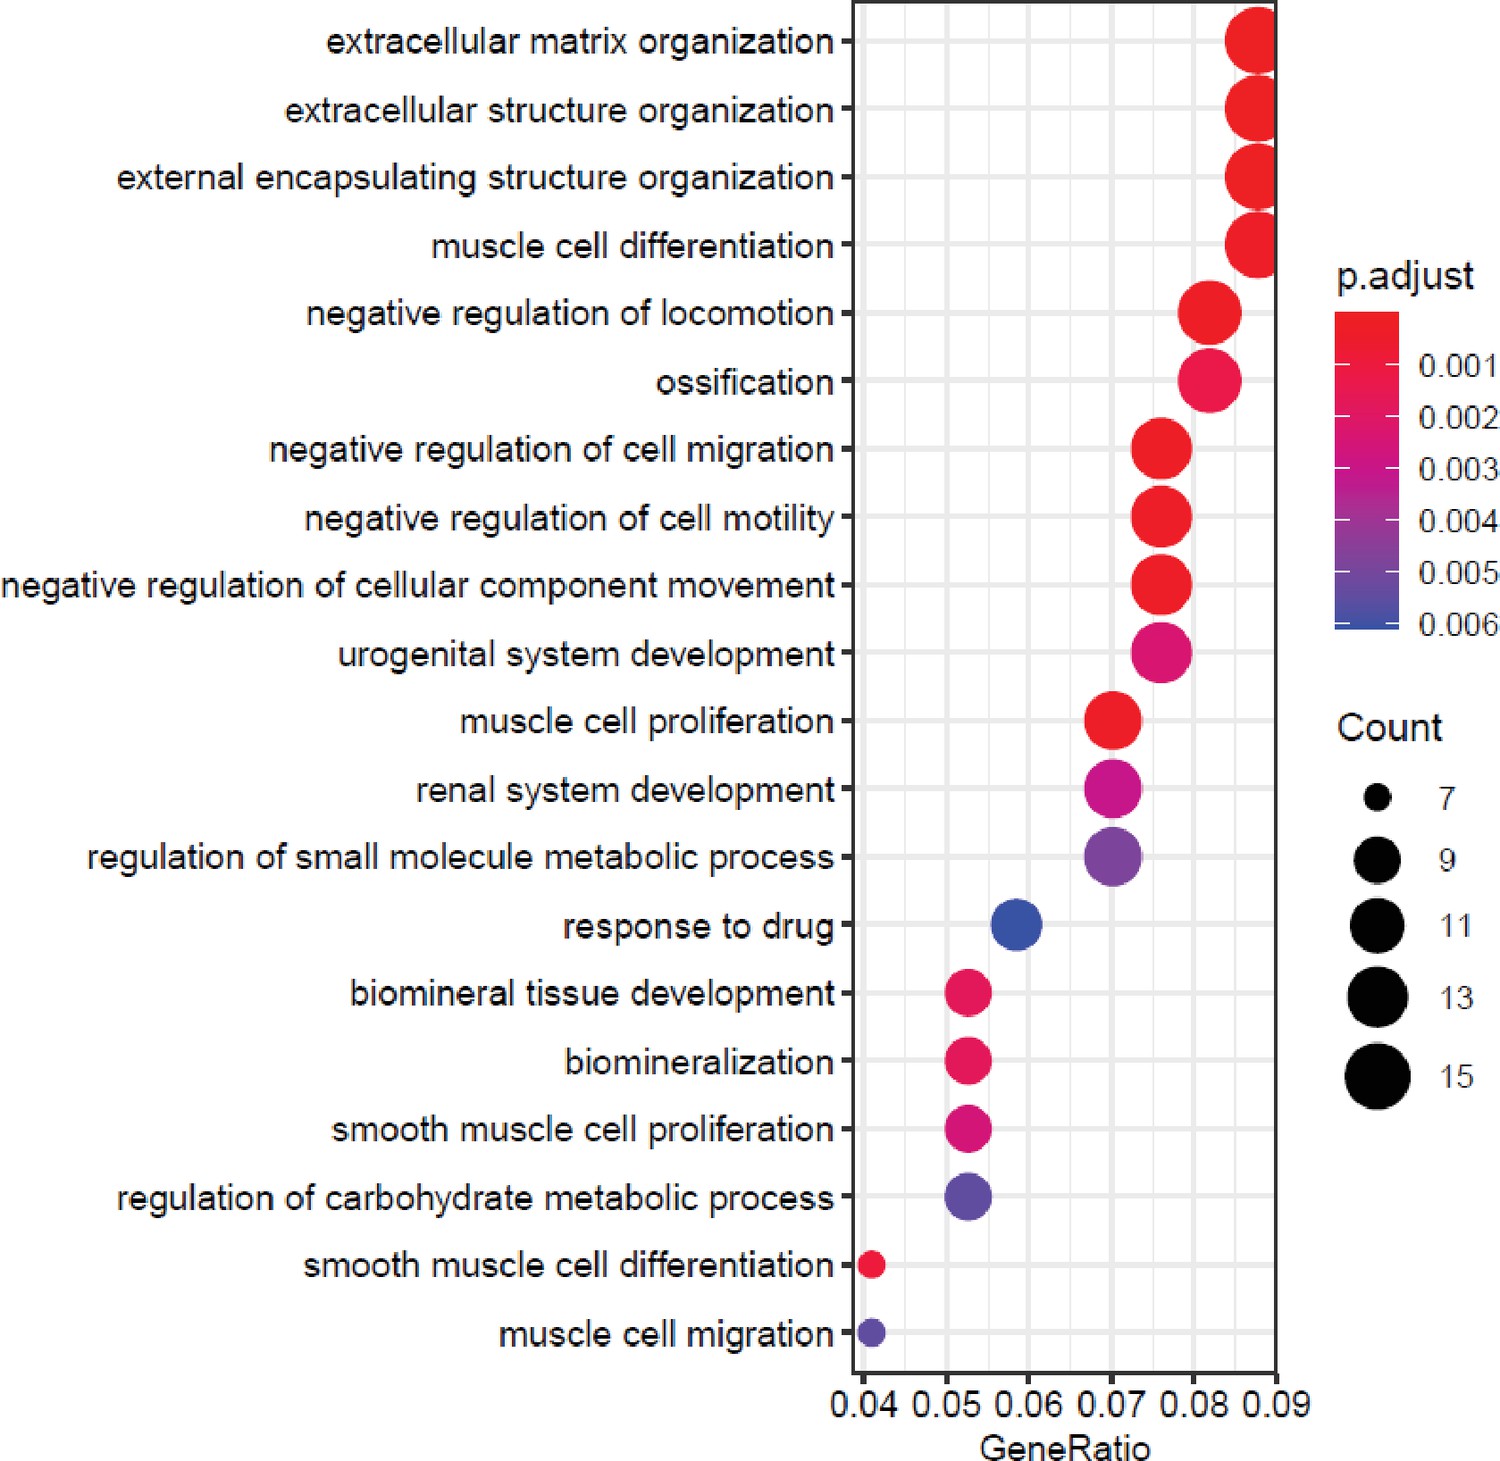
Brf1 knockdown produces gene changes that are enriched in gene ontology (GO) terms related to bone biology and immune responses.
Top 20 biological process-related GO enrichment terms of genes changed by Brf1 knockdown on day 0. Genes with padj<0.05 and log2fold >0.7 in either direction, were used for analysis.
Figure 6—figure supplement 5
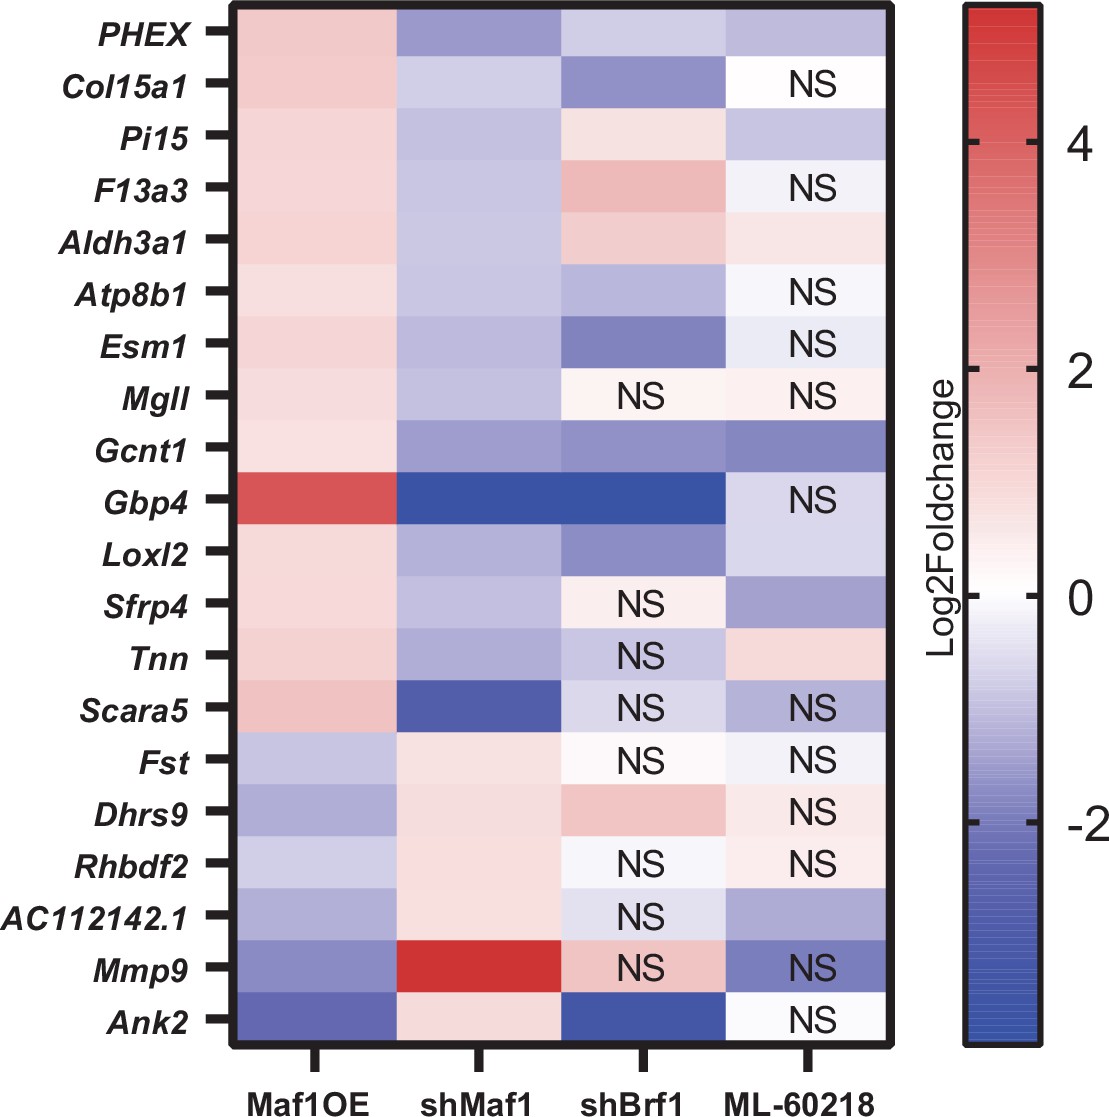
Genes altered by changes in MAF1 expression prior to differentiation.
Genes that were significantly altered on day 0 in opposing directions by MAF1 overexpression and MAF1 knockdown by at least log2fold 0.7 are shown. Changes in corresponding genes after Brf1 knockdown or ML-60218 treatment are shown. NS: not significantly affected.
Figure 7
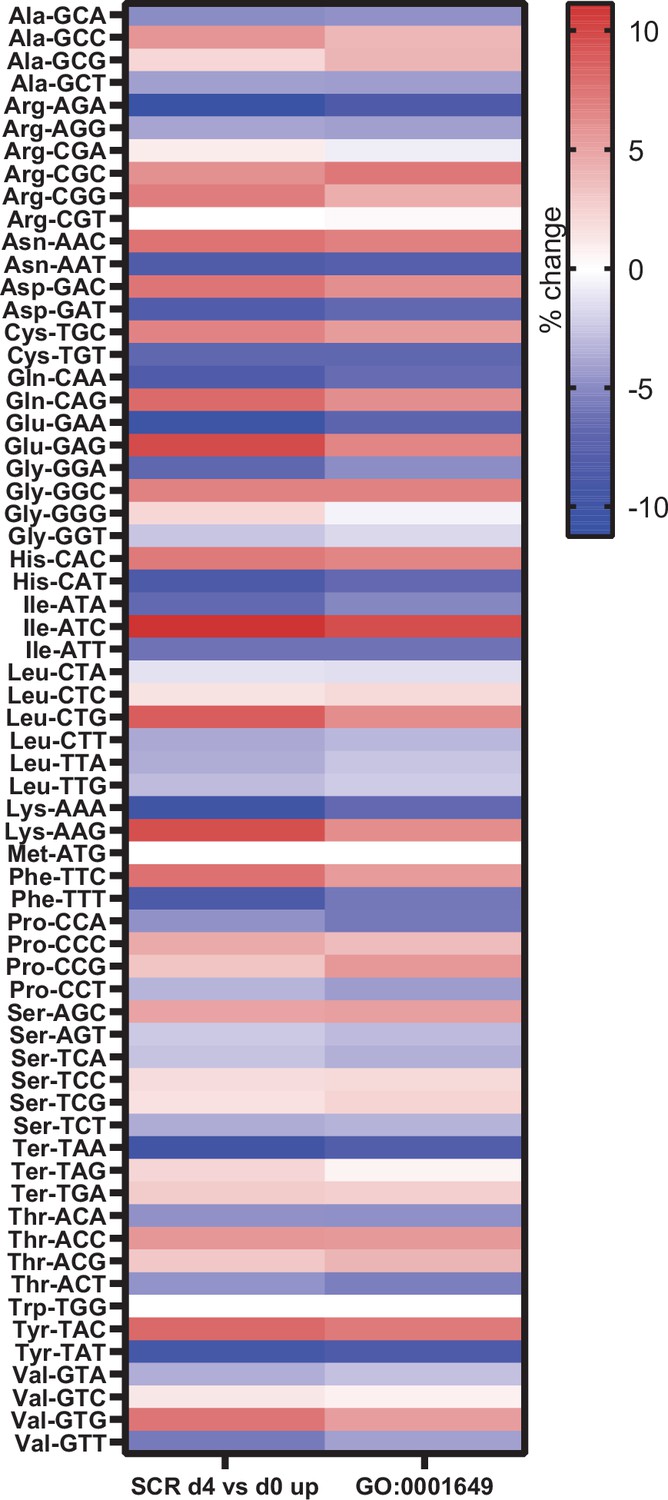
Genes expressed during osteoblast differentiation display significant codon bias.
Relative changes in codon usage during osteoblast differentiation day 4, compared to day 0 for SCR control cells (left) or of genes that are members of the GO term 0001649 (osteoblast differentiation) (right). Figure 7—source data 1 contains excel files with all codon analysis.
-
Figure 7—source data 1
GEO dataset analysis.
- https://cdn.elifesciences.org/articles/74740/elife-74740-fig7-data1-v2.zip
Tables
Table 1
Summary of results found by distinct manipulations of RNA pol III-mediated transcription.
| Outcome/Phenotype | Mouse line Maf1-/- | Mouse line Prx1-Cre-MAF | ST2 cell line MAF1 OE | ST2 cell line shMAF1 | ST2 cell line shBrf1 | ST2 cell line ML-60218 |
|---|---|---|---|---|---|---|
| RNA pol III transcription | Increased | Decreased | Decreased | Increased | Decreased | Decreased |
| Bone mass | Increased | Increased | N/A | N/A | N/A | N/A |
| In vitro osteoblast differentiation/ mineralization | Decreased | Increased | Increased | Decreased | Decreased | Decreased |
| In vivo bone marrow adipocyte number | Decreased | ND | N/A | N/A | N/A | N/A |
| In vitro adipocyte differentiation | Decreased | ND | Increased | ND | Increased | Increased |
Key resources table
| Reagent type (species) or resource | Designation | Source or reference | Identifiers | Additional information |
|---|---|---|---|---|
| Strain, strain background (Mus musculus) | Rosa26-Lox-stop-lox-MAF1-HA; LSL-MAF1 | This paper | An engineered construct of Rosa26-Lox-stop-lox-MAF1-HA was injected into C57Bl6/J mice embryonic stem cells. chimeric mice were created by by blastocyst injection of homologous recombinant clones. | |
| Strain, strain background (M. musculus) | Maf1-/- | Bonhoure et al., 2015 | Mouse line maintained in Dr. I Willis lab. | |
| Strain, strain background (M. musculus) | Prrx1Cre | Jackson laboratory | Strain #:005584 | |
| Cell line (M. musculus) | ST2 | RIKEN cell bank | #RCB0224 | |
| Transfected construct (M. musculus) | Scramble shRNA | Addgene, Sheila Steward | #17,920 | Lentiviral construct to express shRNA |
| Transfected construct (M. musculus) | MAF1 shRNA#1 | Millipore sigma | TRCN0000125776 | Lentiviral construct to express shRNA |
| Transfected construct (M. musculus) | MAF1 shRNA#2 | Millipore sigma | TRCN0000125778 | Lentiviral construct to express shRNA |
| Transfected construct (M. musculus) | Brf1 shRNA#1 | Millipore sigma | TRCN0000119897 | Lentiviral construct to express shRNA |
| Transfected construct (M. musculus) | Brf1 shRNA#2 | Millipore sigma | TRCN0000119901 | Lentiviral construct to express shRNA |
| Transfected construct (M. musculus) | pInducer20 | Addgene Stephen Elledge | #44,012 | Lentiviral construct to express shRNA |
| Transfected construct (Human) | pInducer20-MAF1-HA | This paper | pInd20-MAF1-HA was cloned by taking MAF1-HA from pFTREW-MAF1-HA into a pInducer20 construct by gateway cloning using LR clonase. Cell line M. musculus construct: human | |
| Chemical compound, drug | Calcein | Millipore Sigma | C0875 | 10 mg/kg |
| Chemical compound, drug | Xylenol orange | Millipore Sigma | X0127 | 90 mg/kg |
| Chemical compound, drug | LR clonase | Thermo Fisher | #11791020 | |
| Chemical compound, drug | Doxycycline hyclate | Millipore Sigma | #D9891 | Used at 1 µM |
| Chemical compound, drug | ML-60218 | Millipore Sigma | #557,403 | RNA pol III inhibitor |
| Chemical compound, drug | Ascorbic acid | Sigma | #A4544 | Used at 50 µg/mL |
| Chemical compound, drug | Β-glycerolphosphate | Millipore Sigma | #35,675 | Used at 10 mM |
| Chemical compound, drug | Cetylpyridinium chloride | Sigma | #C0732 | Used at 10% for alizarin red extraction |
| Chemical compound, drug | rosiglitazone | Sigma | R2408 | Used at 1 µM |
| Chemical compound, drug | 3-isobutyl-1-methyl xanthine | Sigma | I5879 | Used at 0.5 mM |
| Chemical compound, drug | dexamethasone | Sigma | D4902 | Used at 2 µM |
| Chemical compound, drug | Insulin | Sigma | I05016 | Used at 10 µg/mL |
| Chemical compound, drug | RNA stat-60 | Tel-test Inc | #NC9256697 | |
| Chemical compound, drug | Alizarin Red | Sigma | #A5533 | Used at 1% at ph 4.2 |
| Chemical compound, drug | Oil red O | Sigma | #01391 | Used at 0.3% |
| Chemical compound, drug | collagenase IV | Gibco | #17104019 | Used at 2.5% |
| Commercial assay or kit | TRAP staining kit | Sigma | #387A-1KT | |
| Commercial assay or kit | Von Kossa staining | Statlab | #KTVKO | |
| Commercial assay or kit | Alkaline phosphatase staining | Vector laboratories | #SK5300 | |
| Commercial assay or kit | Quick-RNA miniprep kit | Zymo | #R1055 | Used for RNA isolation from cell culture |
| Commercial assay or kit | Direct-zol RNA miniprep kit | Zymo | #R2052 | Used for RNA isolation from femurs |
| Commercial assay or kit | Superscript IV First Strand Synthesis Kit | Invitrogen | #18091050 | cDNA synthesis |
| Commercial assay or kit | SYBR fast qPCR mastermix | KAPA Biosystems | #KK4602 | |
| Peptide, recombinant protein | M-CSF | Peprotech | #300–25 | Used at 30 ng/mL |
| Peptide, recombinant protein | RANK-L | Peprotech | #310–01 C | Used at 100 ng/mL |
| Peptide, recombinant protein | FGF2 | Biovision | #4,038 | Used at 10 ng/mL |
| Commercial assay or kit | DC protein assay | Biorad | #5000112 | |
| Antibody | Anti-MAF1 (H2) (mouse monoclonal) | Santa Cruz | #SC-515614 | (Wb 1:500) |
| Antibody | Anti-TFIIIB90 (mouse monoclonal) | Santa Cruz | #SC-390821 | Antibody to Brf1. (Wb 1:1000) |
| Antibody | Anti-VINCULIN (mouse monoclonal) | Santa Cruz | # sc-73614 AF488 | (Wb 1:5000) |
| Antibody | Anti-RUNX2 (rabbit monoclonal) | Cell Signaling | #12,556 | (Wb 1:1000) |
| Antibody | Anti-PPARγ (rabbit monoclonal) | Cell Signaling | #2,435 | (Wb 1:1000) |
| Antibody | Anti-FABP4 (rabbit monoclonal) | Cell Signaling | #3,544 | (Wb 1:1000) |
| Antibody | Anti-HA (Rat monoclonal) | Roche | #11867423001 | (Wb 1:1000) |
| Software, algorithm | R- studio | https://rstudio.com | Version 4.1.1 | |
| Software, algorithm | DeSeq2 | 10.18129/B9.bioc.DESeq2 | ||
| Software, algorithm | clusterProfiler | doi.org/10.1016 /j.xinn.2021.100141 | ||
| Software, algorithm | InteractiVenn | 10.1186 /s12859-015-0611-3 | ||
| Software, algorithm | Graphpad prism | https://www.graphpad.com/ | Version 9.3.1 |
Appendix 1—table 1
qPCR primers used for genotyping and qRT-PCR analysis.
| Target | Forward primer | Reverse primer | citation |
|---|---|---|---|
| Cre (genotyping) | TCCAATTTACTGAC CGTACACCAA | CCTGATCCTGGC AATTTCGGCTA | |
| LSL-MAF1 (genotyping) | TTCACTTCATAC CCATACGACG | CCATTTTCCTTA TTTGCCCCTA | |
| WT Maf1 | AGGCTTGCAGG GCAGCAATG | CACTGGCTGACA GGGAGATG | Bonhoure et al., 2015 |
| Maf1 KO (genotyping) | AGGCTTGCAGG GCAGCAATG | TGGCCCTTAGAG CTGGAGTG | Bonhoure et al., 2015 |
| Pre-tRNALeu | GTCAGGATGGCC GAGTGGTCTAAG | CCACGCCTCCATACGGA GAACCAGAAGACCC | Chen et al., 2018 |
| Pre-tRNAiMet | CTGGGCCCAT AACCCAGAG | TGGTAGCAGA GGATGGTTTC | Chen et al., 2018 |
| Pre-tRNAIle | GTTAGCGCGC GGTACTTATA | GGATCGAACT CACAACCTCG | Graczyk et al., 2015 |
| Pre-tRNAPro | GGCTCGTTGGTCTAGGG | TTTGAACCCGGGACCTC | Graczyk et al., 2018 |
| Maf1 | GACTATGACTTC AGCACAGCC | CTGGGTTATAGC TGTAGATGTCAC | Chen et al., 2018 |
| Brf1 | GGAAAGGAATCAAG AGCACAGACCC | GTCCTCGGGTAA GATGCTTGCTT | Chen et al., 2018 |
| Runx2 | AGGGACTATGG CGTCAAACA | GGCTCACGT CGCTCATCTT | Fujioka-Kobayashi et al., 2016 |
| Col1a1 | CCCAATGGTG AGACGTGGAA | TTGGGTCCCT CGACTCCTAC | |
| Sp7 | ATGGCGTCCT CTCTGCTTG | GTCCATTGGT GCTTGAGAAGG | Fitter et al., 2017 |
| Bglap | TCTGACAAAG CCTTCATGTCC | AAATAGTGATA CCGTAGATGCG | Pustylnik et al., 2013 |
| Alp | CGGATCCTGA CCAAAAACC | TCATGATGT CCGTGGTCAAT | |
| Ibsp | GAAAATGGAG ACGGCGATAG | CATTGTTTTC CTCTTCGTTTGA | |
| EF1a | CTGAACCATC CAGGCCAAAT | GGCTGTGT GACAATCCAG | Van Itallie et al., 2006 |
| β-actin | CGACAACGGC TCCGGCATG | CTGGGGTGTTGAA GGTCTCAAACATG | |
| Rankl | CAGCCATTTGC ACACCTCAC | GTCTGTAGGT ACGCTTCCCG | |
| Opg | AGGAACTGCA GTCCGTGAAG | ATTCCACACT TTTGCGTGGC | |
| Ppia1 | CGAGCTGTTTGCAG ACAAAGTTCC | CCCTGGCACA TGAATCCTGG | Chen et al., 2018 |
| Pparg | ATCATCTACACG ATGCTGGCCT | TGAGGAACTCC CTGGTCATGAATC | Chen et al., 2018 |
| Pparg2 | TCGCTGATGCA CTGCCTATGA | GGAGAGGTC CACAGAGCTGAT | |
| Cebpa | GAACAGCAACGA GTACCGGGTA | CCATGGCCTT GACCAAGGAG | Chen et al., 2018 |
| Fabp4 | TGGGAACCTG GAAGCTTGTCT | TCGAATTCCAC GCCCAGTTTGA | Chen et al., 2018 |
Additional files
-
Supplementary file 1
Maf1-/- mice show increased bone mass in the spine.
- https://cdn.elifesciences.org/articles/74740/elife-74740-supp1-v2.docx
-
Transparent reporting form
- https://cdn.elifesciences.org/articles/74740/elife-74740-transrepform1-v2.docx
Download links
A two-part list of links to download the article, or parts of the article, in various formats.
Downloads (link to download the article as PDF)
Open citations (links to open the citations from this article in various online reference manager services)
Cite this article (links to download the citations from this article in formats compatible with various reference manager tools)
MAF1, a repressor of RNA polymerase III-dependent transcription, regulates bone mass
eLife 11:e74740.
https://doi.org/10.7554/eLife.74740


