Mammals adjust diel activity across gradients of urbanization
- Environmental Science and Policy, College of Science, George Mason University, United States
- Urban Wildlife Institute, Conservation and Science Department, Lincoln Park Zoo, United States
- Department of Natural Resource Science, The University of Rhode Island, United States
- Department of Horticulture and Natural Resources, Kansas State University, United States
- Department of Biological Sciences and Center for Urban Ecology and Sustainability, Butler University, United States
- Department of Biological Sciences, California State University Long Beach, United States
- Department of Environmental Science and Policy, St. Edward’s University, United States
- Department of Forest and Wildlife Ecology, University of Wisconsin-Madison, United States
- Austin Parks and Recreation, City of Austin, United States
- Department of Biological Sciences, University of Alberta, Canada
- Department of Geographical and Sustainability Sciences, University of Iowa, United States
- Department of Education & Conservation, Brandywine Zoo, United States
- The Nature Conservancy in Texas, United States
- Texas Parks and Wildlife, United States
Figures
Figure 1
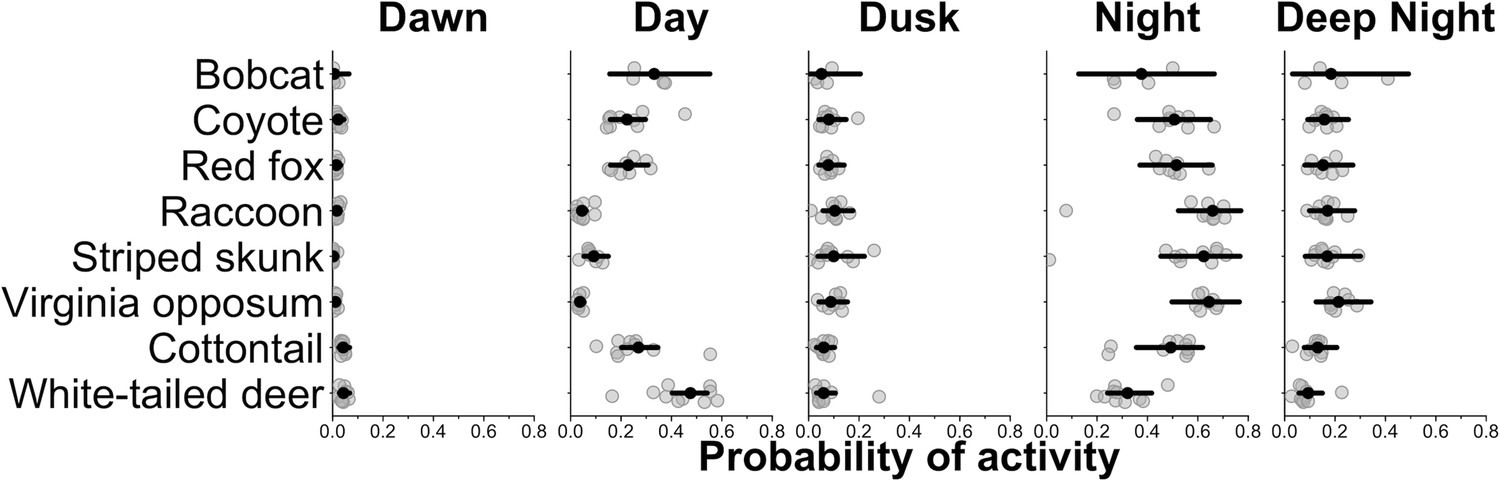
City-specific probability of activity for each species.
Gray points are city-specific estimates of the average probability of activity in each time category. The black point indicates the average probability of activity among cities and the horizontal lines are 95% credible interval for the average probability estimates among cities. Wider credible intervals indicate more variation among cities.
Figure 2

The predicted probability of activity in each time category at each sampling site (x-axis) the species was detected.
Each column on the x-axis is a stacked bar plot representing the probability of activity in each time category at each sampling site. For each bar plot, all categories sum to one. Sampling sites along the x-axis are ordered from the lowest probability of nocturnal activity to the highest.
Figure 3
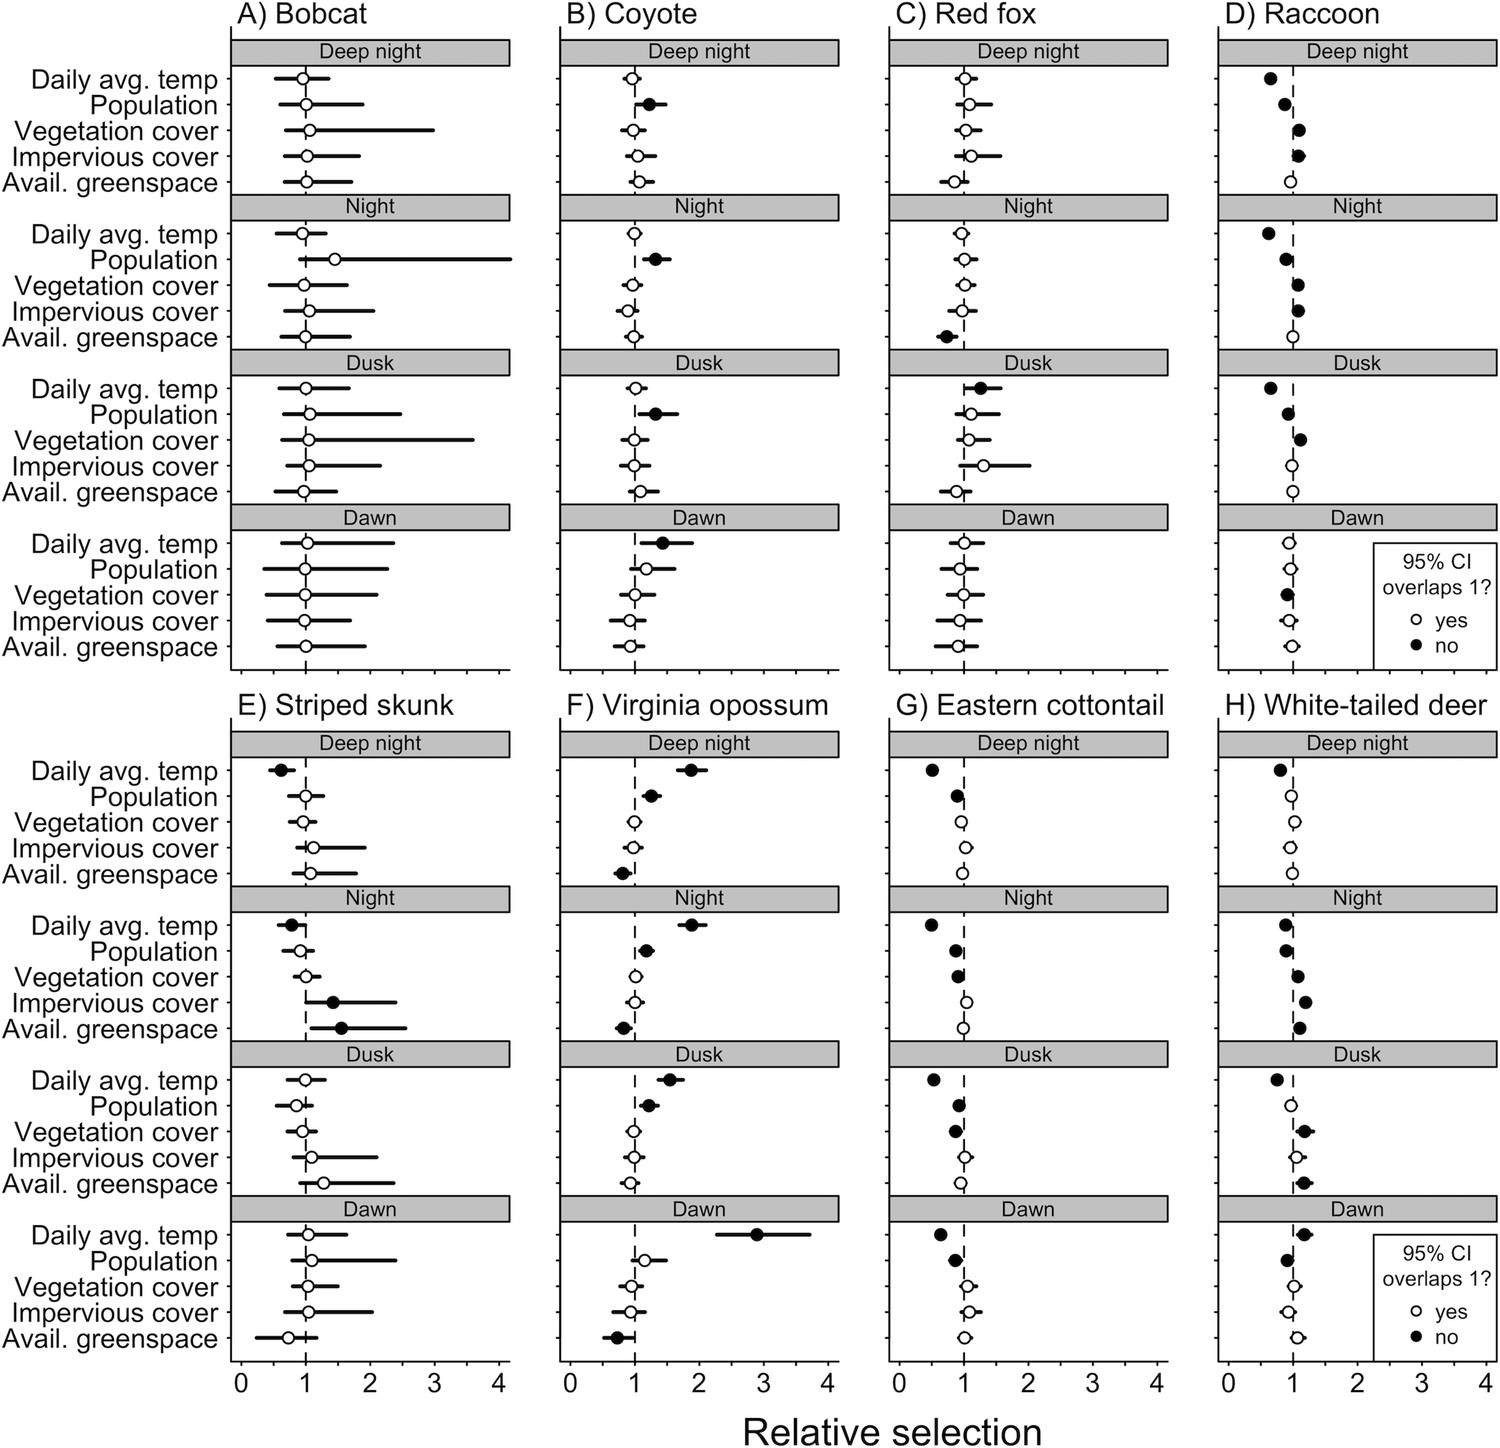
Mean (circle) and 95% credible intervals of estimated coefficients from natural and anthropogenic features on temporal selection of deep night, night, dusk, and dawn relative to day.
Figure 4
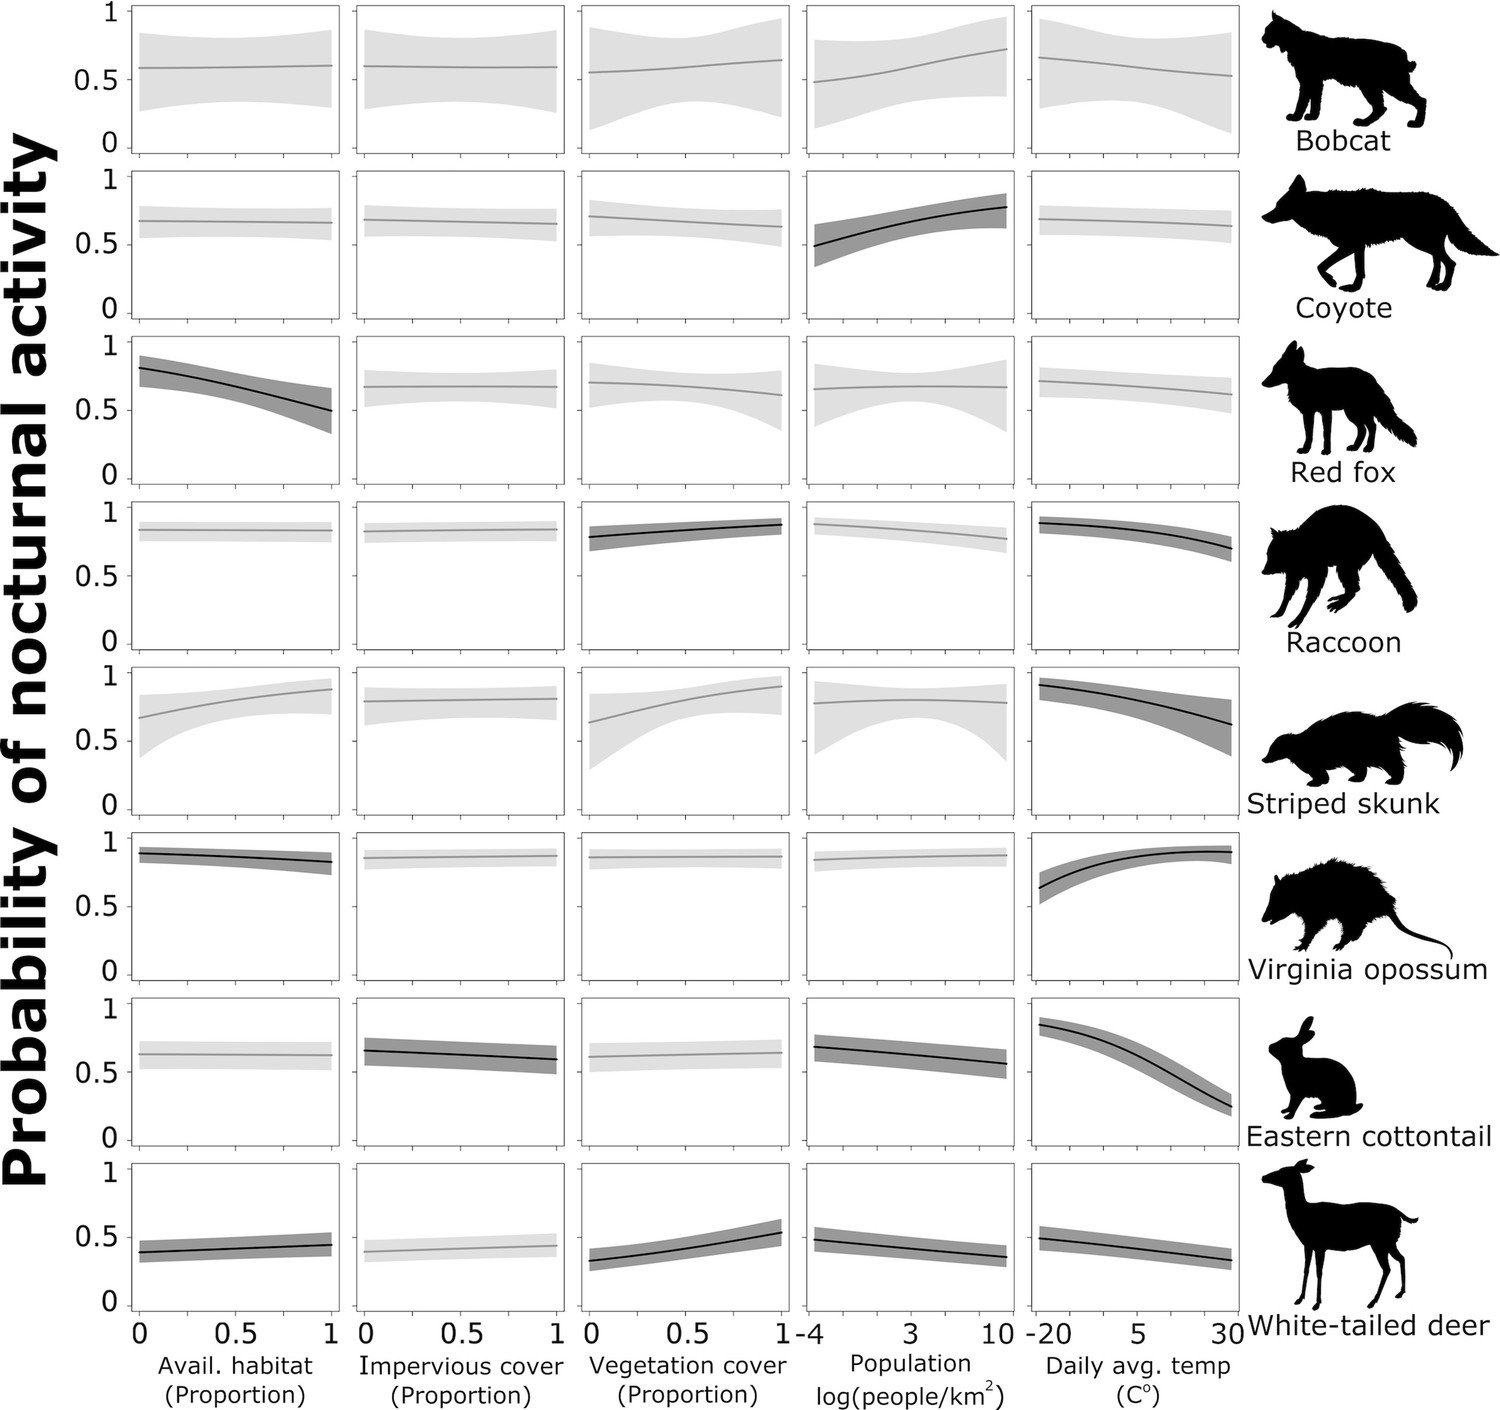
Probability of nocturnal activity (night and deep night combined) across each of our natural and anthropogenic characteristics of the urban environment.
Solid line indicates the median predicted line and shaded areas are 95% credible interval. Darker shading represent the relationships whose odds ratios did not overlap 1.
Appendix 1—figure 1
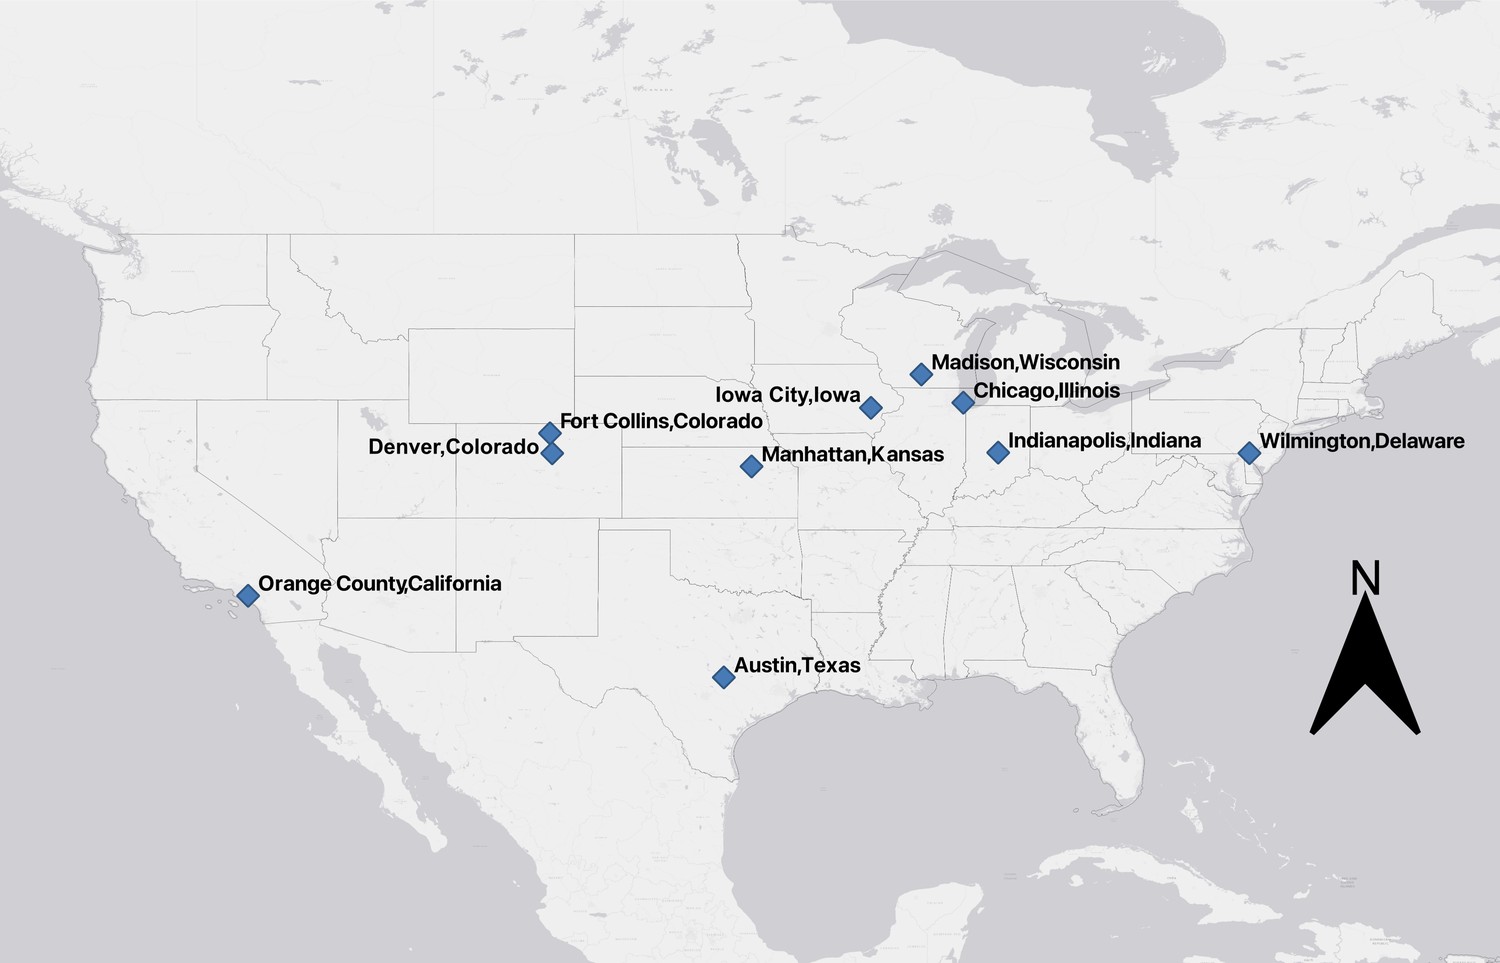
US cities where remotely triggered wildlife cameras were deployed to assess diel patterns in urban mammals.
Tables
Table 1
The total number of detections for each species, number of cities each species was detected in, mean proportion of sites each species was detected at per city, and total number of detections in each time category for 8 urban mammal species across 10 US metropolitan areas between January 2017 and December 2018.
| Species | Total detections | No. of cities species detected | Mean proportion of sites species detected per city | No. of ‘day’ detections | No. of ‘dawn’ detections | No. of ‘dusk’ detections | No. of ‘night’ detections | No. of ‘deep night’ detections |
|---|---|---|---|---|---|---|---|---|
| Bobcat | 102 | 5 | 0.16 | 29 | 1 | 9 | 45 | 18 |
| Coyote | 2732 | 9 | 0.63 | 671 | 98 | 256 | 1318 | 389 |
| Eastern cottontail | 16,102 | 10 | 0.61 | 3984 | 619 | 1097 | 8317 | 2085 |
| Raccoon | 34,931 | 10 | 0.77 | 2638 | 642 | 3767 | 21,723 | 6161 |
| Red fox | 1570 | 8 | 0.51 | 441 | 35 | 152 | 744 | 198 |
| Striped skunk | 990 | 10 | 0.24 | 89 | 24 | 98 | 584 | 195 |
| Virginia opossum | 8357 | 8 | 0.7 | 407 | 116 | 1027 | 5087 | 1720 |
| White-tailed deer | 14,875 | 10 | 0.56 | 7965 | 658 | 816 | 4299 | 1137 |
Table 2
Odds ratios for each predictor variable and a 1 and 2 standard deviation increase across their values.
Bolded text indicates scenarios where the 95% credible intervals do not overlap 1.
| Available greenspace | Impervious cover | Vegetation cover | Human pop. density | Daily avg. temp | ||||||
|---|---|---|---|---|---|---|---|---|---|---|
| 1-Unit increase | 2-Unit increase | 1-Unit increase | 2-Unit increase | 1-Unit increase | 2-Unit increase | 1-Unit increase | 2-Unit increase | 1-Unit increase | 2-Unit increase | |
| Bobcat | 1.01 | 1.03 | 1.04 | 1.09 | 1.00 | 1.00 | 1.27 | 1.64 | 0.94 | 0.89 |
| (0.72–1.58) | (0.52–2.58) | (0.74–1.75) | (0.54–3.18) | (0.57–1.77) | (0.30–3.51) | (0.87–3.09) | (0.74–10.4) | (0.59–1.24) | (0.35–1.56) | |
| Coyote | 0.99 | 0.97 | 0.94 | 0.89 | 0.97 | 0.94 | 1.18 | 1.38 | 0.95 | 0.89 |
| (0.88–1.10) | (0.76–1.22) | (0.80–1.09) | (0.64–1.19) | (0.84–1.09) | (0.71–1.18) | (1.04–1.35) | (1.05–1.80) | (0.87–1.03) | (0.74–1.06) | |
| Red fox | 0.79 | 0.62 | 0.94 | 0.87 | 1.00 | 0.99 | 1.00 | 1.00 | 0.92 | 0.83 |
| (0.66–0.93) | (0.44–0.86) | (0.75–1.14) | (0.53–1.30) | (0.89–1.13) | (0.78–1.27) | (0.86–1.17) | (0.73–1.38) | (0.82–1.01) | (0.66–1.02) | |
| Raccoon | 0.99 | 0.99 | 1.10 | 1.20 | 1.02 | 1.03 | 0.93 | 0.87 | 0.81 | 0.63 |
| (0.95–1.03) | (0.91–1.07) | (1.05–1.16) | (1.10–1.34) | (0.98–1.06) | (0.96–1.11) | (0.90–0.97) | (0.81–0.94) | (0.76–0.85) | (0.55–0.70) | |
| Striped skunk | 1.26 | 1.58 | 1.27 | 1.60 | 1.02 | 1.04 | 1.00 | 0.99 | 0.75 | 0.56 |
| (0.93–1.77) | (0.84–3.09) | (0.93–1.87) | (0.85–3.48) | (0.86–1.22) | (0.73–1.49) | (0.79–1.22) | (0.60–1.46) | (0.59–0.92) | (0.35–0.84) | |
| Virginia opossum | 0.88 | 0.77 | 1.01 | 1.02 | 1.03 | 1.05 | 1.04 | 1.07 | 1.25 | 1.42 |
| (0.81–0.96) | (0.65–0.92) | (0.91–1.12) | (0.82–1.24) | (0.96–1.10) | (0.92–1.20) | (0.97–1.11) | (0.93–1.23) | (1.14–1.36) | (1.10–1.70) | |
| Eastern cottontail | 0.99 | 0.99 | 1.03 | 1.05 | 0.93 | 0.87 | 0.90 | 0.81 | 0.57 | 0.31 |
| (0.95–1.04) | (0.90–1.07) | (0.97–1.09) | (0.94–1.18) | (0.89–0.98) | (0.78–0.96) | (0.86–0.94) | (0.75–0.89) | (0.53–0.60) | (0.27–0.34) | |
| White-tailed deer | 1.05 | 1.11 | 1.14 | 1.31 | 1.04 | 1.09 | 0.92 | 0.85 | 0.88 | 0.77 |
| (1.00–1.10) | (1.01–1.22) | (1.07–1.21) | (1.16–1.47) | (1.00–1.09) | (0.99–1.19) | (0.88–0.96) | (0.78–0.92) | (0.84–0.92) | (0.70–0.84) | |
Additional files
-
Supplementary file 1
Additional data tables that summarize observations from remotely triggered wildlife cameras and environmental variables associated with sampling sites across 10 US cities.
- https://cdn.elifesciences.org/articles/74756/elife-74756-supp1-v2.docx
-
Transparent reporting form
- https://cdn.elifesciences.org/articles/74756/elife-74756-transrepform1-v2.docx
Download links
A two-part list of links to download the article, or parts of the article, in various formats.
Downloads (link to download the article as PDF)
Open citations (links to open the citations from this article in various online reference manager services)
Cite this article (links to download the citations from this article in formats compatible with various reference manager tools)
Mammals adjust diel activity across gradients of urbanization
eLife 11:e74756.
https://doi.org/10.7554/eLife.74756


