Predictions and experimental tests of a new biophysical model of the mammalian respiratory oscillator
- Department of Mathematics, University of Pittsburgh, United States
- Center for the Neural Basis of Cognition, United States
- Cellular and Systems Neurobiology Section, NINDS, NIH, United States
- Department of Mathematics and Statistics, Georgia State University, United States
- Neuroscience Institute, Georgia State University, United States
Figures
Figure 1 with 1 supplement
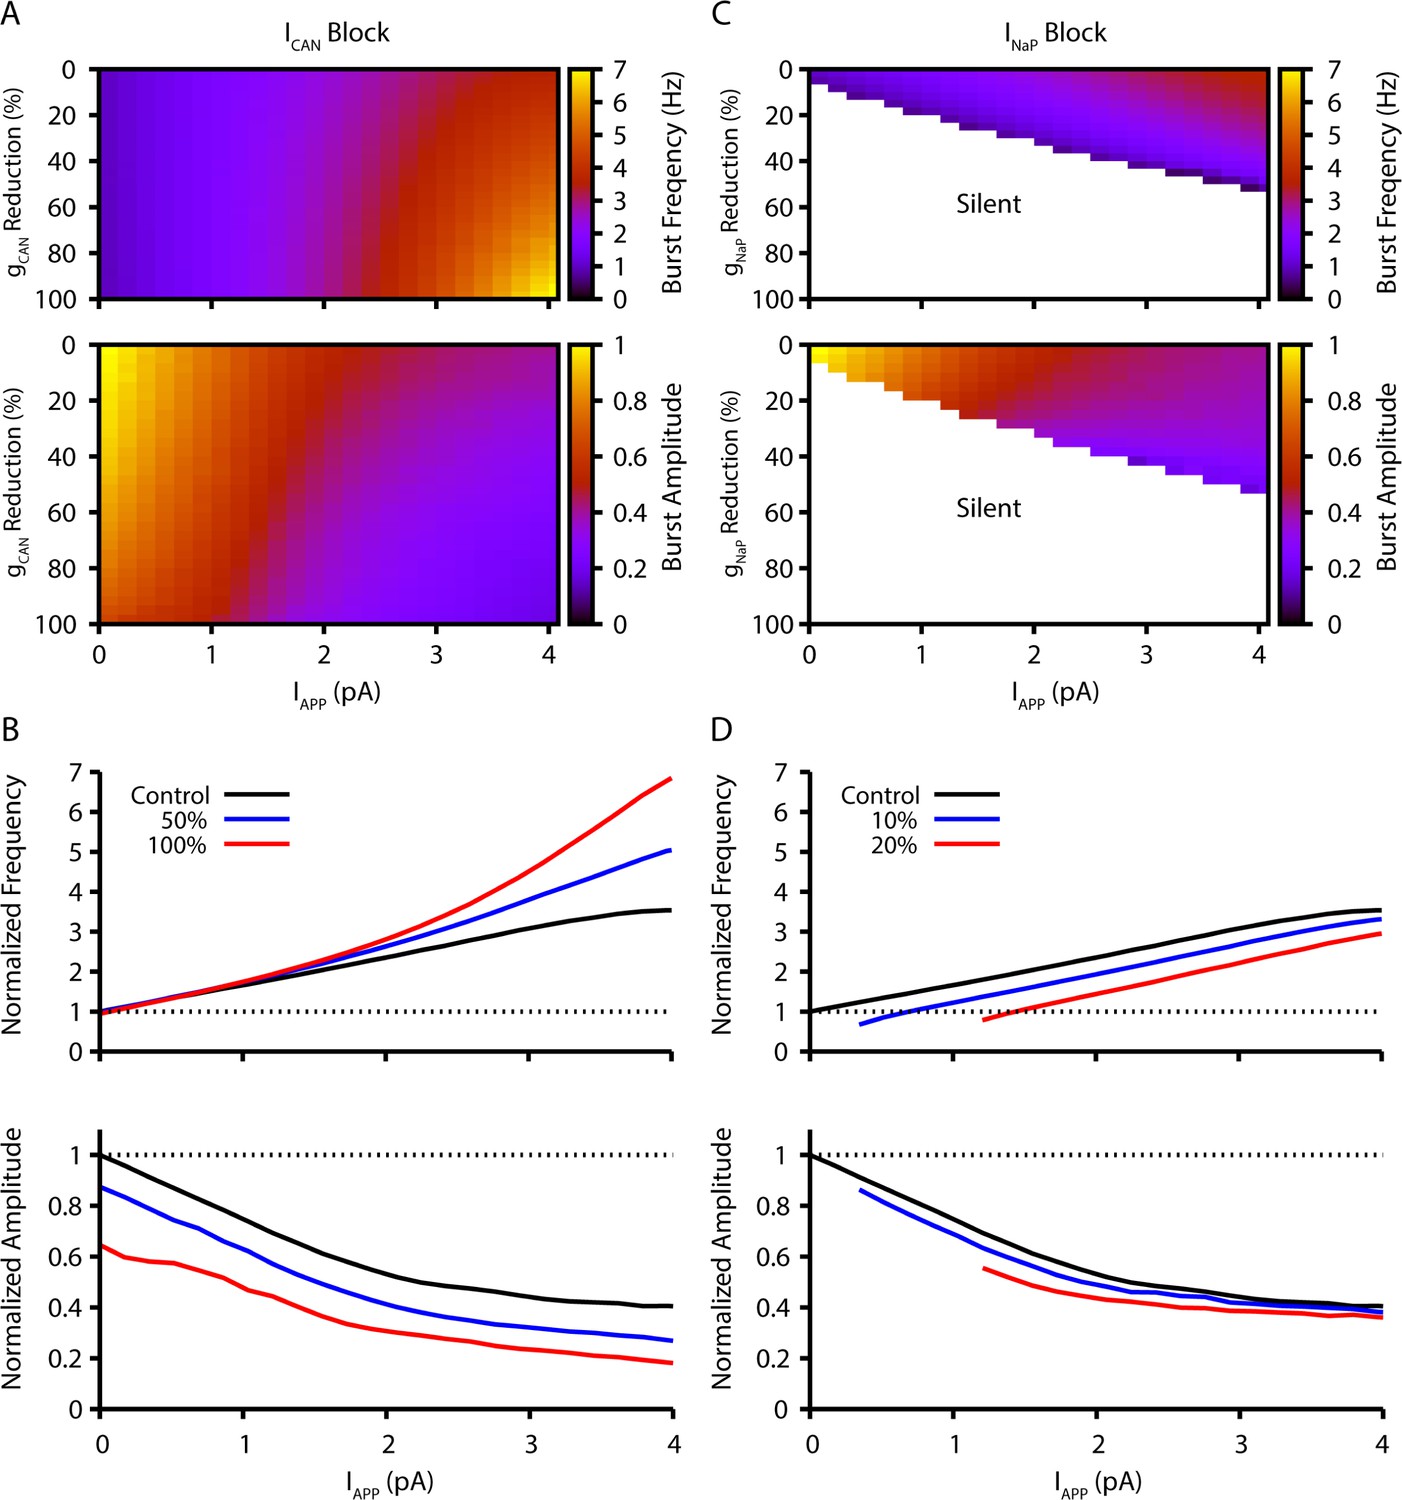
Model simulation predictions for the relationships between applied current (IApp) and population burst frequency and amplitude of synaptically coupled excitatory neurons (N=100) incorporating neuronal persistent sodium current (INaP) and calcium-activated non-selective cation current (ICAN) over a range of conductances (calcium-activated non-selective cation conductance [gCAN], neuronal persistent sodium conductance [gNaP]).
Pharmacological block of INaP and ICAN is simulated by a percent reduction of their respective conductances. (A & B) Model parameter space plots color-coded from simulations show effects on frequency (upper panel in A) and amplitude (lower panel in A) of reductions in gCAN, and in (B) at fixed levels of reductions (50%, 100%) in gCAN from initial control values over a wide range of IApp. (C & D) Parameter space plots showing effects in (C) of reductions in gNaP on frequency and amplitude of model neuronal population activity, and in (D) at fixed levels of reduction (10%, 20%) in gNaP from control. Color scale bars for values of burst frequency and amplitude are at right of plots in (A) and (C). Frequencies and amplitudes of population activity in (C) and (D) are normalized to control values.
-
Figure 1—source data 1
Related to Figure 1A–D.
- https://cdn.elifesciences.org/articles/74762/elife-74762-fig1-data1-v1.xlsx
Figure 1—figure supplement 1
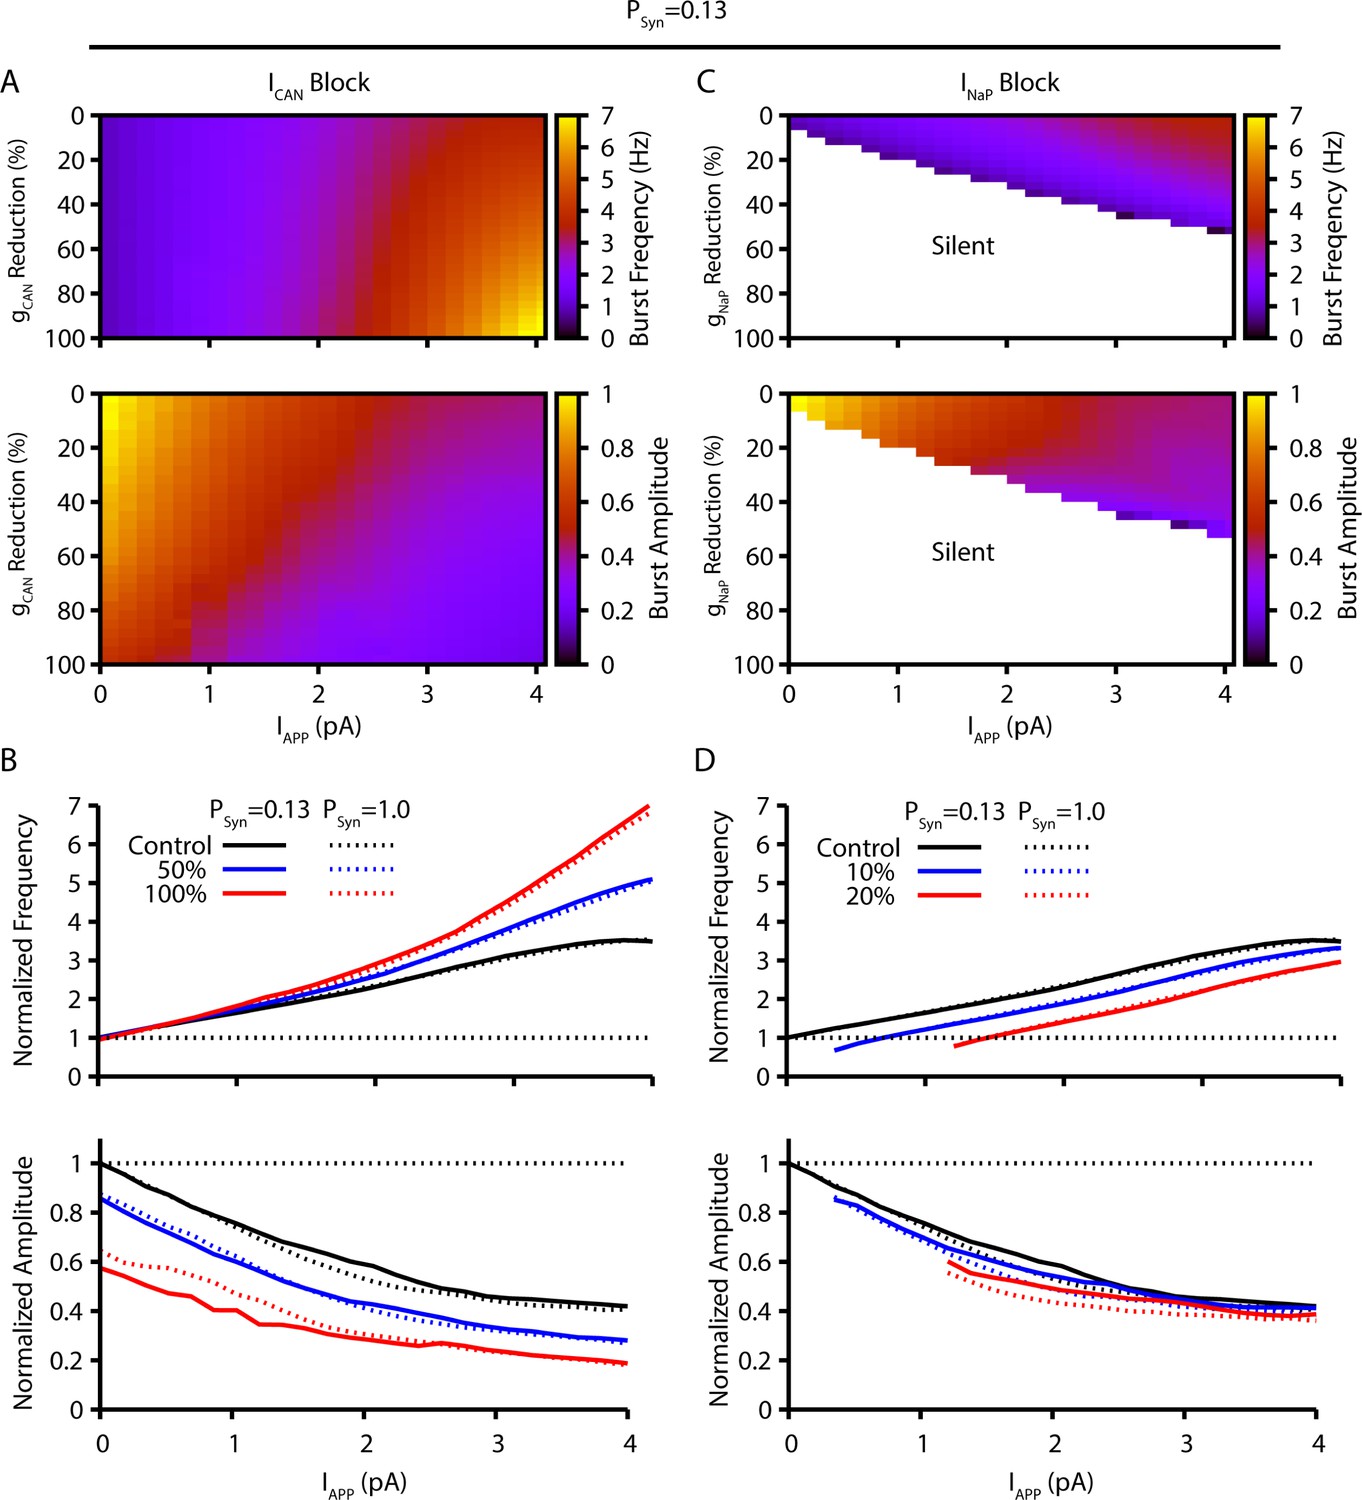
Comparison of model simulation predictions with a lower synaptic connection probability of 13% (pSyn=0.13), as experimentally approximated by Rekling et al., 2000, with those presented in Figure 1.
Simulations characterize the predicted relationships between applied current (IApp) and population burst frequency and amplitude of synaptically coupled excitatory neurons (N=100) incorporating neuronal persistent sodium current (INaP) and calcium-activated non-selective cation current (ICAN) over a range of conductances (calcium-activated non-selective cation conductance [gCAN], neuronal persistent sodium conductance [gNaP]). Pharmacological block of INaP and ICAN is simulated by a percent reduction of their respective conductances. (A & B) Model parameter space plots color-coded from simulations show effects on frequency (upper panel in A) and amplitude (lower panel in A) of reductions in gCAN, and in (B) at fixed levels of reductions (50%, 100%) in gCAN from initial control values over a wide range of IApp. (C & D) Parameter space plots showing effects in (C) of reductions in gNaP on frequency and amplitude of model neuronal population activity, and in (D) at fixed levels of reduction (10%, 20%) in gNaP from control. Color scale bars for values of burst frequency and amplitude are at right of plots in (A) and (C). Frequencies and amplitudes of population activity in (C) and (D) are normalized to control values. The simulation results shown for the two different synaptic connectivity probabilities are qualitatively similar since the synaptic strength remains constant (i.e. number of neurons [N] × connection probability [pSyn] x synaptic weight [Wmax]=constant), which was achieved in the simulations for these two cases by adjusting Wmax.
-
Figure 1—figure supplement 1—source data 1
Related to Figure 1—figure supplement 1A-D.
- https://cdn.elifesciences.org/articles/74762/elife-74762-fig1-figsupp1-data1-v1.xlsx
Figure 2

Channelrhodopsin-2 (ChR2)-mediated membrane depolarization of preBötzinger complex (preBötC) vesicular glutamate transporter type-2 (VgluT2)-positive inspiratory neurons in vitro.
(A) Two-photon microscopy single optical plane live images of the preBötC subregion in an in vitro neonatal medullary slice preparation from the VgluT2-tdTomato-ChR2-EYFP transgenic mouse line, illustrating tdTomato-labeled VgluT2-positive neurons distributed in the preBötC and adjacent regions (red) and expression of ChR2-EYFP (green) in somal membranes and neuronal processes of VgluT2-tdTomato neurons, as seen in the merged image. Abbreviations: d, dorsal; l, lateral; NAsc, semi-compact subdivision of nucleus ambiguus. (B) Overview of experimental in vitro rhythmic slice preparation from a neonatal VgluT2-tdTomato-ChR2 transgenic mouse showing whole-cell patch-clamp recording from a functionally identified preBötC inspiratory VgluT2-positive neuron with unilateral preBötC laser illumination (0.5–5 mW) to test for neuronal expression of ChR2, and suction-electrode extracellular recordings from hypoglossal (XII) nerves to monitor inspiratory activity. Regional photostimulation was accomplished with a 100-µm diameter optical cannula positioned at the slice surface above the preBötC region. Abbreviations: V4, fourth ventricle; IO, inferior olivary nucleus. Upper right in (B) two-photon single optical plane images showing an imaged preBötC inspiratory neuron (arrow) targeted for whole-cell recording. From left, Dodt gradient contrast structural image, VgluT2-Cre driven tdTomato labeling, ChR2-EYFP expression, and merged image that confirm co-expression of tdTomato and ChR2-EYFP. The lower right traces are current-clamp recordings from the VgluT2-positive preBötC neuron shown in the above images, illustrating inspiratory spikes/bursts synchronized with integrated inspiratory XII nerve activity (∫XII). The traces shown at right within the dashed box are expanded time scale traces of the bursting activity within the dashed box in the left traces. (C) The membrane potential (Vm) of the neuron shown in (B) was depolarized during photostimulation by ~6.0 mV at 1 mW, ~8.5 mV at 2 mW, and ~11.5 mV at 5 mW of laser power (spikes are truncated). The neuron was hyperpolarized from resting baseline potential to –74 mV by applying constant current in this example to reveal the magnitude of the light-induced membrane depolarization. Photostimulation was performed in the interval between inspiratory population bursts. (D) Summary data (n=12 neurons from four slice preparations, mean ± SEM) showing the laser-power-dependent, ChR2-mediated neuronal membrane depolarization from baseline (ΔVM) of VgluT2-positive preBötC inspiratory neurons.
-
Figure 2—source data 1
Related to Figure 2D.
- https://cdn.elifesciences.org/articles/74762/elife-74762-fig2-data1-v1.xlsx
Figure 3
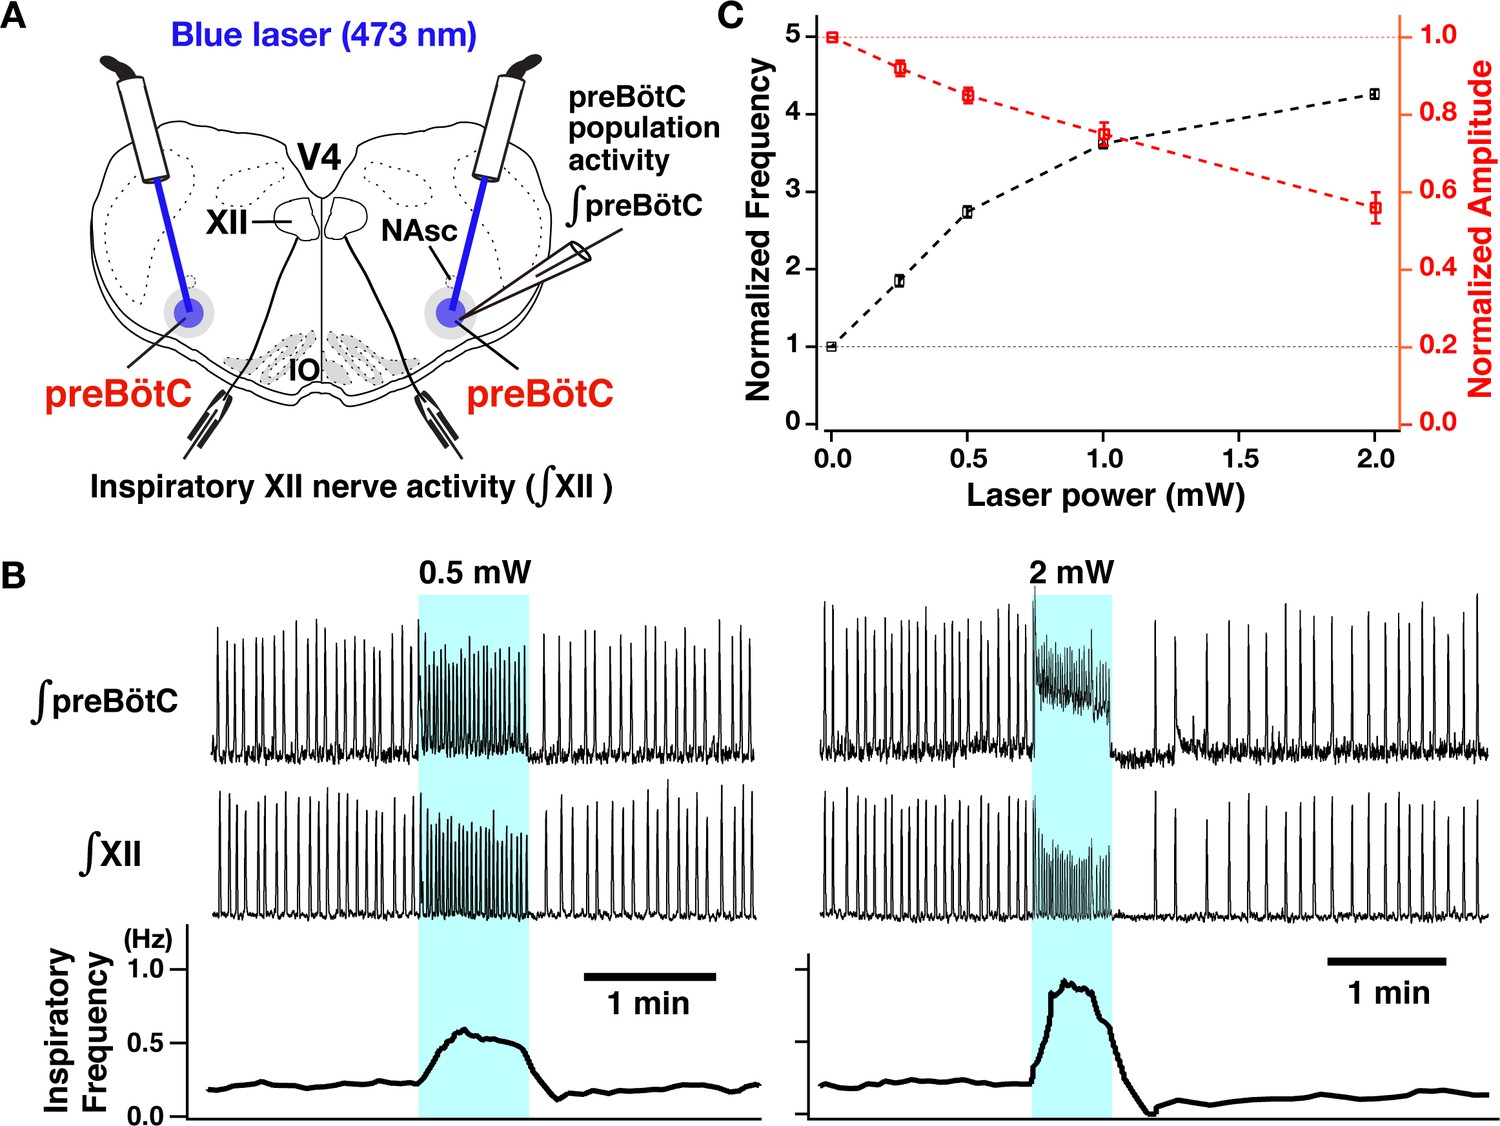
Photostimulation of the bilateral preBötzinger complex (preBötC) vesicular glutamate transporter type-2 (VgluT2)-positive neuron population caused laser-power-dependent increases of inspiratory burst frequency and decreases of burst amplitude.
(A) Overview of experimental in vitro rhythmically active slice preparation from neonatal VgluT2-tdTomato-channelrhodopsin-2 transgenic mouse with macro-patch electrodes on the preBötC region for recording preBötC population activity and suction electrodes on hypoglossal (XII) nerves to monitor inspiratory motor activity during bilateral preBötC laser illumination (0.25–2 mW, 473 nm wavelength) with optical cannula (100 µm diameter) positioned obliquely to illuminate the preBötC region. Abbreviations: NAsc, nucleus ambiguus semi-compact subdivision; V4, fourth ventricle; IO, inferior olivary nucleus. (B) Representative examples of epochs of bilateral preBötC laser illumination and effects on inspiratory burst frequency and burst amplitude. The upper traces show the integrated macro-patch recordings from the preBötC inspiratory neuron population (∫preBötC), middle traces show the integrated inspiratory XII activity (∫XII), and the bottom traces show the inspiratory burst frequency (time-based moving median in a 10 s window). The sustained laser illumination with the laser intensity is given by blue shading. Low-intensity illumination (0.5 mW) caused significant increase (~149% in this example) of inspiratory burst frequency and decrease of inspiratory burst amplitude of both preBötC and XII population activity (~22 and~21%, respectively, left panel). Higher intensity laser illumination (2 mW; right panel) caused a larger increase (~295%) of inspiratory frequency and decrease of burst amplitude of inspiratory preBötC and XII activity (~65 and~44%, respectively). Also note that photostimulation induced tonic activity (indicated by baseline shift) in ∫preBötC population activity recordings. (C) Summary data of relations between inspiratory burst frequency and amplitude vs photostimulation laser power (n=31 slices; data points plotted are mean ± SEM).
-
Figure 3—source data 1
Related to Figure 3C.
- https://cdn.elifesciences.org/articles/74762/elife-74762-fig3-data1-v1.xlsx
Figure 4 with 1 supplement
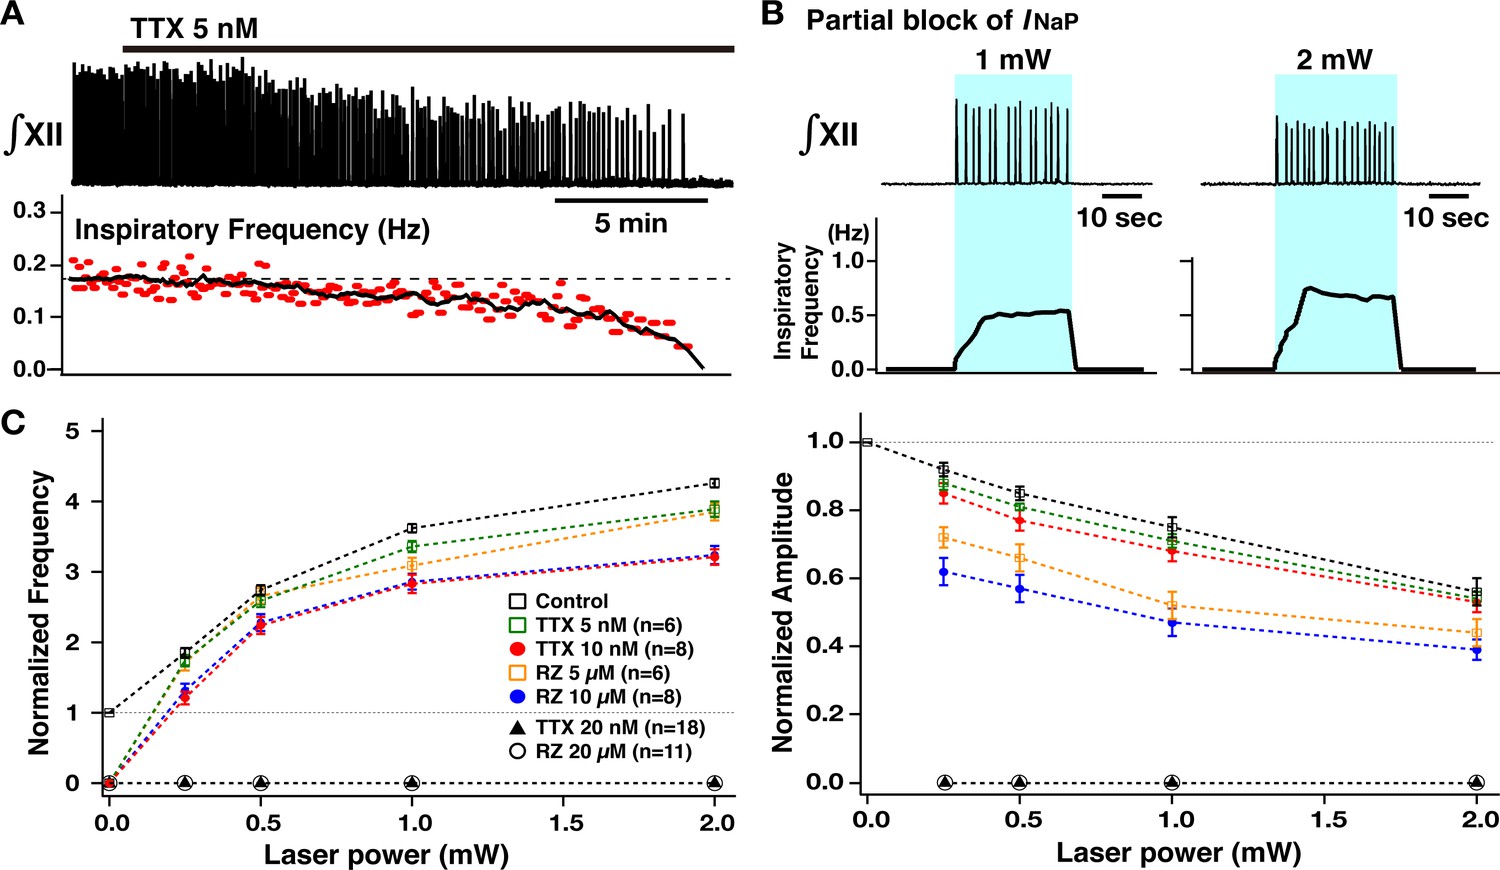
Perturbations of inspiratory burst frequency and amplitude by bilateral preBötzinger complex (preBötC) photostimulation during pharmacological block of neuronal persistent sodium current (INaP).
(A) Example recordings of integrated XII activity (∫XII) with bath application of low concentration of tetrodotoxin citrate (TTX; 5 nM), which gradually decreased inspiratory burst frequency and completely stopped the rhythm within ~25–30 min. The amplitude of XII activity also gradually decreased (~36% before the rhythm stopped in this example). (B) Under these conditions of partial block of INaP, bilateral preBötC photostimulation (30 min after the rhythm stopped, blue-shaded epoch) could reinitiate the rhythm, which was also laser-power-dependent (~202% increase at 1 mW compared to the control, and ~306% increase at 2 mW in the example shown). (C) Summary plots (TTX 5 nM, n=6; TTX 10 nM, n=8; TTX 20 nM, n=18; riluzole [RZ] 5 µM, n=6; RZ 10 µM, n=8; RZ 20 µM, n=8; mean ± SEM plotted) of the relations between laser power and normalized inspiratory burst frequency indicate laser-power-dependent, significant increases of frequency in all cases. The curves for higher concentration of TTX and riluzole are downward-shifted compared to those for the lower concentration as well as those under control conditions (before drug applications). Right panel shows summary plots (TTX 5 nM, n=6; TTX 10 nM, n=8; TTX 20 nM, n=18; RZ 5 µM, n=6; RZ 10 µM; n=8; RZ 20 µM, n=8; mean ± SEM plotted) of the relations between laser power and normalized XII burst amplitude indicating laser-power-dependent, significant decreases of burst amplitude in all cases. The curves under the INaP partial block (except for at TTX 5 nM) are downward-shifted compared to those under the control conditions. The decrease in burst amplitudes under RZ is more significant than those under TTX, although there are no significant differences between different concentrations of TTX or RZ. The loss of network rhythmic bursting activity after complete block of INaP (20 nM TTX or 20 µM RZ) is reflected by the zero frequency (left) and amplitude (right) points for 20 µM RZ and 20 nM TTX on the plots.
-
Figure 4—source data 1
Related to Figure 4C.
- https://cdn.elifesciences.org/articles/74762/elife-74762-fig4-data1-v1.xlsx
Figure 4—figure supplement 1
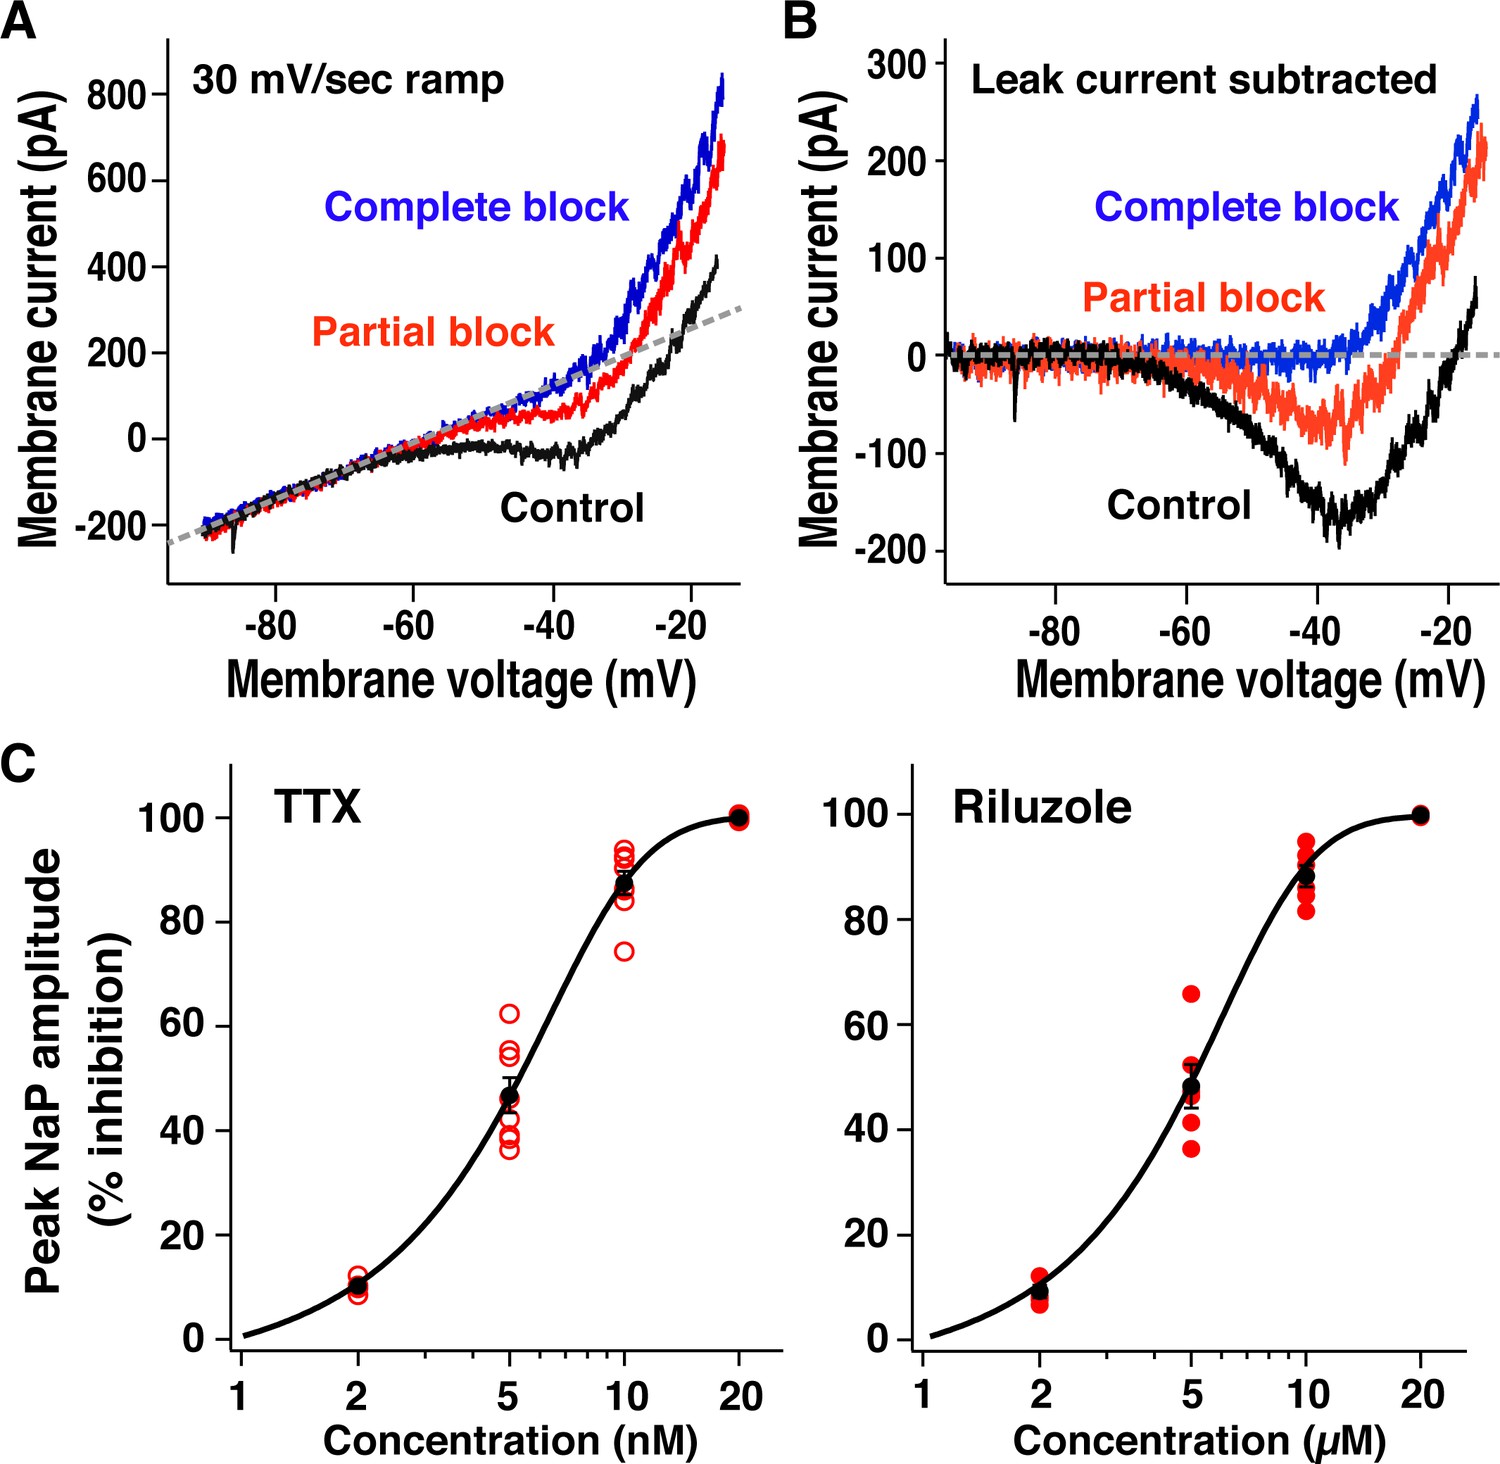
Pharmacological profile of block of neuronal persistent sodium current (INaP) in preBötzinger complex (preBötC) inspiratory glutamatergic neurons.
(A) Example of current-voltage (I-V) relationships measured from whole-cell voltage-clamp recording obtained by applying slow voltage ramps (30 mV/s; –100 to +10 mV) from optically identified vesicular glutamate transporter type-2 (VgluT2)-tdTomato expressing preBötC inspiratory neuron. I-V curves were measured in control, partial block of INaP (5 nM tetrodotoxin citrate [TTX]) and complete block of INaP (20 nM TTX) conditions. (B) TTX-sensitive INaP obtained from raw whole-cell recordings in (A) by subtracting I-V curves measured before and after application of TTX, illustrating reductions of INaP inward current with partial and complete block. (C) Relations between percent reduction of peak INaP amplitude (measured at –40 to –35 mV after I-V curve subtraction) and TTX or riluzole concentrations for VgluT2-tdTomato expressing inspiratory neurons (n=8 with TTX; n=6 with riluzole). Data points (red; black: mean ± SEM) are fitted with a sigmoid curve.
-
Figure 4—figure supplement 1—source data 1
Related to Figure 4—figure supplement 1C.
- https://cdn.elifesciences.org/articles/74762/elife-74762-fig4-figsupp1-data1-v1.xlsx
Figure 5
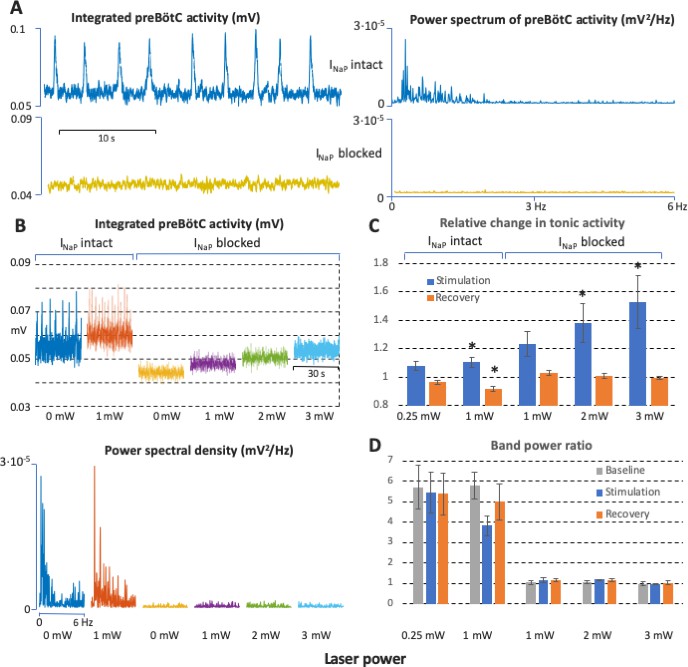
Power spectrum analyses of preBötzinger complex (preBötC) neuronal population activity in vitro before and after complete block of neuronal persistent sodium current (INaP).
(A) Examples of preBötC integrated population activity patterns and associated power spectra before and after block of INaP, which eliminates rhythmic preBötC population activity, leaving only a baseline low level of tonic activity or ‘noise’ with a flat power spectrum (lower traces). The power spectra of the rhythmic activity have clear peaks corresponding to the fundamental and higher harmonic frequencies (upper traces). (B) Representative experiment illustrating activity patterns and power spectra before and after block of INaP at various levels of photostimulation (0 and 1 mW in control; 0, 1, 2, and 3 mW after INaP blocked). With INaP intact (control conditions, left traces), photostimulation increases the frequency of integrated preBötC inspiratory population activity accompanying an upward shift of the integrated baseline activity due to tonic activity, and there are clear peaks in the power spectra of the rhythmic activity corresponding to the fundamental and higher harmonic frequencies (lower panel). After block of INaP with 20 nM tetrodotoxin citrate (TTX), there is a graded shift in the baseline level of tonic activity during photostimulation, but no rhythmic integrated population activity as indicated by the flat power spectra resembling that of the baseline noise activity in the absence of photostimulation. (C) Data from integrated preBötC population recordings showing the change in level of tonic activity relative to baseline during graded photostimulation and the recovery period following stimulation under control conditions with INaP intact and with INaP blocked (20 nM TTX). Increasing the level of photostimulation (0.25, 1 mW in control; 1, 2, 3 mW with INaP blocked) in both conditions increases the level of tonic activity. The activity returns to the baseline level (INaP blocked) or is slightly depressed (control conditions) in the post-photostimulation recovery period. Bars indicate mean ± SEM from 5 slices. * indicates statistically significant difference from unity (p<0.05 by two-tailed t-test). (D) Quantification of the oscillatory component in the preBötC activity before and after complete block of INaP at different levels of photostimulation as the ratio of the band power in the 0–3 Hz frequency range over the band power in the 3–6 Hz range. The ratios are high in control conditions, reflecting significantly higher spectral power content in the low frequency band (oscillations) compared to one in the high frequency band (noise) when there is rhythmic activity at baseline, with photostimulation, and during recovery. The ratios are not different and have a value of unity when INaP is blocked, reflecting the flat power spectra under this condition. Bars indicate mean ± SEM from 5 slices.
-
Figure 5—source data 1
Related to Figure 5C and D.
- https://cdn.elifesciences.org/articles/74762/elife-74762-fig5-data1-v1.xlsx
Figure 6
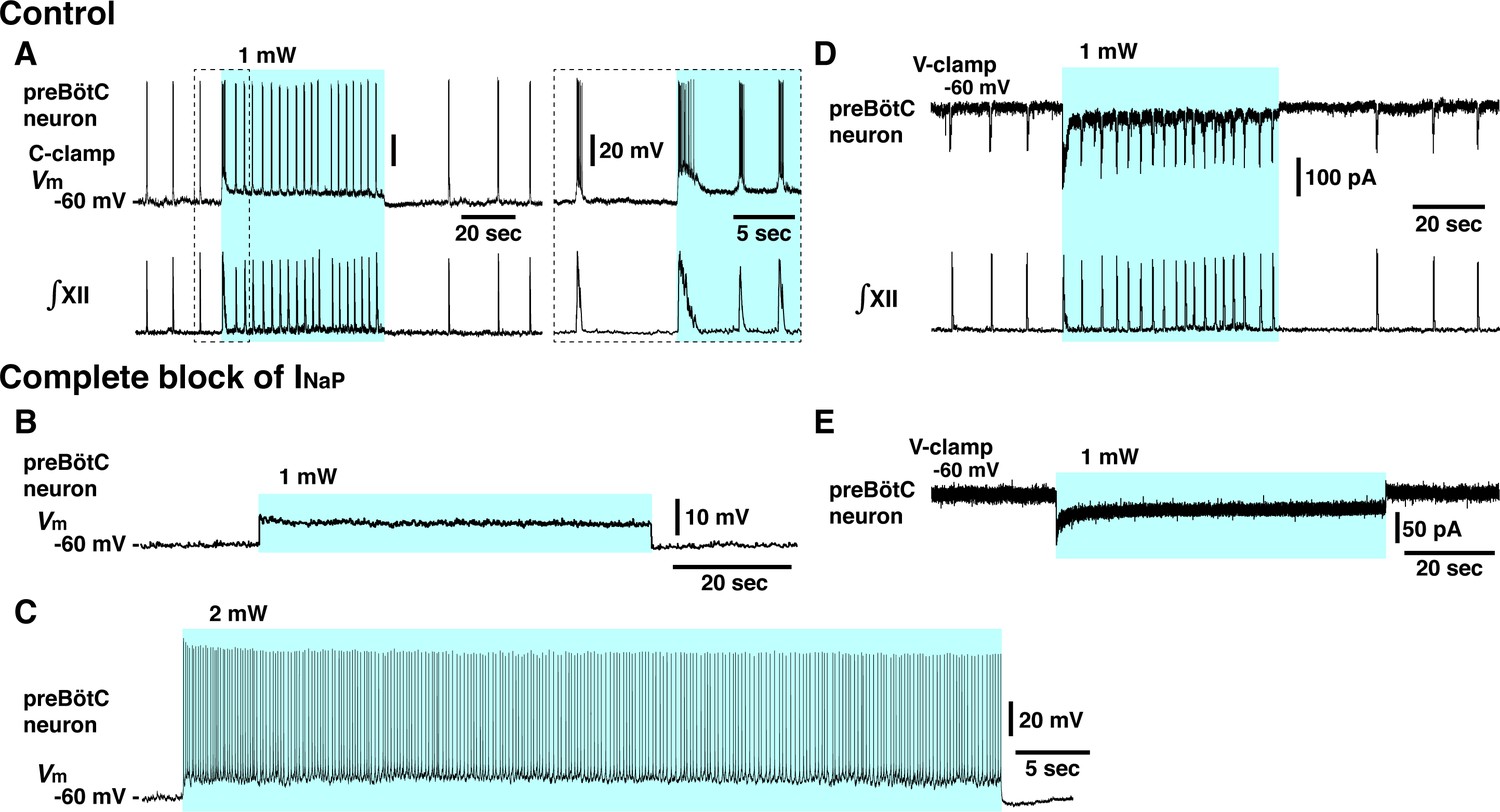
Elimination of inspiratory rhythm at the cellular level after complete block of neuronal persistent sodium current (INaP) in vitro.
(A) Whole-cell current-clamp recordings from td-tomato-labeled preBötzinger complex (preBötC) inspiratory neuron illustrating rhythmic bursting synchronized with inspiratory hypoglossal (XII) motor activity. In control conditions, optogenetic stimulation (1 mW) induced neuronal membrane depolarization (~6 mV) along with a significant increase of inspiratory bursting frequency synchronized with the network bursting frequency indicated by the integrated inspiratory XII activity (∫XII). Shown at right within the dashed box are expanded time scale traces of the activity within the dashed box in the left traces. (B, C) With complete block of INaP (20 nM tetrodotoxin citrate [TTX]), photostimulation did not induce rhythmic activity in this neuron, only membrane depolarization without rhythmic synaptic drive potentials or bursting at 1 mW laser application (B) and only tonic neuronal spiking at a higher laser power of 2 mW (C). The latter indicates that the neuron retained spiking capabilities at the low concentration of TTX employed, which did not interfere with action potential generation by transient Na+ channels while INaP was completely blocked (see Figure 4—figure supplement 1). (D) Voltage-clamp recordings from td-tomato-labeled preBötC inspiratory neuron showing inward rhythmic synaptic drive currents synchronized with inspiratory hypoglossal activities. Under control conditions, optogenetic stimulation (1 mW) induced inward currents and rhythmic synaptic drive currents synchronized with the higher frequency inspiratory XII activities. (E) Rhythmic inspiratory synaptic drive currents did not occur with photostimulation (1 mW) after complete block of INaP at 20 nM TTX, indicating loss of synaptic interactions and network rhythmic activity.
Figure 7
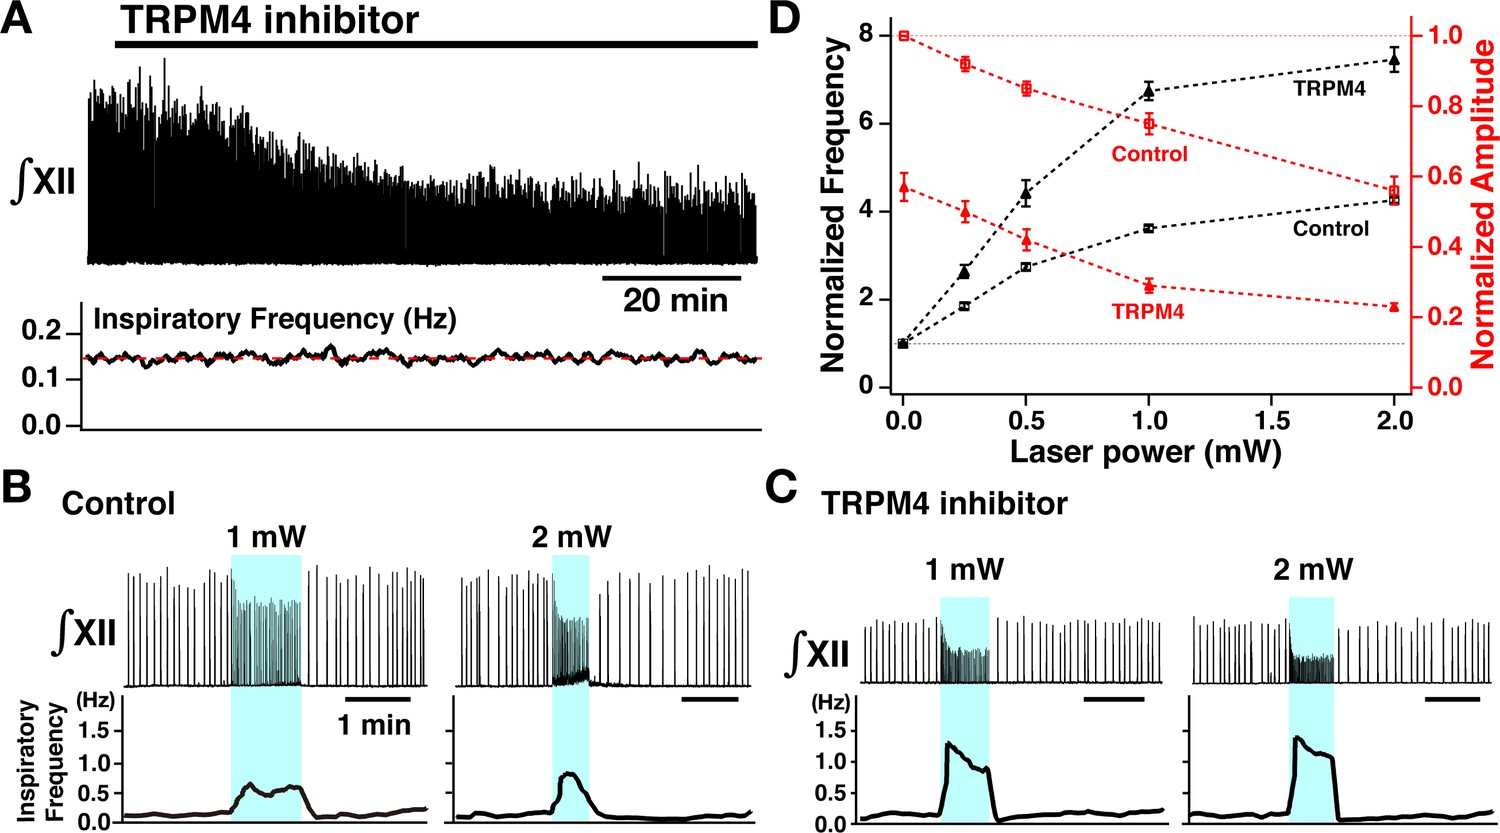
Perturbations of inspiratory burst frequency and amplitude by bilateral photostimulation of the preBötzinger complex (preBötC) during transient receptor potential channel M4 (TRPM4) pharmacological blockade.
(A) Upper trace illustrates the time course of integrated XII inspiratory activity (∫XII) during bath application of the specific pharmacological inhibitor of TRPM4 channels (9-phenanthrol, 50 µM), which gradually decreased inspiratory burst amplitude (~58% reduction at steady state ~60 min after drug application), but had little effect on the inspiratory frequency (bottom trace). (B) Bilateral photostimulation of the preBötC (control, before pharmacological block) increased inspiratory burst frequency in a laser-power-dependent manner (~284% increase at 1 mW, ~354% increase at 2 mW) and monotonically decreased inspiratory XII burst amplitude (~25% decrease at 1 mW, ~44% decrease at 2 mW). (C) Under TRPM4 block conditions (>60 min after 9-phenanthrol application), photostimulation significantly increased inspiratory frequency (~586% increase at 1 mW, ~724% increase at 2 mW), and decreased ∫XII inspiratory burst amplitude (~72% decrease at 1 mW, ~78% decrease at 2 mW). (D) Summary plots of monotonic relations between laser power and normalized inspiratory frequency (black lines, n=8 slices) and normalized amplitude (red, n=8). Data points plotted are mean ± SEM.
-
Figure 7—source data 1
Related to Figure 7D.
- https://cdn.elifesciences.org/articles/74762/elife-74762-fig7-data1-v1.xlsx
Figure 8
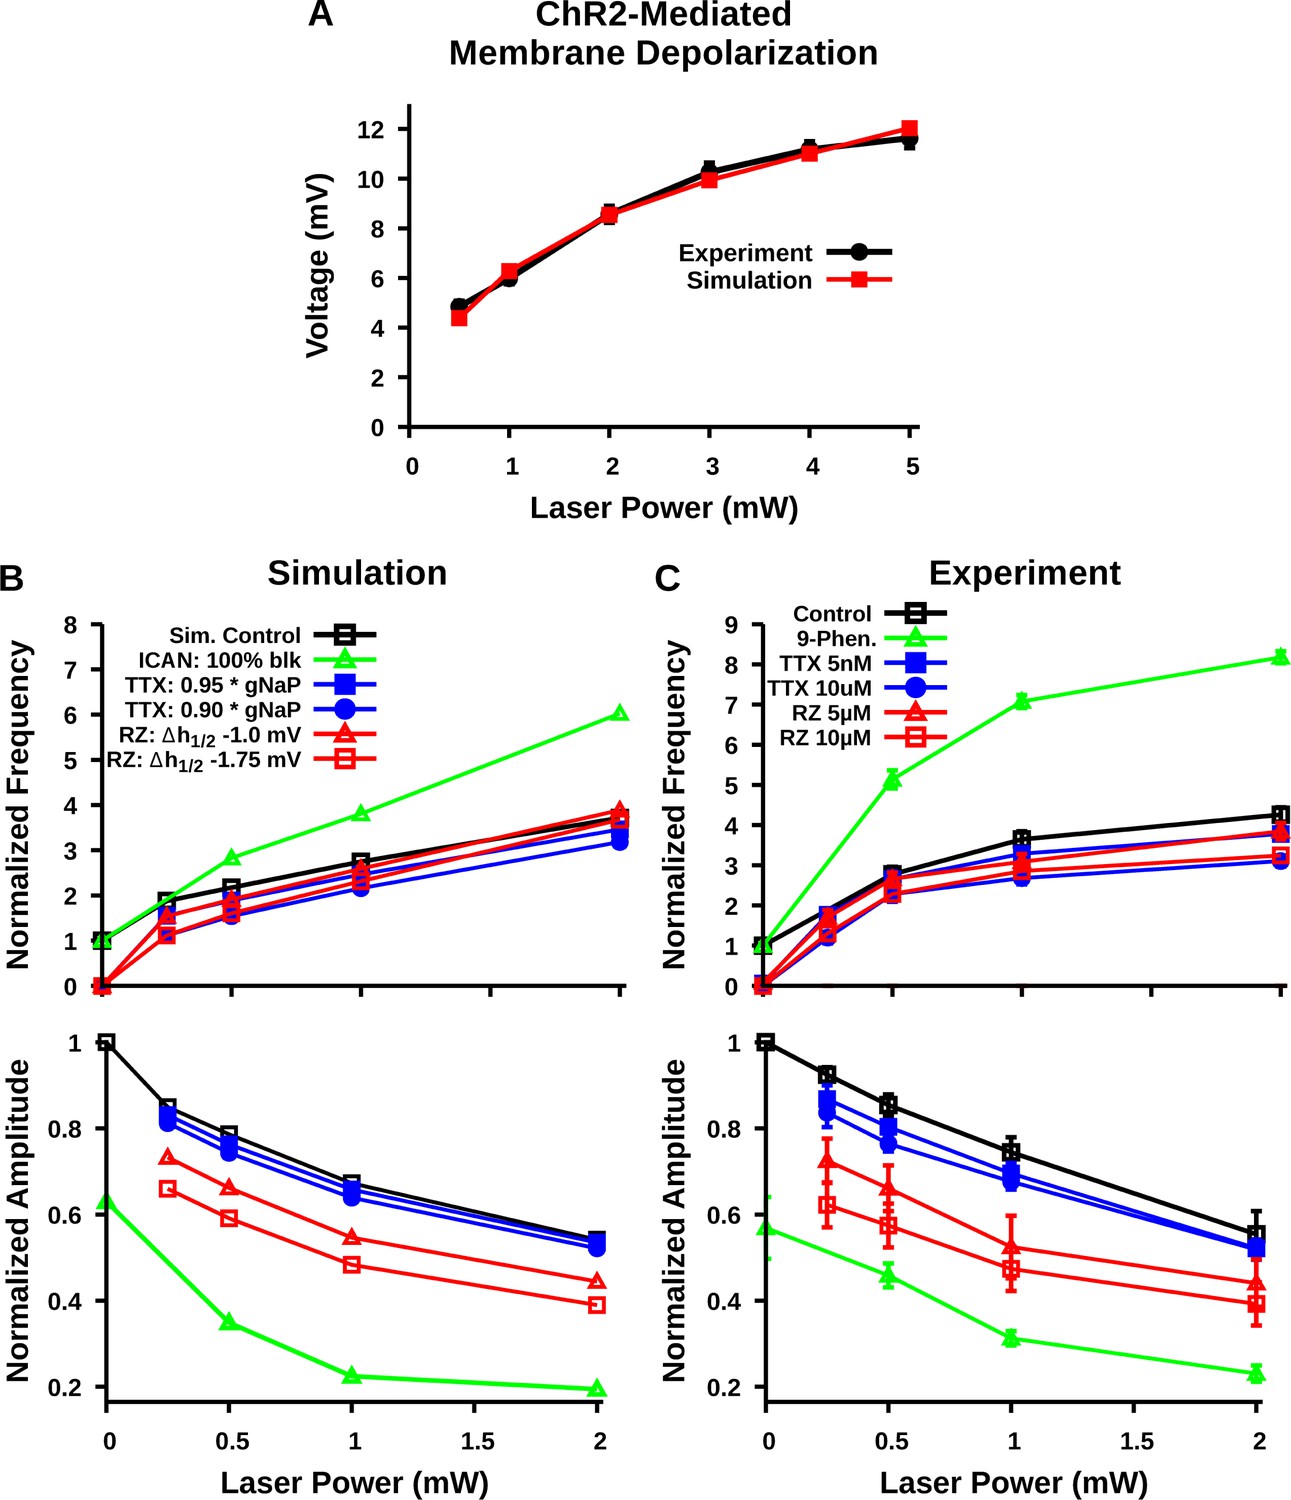
Comparison of experimental and simulated optogenetic photostimulation of the preBötzinger complex (preBötC) excitatory network under control conditions and after partial block of neuronal persistent sodium current (INaP) or transient receptor potential channel M4 (TRPM4)/calcium-activated non-selective cation current (ICAN).
(A) Matched relationship between neuronal membrane depolarization from baseline (ΔVM) as a function of laser power with photostimulation from experimental data (same as shown in Figure 2D) and model simulations. (B) Relationship between laser power and burst frequency (top) and amplitude (bottom) of the preBötC network with model simulated blockade of INaP by tetrodotoxin citrate (TTX) and riluzole (RZ) or block of ICAN. INaP block by TTX and ICAN block by 9-phenanthrol (Phen.) were simulated by reducing the persistent sodium conductance (gNaP) and calcium-activated non-selective cation conductance (gCAN), respectively. In contrast, blockade of INaP by RZ was simulated by a hyperpolarizing shift in the inactivation parameter Vh1/2 and by a partial reduction in Wmax; –20 and –25% for simulation of 5 µM and 10 µM RZ application, as described and justified previously (Phillips and Rubin, 2019). (C) Relationship between laser power and inspiratory burst frequency (top) and amplitude (bottom) of the integrated XII output with bath application of the pharmacological blockers of INaP (TTX or RZ) or ICAN (9-phenanthrol); data are the same as shown in Figures 4C and 7D. Data points and error bars are mean ± SEM.
-
Figure 8—source data 1
Related to Figure 8A–C.
- https://cdn.elifesciences.org/articles/74762/elife-74762-fig8-data1-v1.xlsx
Figure 9
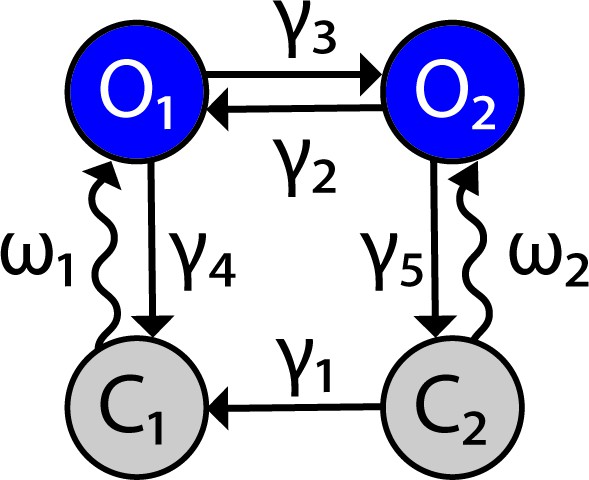
Channelrhodopsin-2 (ChR2) channel configuration.
The ChR2 channel activation dynamics are described with a four-state Markov model, based on Williams et al., 2013. Transition rates between states are represented by variables and the light-dependent variables Figure 9 has been adapted from Figure 1B in Williams et al., 2013.
Tables
Table 1
Updated model parameters.
| Channel | Parameters |
|---|---|
| , , , , , , , , , , , | |
| , , , , , , , | |
| , | |
| , , , , , , , , , , | |
| , , | |
| , , , , , , , , , , , | |
| , , , | |
| , , , , | |
| , , , , , , , , , |
Additional files
-
Transparent reporting form
- https://cdn.elifesciences.org/articles/74762/elife-74762-transrepform1-v1.pdf
-
Source code 1
Model source code.
- https://cdn.elifesciences.org/articles/74762/elife-74762-code1-v1.zip
Download links
A two-part list of links to download the article, or parts of the article, in various formats.
Downloads (link to download the article as PDF)
Open citations (links to open the citations from this article in various online reference manager services)
Cite this article (links to download the citations from this article in formats compatible with various reference manager tools)
Predictions and experimental tests of a new biophysical model of the mammalian respiratory oscillator
eLife 11:e74762.
https://doi.org/10.7554/eLife.74762


