A motor neuron disease-associated mutation produces non-glycosylated Seipin that induces ER stress and apoptosis by inactivating SERCA2b
- Department of Biophysics, Graduate School of Science, Kyoto University, Japan
Figures
Figure 1 with 2 supplements
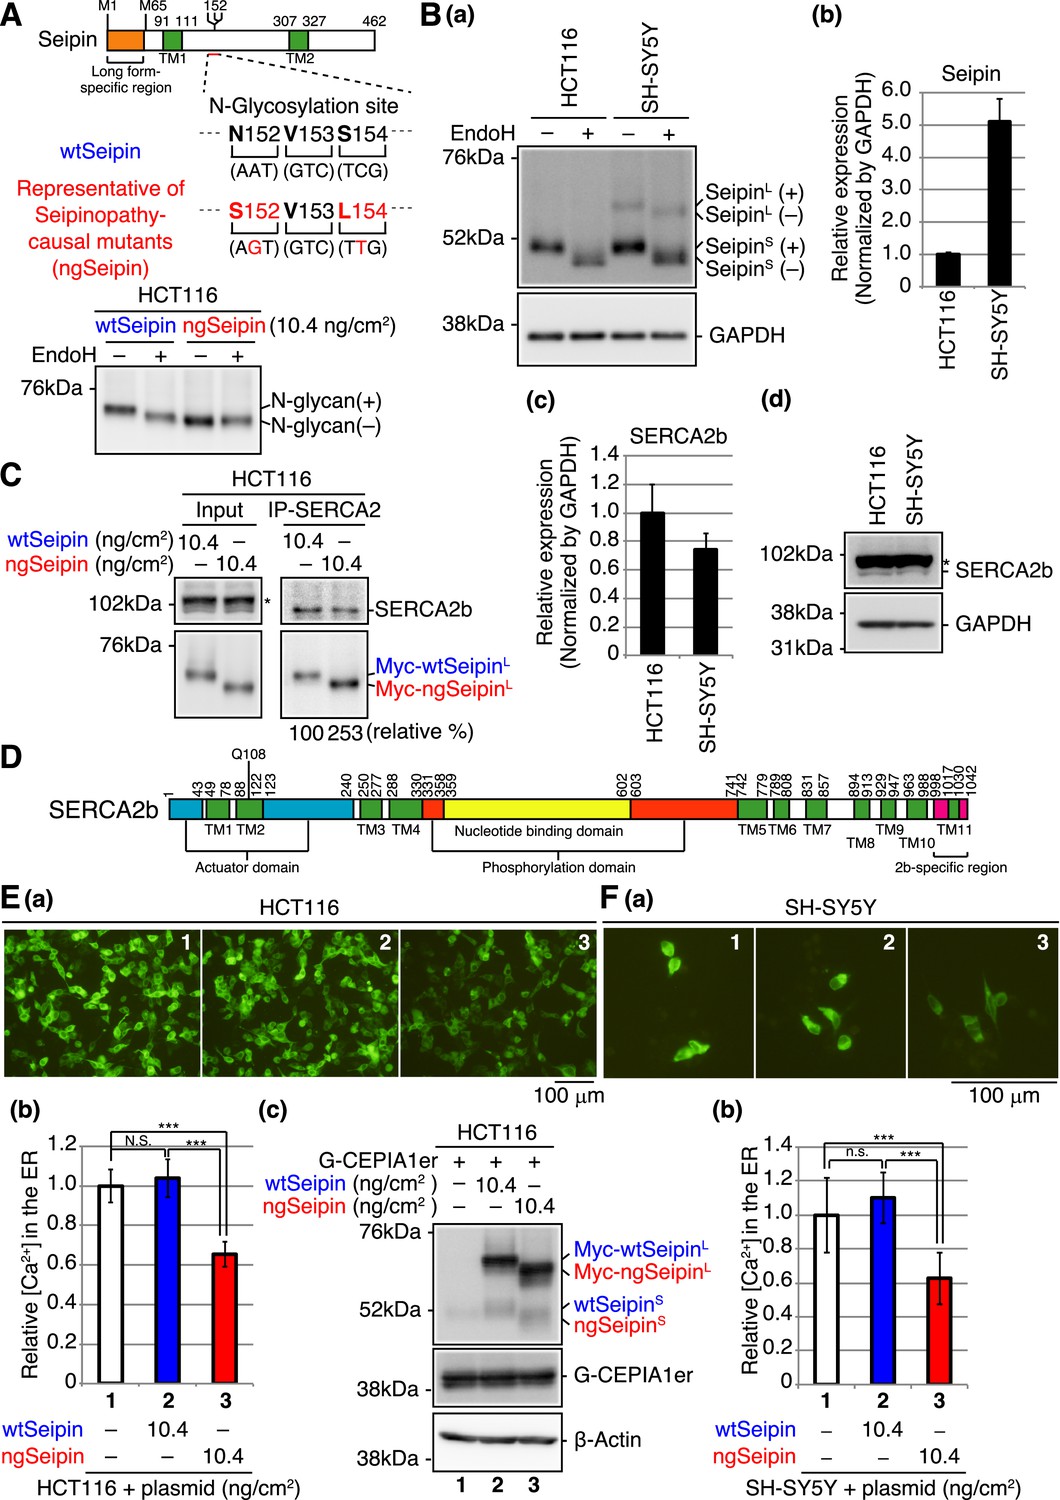
Effect of non-glycosylated Seipin (ngSeipin) expression on calcium concentration in the endoplasmic reticulum (ER) of HCT116 and SH-SY5Y cells.
(A) Structure of human Seipin is schematically shown. The orange and green boxes denote the long form-specific region and transmembrane (TM1 and TM2) domains, respectively. The amino acid sequences of 152–154 and corresponding nucleotide sequences of wild-type Seipin (wtSeipin) and representative of Seipinopathy-causal mutants (ngSeipin) are shown below. Cell lysates were prepared from HCT116 cells transfected with plasmid (10.4 ng/cm2) to express Myc-tagged wtSeipin or ngSeipin (both long forms), treated with (+) or without (-) EndoH, and analyzed by immunoblotting using anti-Myc antibody. (B) (a) Cell lysates were prepared from HCT116 and SH-SY5Y cells, treated with (+) or without (-) EndoH, and analyzed by immunoblotting using anti-Seipin and anti-GAPDH antibodies. (+) and (-) denote glycosylated and de-glycosylated protein, respectively. (b) Quantitative RT-PCR was conducted to determine the level of endogenous Seipin mRNA (a region shared by SeipinL and SeipinS was amplified) relative to that of GAPDH mRNA in HCT116 and SH-SY5Y cells (n = 3). (c) Quantitative RT-PCR was conducted to determine the level of SERCA2b mRNA relative to that of GAPDH mRNA in HCT116 and SH-SY5Y cells (n = 3). (d) Cell lysates were prepared from HCT116 and SH-SY5Y cells and analyzed by immunoblotting using anti-SERCA2 and anti-GAPDH antibodies. The asterisk denotes a nonspecific band. (C) Cell lysates were prepared from HCT116 cells transfected with plasmid (10.4 ng/cm2) to express Myc-tagged wtSeipin or ngSeipin, and subjected to immunoprecipitation using anti-SERCA2 antibody. Aliquots of cell lysates (Input) and immunoprecipitates (IP-SERCA2) were analyzed by immunoblotting using anti-SERCA2 and anti-Myc antibodies. The asterisk denotes a nonspecific band. (D) Structure of human SERCA2b is schematically shown. Green, blue, orange, yellow, and red boxes denote transmembrane (TM1-TM11) domains, actuator domain, phosphorylation domain, nucleotide-binding domain, and SERCA2b-specific region, respectively. (E) HCT116 cells were transfected with plasmid (104 ng/cm2) to express G-CEPIA1er together with or without plasmid (10.4 ng/cm2) to express Myc-tagged wtSeipin or ngSeipin. (a) Fluorescent microscopic analysis of transfected cells was conducted. Scale bar: 100 μm. (b) Fluorescence intensities of 16–17 pictures obtained from three independent experiments (5–7 pictures each) were quantified and are expressed relative to that in cells transfected with plasmid to express G-CEPIA1er alone with error bars (standard deviation). (c) Cell lysates were prepared and analyzed by immunoblotting using anti-Seipin, anti-GFP, and anti-β-actin antibodies. (F) (a) Fluorescent microscopic analysis of SH-SY5Y cells transfected with plasmid (104 ng/cm2) to express G-CEPIA1er together with or without plasmid (10.4 ng/cm2) to express Myc-tagged wtSeipin or ngSeipin was conducted. Scale bar: 100 μm. (b) Fluorescence intensities of 15–17 pictures obtained from three independent experiments (5–7 pictures each) were quantified and are expressed as in (E). See also Figure 1—source data 1.
-
Figure 1—source data 1
Raw data related to Figure 1A, B, C and E.
- https://cdn.elifesciences.org/articles/74805/elife-74805-fig1-data1-v1.zip
Figure 1—figure supplement 1
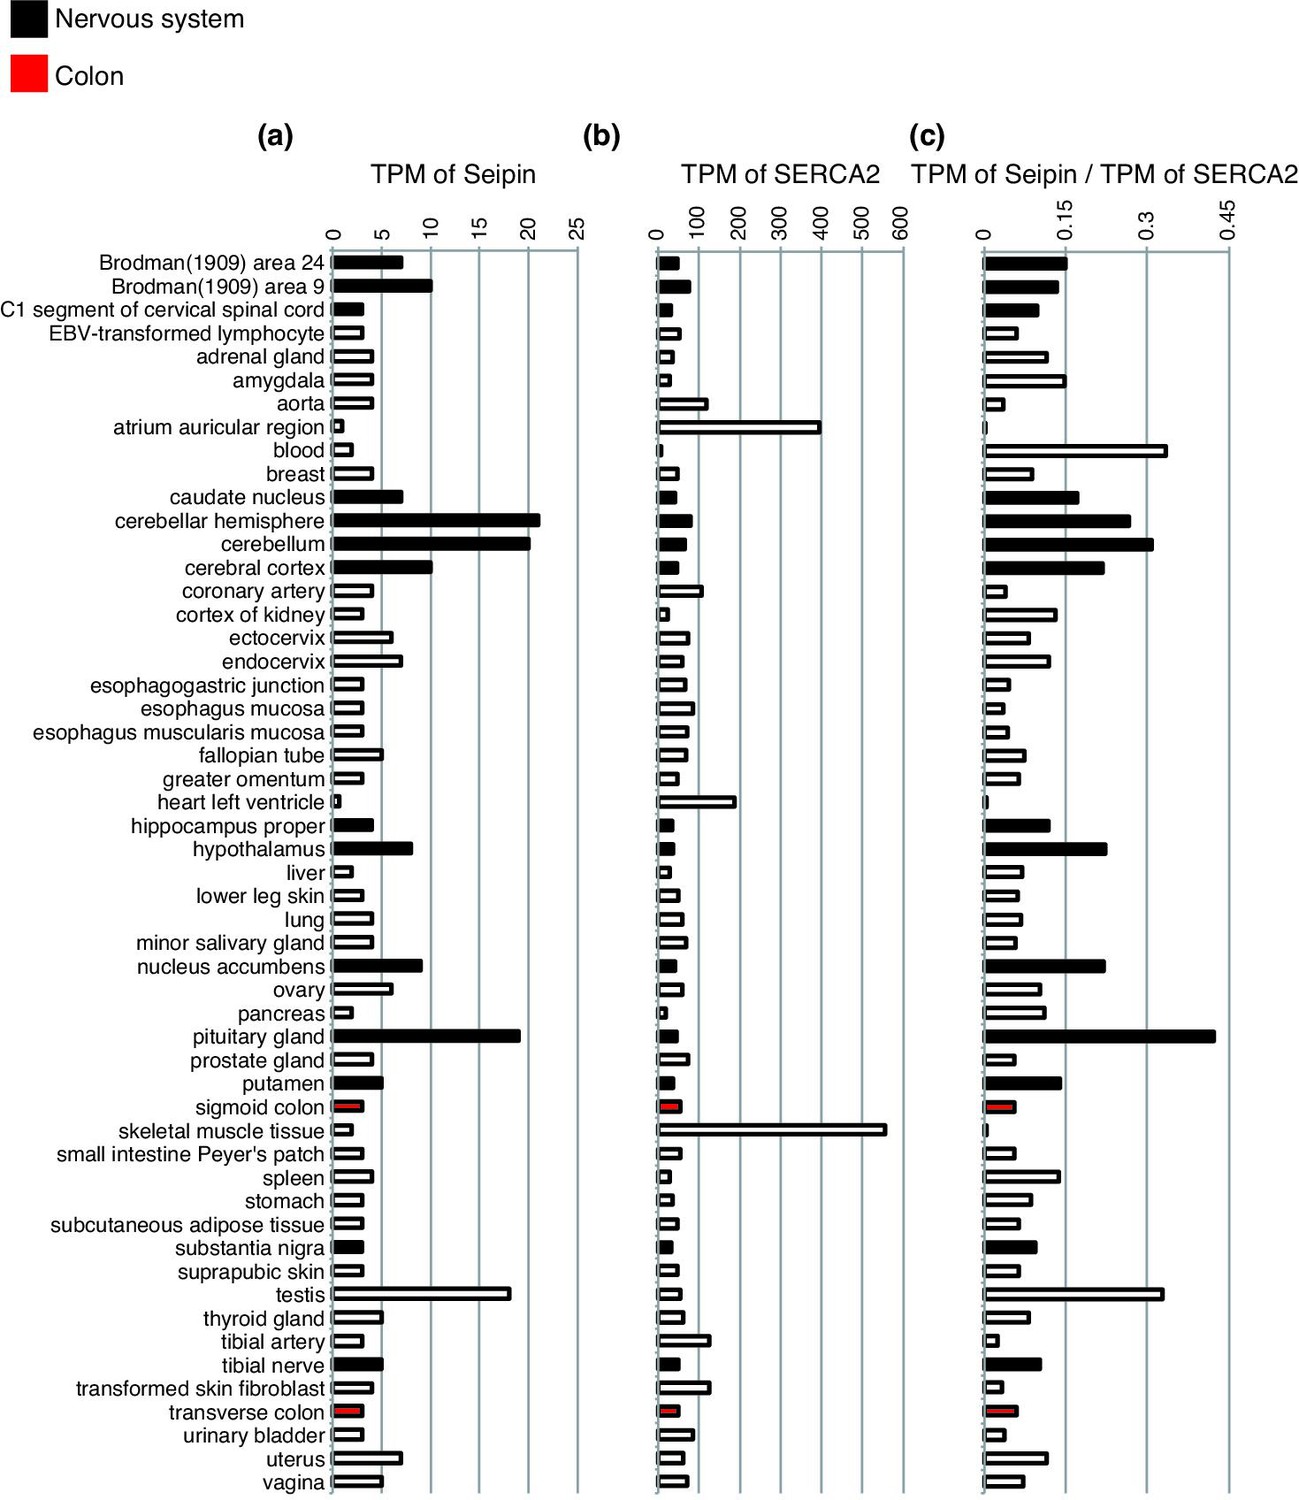
Expression levels of Seipin mRNA and SERCA2 mRNA in different human tissues.
Transcripts per million (TPM) of Seipin (a), TPM of SERCA2 (b), and relative Seipin-TPM/SERCA2-TPM (c) in different human tissues are shown. TPM data were acquired from Expression Atlas: Gene expression across species and biological conditions (https://www.ebi.ac.uk/gxa/home). Black and red bars denote data of the nervous system and of colon, respectively, as indicated at the top left.
Figure 1—figure supplement 2
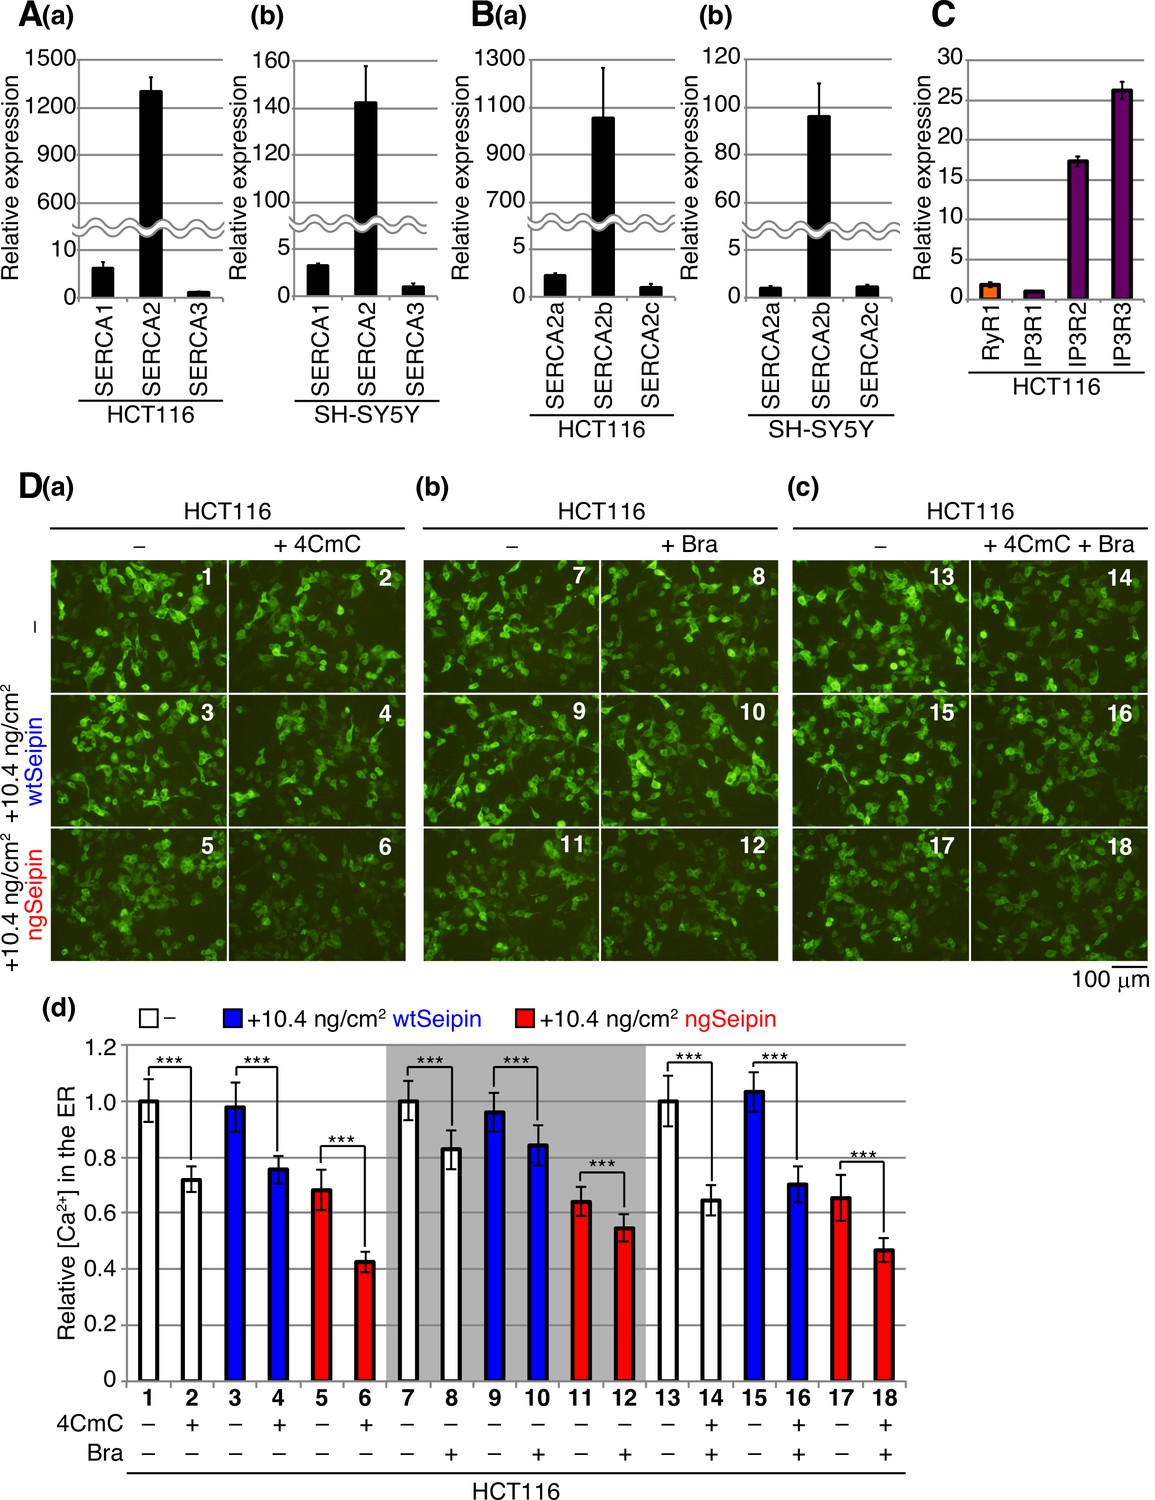
Comparison of expression levels of SERCA1/2/3 mRNA and SERCA2a/b/c mRNA in HCT116 and SH-SY5Y cells as well as the effect of non-glycosylated Seipin (ngSeipin) expression on RyR and IP3R.
(A) Quantitative RT-PCR was conducted to determine the levels of endogenous mRNA encoding SERCA1, SERCA2, and SERCA3 relative to that of GAPDH mRNA in HCT116 (a) and SH-SY5Y (b) cells (n = 3). The mean value of SERCA3 mRNA is set as 1. (B) Quantitative RT-PCR was conducted to determine the levels of endogenous mRNA encoding SERCA2a, SERCA2b, and SERCA2c relative to that of GAPDH mRNA in HCT116 (a) and SH-SY5Y (b) cells (n = 3). The mean value of SERCA2c mRNA and SERCA2a mRNA is set as 1 for (a) and (b), respectively. (C) Quantitative RT-PCR was conducted to determine the levels of endogenous mRNA encoding RyR1, IP3R1, IP3R2, and IP3R3 mRNA relative to that of GAPDH mRNA in HCT116 cells (n = 3). The mean value of IP3R1 mRNA is set as 1. Note that the expression of RyR2 mRNA and RyR3 mRNA was not detected by our quantitative RT-PCR analysis. (D) HCT116 cells transfected with plasmid (104 ng/cm2) to express G-CEPIA1er together with or without plasmid (10.4 ng/cm2) to express Myc-tagged wild-type Seipin (wtSeipin) or ngSeipin were untreated (-) or treated with (a) 1 mM 4-chloro-m-cresol (4CmC), (b) 10 μM bradykinin (Bra), or (c) both for 10 min. Fluorescent microscopic analysis was conducted. Scale bar: 100 μm. (d) Fluorescence intensities were quantified at each time point and are expressed as in Figure 1E(b) (n = 3). The experiments (a), (b), and (c) were conducted separately.
Figure 2 with 1 supplement
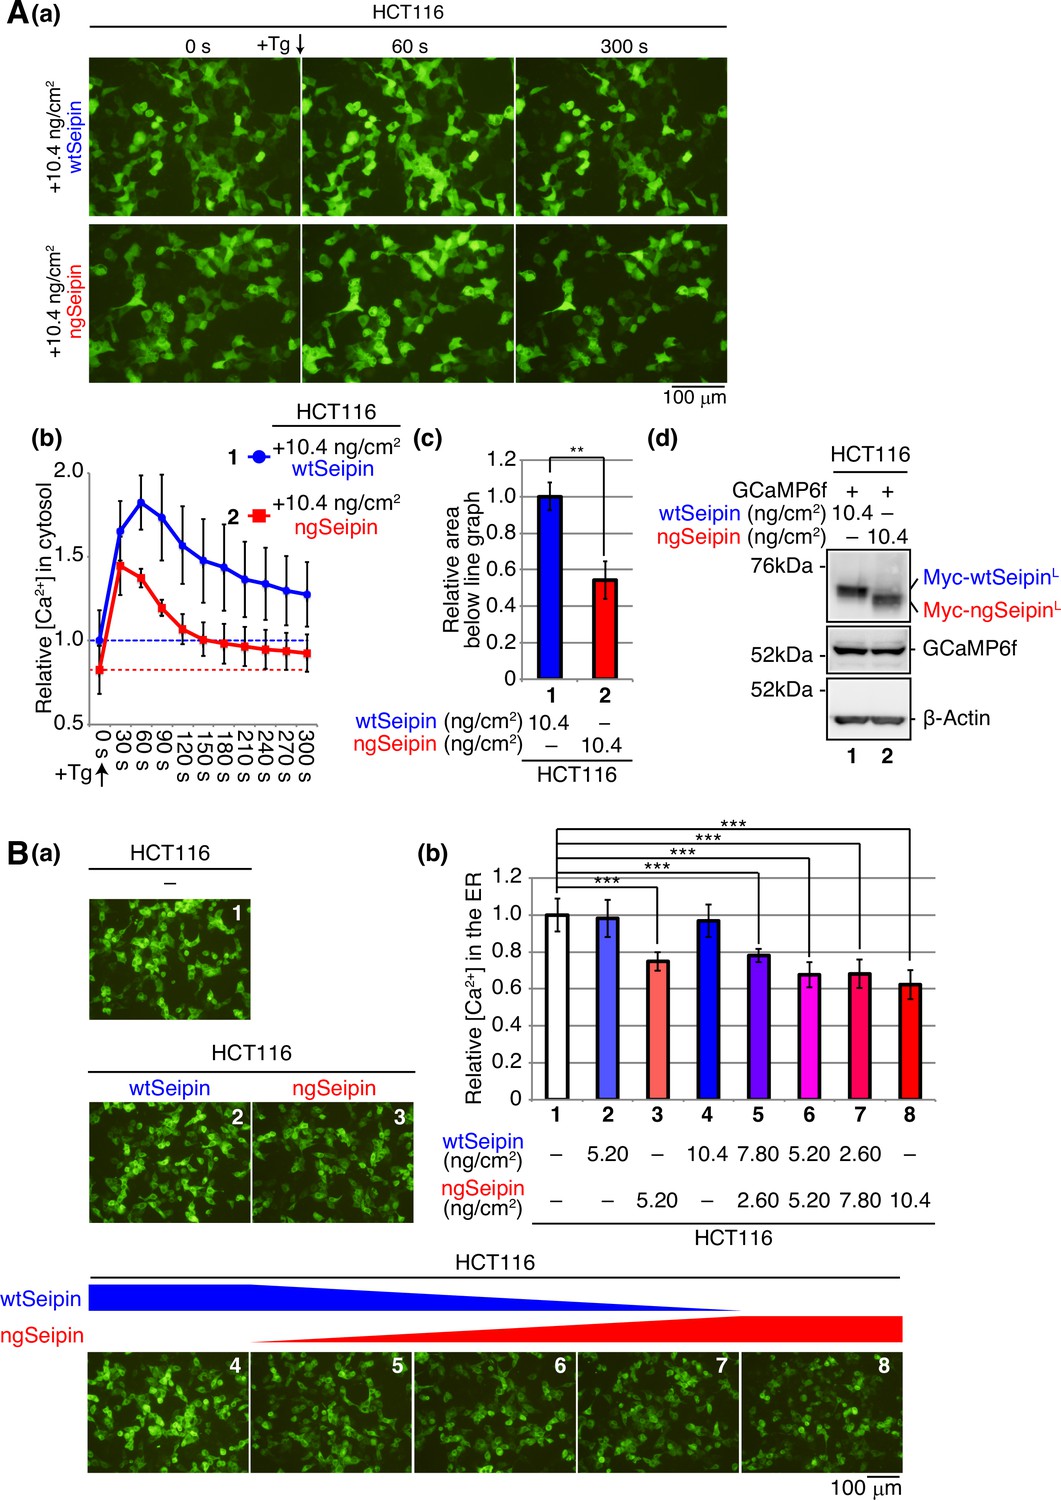
Effect of non-glycosylated Seipin (ngSeipin) expression on calcium concentration in the cytosol and effect of co-expression of ngSeipin and wild-type Seipin (wtSeipin) on calcium concentration in the endoplasmic reticulum (ER) in HCT116 cells.
(A) HCT116 cells were transfected with plasmid (104 ng/cm2) to express GCaMP6f together with plasmid (10.4 ng/cm2) to express Myc-tagged wtSeipin or ngSeipin. (a) Fluorescent microscopic analysis was conducted before (0 s) and every 30 s after treatment with 1 μM thapsigargin (Tg). Only pictures of 0 s, 60 s, and 300 s are shown. Scale bar: 100 μm. (b) Fluorescence intensities were quantified at each time point and are shown as a line graph with the fluorescence intensity in HCT116 cells expressing wtSeipin before Tg treatment set as 1 (n = 3). (c) The area below the red line graph until the broken red line (fluorescence intensity at 0 s,+ngSeipin) in (b) was calculated and is shown relative to that below the blue line graph until the broken blue line (fluorescence intensity at 0 s,+wtSeipin). (d) Cell lysates were prepared and analyzed by immunoblotting using anti-Myc, anti-GFP, and anti-β-actin antibodies. (B) HCT116 cells were transfected with plasmid (104 ng/cm2) to express G-CEPIA1er together with or without the indicated amounts of plasmid to express Myc-tagged wtSeipin or ngSeipin. (a) Fluorescent microscopic analysis was conducted. Scale bar: 100 μm. (b) Fluorescence intensities were quantified and are expressed as in Figure 1E(b) (n = 3). See also Figure 2—source data 1.
-
Figure 2—source data 1
Raw data related to Figure 2A.
- https://cdn.elifesciences.org/articles/74805/elife-74805-fig2-data1-v1.zip
Figure 2—figure supplement 1
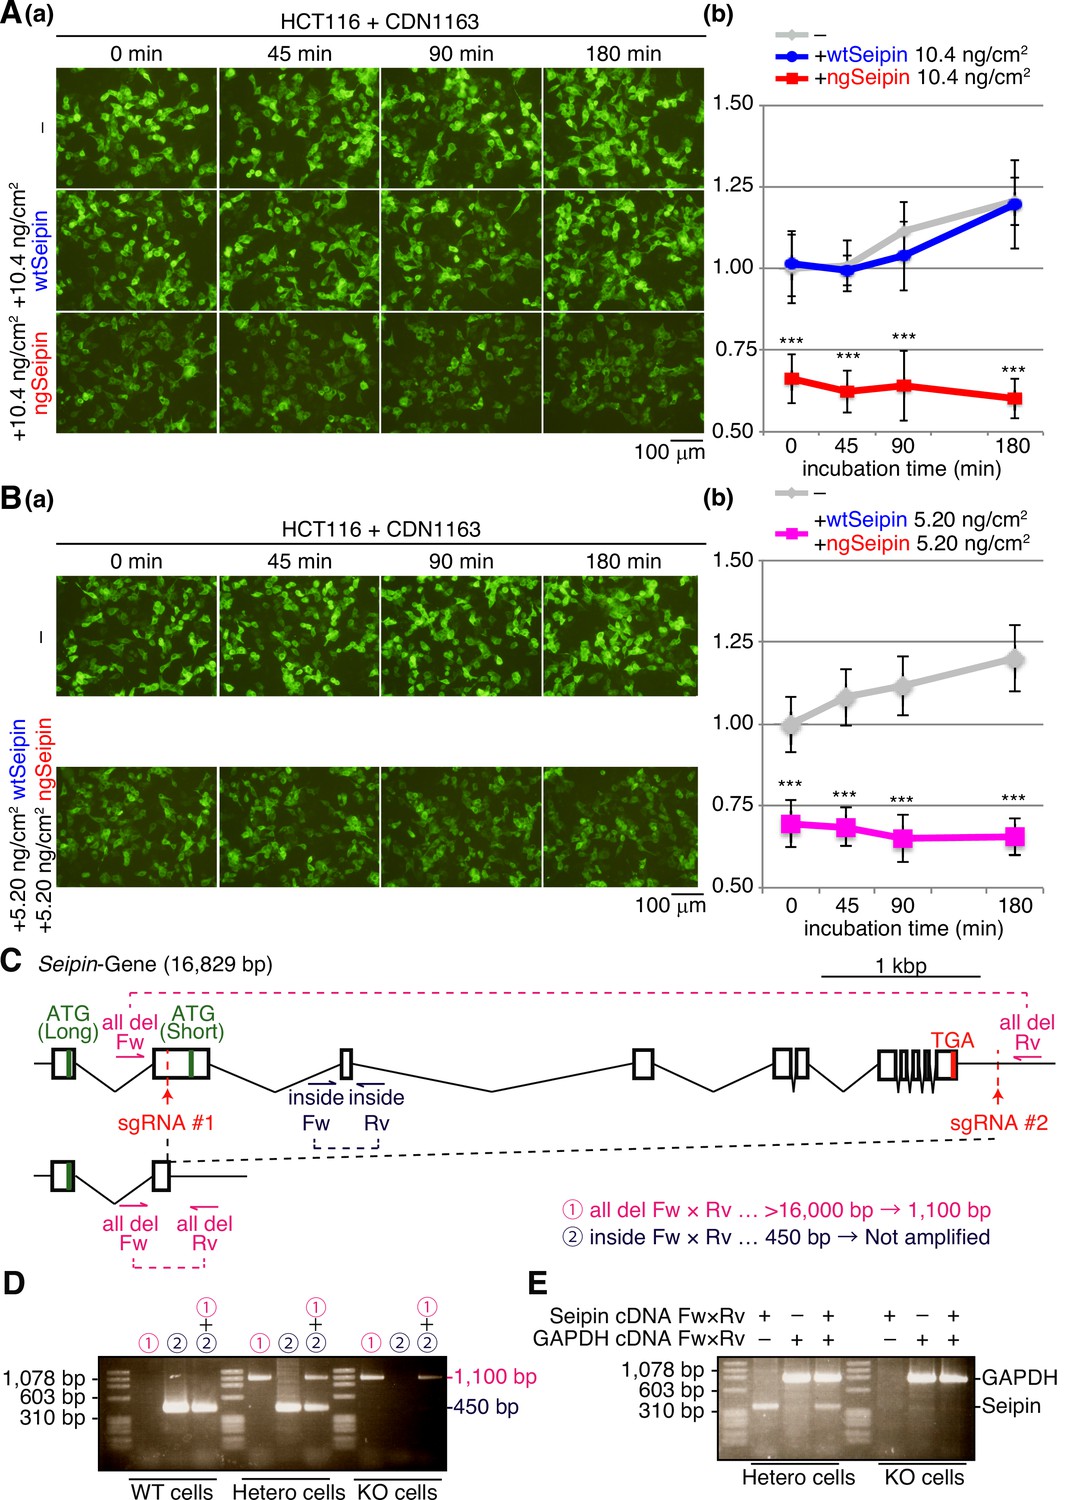
Effect of CDN1163 on calcium concentration in the endoplasmic reticulum (ER) as well as construction of Seipin-KO HCT116 cells.
(A) HCT116 cells transfected with plasmid (104 ng/cm2) to express G-CEPIA1er together with or without plasmid (10.4 ng/cm2) to express Myc-tagged wild-type Seipin (wtSeipin) or non-glycosylated Seipin (ngSeipin) were treated with 10 μM CDN1163 for the indicated times. (a) Fluorescent microscopic analysis was conducted. Scale bar: 100 μm. (b) Fluorescence intensities were quantified and are expressed as in Figure 1E(b) (n = 3). (B) HCT116 cells transfected with plasmid (104 ng/cm2) to express G-CEPIA1er together with or without plasmid (5.20 ng/cm2) to express Myc-tagged wtSeipin plus plasmid (5.20 ng/cm2) to express Myc-tagged ngSeipin were treated with 10 μM CDN1163 for the indicated periods. (a) Fluorescent microscopic analysis was conducted. Scale bar: 100 μm. (b) Fluorescence intensities were quantified at each time point and are expressed as in Figure 1E(b) (n = 3). (C) Strategy of the CRISPR/Cas9-mediated cleavage to delete almost the entire the Seipin gene is shown. (D) Genomic PCR was carried out to confirm non-homologous end joining after cleavage. The positions of primers and expected sizes of amplified fragments are shown in (C). (E) Total RNA was prepared from heterozygous and Seipin-KO cells, and subjected to RT-PCR to amplify cDNA corresponding to Seipin mRNA and GAPDH mRNA. See also Figure 2—figure supplement 1—source data 1.
-
Figure 2—figure supplement 1—source data 1
Raw data related to Figure 2—figure supplement 1D, E.
- https://cdn.elifesciences.org/articles/74805/elife-74805-fig2-figsupp1-data1-v1.zip
Figure 3

Effect of non-glycosylated Seipin (ngSeipin) expression on calcium concentration in the endoplasmic reticulum (ER), ER stress, and apoptosis in Seipin-KO HCT116 cells.
(A) WT cells were transfected with plasmid (104 ng/cm2) to express G-CEPIA1er. Seipin-KO cells were transfected with plasmid (104 ng/cm2) to express G-CEPIA1er together with or without the indicated amounts of plasmid to express Myc-tagged wild-type Seipin (wtSeipin) or ngSeipin. (a) Fluorescent microscopic analysis of WT cells and Seipin-KO cells transfected as indicated was conducted. Scale bar: 100 μm. (b) Fluorescence intensities were quantified and are expressed as in Figure 1E(b) (n = 3). (c) Cell lysates were prepared from the indicated cells and analyzed by immunoblotting using anti-Seipin and anti-β-actin antibodies. (B) Quantitative RT-PCR was conducted to determine the levels of endogenous BiP mRNA, spliced XBP1 [XBP1(S)] mRNA and CHOP mRNA relative to that of GAPDH mRNA in WT cells, Seipin-KO cells, and Seipin-KO cells transfected with the indicated amounts of plasmid to express Myc-tagged wtSeipin or ngSeipin (n = 3). The mean value of untransfected WT cells is set as 1. (C) (a) WT cells, Seipin-KO cells, and Seipin-KO cells transfected with the indicated amounts of plasmid to express Flag-tagged wtSeipin or ngSeipin were fixed 28 hr later, subjected to immunofluorescence using anti-Flag (red) and anti-cleaved Caspase-3 (green) antibodies, and analyzed by confocal microscopy. Scale bar: 10 μm. (b) The number of Flag-tagged Seipin and cleaved Caspase-3 double-positive cells was counted in 118–250 cells obtained from three independent experiments and is shown as a percentage. See also Figure 3—source data 1.
-
Figure 3—source data 1
Raw data related to Figure 3A.
- https://cdn.elifesciences.org/articles/74805/elife-74805-fig3-data1-v1.zip
Figure 4
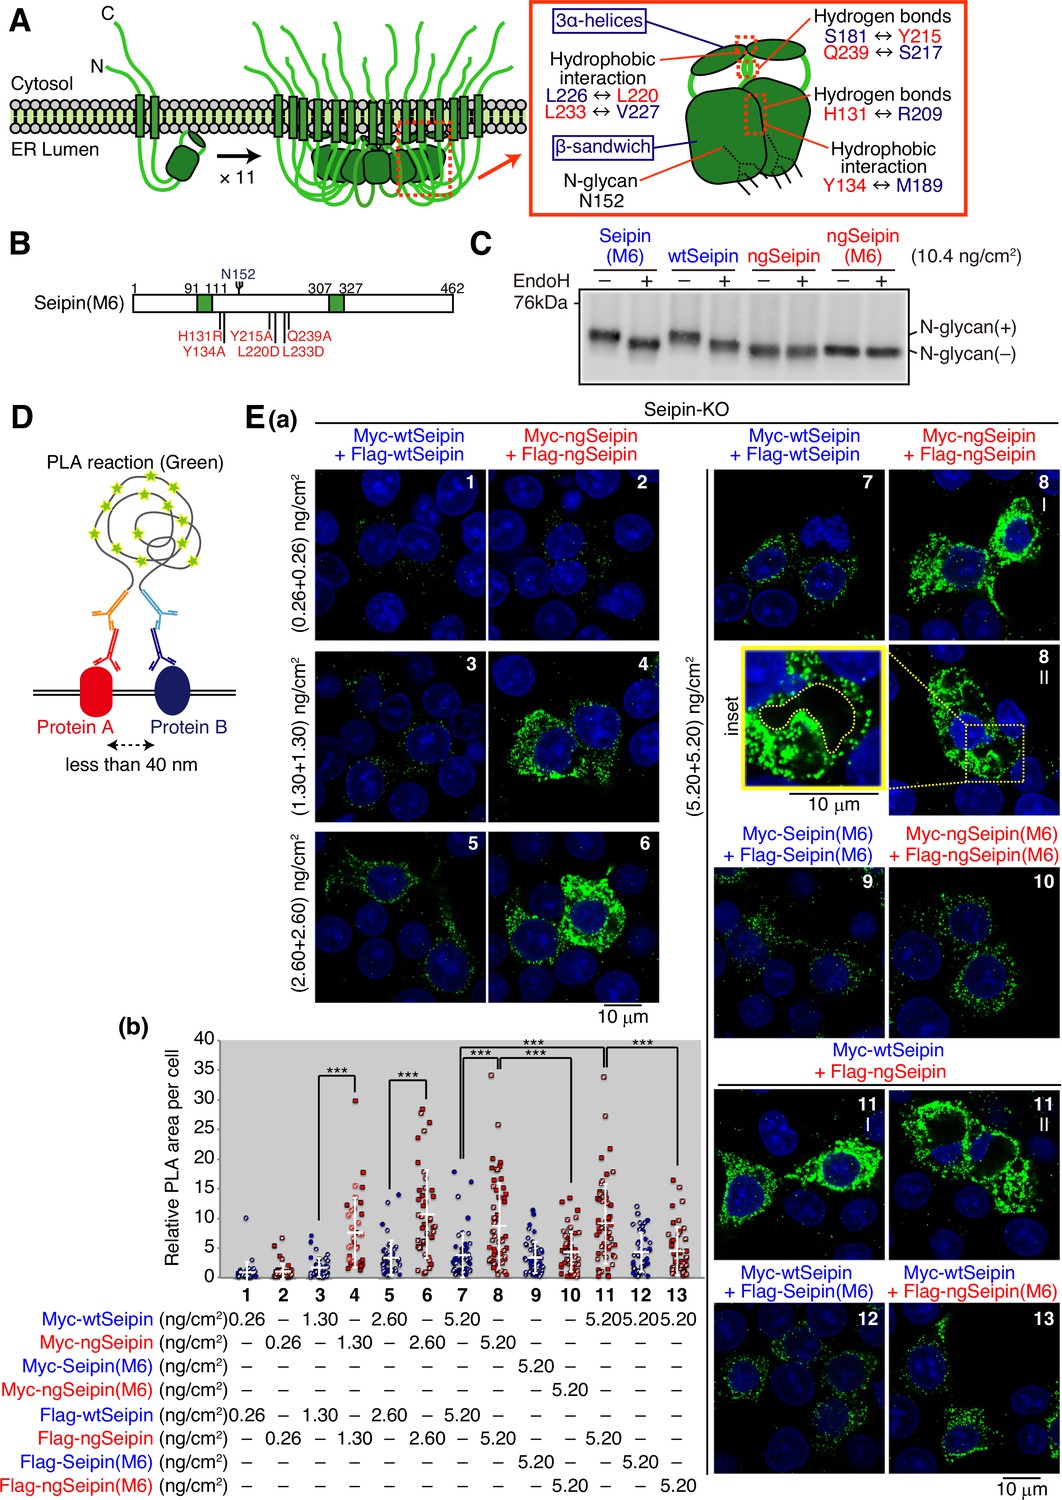
Luminal region-mediated aggregation of non-glycosylated Seipin (ngSeipin).
(A) Structures of human Seipin monomer and undecamer are schematically shown on the left. Structure of one Seipin protomer and its neighboring protomer is schematically shown on the right with the positions of the β-sandwich domain, three α-helices, hydrophobic interactions, hydrogen bonds, and N-glycan. (B) Structure of Seipin(M6) is schematically shown, in which the six amino acids critical for oligomerization of Seipin are mutated as indicated and highlighted in red. (C) Cell lysates were prepared from HCT116 WT cells transfected with plasmid (10.4 ng/cm2) to express Myc-tagged wild-type Seipin (wtSeipin), Seipin(M6), ngSeipin, or ngSeipin(M6), treated with (+) or without (-) EndoH, and analyzed by immunoblotting using anti-Myc antibody. (D) The principle of proximity ligation assay (PLA) is diagrammatically presented. PLA detects the proximal interaction (less than 40 nm) of two proteins in the cell using two different antibodies. (E) (a) PLA was conducted in Seipin-KO cells transfected with the indicated amounts of plasmid to simultaneously express Myc-tagged and Flag-tagged proteins with various combinations as indicated, and analyzed by confocal microscopy. Scale bar: 10 μm. (b) PLA signals were quantified in 35–57 cells obtained from two independent experiments (filled and striped dots denote the data of experiments 1 and 2, respectively) and are shown as signals (summation of PLA-positive area) per cell relative to those observed in cells transfected simultaneously with plasmid to express Myc-tagged wtSeipin (0.26 ng/cm2) and plasmid to express Flag-tagged wtSeipin (0.26 ng/cm2). See also Figure 4—source data 1.
-
Figure 4—source data 1
Raw data related to Figure 4A.
- https://cdn.elifesciences.org/articles/74805/elife-74805-fig4-data1-v1.zip
Figure 5
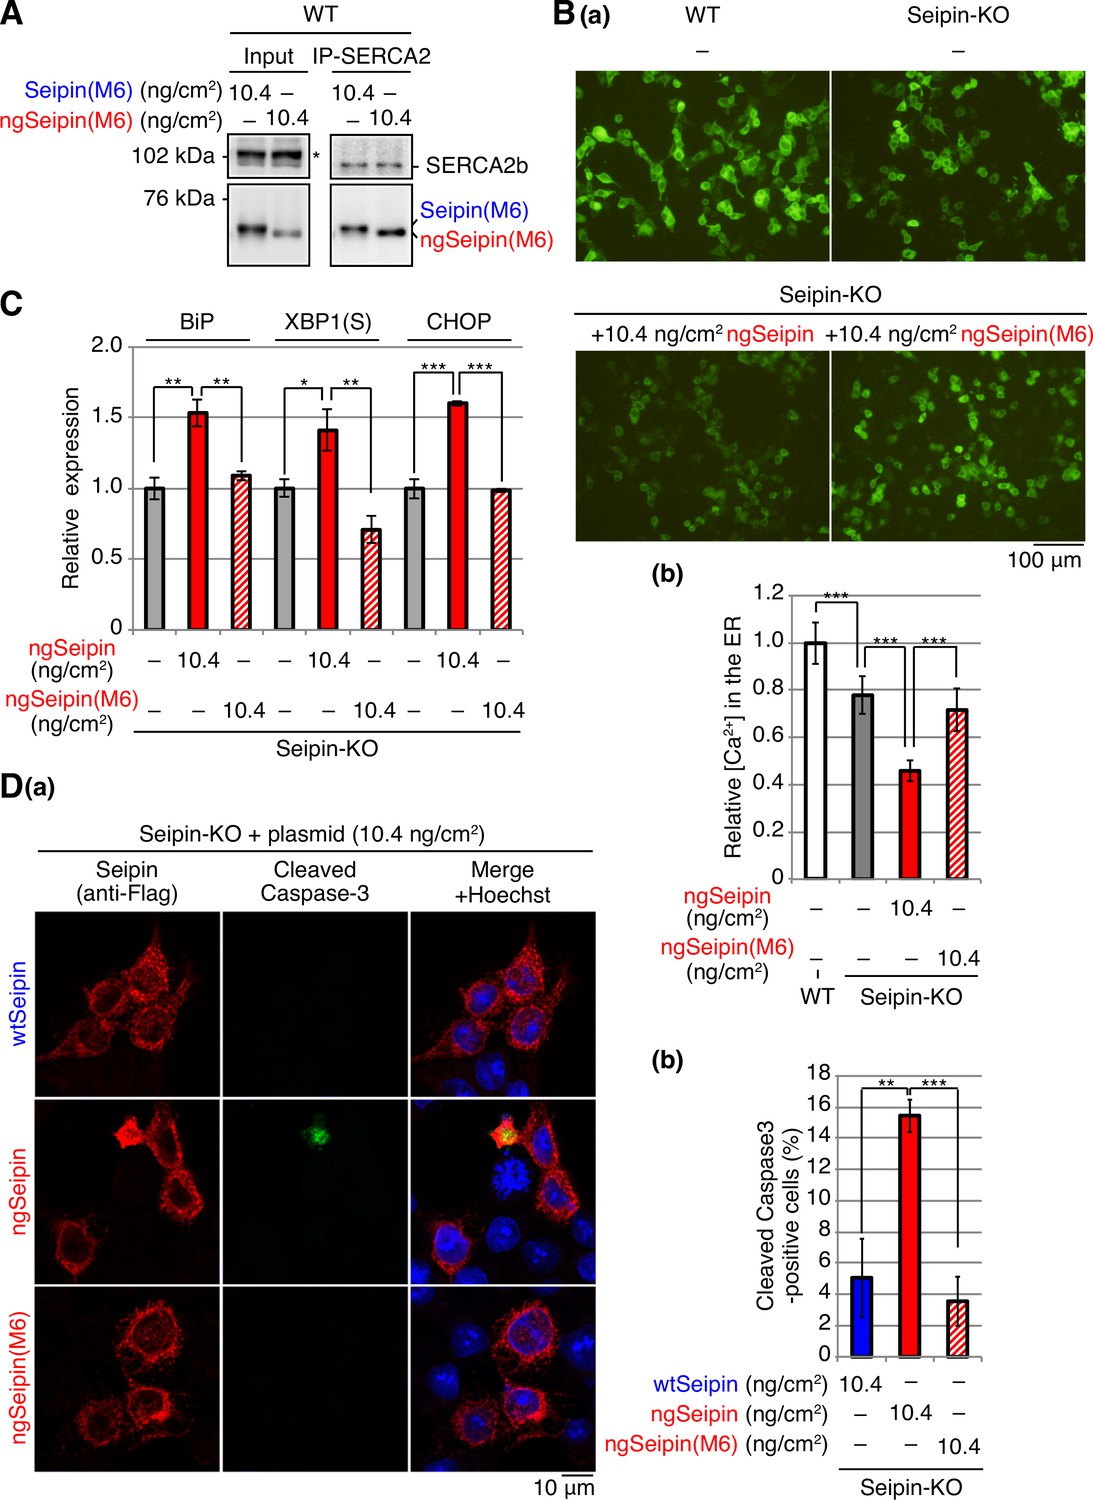
Effect of non-glycosylated Seipin (ngSeipin) oligomerization on calcium concentration in the endoplasmic reticulum (ER), ER stress, and apoptosis in Seipin-KO HCT116 cells.
(A) Cell lysates were prepared from HCT116 WT cells transfected with plasmid (10.4 ng/cm2) to express Myc-tagged Seipin(M6) or ngSeipin(M6), subjected to immunoprecipitation using anti-SERCA2 antibody, and analyzed as in Figure 1C. The asterisk denotes a nonspecific band. (B) HCT116 WT cells were transfected with plasmid (104 ng/cm2) to express G-CEPIA1er. Seipin-KO cells were transfected with plasmid (104 ng/cm2) to express G-CEPIA1er together with or without plasmid (10.4 ng/cm2) to express Myc-tagged ngSeipin or ngSeipin(M6). (a) Fluorescent microscopic analysis was conducted. Scale bar: 100 μm. (b) Fluorescence intensities were quantified and are expressed as in Figure 1E(b) (n = 3). (C) Quantitative RT-PCR was conducted in Seipin-KO cells transfected with or without plasmid (10.4 ng/cm2) to express Myc-tagged ngSeipin or ngSeipin(M6) (n = 3), as in Figure 3B. (D) (a, b) Seipin-KO cells transfected with plasmid (10.4 ng/cm2) to express Flag-tagged wild-type Seipin (wtSeipin), ngSeipin, or ngSeipin(M6) were fixed 28 hr later, subjected to immunofluorescence, and analyzed as in Figure 3C using 108–118 cells (n = 3). Scale bar: 10 μm. See also Figure 5—source data 1.
-
Figure 5—source data 1
Raw data related to Figure 5A.
- https://cdn.elifesciences.org/articles/74805/elife-74805-fig5-data1-v1.zip
Figure 6 with 1 supplement
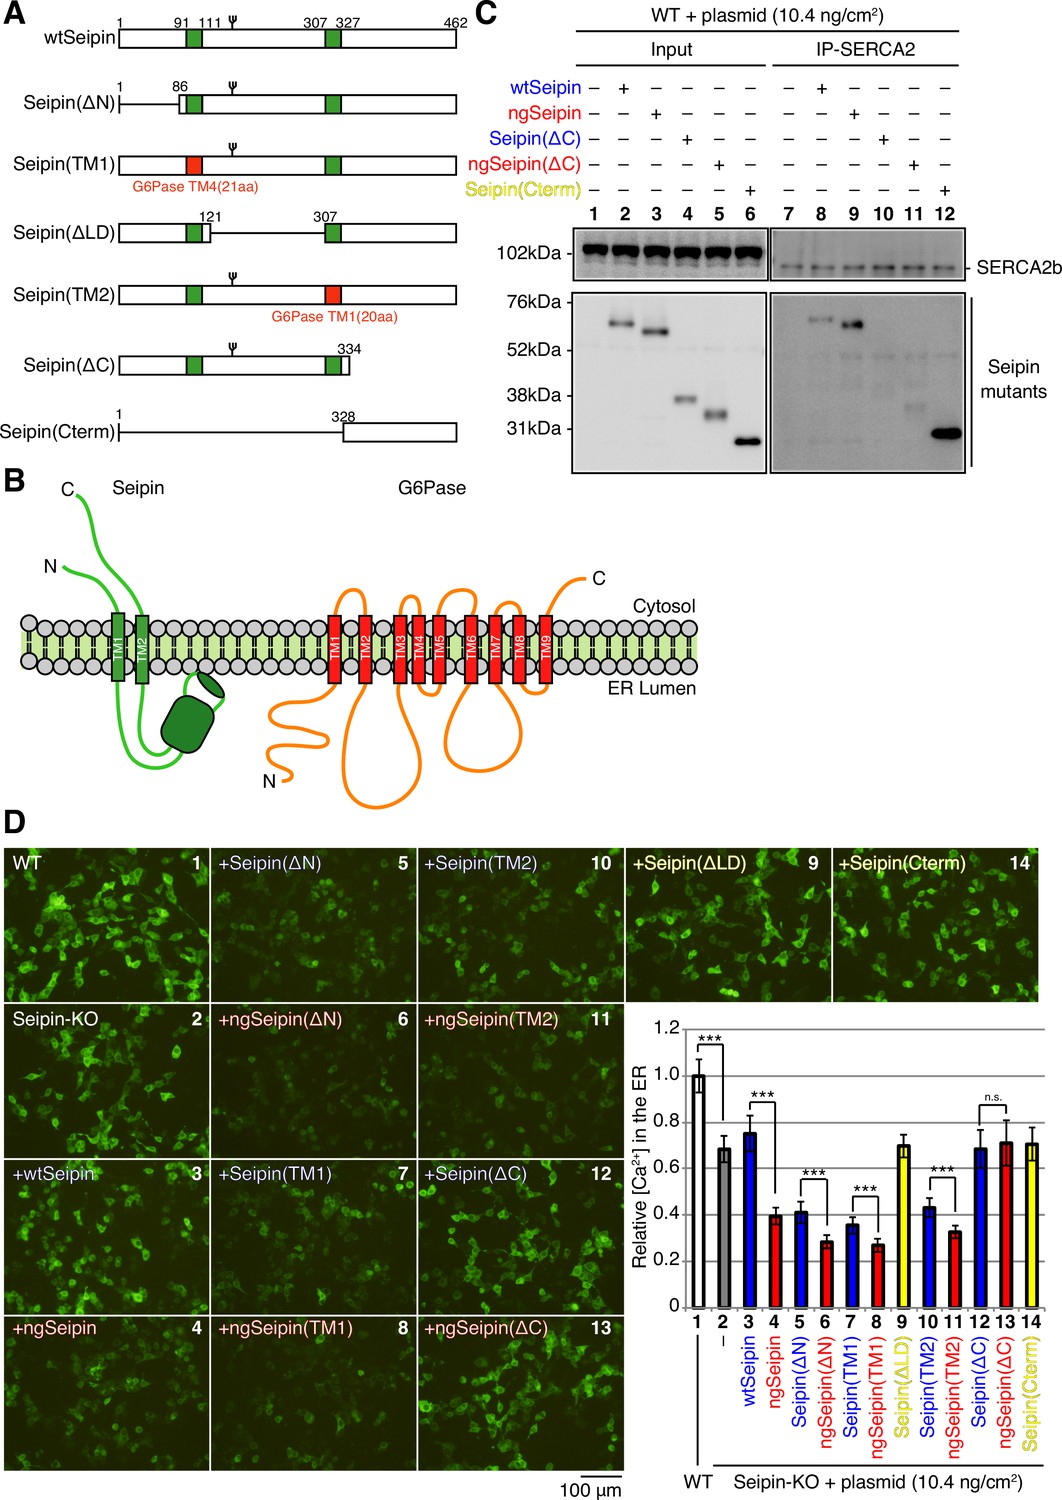
Effect of various deletions or replacements of non-glycosylated Seipin (ngSeipin) on interaction with SERCA2b and calcium concentration in the endoplasmic reticulum (ER) of Seipin-KO HCT116 cells.
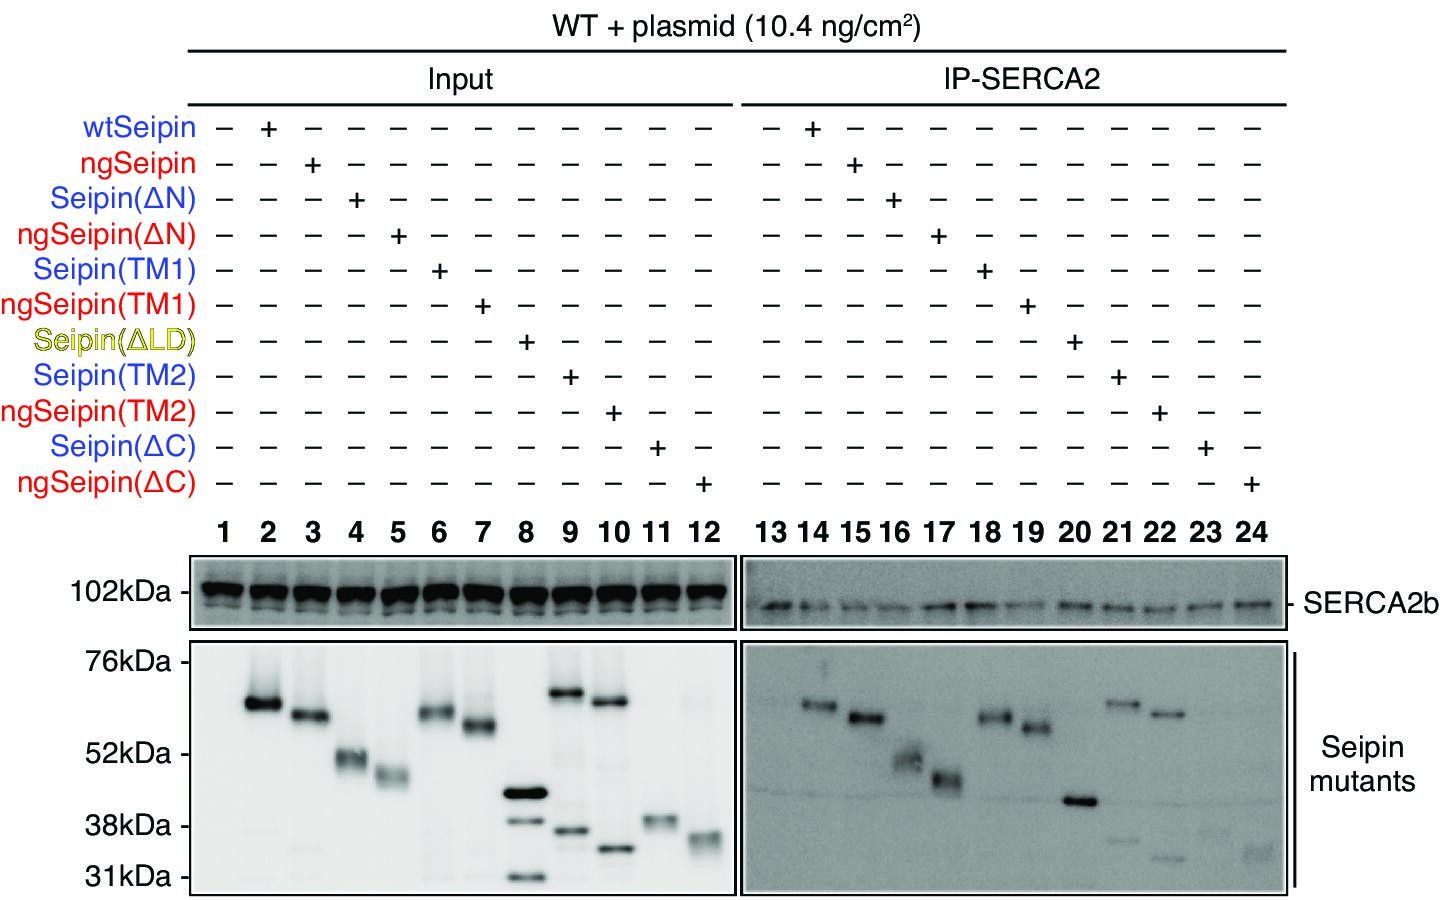
(A) Structures of wild-type Seipin (wtSeipin) and various mutant Seipin are schematically shown. The red boxes denote the transmembrane (TM1 and TM4) domains of glucose 6-phosphatase (G6Pase) to swap the TMs of Seipin. (B) Structures of Seipin and G6Pase are schematically shown. (C) Cell lysates were prepared from HCT116 WT cells transfected with plasmid (10.4 ng/cm2) to express Myc-tagged wtSeipin or various mutant Seipin, subjected to immunoprecipitation using anti-SERCA2 antibody, and analyzed as in Figure 1C. (D) HCT116 WT cells were transfected with plasmid (104 ng/cm2) to express G-CEPIA1er. Seipin-KO cells were transfected with plasmid (104 ng/cm2) to express G-CEPIA1er together with or without plasmid (10.4 ng/cm2) to express Myc-tagged wtSeipin or various mutant Seipin. (a) Fluorescent microscopic analysis of WT or Seipin-KO cells transfected as indicated was conducted. Scale bar: 100 μm. (b) Fluorescence intensities were quantified and are expressed as in Figure 1E(b) (n = 3). See also Figure 6—source data 1.
-
Figure 6—source data 1
Raw data related to Figure 6C.
- https://cdn.elifesciences.org/articles/74805/elife-74805-fig6-data1-v1.zip
Figure 6—figure supplement 1
Effect of various deletions or replacements of non-glycosylated Seipin (ngSeipin) on interaction with SERCA2b.
Cell lysates were prepared from HCT116 WT cells transfected with plasmid (10.4 ng/cm2) to express Myc-tagged wild-type Seipin (wtSeipin) or various mutant Seipin, subjected to immunoprecipitation using anti-SERCA2 antibody, and analyzed as in Figure 1C. See also Figure 6—source data 1.
-
Figure 6—figure supplement 1—source data 1
Raw data related to Figure 6—figure supplement 1.
- https://cdn.elifesciences.org/articles/74805/elife-74805-fig6-figsupp1-data1-v1.zip
Figure 7
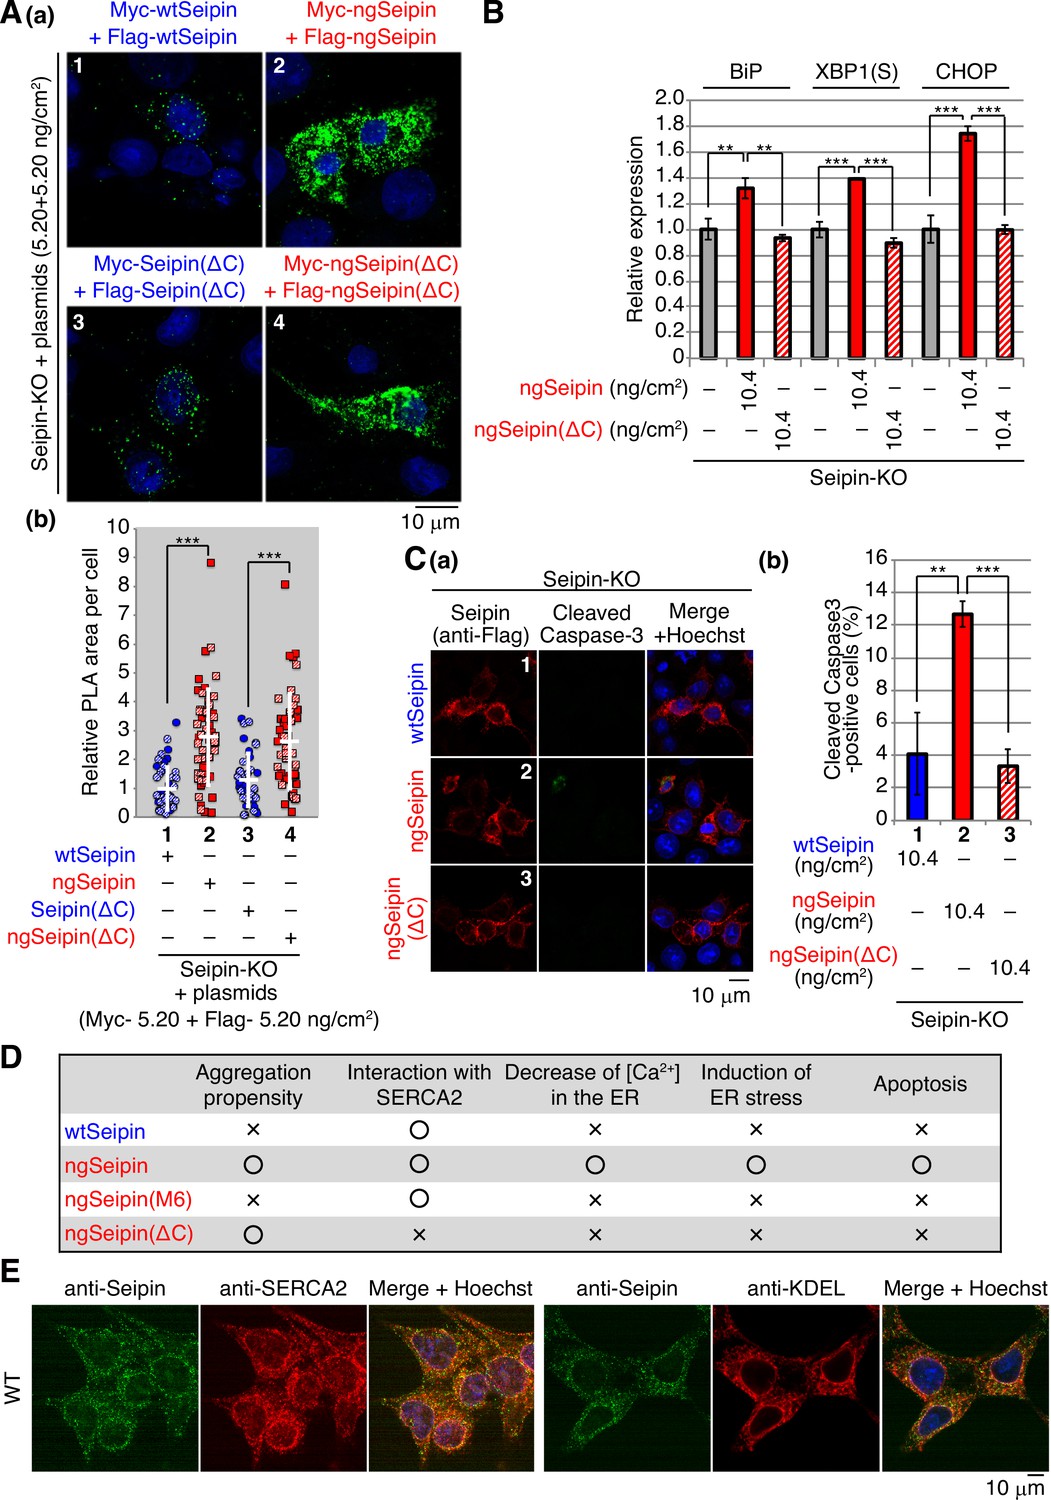
Effect of C-terminal deletion of non-glycosylated Seipin (ngSeipin) on aggregation of Seipin, endoplasmic reticulum (ER) stress, and apoptosis in Seipin-KO HCT116 cells.
(A) (a, b) Seipin-KO cells transfected with plasmids (5.20 ng/cm2 each) to simultaneously express Myc-tagged and Flag-tagged wild-type Seipin (wtSeipin) or various mutant Seipin as indicated were subjected to proximity ligation assay (PLA) and analyzed as in Figure 4E using 40–48 cells (n = 2). Scale bar: 10 μm. (B) Quantitative RT-PCR was conducted in Seipin-KO cells transfected with or without plasmid (10.4 ng/cm2) to express Myc-tagged ngSeipin or ngSeipin(ΔC) (n = 3), as in Figure 3B. (C) (a, b) Seipin-KO cells transfected with plasmid (10.4 ng/cm2) to express Flag-tagged wtSeipin, ngSeipin, or ngSeipin(ΔC) were fixed 28 hr later, subjected to immunofluorescence, and analyzed as in Figure 3C using117-127 cells (n = 3). Scale bar: 10 μm. (D) Phenotypes of wtSeipin, ngSeipin, ngSeipin(M6), and ngSeipin(ΔC) are summarized. (E) HCT116 WT cells were analyzed by immunofluorescence using anti-Seipin, anti-SERCA2, and anti-KDEL antibodies with fluorescence microscopy (AiryScan). Scale bar: 10 μm.
Figure 8 with 2 supplements
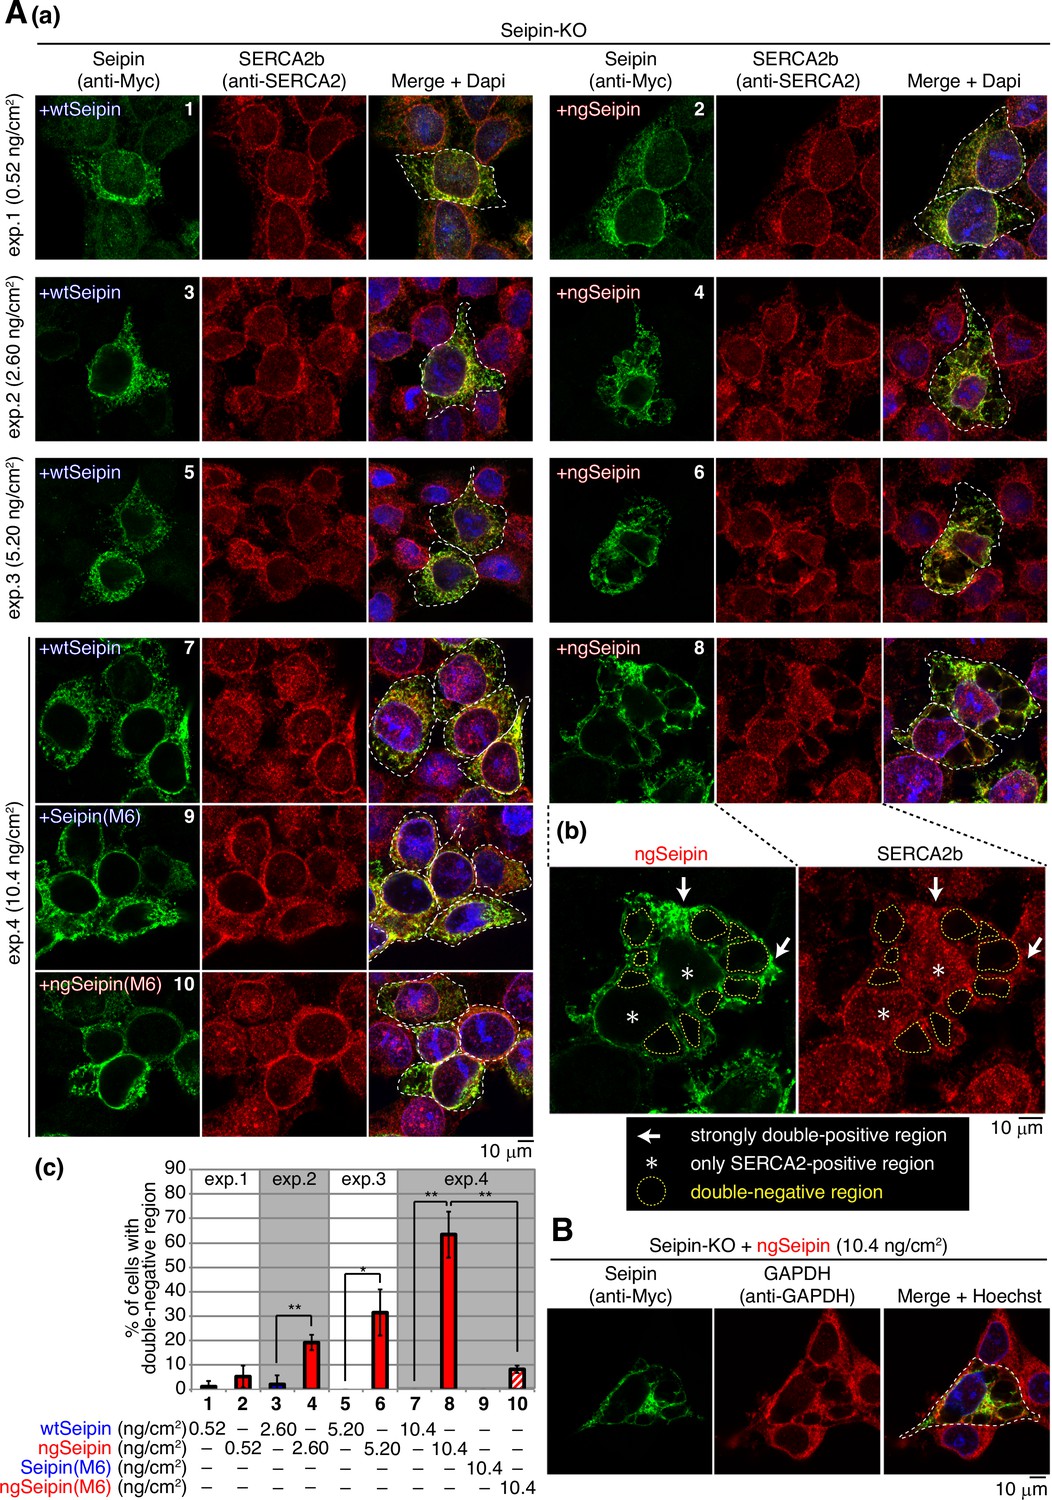
Effect of non-glycosylated Seipin (ngSeipin) expression on morphology of the endoplasmic reticulum (ER) and localization of SERCA2b.
(A) (a) Seipin-KO cells transfected with the indicated amounts of plasmid to express Myc-tagged wild-type Seipin (wtSeipin), ngSeipin, Seipin(M6), or ngSeipin(M6) were analyzed by immunofluorescence using anti-Myc and anti-SERCA2 antibodies with fluorescence microscopy (AiryScan). Transfected cells are surrounded by white broken lines. Scale bar: 10 μm. (b) Immunofluorescence images of Seipin-KO cells expressing ngSeipin by transfection (10.4 ng/cm2) are enlarged. Strongly double-positive regions and SERCA2-positive-only regions are indicated by white arrows and asterisks, respectively. Double-negative regions are surrounded by yellow broken lines. (c) Percentages of cells containing double-negative regions were quantified and are shown (n = 3, total 70–132 cells analyzed). (B) Seipin-KO cells transfected with plasmid (10.4 ng/cm2) to express Myc-tagged ngSeipin were analyzed by immunofluorescence using anti-Myc and anti-GAPDH antibodies with fluorescence microscopy (AiryScan). Scale bar: 10 μm.
Figure 8—figure supplement 1
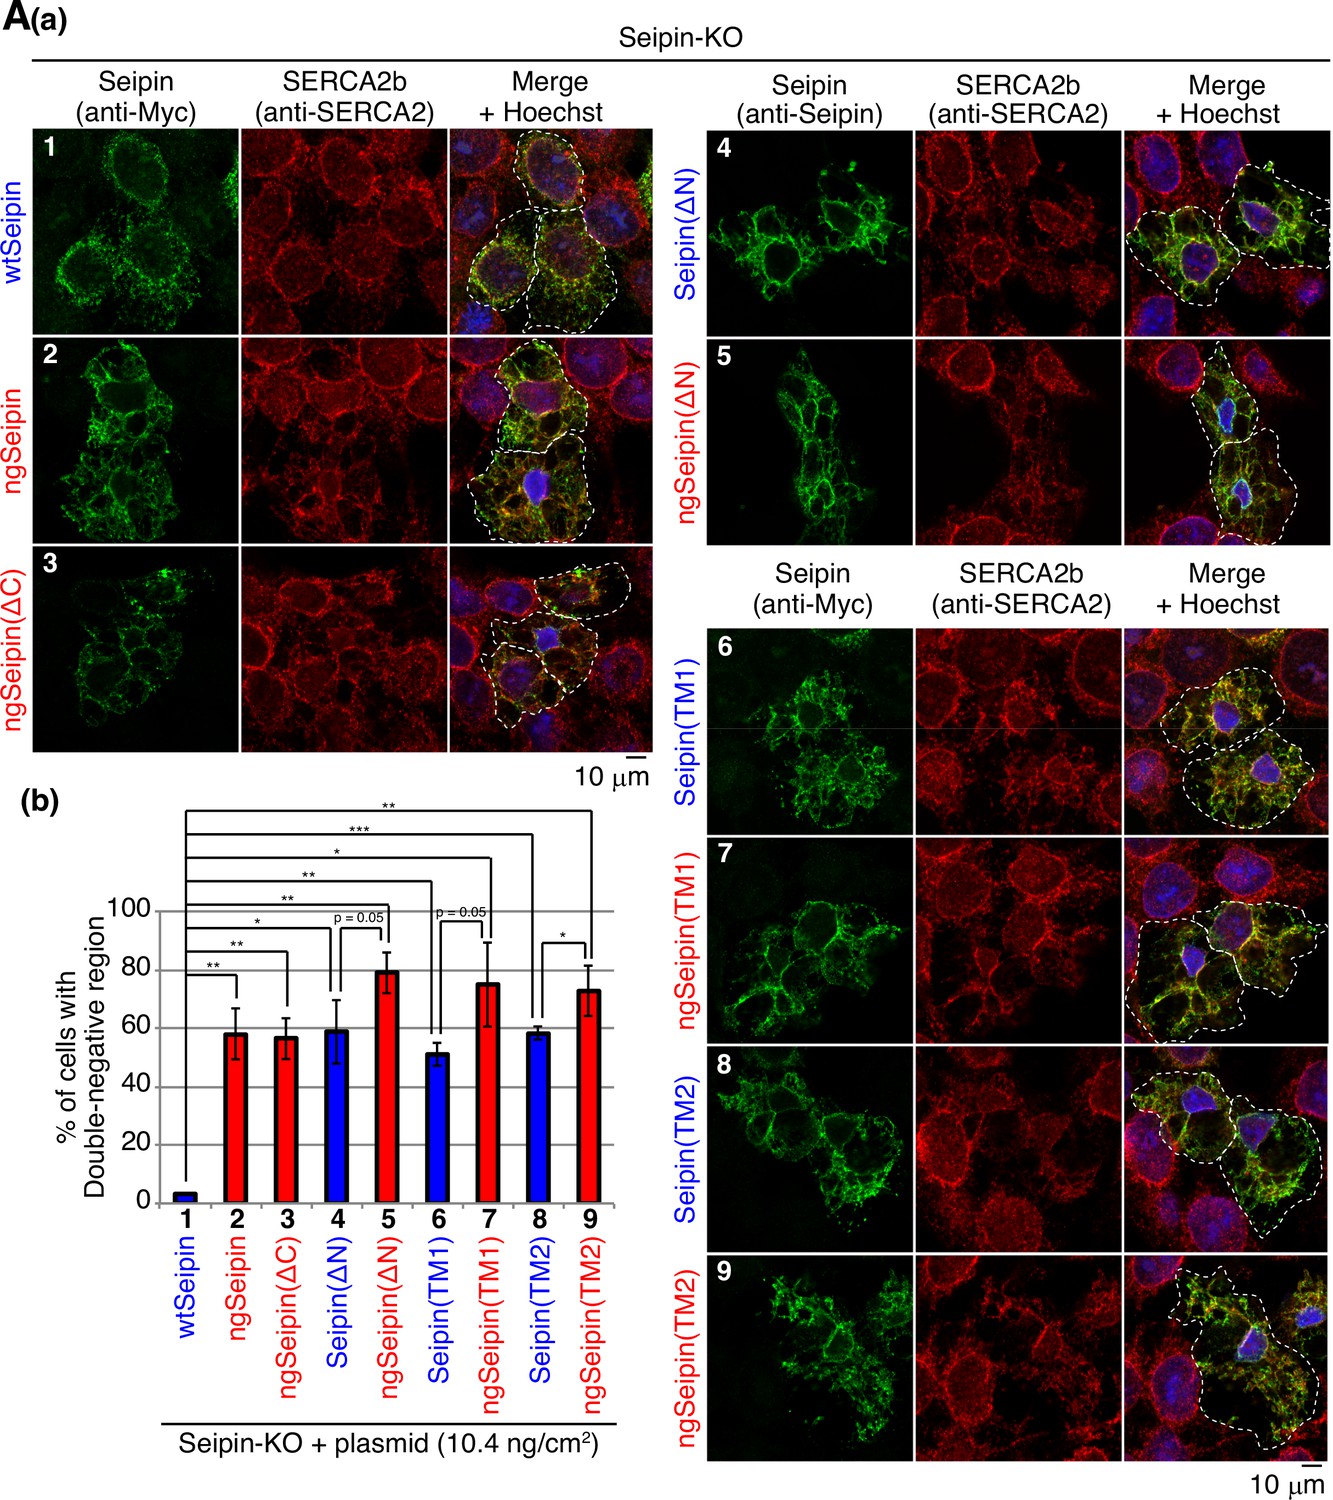
Effect of various deletions or replacements of Seipin on morphology of the endoplasmic reticulum (ER) and localization of SERCA2b.
(A) (a) Seipin-KO cells transfected with the indicated amounts of plasmid to express Myc-tagged wild-type Seipin (wtSeipin) or various mutant Seipin were analyzed by immunofluorescence using anti-SERCA2 antibody and anti-Myc or anti-Seipin antibody with fluorescence microscopy (AiryScan) as in Figure 8A. Transfected cells are surrounded by white broken lines. Scale bar: 10 μm. (b) Percentages of cells containing double-negative regions were quantified and are shown (n = 3, total 87–98 cells analyzed).
Figure 8—figure supplement 2
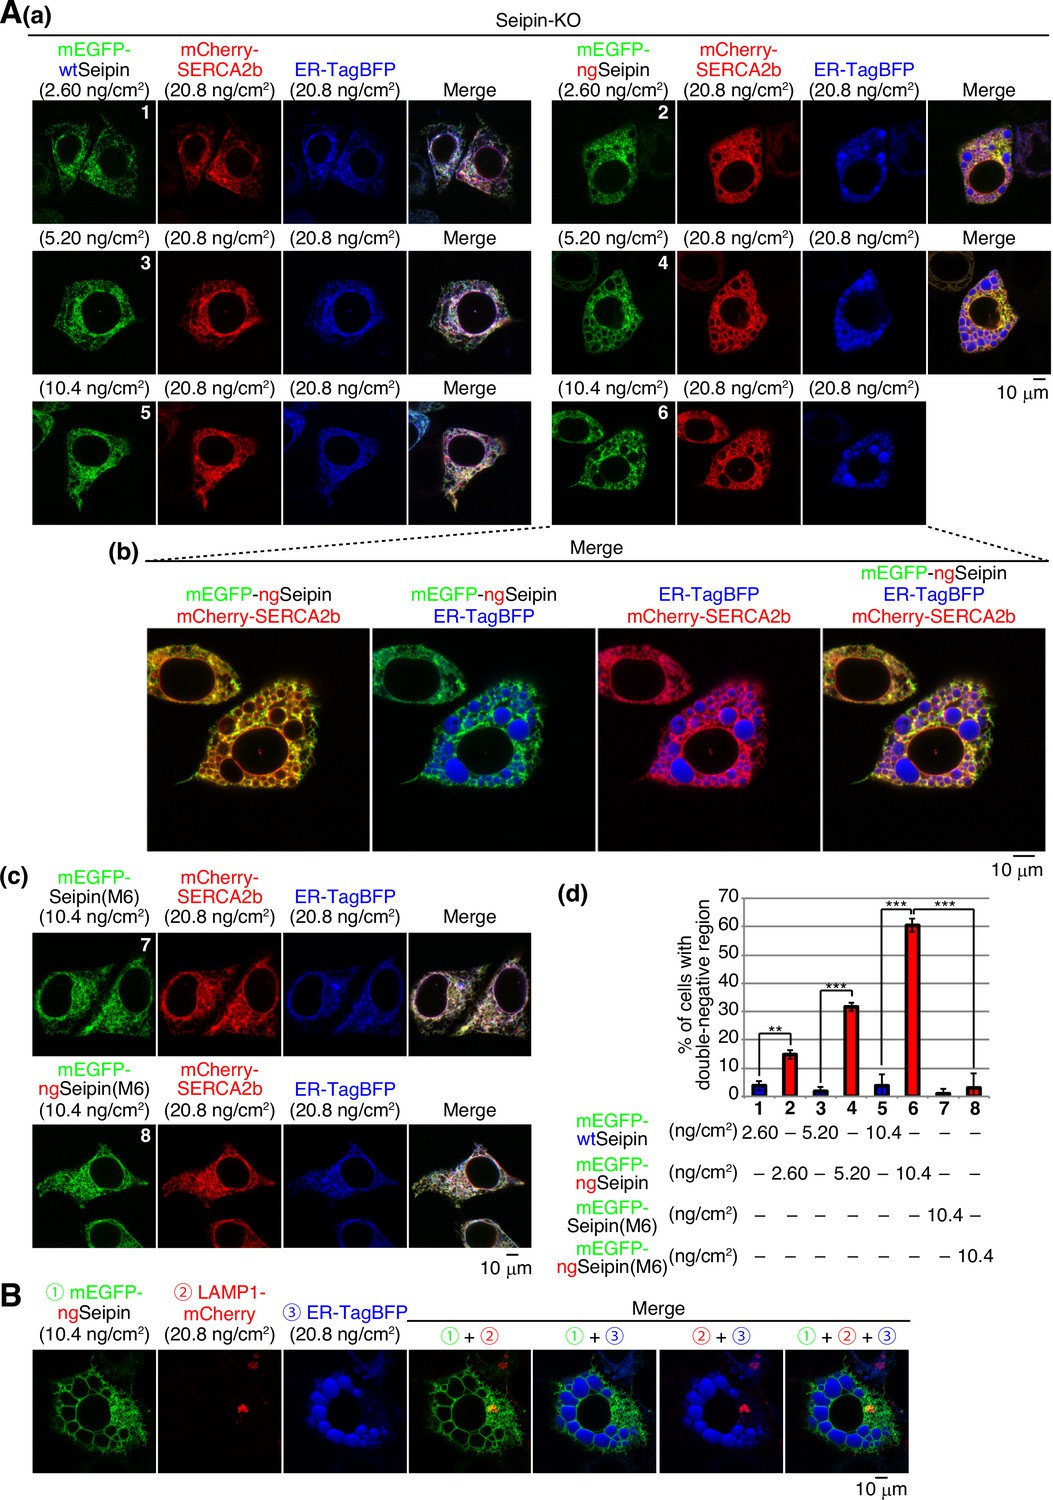
Effect of mEGFP-ngSeipin expression on morphology of the endoplasmic reticulum (ER) and localization of SERCA2b.
(A) (a) Seipin-KO cells transfected with the indicated amounts of plasmid to express mCherry-SERCA2b, ER-tagBFP, and mEGFP-wtSeipin or mEGFP-ngSeipin were analyzed with fluorescence microscopy (AiryScan). Scale bar: 10 μm. (b) Fluorescence microscopic images of Seipin-KO cells simultaneously expressing mCherry-SERCA2b, ER-tagBFP, and mEGFP-ngSeipin by transfection are enlarged. Scale bar: 10 μm. (c) Seipin-KO cells transfected with the indicated amounts of plasmid to express mCherry-SERCA2b, ER-tagBFP, and mEGFP-Seipin(M6) or mEGFP-ngSeipin(M6) were analyzed with fluorescence microscopy (AiryScan). Scale bar: 10 μm.(d) Percentages of cells containing double-negative regions were quantified and are shown (n = 3, total 91–105 cells analyzed). (B) Seipin-KO cells transfected with the indicated amounts of plasmid to express Lamp1-mCherry, ER-tagBFP, and mEGFP-ngSeipin were analyzed with fluorescence microscopy (AiryScan). Scale bar: 10 μm.
Figure 9 with 1 supplement

Effect of introduction of SERCA2b on aggregation of non-glycosylated Seipin (ngSeipin), endoplasmic reticulum (ER) stress, growth, and apoptosis in ngSeipin-expressing HCT116 cells.
(A) Seipin-KO cells transfected with plasmids (5.20 ng/cm2 each) to simultaneously express Myc-tagged and Flag-tagged ngSeipin together with or without plasmid (20.8 ng/cm2) to express HA-tagged SERCA2b were subjected to proximity ligation assay (PLA) and analyzed as in Figure 4E using 49–50 cells (n = 2). Scale bar: 10 μm. (B) Seipin-KO cells transfected with plasmid (10.4 ng/cm2) to express Myc-tagged ngSeipin together with or without plasmid (20.8 ng/cm2) to express HA-tagged SERCA2b were analyzed by immunofluorescence using anti-Myc antibody with fluorescence microscopy (AiryScan). Percentage of cells containing double-negative regions was determined and shown (n = 3, total 110–112 cells analyzed). (C) Quantitative RT-PCR was conducted in Seipin-KO cells transfected with or without plasmid (10.4 ng/cm2) to express Myc-tagged wild-type Seipin (wtSeipin) or ngSeipin together with or without plasmid (20.8 ng/cm2) to express Myc-tagged SERCA2b (n = 3), as in Figure 3B. (D) Growth rates of HCT116 WT cells transfected with plasmid (10.4 ng/cm2) to express Venus, Myc-tagged wtSeipin or ngSeipin together with or without plasmid (20.8 ng/cm2) to express Myc-tagged SERCA2b were determined by counting cell number every 24 hr (n = 4). Cell number at the time of transfection is set as 1. (E) Seipin-KO cells transfected with plasmid (10.4 ng/cm2) to express Flag-tagged wtSeipin or ngSeipin together with or without plasmid (20.8 ng/cm2) to express Myc-tagged SERCA2b were fixed 28 hr later, subjected to immunofluorescence, and analyzed as in Figure 3C using 97–125 cells (n = 3). Scale bar: 10 μm.
Figure 9—figure supplement 1
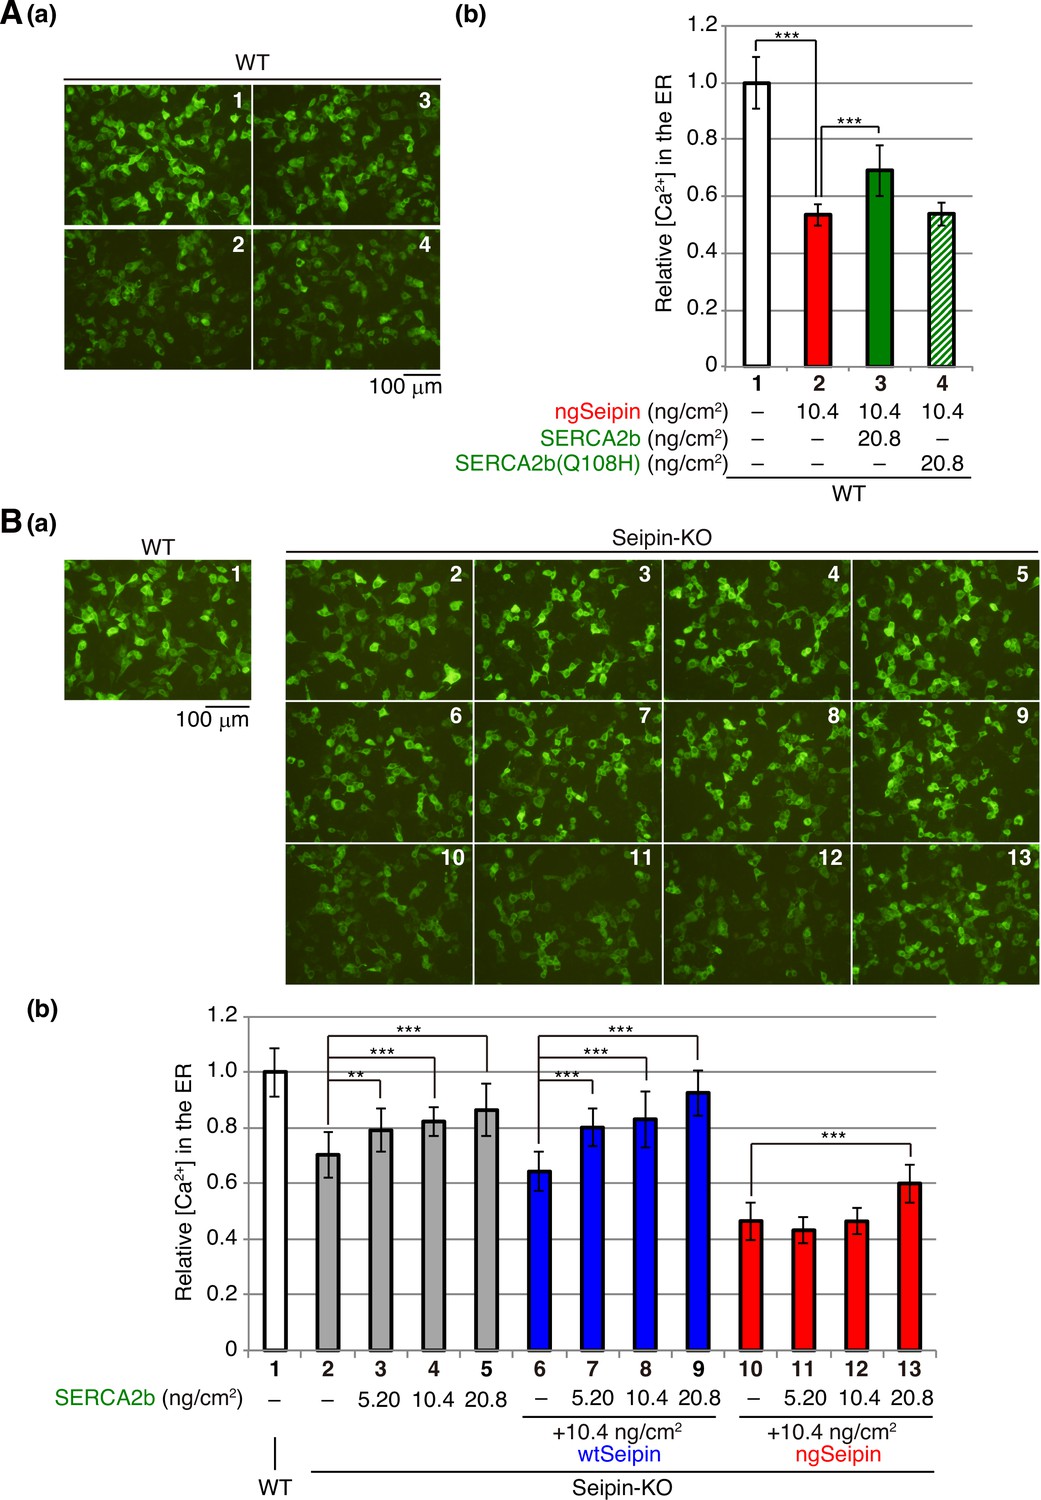
Effect of introduction of SERCA2b on calcium concentration in the endoplasmic reticulum (ER) of non-glycosylated Seipin (ngSeipin)-expressing HCT116 cells.
(A) HCT116 WT cells were transfected with plasmid (104 ng/cm2) to express G-CEPIA1er together with or without the indicated amounts of plasmid to express Myc-tagged ngSeipin or Myc-tagged SERCA2b (WT or Q108H). (a) Fluorescent microscopic analysis was conducted. Scale bar: 100 μm. (b) Fluorescence intensities were quantified and are expressed as in Figure 1E(b) (n = 3). (B) HCT116 WT cells were transfected with plasmid (104 ng/cm2) to express G-CEPIA1er. Seipin-KO cells were transfected with plasmid (104 ng/cm2) to express G-CEPIA1er together with or without the indicated amounts of plasmid to express Myc-tagged SERCA2b in addition to plasmid (10.4 ng/cm2) to express Myc-tagged wild-type Seipin (wtSeipin) or ngSeipin. (a) Fluorescence microscopic analysis was conducted. Scale bar: 100 μm. (b) Fluorescence intensities were quantified and are expressed as in Figure 1E(b) (n = 3).
Figure 10 with 1 supplement

Effect of non-glycosylated Seipin (ngSeipin) expression on calcium concentration in the endoplasmic reticulum (ER), morphology of the ER, ER stress, and apoptosis in Seipin-KO SH-SY5Y cells.
(A) SH-SY5Y WT cells were transfected with plasmid (104 ng/cm2) to express G-CEPIA1er. Seipin-KO cells were transfected with plasmid (104 ng/cm2) to express G-CEPIA1er together with or without the indicated amounts of plasmid to express Myc-tagged wtSeipinL plus wtSeipinS, ngSeipinL plus ngSeipinS, or both. (a) Fluorescence microscopic analysis of WT cells and Seipin-KO cells transfected as indicated was conducted. Scale bar: 100 μm. (b) Fluorescence intensities were quantified and are expressed as in Figure 1E(b) (n = 3). (c) Cell lysates were prepared from the indicated cells and analyzed by immunoblotting using anti-Seipin and anti-GAPDH antibodies. Quantified data are shown between blots of Seipin and GAPDH. (B) (a) Seipin-KO cells transfected with the indicated amounts of plasmid to express Myc-tagged wtSeipinL plus wtSeipinS, ngSeipinL plus ngSeipinS, or both as in (A) were analyzed by immunofluorescence using anti-Seipin and anti-SERCA2 antibodies with fluorescence microscopy (AiryScan). Transfected cells are surrounded by white broken lines. Scale bar: 10 μm. Strongly double-positive regions are indicated by white arrows. Double-weak regions are surrounded by yellow broken lines. (c) Percentages of cells containing double-weak regions were quantified and are shown (n = 3, total 90–98 cells analyzed). (C) Seipin-KO cells were transfected with the indicated amounts of plasmid to express Myc-tagged wtSeipinL plus wtSeipinS, ngSeipinL plus ngSeipinS, or both as in (A) together with the ERSE, UPRE, or ATF4 reporter (104 ng/cm2) and the reference plasmid pRL-SV40 (10.4 ng/cm2). Cell lysates were prepared 28 hr later and luciferase activities were determined (n = 3). (D) Seipin-KO cells transfected with the indicated amounts of plasmid to express Myc-tagged wtSeipinL plus wtSeipinS, ngSeipinL plus ngSeipinS, or both as in (A) were fixed 28 hr later, subjected to immunofluorescence, and analyzed as in Figure 3C. Scale bar: 10 μm. (b) Number of Myc-tagged Seipin (red) and cleaved Caspase-3 (green) double-positive cells was counted in 100–110 cells obtained from three independent experiments and shown as a percentage. See also Figure 10—source data 1.
-
Figure 10—source data 1
Raw data related to Figure 10A.
- https://cdn.elifesciences.org/articles/74805/elife-74805-fig10-data1-v1.zip
Figure 10—figure supplement 1
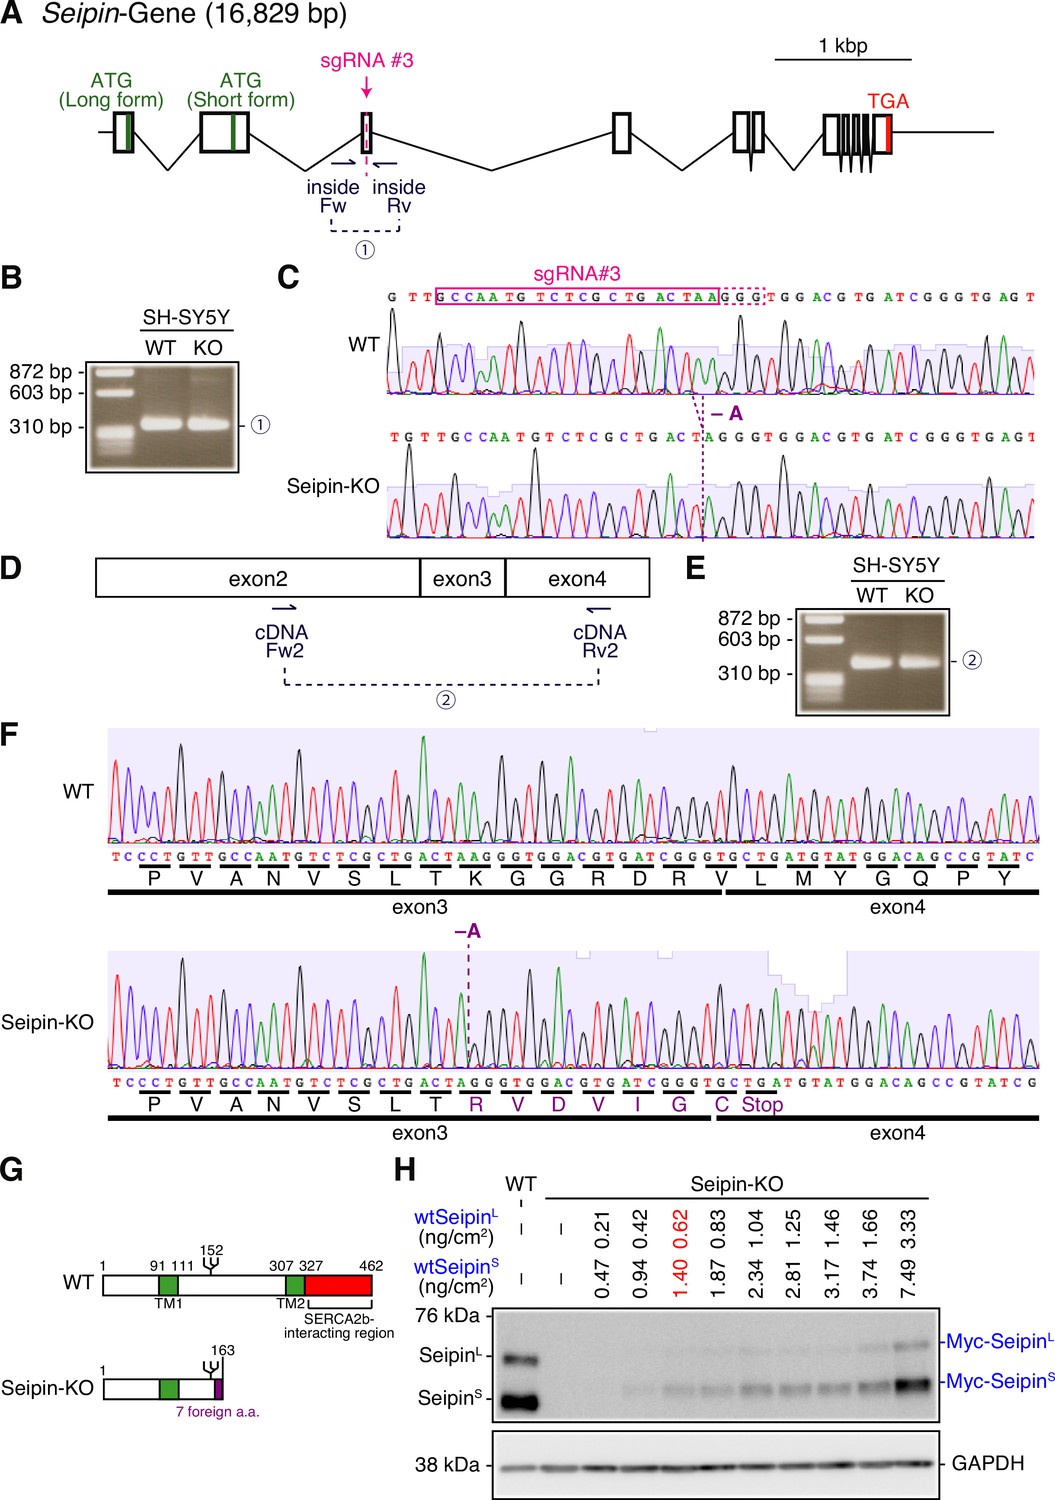
Construction of Seipin-KO SH-SY5Y cells.
(A) Strategy of the CRISPR/Cas9-mediated cleavage at exon 3 of the Seipin gene is shown. (B) Genomic PCR was carried out to confirm non-homologous end joining after cleavage. The positions of primers are shown in (A). (C) The fragments amplified in (B) were sequenced. (D) Strategy of RT-PCR-mediated amplification of cDNA fragment is shown. (E) Total RNA was prepared from WT and Seipin-KO cells, and subjected to RT-PCR to amplify cDNA fragment using the primers shown in (D). (F) The fragments amplified in (E) were sequenced. (G) Structures of Seipin expressed in WT and Seipin-KO cells are schematically shown. (H) Cell lysates were prepared from WT cells and Seipin-KO cells transfected with the indicated amounts of plasmid to express Myc-tagged wtSeipinL and wtSeipinS, and analyzed by immunoblotting using anti-Seipin and anti-GAPDH antibodies. See also Figure 10—figure supplement 1—source data 1.
-
Figure 10—figure supplement 1—source data 1
Raw data related to Figure 10—figure supplement 1B, E, and H.
- https://cdn.elifesciences.org/articles/74805/elife-74805-fig10-figsupp1-data1-v1.zip
Tables
Key resources table
| Reagent type (species) or resource | Designation | Source or reference | Identifiers | Additional information |
|---|---|---|---|---|
| Cell line (Homo sapiens) | Colorectal carcinoma | ATCC | HCT116 | Parental cell line has been authenticated using STR profiling All cell lines have been tested negative for mycoplasma |
| Cell line (H. sapiens) | Neuroblastoma | ATCC | SH-SY5Y | Parental cell line has been authenticated using STR profiling All cell lines have been tested negative for mycoplasma |
| Recombinant DNA reagent | pCMV-Myc | Clontech | ||
| Recombinant DNA reagent | pCMV G-CEPIA1er | Addgene | ||
| Recombinant DNA reagent | pGP-CMV-GCaMP6f | Addgene | ||
| Recombinant DNA reagent | px330-U6-Chimeric_BB-CBh-hSpCas9 | Addgene | ||
| Antibody | Anti-BSCL2(Seipin) (rabbit monoclonal) | Cell Signaling | Cat# 23846 | WB (1:1000) Immunostaining (1:1000) |
| Antibody | Anti-SERCA2 (mouse monoclonal) | Santa Cruz | Cat# sc-376235 | WB (1:500) IP (5 µl) Immunostaining (1:250) |
| Antibody | Anti-Myc-tag mAb-HRP-DirecT (mouse monoclonal) | MBL | Code M047-7 | WB (1:1000) |
| Antibody | Anti-GFP (rabbit polyclonal) | MBL | Code 598 | WB (1:1000) |
| Antibody | Anti-β-actin (mouse monoclonal) | Wako | Cat# 017-24573 | WB (1:2000) |
| Antibody | Anti-GAPDH peroxidase conjugated (mouse monoclonal) | Wako | Cat# 015-25473 | WB (1:5000) |
| Antibody | Anti-GAPDH (mouse monoclonal) | Wako | Cat# 014-25524 | Immunostaining (1:1000) |
| Antibody | Anti-KDEL (mouse monoclonal) | MBL | Code M181-3 | Immunostaining (1:2000) |
| Antibody | Anti-Myc-tag (rabbit polyclonal) | MBL | Code 562 | PLA (1:250) Immunostaining (1:100) |
| Antibody | Anti-Flag M2 (mouse monoclonal) | Sigma | Cat# F3165 | PLA (1:250) Immunostaining (1:500) |
| Antibody | Anti-Myc tag (mouse monoclonal) | Wako | Cat# 017-21871 | Immunostaining (1:100) |
| Antibody | Anti-cleaved Caspase-3 (rabbit polyclonal) | Cell Signaling | Cat# 9661 | Immunostaining (1:800) |
| Antibody | Alexa488-conjugated anti-rabbit secondary antibody (goat polyclonal) | Invitrogen | Cat# A-11008 | Immunostaining (1:1000) |
| Antibody | Alexa568-conjugated anti-mouse secondary antibody (goat polyclonal) | Invitrogen | Cat# A-11004 | Immunostaining (1:1000) |
Additional files
-
MDAR checklist
- https://cdn.elifesciences.org/articles/74805/elife-74805-mdarchecklist1-v1.docx
-
Supplementary file 1
Names and sequences of various primers used.
- https://cdn.elifesciences.org/articles/74805/elife-74805-supp1-v1.docx
Download links
A two-part list of links to download the article, or parts of the article, in various formats.
Downloads (link to download the article as PDF)
Open citations (links to open the citations from this article in various online reference manager services)
Cite this article (links to download the citations from this article in formats compatible with various reference manager tools)
A motor neuron disease-associated mutation produces non-glycosylated Seipin that induces ER stress and apoptosis by inactivating SERCA2b
eLife 11:e74805.
https://doi.org/10.7554/eLife.74805


