Dorsal striatum coding for the timely execution of action sequences
- Universidad de Buenos Aires, Facultad de Ciencias Exactas y Naturales, Departamento de Fisiología, Biología Molecular y Celular “Dr. Héctor Maldonado”, Argentina
- Universidad de Buenos Aires - CONICET, Instituto de Fisiología y Biofísica “Dr. Bernardo Houssay” (IFIBIO-Houssay), Grupo de Neurociencia de Sistemas, Argentina
- Universidad de Buenos Aires, Facultad de Ciencias Médicas, Departamento de Fisiología, Argentina
Figures
Figure 1 with 1 supplement
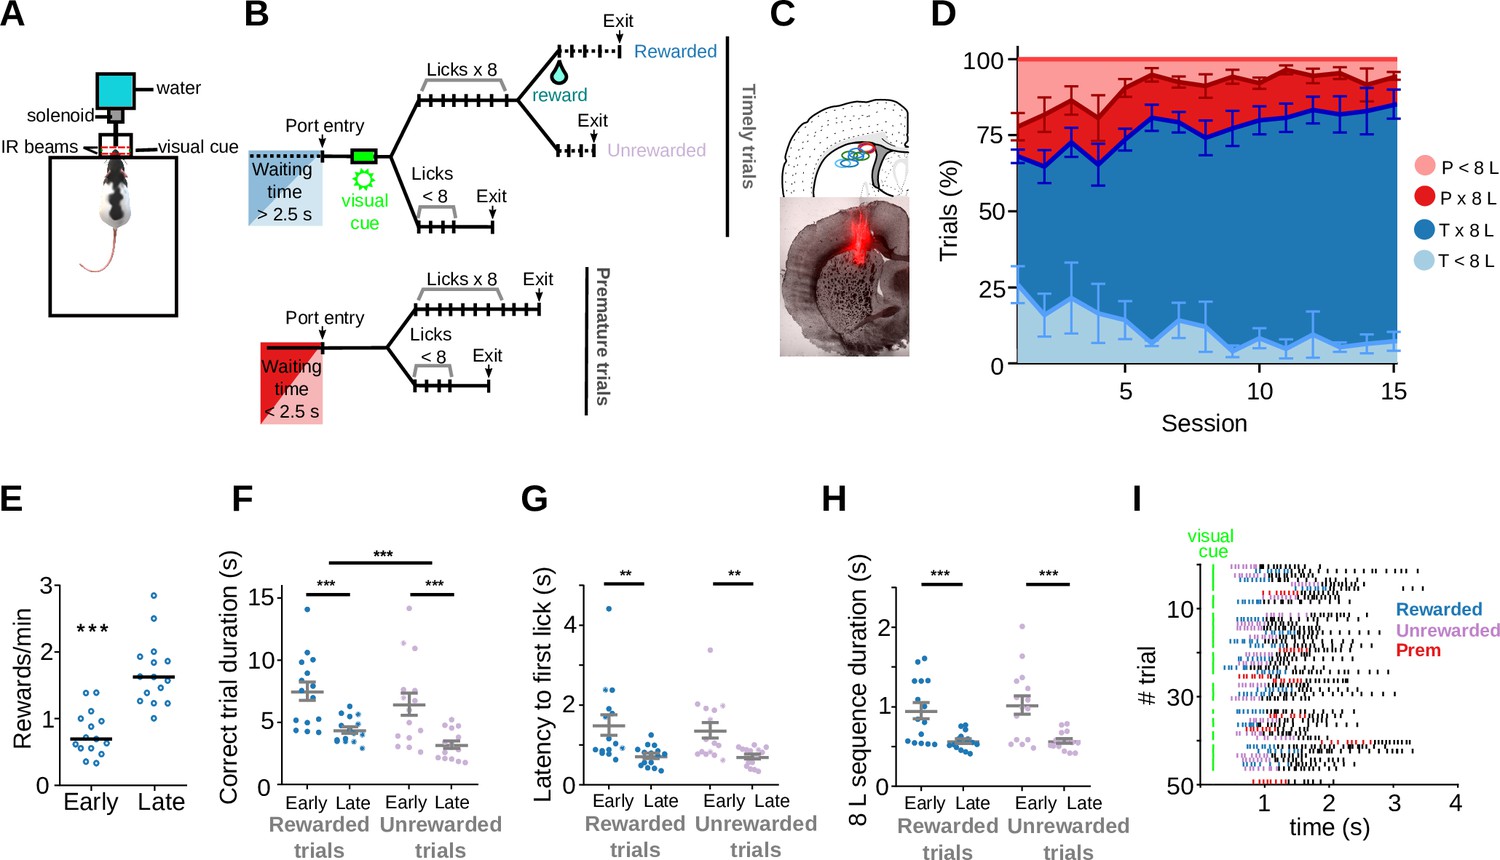
Rats become skilled in the task.
(A) Behavioral chamber with the nose-poke. Animals’ entries/exits from the nose-poke and licks are detected with infra-red (IR) beams. A 100-ms visual cue is presented through a pair of green LEDs placed on the side of the nose-poke to indicate a timely entry. (B) Schematic representation of the different types of trials. Timely trials require a minimum waiting time of 2.5 s and premature trials are those in which the minimum waiting time is not met. After that, trials are classified by whether animals performed an 8-lick sequence or not. (C) Top: Representative diagram of the electrodes’ positioning, aimed at the dorsal striatum. Bottom: histological section (AP = 0.24 cm from bregma) with electrodes traces. (D) Percentage of the different trial types per session, timely trials with an 8-lick sequence (T×8L) or not (T<8L) and premature trials with an 8-lick sequence (P×8L) or not (P<8L). (E) Reward rates for early and late training stages. Trial duration (F), latency to the first lick during correct trials (G), and time to complete the 8-lick sequence (H) for the two types of correct trials (rewarded and unrewarded), at each training stage. (E–H) Data are expressed as mean ± standard error of the mean (SEM), n = 15 early and 15 late sessions, n = 5 rats performing the standard 2.5 s waiting time task,*** p<0.001; ** p<0.01. (I) Raster plot of the licks from 50 trials at a late training session of one of the adult rats. Colored dashes show the first 8 licks of the trial (timely rewarded trials: blue, timely unrewarded trials: lilac, premature trials: red).
Figure 1—figure supplement 1
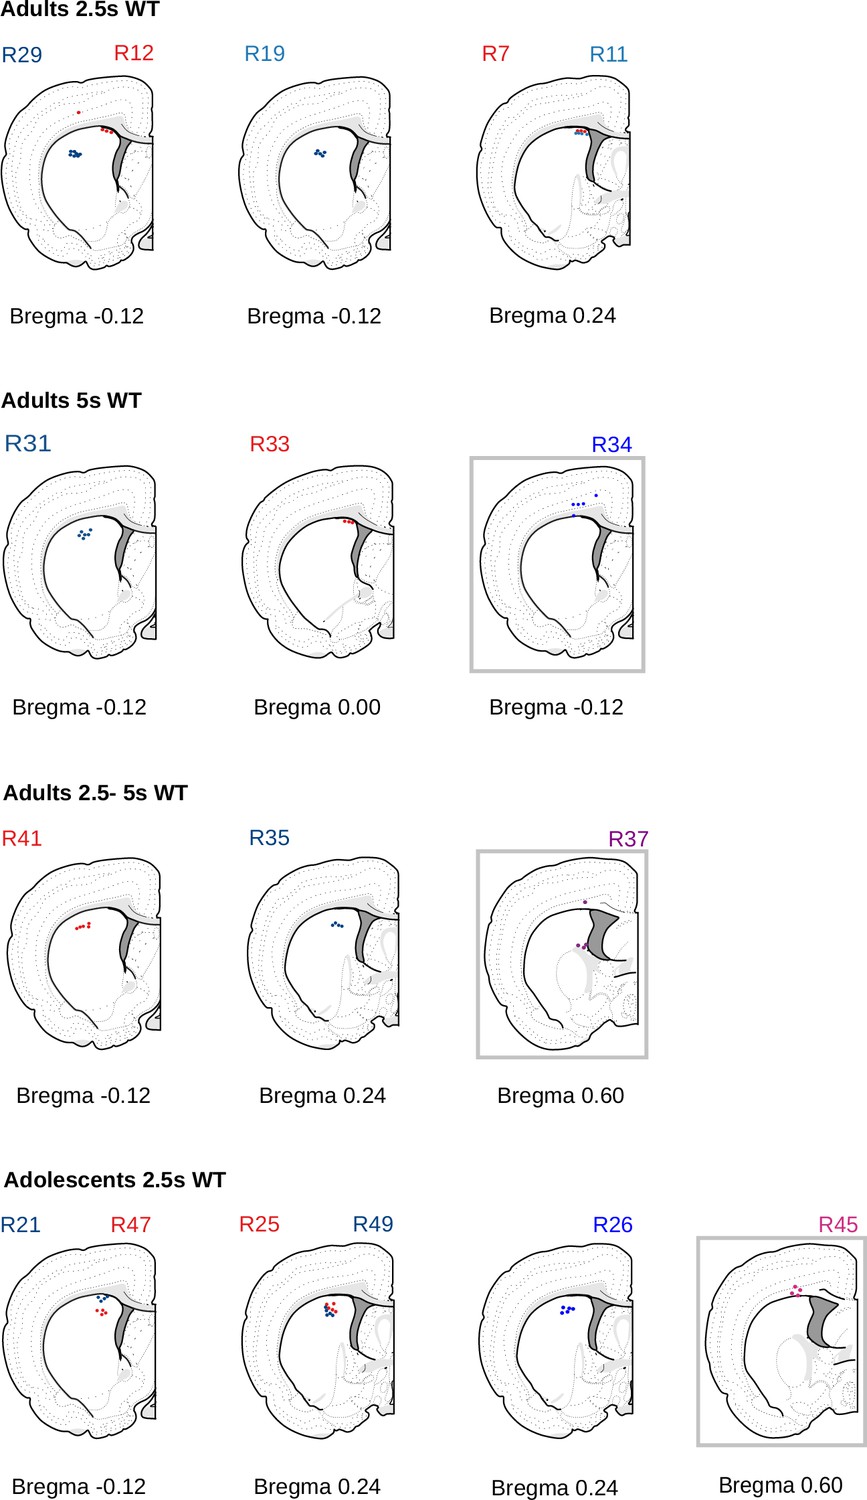
Localization of recording tetrodes.
Schematic representation of the electrodes’ placement for each of the animals, based on the electrode tips visible in the histological analysis, adapted from Swanson’s Brain map: structure of the rat brain (Swanson, 2004), levels 16, 17,19, and 21. As such it is not covered by the CC BY 4.0 license and further reproduction of these panels would need to follow the terms of the CC BY-NC 4.0 license. Animals with incorrect electrode placement (gray squares) were excluded from the electrophysiological analysis but not from the behavioral analysis.
© 2004, Larry Swanson. Adapted from Swanson's Brain map: structure of the rat brain (Swanson, 2004), levels 16, 17,19 and 21, which is distributed under the terms of a Creative Commons Attribution-Noncommercial 4.0 license CC BY-NC-4.0 (https://creativecommons.org/licenses/by-nc/4.0/). As such it is not covered by the CC BY 4.0 license and further reproduction of these panels would need to follow the terms of the CC BY-NC 4.0 license. Animals with incorrect electrode placement (gray squares) were excluded from the electrophysiological analysis but not from the behavioral analysis.
Figure 2 with 2 supplements
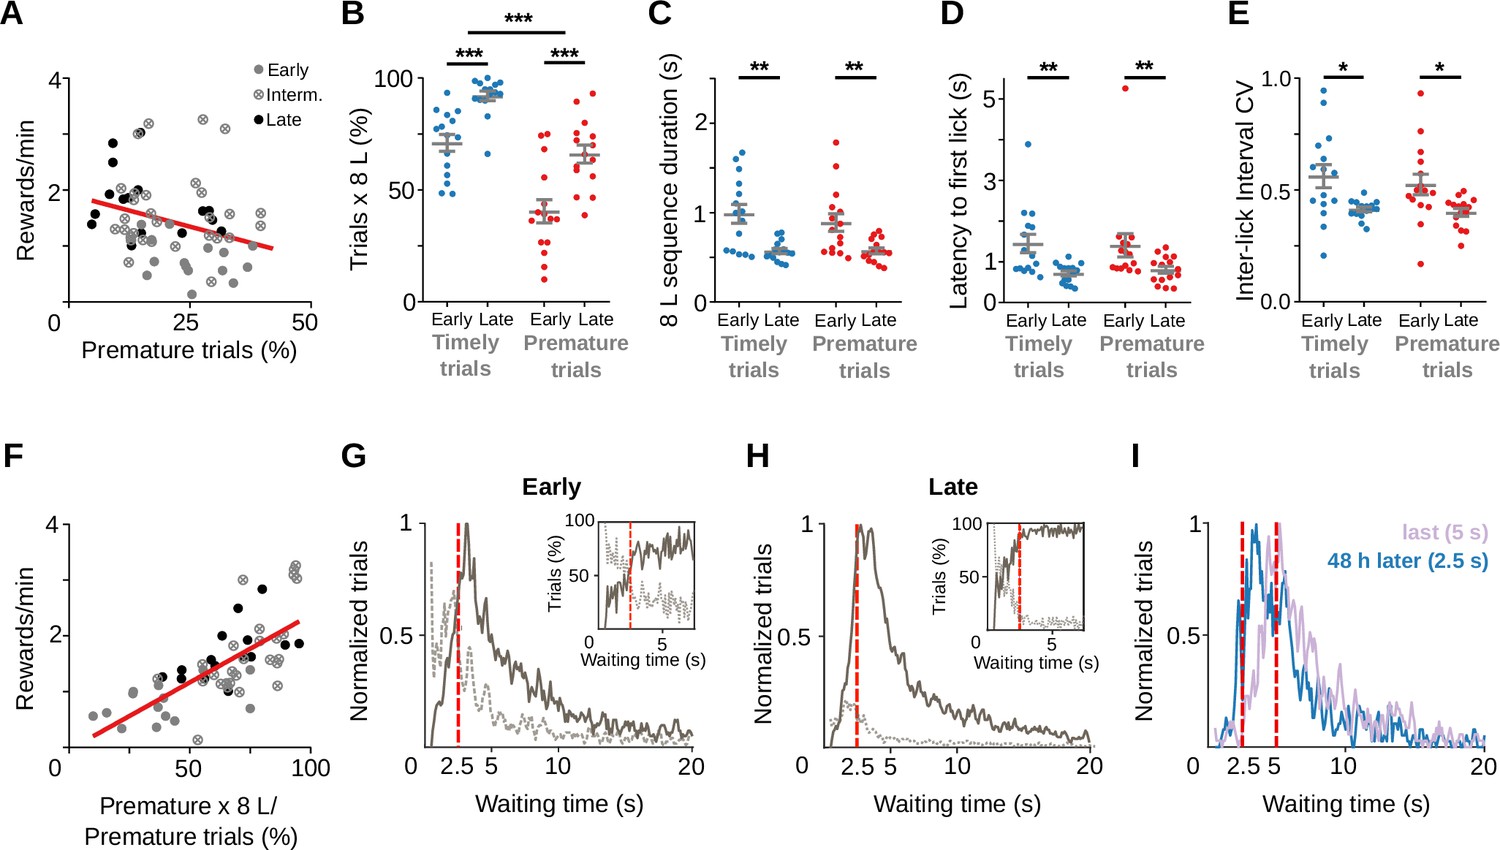
Training does not suppress premature initiations of the learned behavioral response.
Data correspond to five adult animals performing the standard 2.5 s waiting time task. (A) Correlation between all prematurely initiated trials and reward rate (Y = −0.023*X + 1.921, slope significantly different from zero p = 0.018, n=62 sessions from a total of 5 rats). The proportion of trials (B), time to complete the 8-lick sequence (C), latency to first lick (D), and coefficient of variation (E) of the 8-lick sequence inter-lick intervals for prematurely and timely initiated trials, at early and late learning stages. (B–E) Data are expressed as mean ± standard error of the mean (SEM), n = 15 early and 15 late sessions, *** p<0.001 ; ** p<0.01; * p<0.05. (F) Correlation between percentage of prematurely initiated trials followed by an 8-lick sequence and reward rate (Y = 0.024*X − 0.0408, slope significantly different from zero, p = 1.03 × 10⁻⁹, n=62 sessions from a total of 5 rats). (G–I) Normalized frequency distributions of the trial initiation times (waiting time), separated for trials with (gray solid line) and without (dotted line) 8-lick sequences and for early (G) and late (H) training stages (n = 15 sessions). Insets: percentage of the trials with (gray solid line) and without (dotted line) 8-lick sequences for each bin, zoomed around the criterion time. (I) Rats were trained with a 5-s criterion time period (blue) and afterwards were switched to a 2.5-s criterion time for the following two sessions (48 hr after the last 5-s waiting time session, lilac). Red dashed lines: criterion time; bin size: 100 ms; reference for normalization: bin with highest value = 1.
Figure 2—figure supplement 1
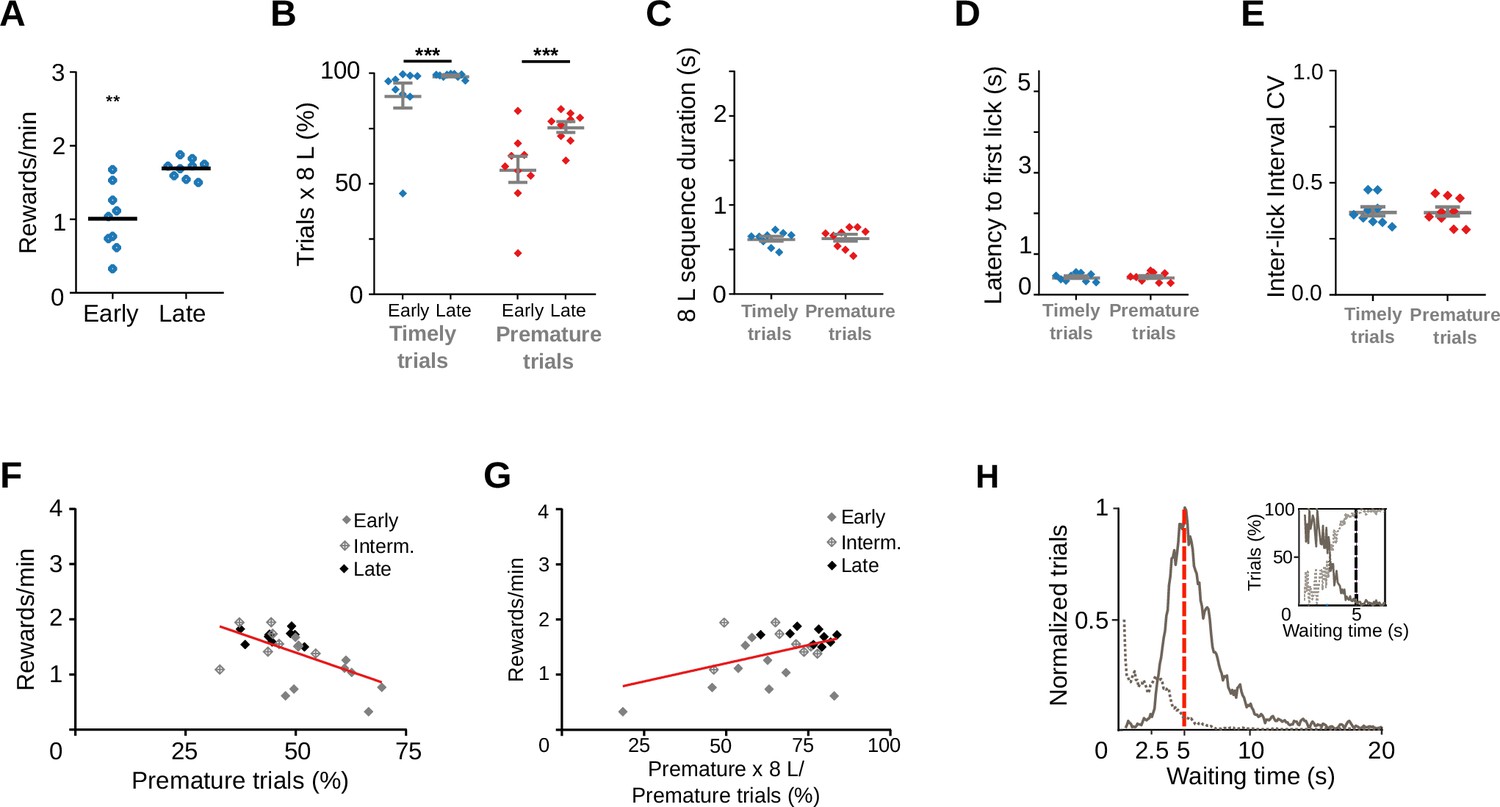
Rats trained with a longer waiting time also emit premature learned responses.
(A) Reward rates for each training stage of rats trained with a 5-s waiting time requirement Wilcoxon matched pairs signed-rank test, **p = 7.80 × 10⁻³, n = 9 pairs. (B) Proportion of trials followed by 8-lick sequences at early and late learning stages. Two-way RM ANOVA: Training stage, F(1, 8) = 5.119, p = 0.053; Type of trial, F(1, 8) = 198.63, ***p = 6.24 × 10⁻⁷; Interaction Training stage × Type of trial, F(1, 8) = 8.52, ***p = 0.019. (C) Time to complete the 8-lick sequence, Paired t-test, t(8) = 0.67. (D) Latency to first lick for prematurely and timely initiated trials, at early and late learning stages, Paired t-test, t(8) = 0.42, p = 0.683. (E) Coefficient of variation of the 8-lick sequence inter-lick intervals for prematurely and timely initiated trials, at early and late learning stages, Paired t-test, t(8) = 0.13, p = 0.896. Data are expressed as mean ± standard error of the mean (SEM), n = 9 sessions. (F) Correlation between prematurely initiated trials and reward rate, Linear regression Y = −0.02755*X + 2.776, slope significantly different from zero: F(1, 24) = 12.05, p = 0.020, R2 = 0.334, n = 26 sessions from 3 rats. (G) Correlation between percentage of prematurely initiated trials followed by an 8-lick sequence and reward rate, Linear regression Y = 0.01321*X + 0.5469, Slope significantly different from zero: F(1, 24) = 6.30, p = 0.019, R2 = 0.208, n = 26 sessions from 3 rats. (H) Normalized frequency distributions of the trial initiation times (waiting time), separated for trials with (gray) and without (dotted line) 8-lick sequences, in the late stages of training. Inset: percentage of the trials with (gray) and without (dotted line) 8-lick sequences for each bin, zoomed around the criterion time n = 9 sessions.
Figure 2—figure supplement 2
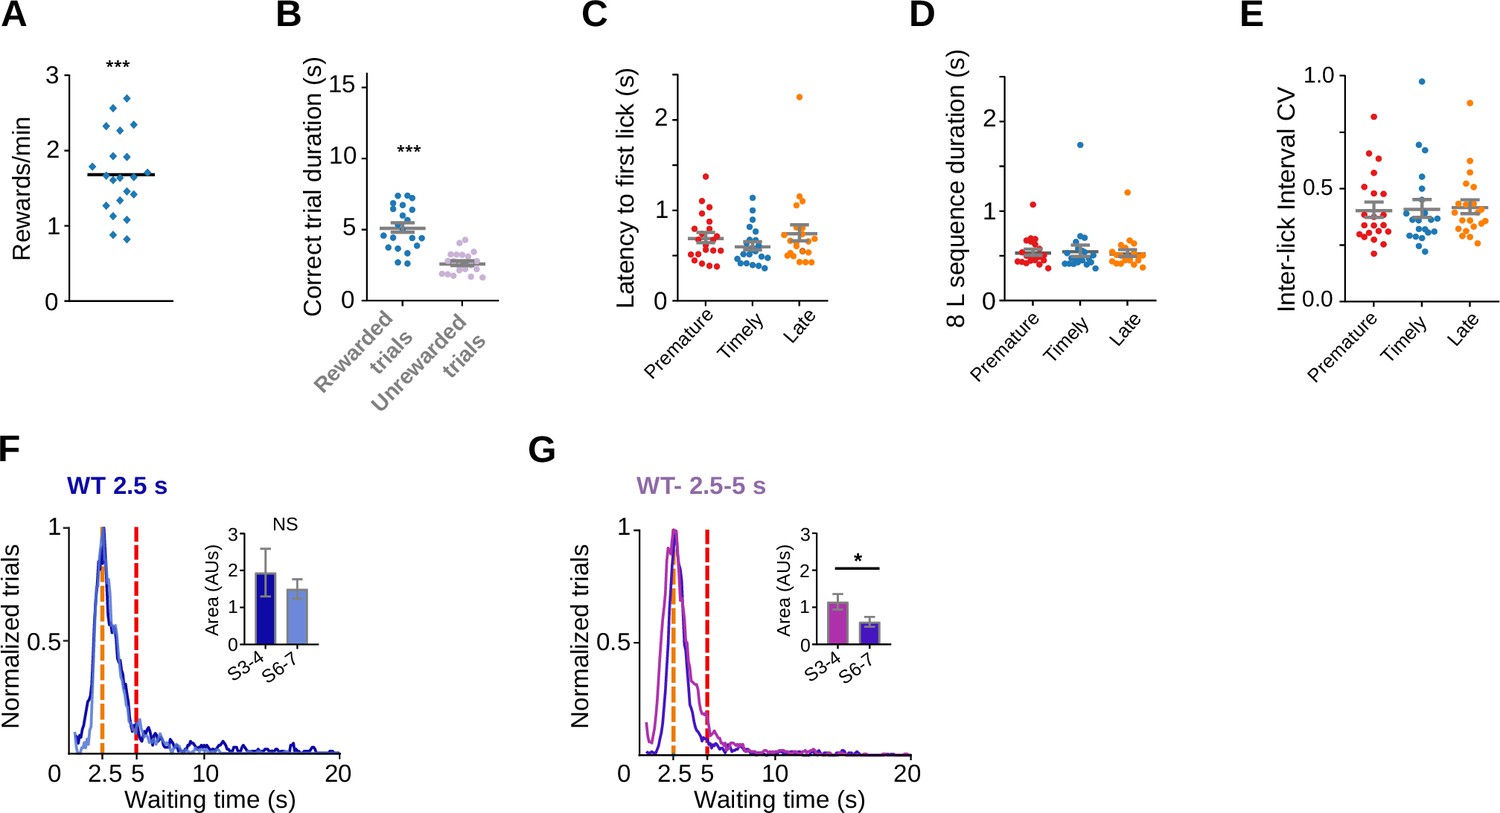
Rats also learn a task with lower and upper limits in the waiting time.
Rats were trained to enter the nose-poke within a minimum waiting time of 2.5 s and a maximum waiting time of 5. (A) Reward rates for the 2.5–5 s waiting time task, ***p = 9.53 × 10⁻⁷, one sample Wilcoxon signed-rank test. (B) Trial duration for correct trials, Paired t-test ***t(33) = 14.41, p = 8.46 × 10⁻¹⁶. (C) Latency to first lick for prematurely, timely and late initiated trials, one-way RM ANOVA NS, F(1.21, 24.21) = 3.36, p = 0.072. (D) Time to complete the 8-lick sequence for the different types of trials, one-way RM ANOVA F(1.29, 25.87) = 0.45, p = 0.559. (E) Variation coefficient of the 8-lick sequence inter-lick intervals for the different types of trials, one-way RM ANOVA NS, p = 0.6407. (F) Normalized frequency distributions of the trial initiation times (waiting time), separated for trials with 8-lick sequences in the third (dark blue) and the seventh (light blue) sessions of training with a 2.5-s waiting time. Inset: area below the curve calculated between 2.5 and 5 s for sessions 3 and 4 versus sessions 6 and 7, Mann–Whitney test, NS, p = 0.8857. (G) Normalized frequency distributions of the trial initiation times (waiting time), separated for trials with 8-lick sequences in the third (lilac) and the seventh (purple) sessions of training with a 2.5- to 5-s waiting time. Inset: area below the curve calculated between 2.5 and 5 s for sessions 3 and 4 versus sessions 6 and 7, Mann–Whitney test *p = 0.024.
Figure 3 with 1 supplement
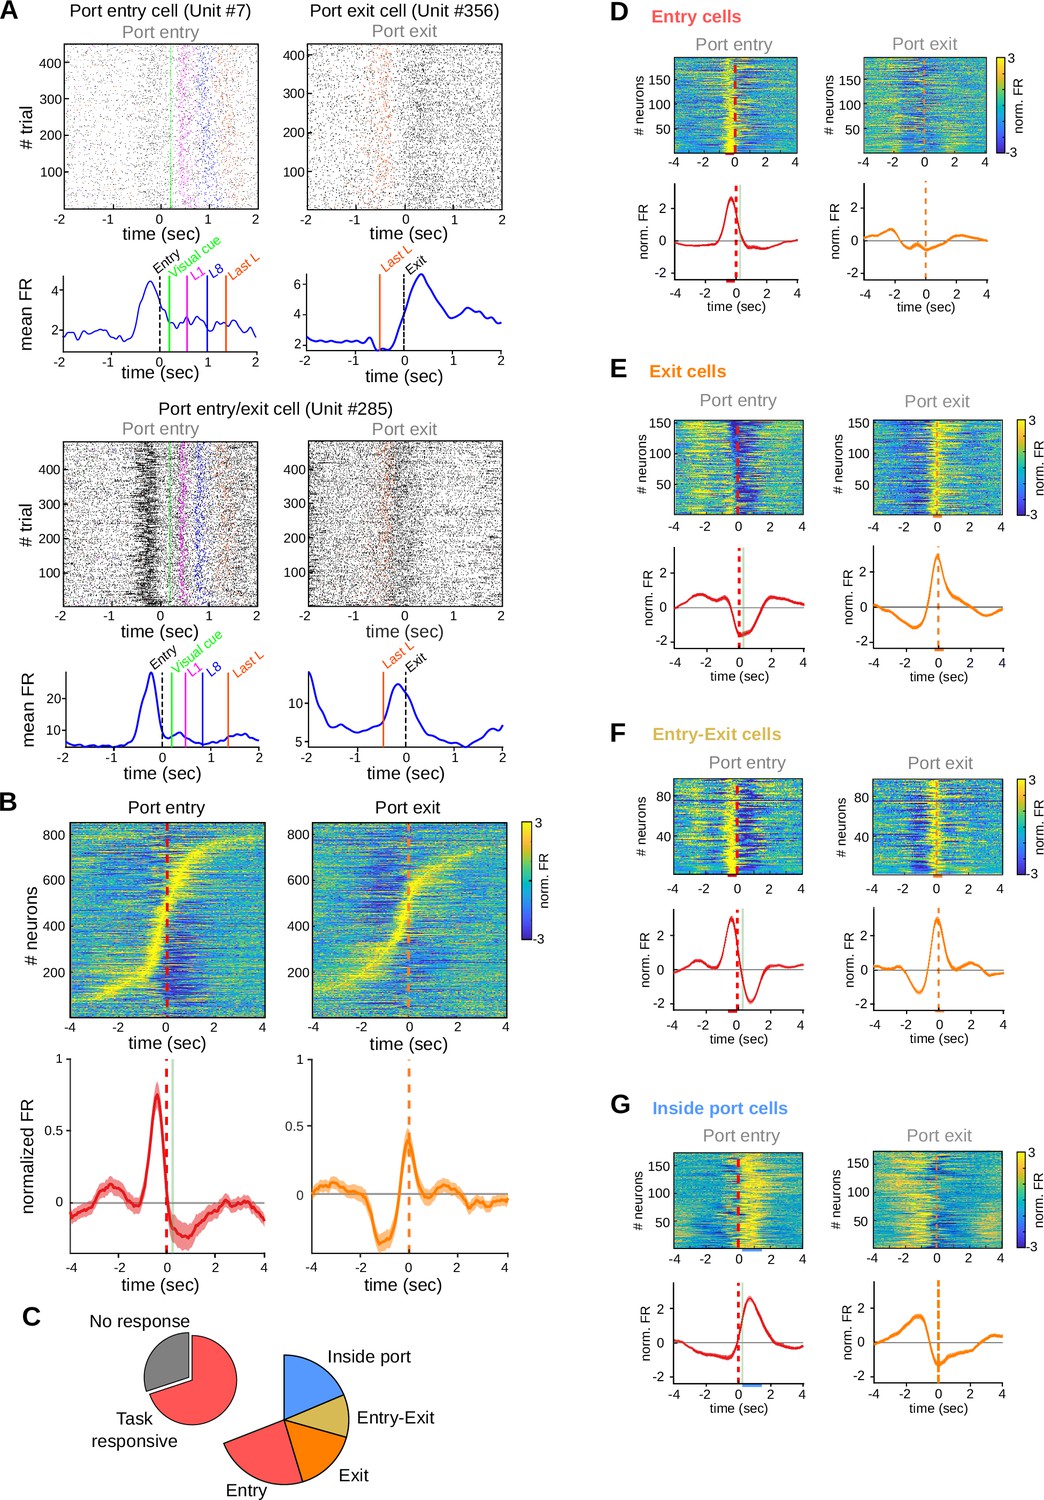
Striatal activity marks transitions between behavioral states of the task.
Data come from five adult animals performing the standard 2.5-s waiting time task and two adult animals performing the 2.5–5 s cutoff version of the task. (A) Representative raster plots (above) and peri-event time histogram (PETH) (below) of striatal units showing firing rate modulations related to port entry and/or port exit. L1: first lick, L8: eighth lick, Last L: last lick. (B) Individual PETHs of striatal neurons during correct trials, aligned to port entry (left) or port exit (right). Below: average PETH (solid line) and standard error of the mean (SEM) (shaded area) for all recorded neurons. Red dashed line: port entry, orange dashed line: port exit, vertical green line: led on. (C) Proportion of neurons showing task-related firing rate modulations. PETH for all individual neurons and population average PETH aligned to port entry (left panels) and to port exit (right panels) for (D) striatal neurons showing only port entry-related activity, (E) striatal neurons showing only port exit-related activity, (F) striatal neurons showing activity modulations at both port entry and port exit, and (G) striatal neurons showing higher activity while animals are inside the port. From (D–G), data are the mean (solid lines) and SEM (shaded area). Colored bars over the x-axis show the interval used to detect firing rate modulations (red: entry, orange: exit, light-blue: inside port).
Figure 3—figure supplement 1
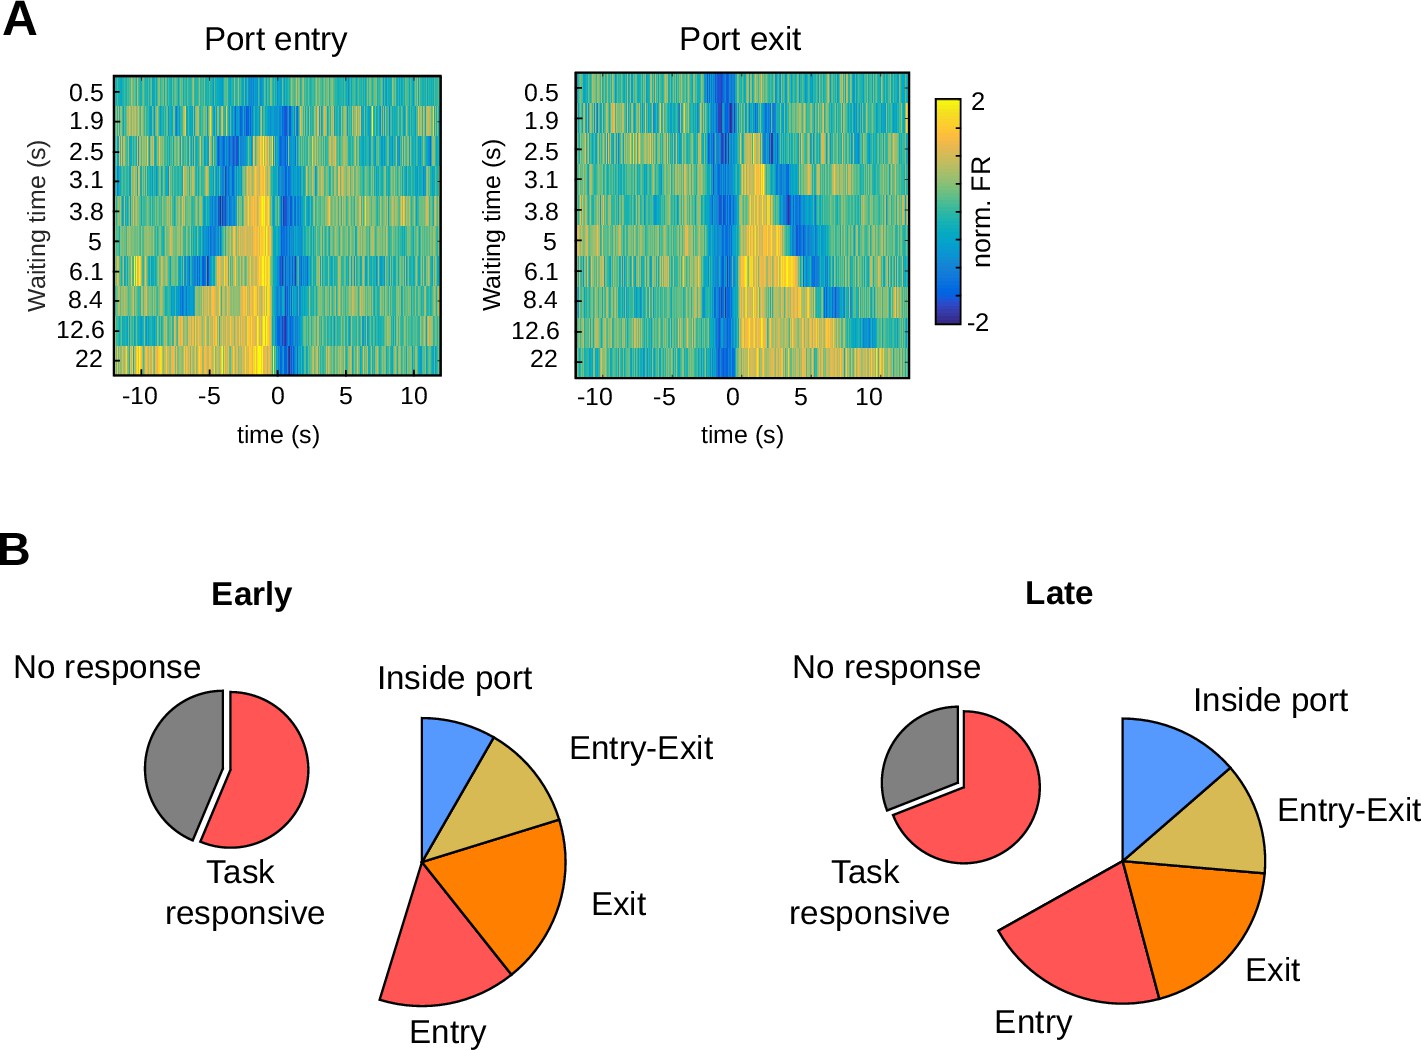
Characteristics of the neurons registered in the 2.5-s waiting time task.
(A) Average firing rate of striatal neurons showing tonic activity during the waiting period, aligned to port entry or port exit, for different waiting times. The color code for the normalized activity (in units of standard deviation) is shown on the left. (B) Proportion of neurons with different responses in both training stages from animals trained with a 2.5-s criterion time.
Figure 4 with 1 supplement
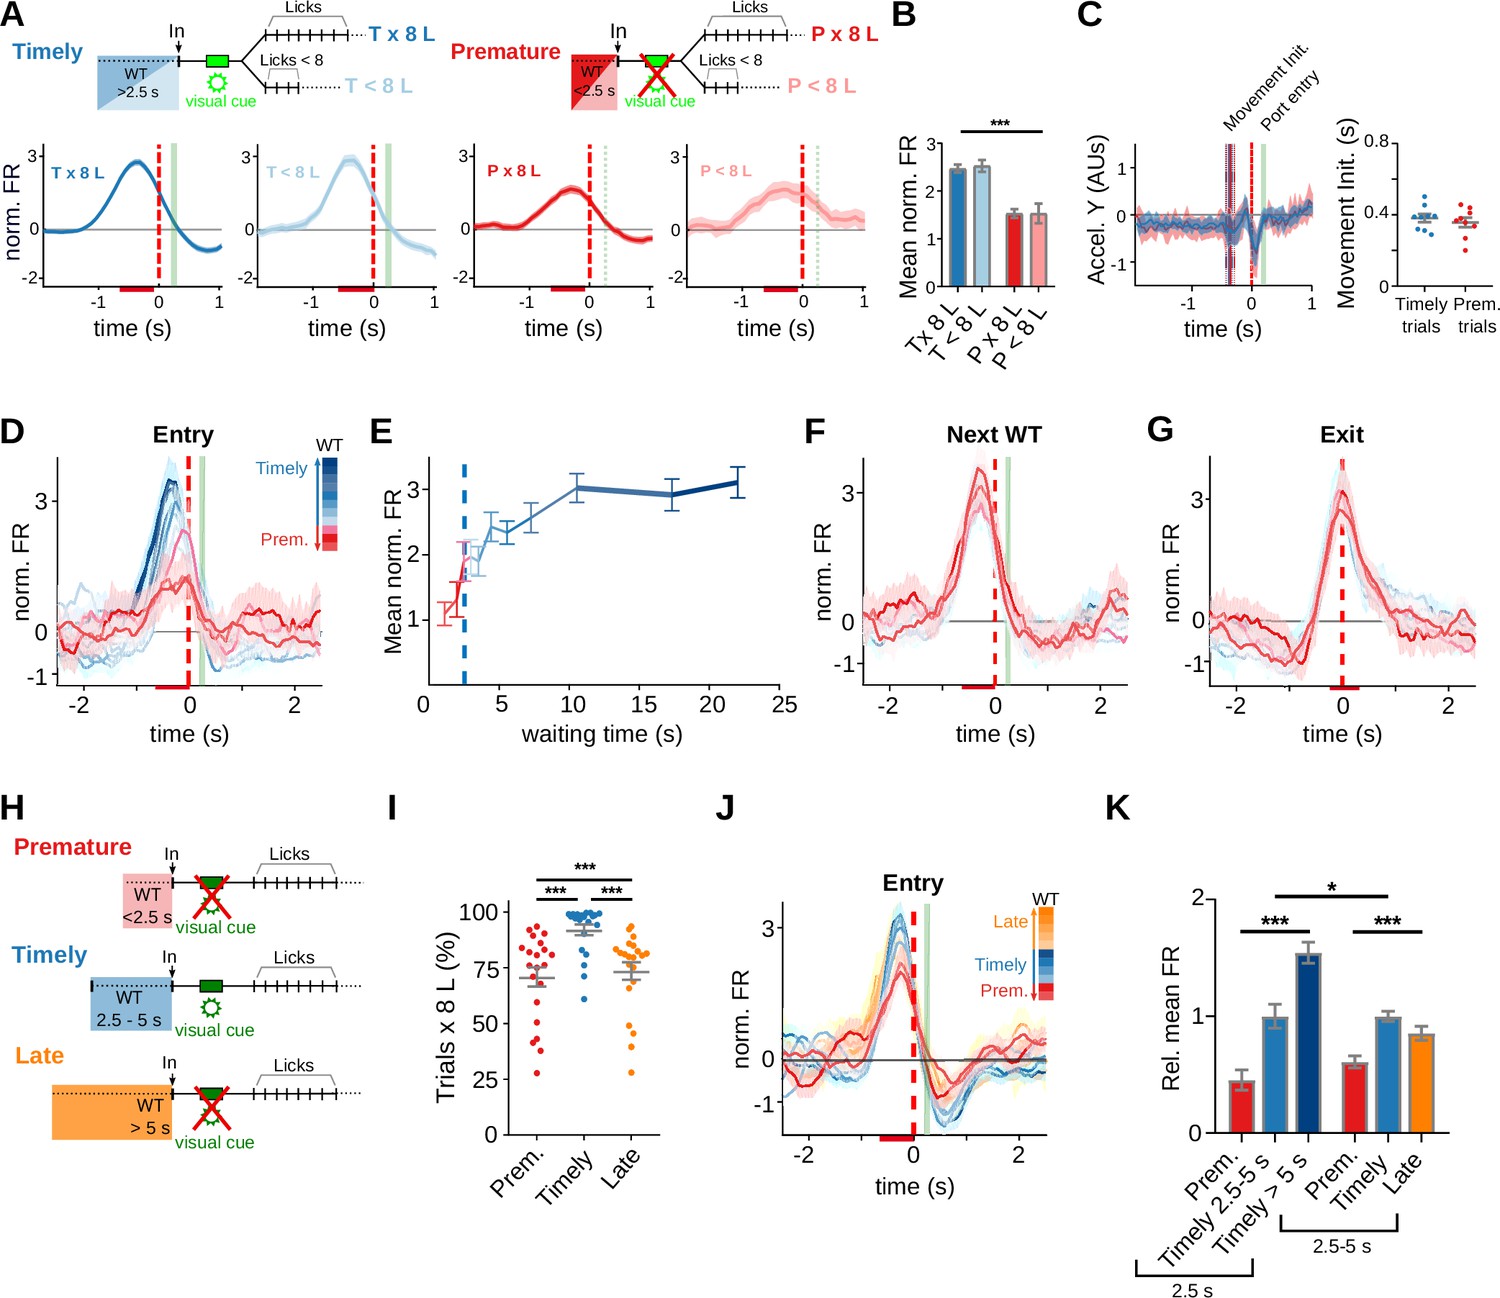
Prematurely initiated trials are preceded by low striatal anticipatory activity.
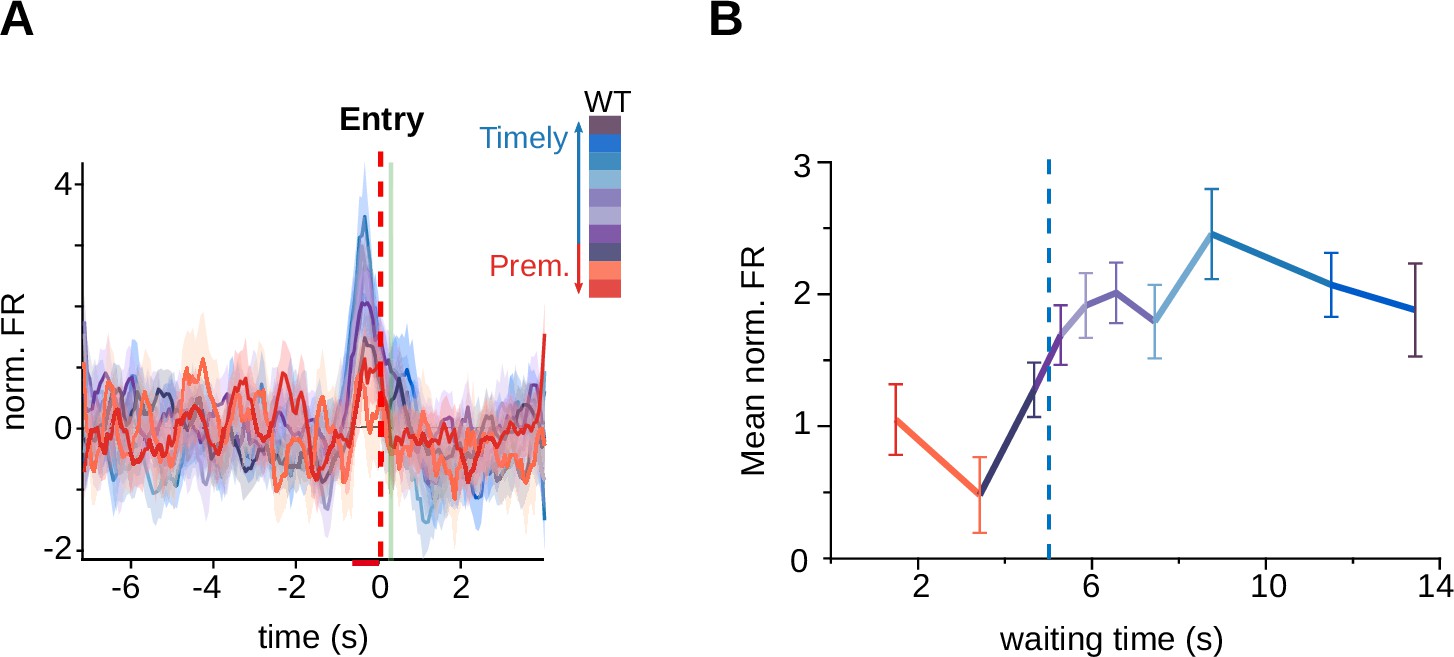
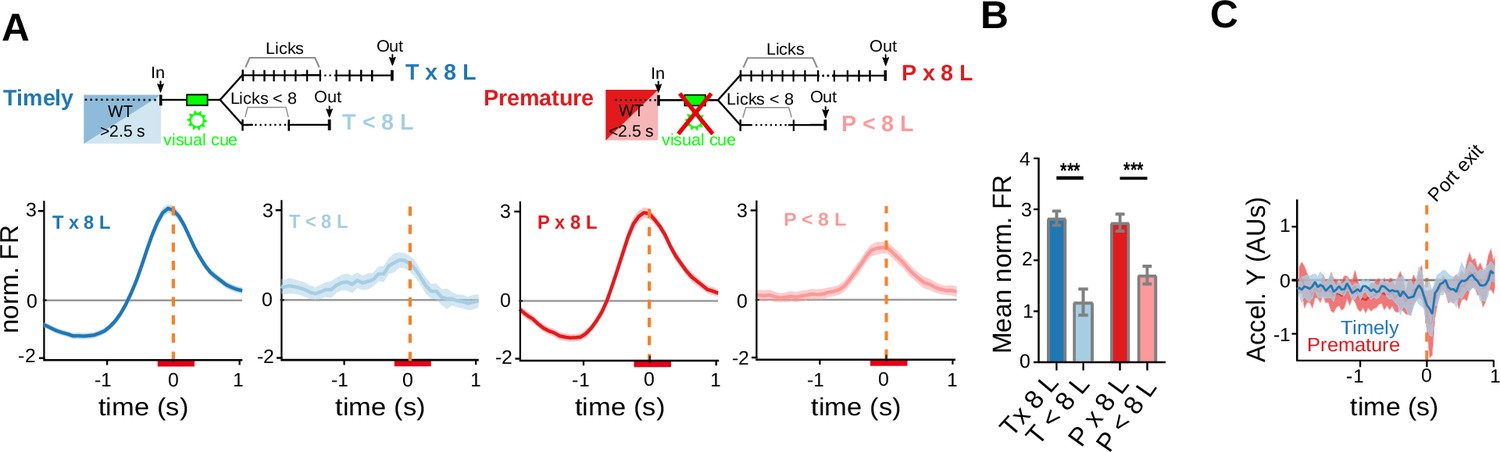
Data come from five adult animals performing the standard 2.5-s waiting time task except for (H–J), where they correspond to three rats trained in the 2.5- to 5-s cutoff task. (A) Average peri-event time histogram (PETH) of entry-related neurons, during premature and timely trials, for trials with or without an 8-lick sequence (diagram on top shows the types of trials analyzed). (B) Mean striatal activity during −640 to −80 ms before port entry for all PETH shown in (A), ***p<0.001. (C) Accelerometer recordings of head movements around port entry time for premature and timely trials. On the left, data are the mean (solid lines) and 95% CI (shaded area) of the accelerometer y-axis. Vertical lines represent the mean (solid) and 95% CI (dashed) of movement initiation for timely and premature trials. On the right, time from port entry to movement initiation for timely and premature trials. Data were obtained from a total of nine training sessions of two animals. (D) Average PETH of striatal neurons showing entry-related activity sorted by trial waiting time duration. The color code for the intervals is shown on the right. (E) Mean normalized firing rate for each of the waiting time segments. The 2.5-s criterion time is shown with a blue dashed line. (F) Average PETH of the same striatal neurons segmented according to next trial waiting time. (G) Average PETH of striatal neurons showing activation at port exit segmented as in (D). (H) Schematic representation of the different trial types in a modified version of the task incorporating a 5-s cutoff time. Timely trials: waiting time between 2.5 and 5 s, Premature trials: waiting time <2.5 s, Late trials: waiting time >5 s. (I) Proportion of trials followed by 8-lick sequences for each type of trial n = 21 late sessions, ***p<0.001. (J) Average PETH of striatal neurons showing activity preceding port entry according to the waiting time duration. The color code for the intervals is shown on the right. (K) Mean normalized firing rate for each of the waiting time groups for the 2.5-s (left) and 2.5- to 5-s (right) waiting times tasks, relative to the mean firing rate of timely trials ***p<0.001; *p<0.05.
Figure 4—figure supplement 1
Anticipatory activity in the 5-s waiting time task.
(A) Average firing rates of striatal neurons (of rats trained with a 5-s criterion time) showing activity preceding the initiation of the trials according to the waiting time duration. Color code for the intervals shown on the right. (B) Mean of the normalized firing rate for each of the waiting time groups, calculated between −640 and −80 ms before the entrance versus waiting time, criterion time is shown with a blue hatched-line.
Figure 5 with 1 supplement
Reward-responsive neurons discriminate prematurely from timely initiated trials.
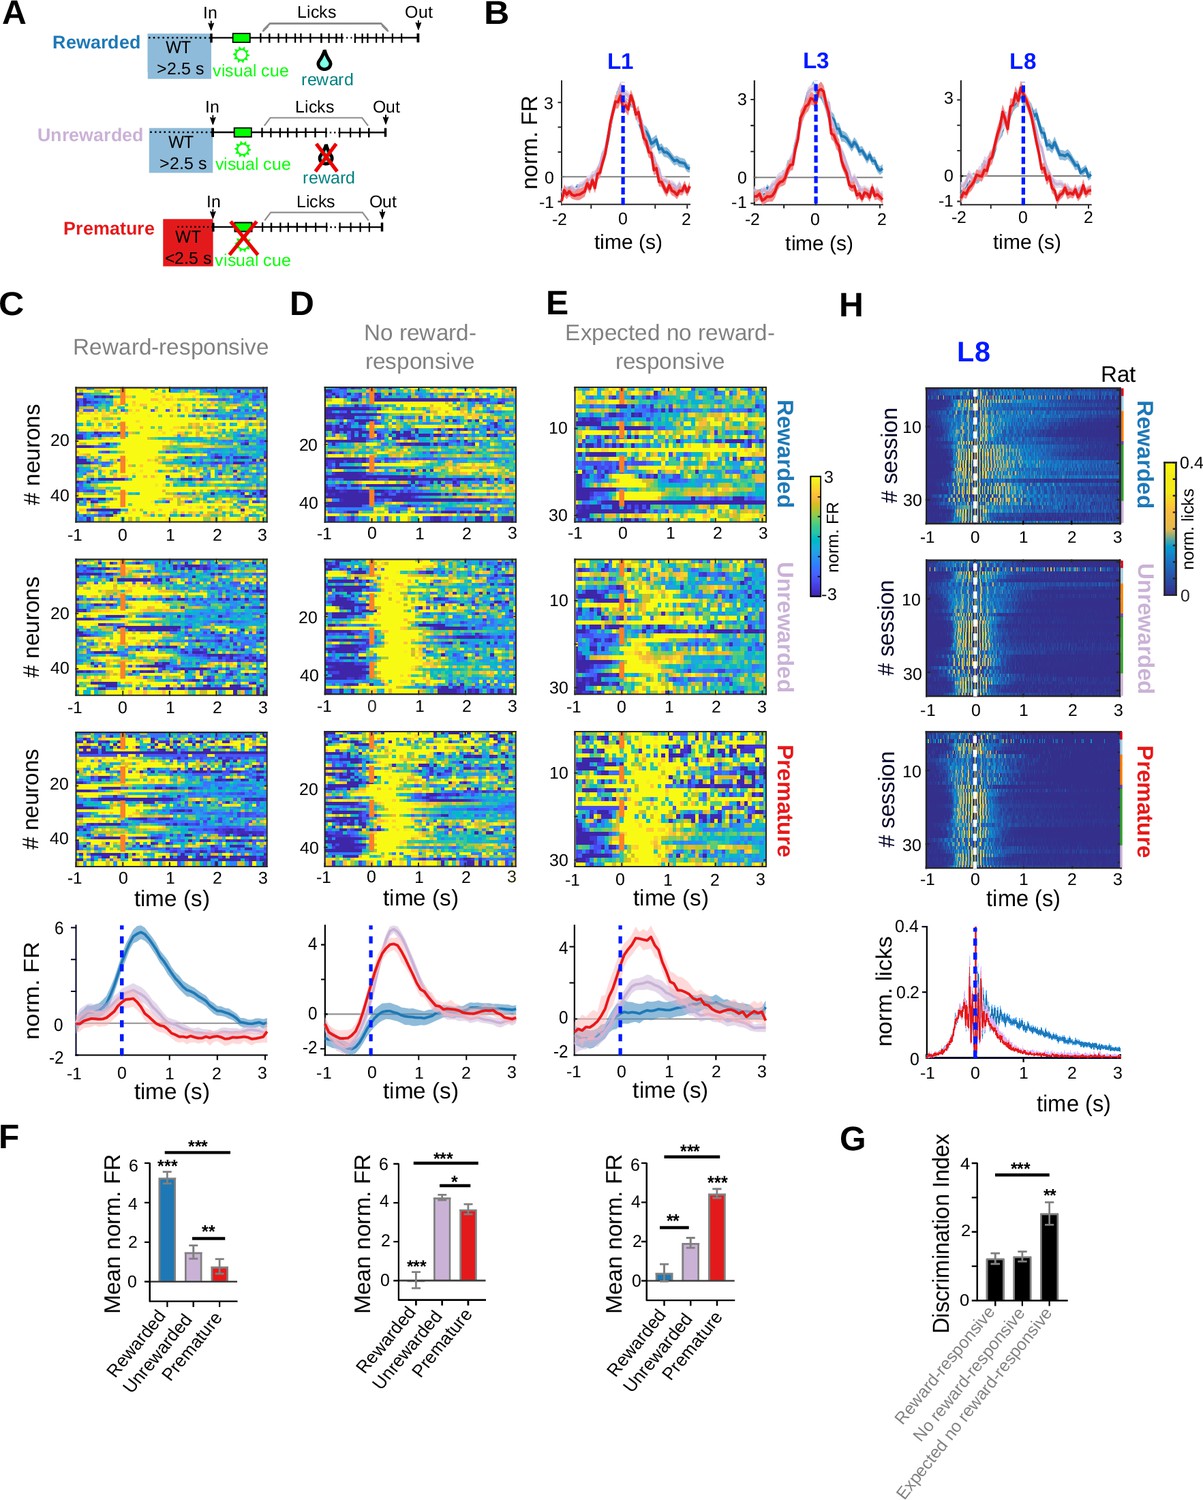
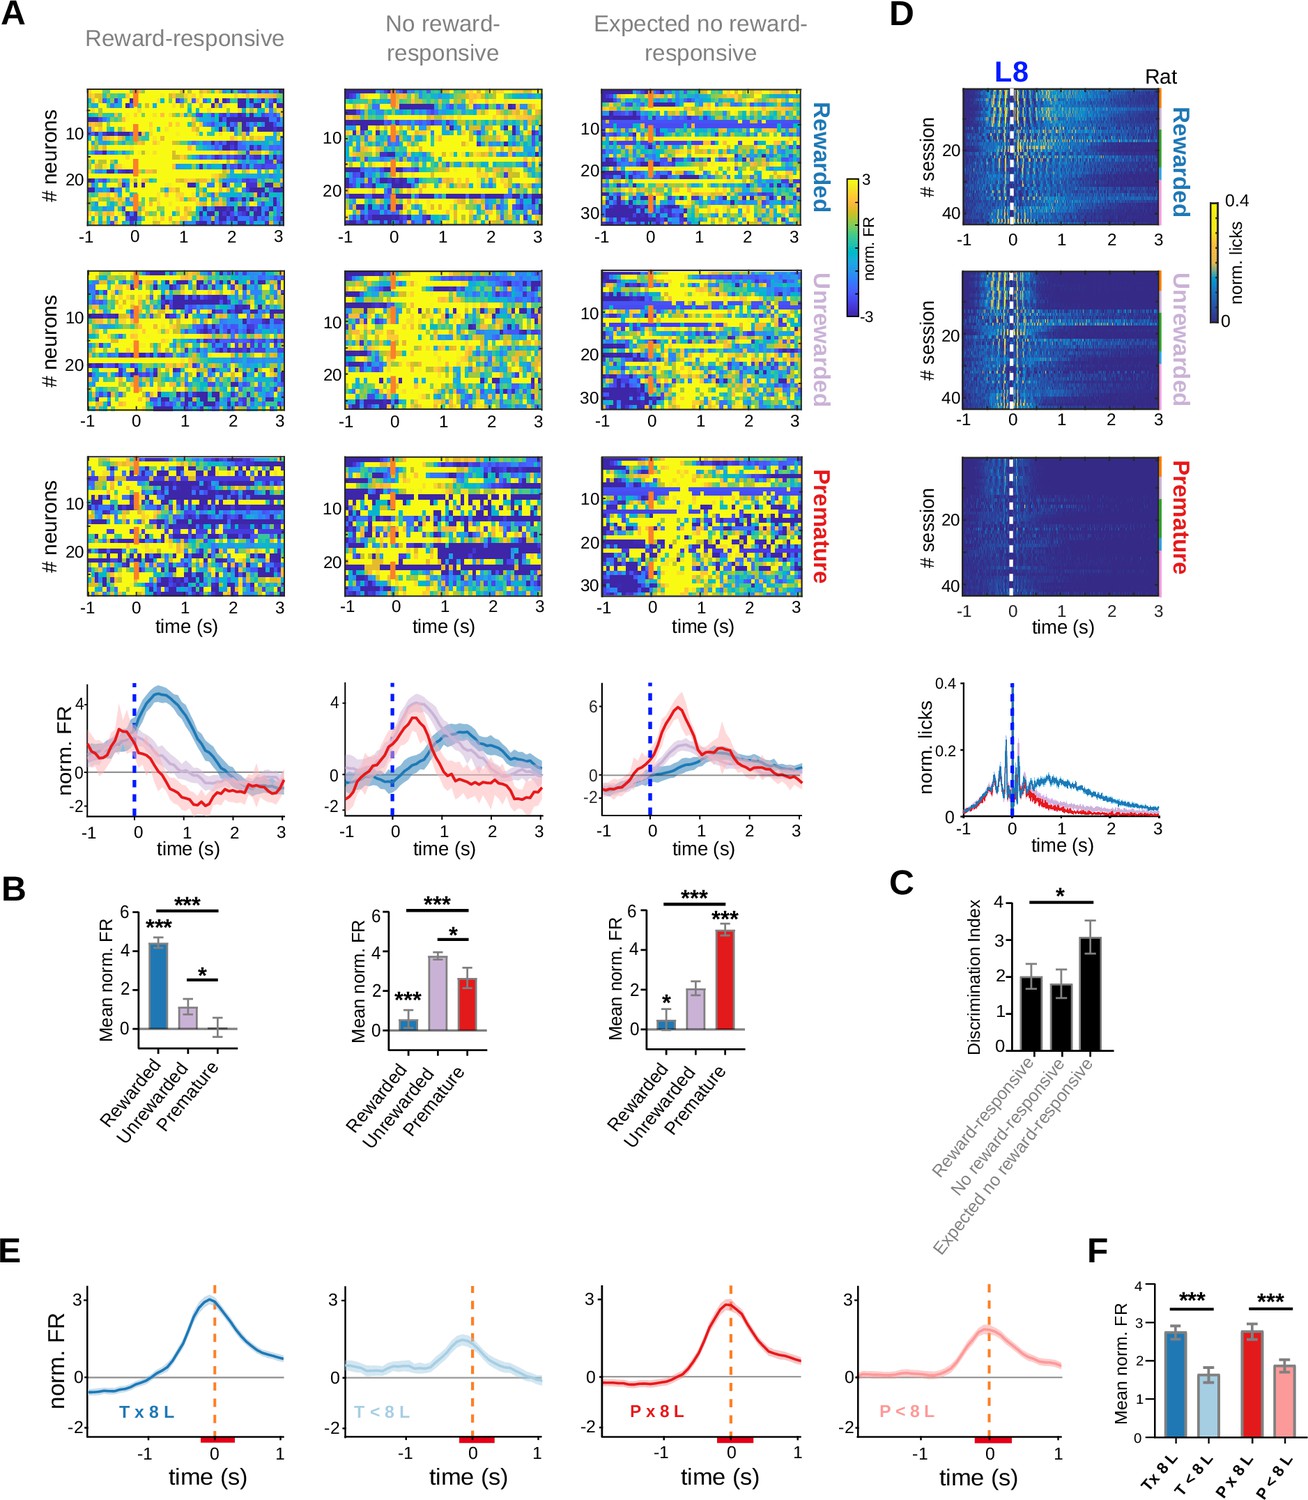
Data come from five adult animals performing the standard 2.5-s waiting time task and two adult animals performing the 2.5- to 5-s cutoff version of the task. (A) Schematic representation of the different types of trials analyzed. (B) Mean (solid lines) and standard error of the mean (SEM) of the average peri-event time histogram (PETH) of striatal units showing firing rate modulations related to licking activity (centered to the first, third, and eighth lick). PETH for all individual neurons and population average PETH of striatal units, aligned to the eighth lick (time 0 s), showing positive firing rate modulations during reward delivery (reward-responsive neurons) (C), reward omission during timely trials (no reward-responsive neurons) (D), or expected reward omission during 8-lick premature trials (expected no reward-responsive neurons) (E). (F) Mean normalized firing rate for the different trial conditions (timely rewarded, timely unrewarded, premature) for the three types of neurons depicted in (C–E). From top to bottom: reward-responsive neurons, no-reward-responsive neurons, and expected no reward-responsive neurons, ***p< 0.001; **p<0.001, *p<0.05. (G) Discrimination index (DI = ABS normalized firing rate in timely unrewarded trials − normalized firing rate in premature trials) for each of the groups of neurons shown in (C–E), ***p< 0.001; **p<0.001. (H) PETH of the licking activity for the three trial conditions, centered at the eighth lick, with its corresponding average at the bottom.
Figure 5—figure supplement 1
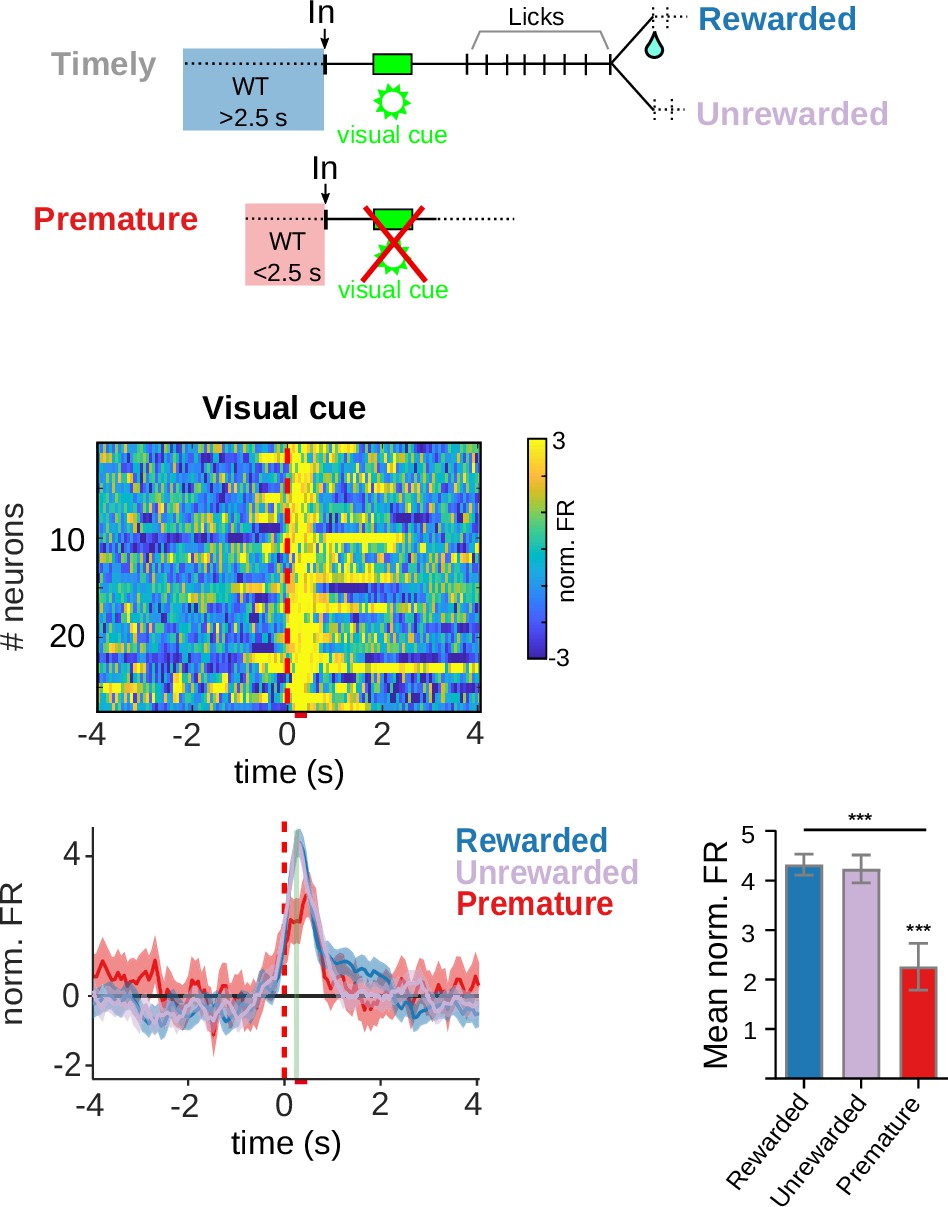
Neuronal activity at the moment of the visual cue.
Population peri-event time histogram (PETH) and average firing rates of striatal units showing positive firing rate modulations related with the visual cue. The color code for the mean normalized FR is shown on the right. The bar graphs show the statistical comparisons between trial conditions. One-way RM ANOVA, F(1.750, 45.49) = 17.80, ***p = 1.17 × 10⁻⁴; Tukey’s multiple comparisons test q(26) = 6.64, ***p = 2.15 × 10⁻⁴; Premature versus Rewarded and, q(26) = 6.79, p = 1.62 × 10⁻⁴ Premature versus Unrewarded.
Figure 6
Striatal activity at port exit reports the performance of the action sequence.
(A, B) Data come from five adult animals performing the standard 2.5-s waiting time task. (A) Average peri-event time histogram (PETH) of neurons responding to port exit, during premature and timely trials, for 8-lick and <8-lick sequence trials (diagram on top shows the types of trials analyzed). (B) Average striatal activity corresponding to the PETH shown in (A). Colored bars over the x-axis show the interval used to detect firing rate modulations, ***p<0.001. (C) Mean (solid lines) and 95% CI (shaded area) of head acceleration around port exit for premature and timely trials. Data were obtained from a total of nine training sessions of two animals.
Figure 7 with 4 supplements
Adolescent rats are more impulsive and show a steeper wait time modulation of striatal activity.
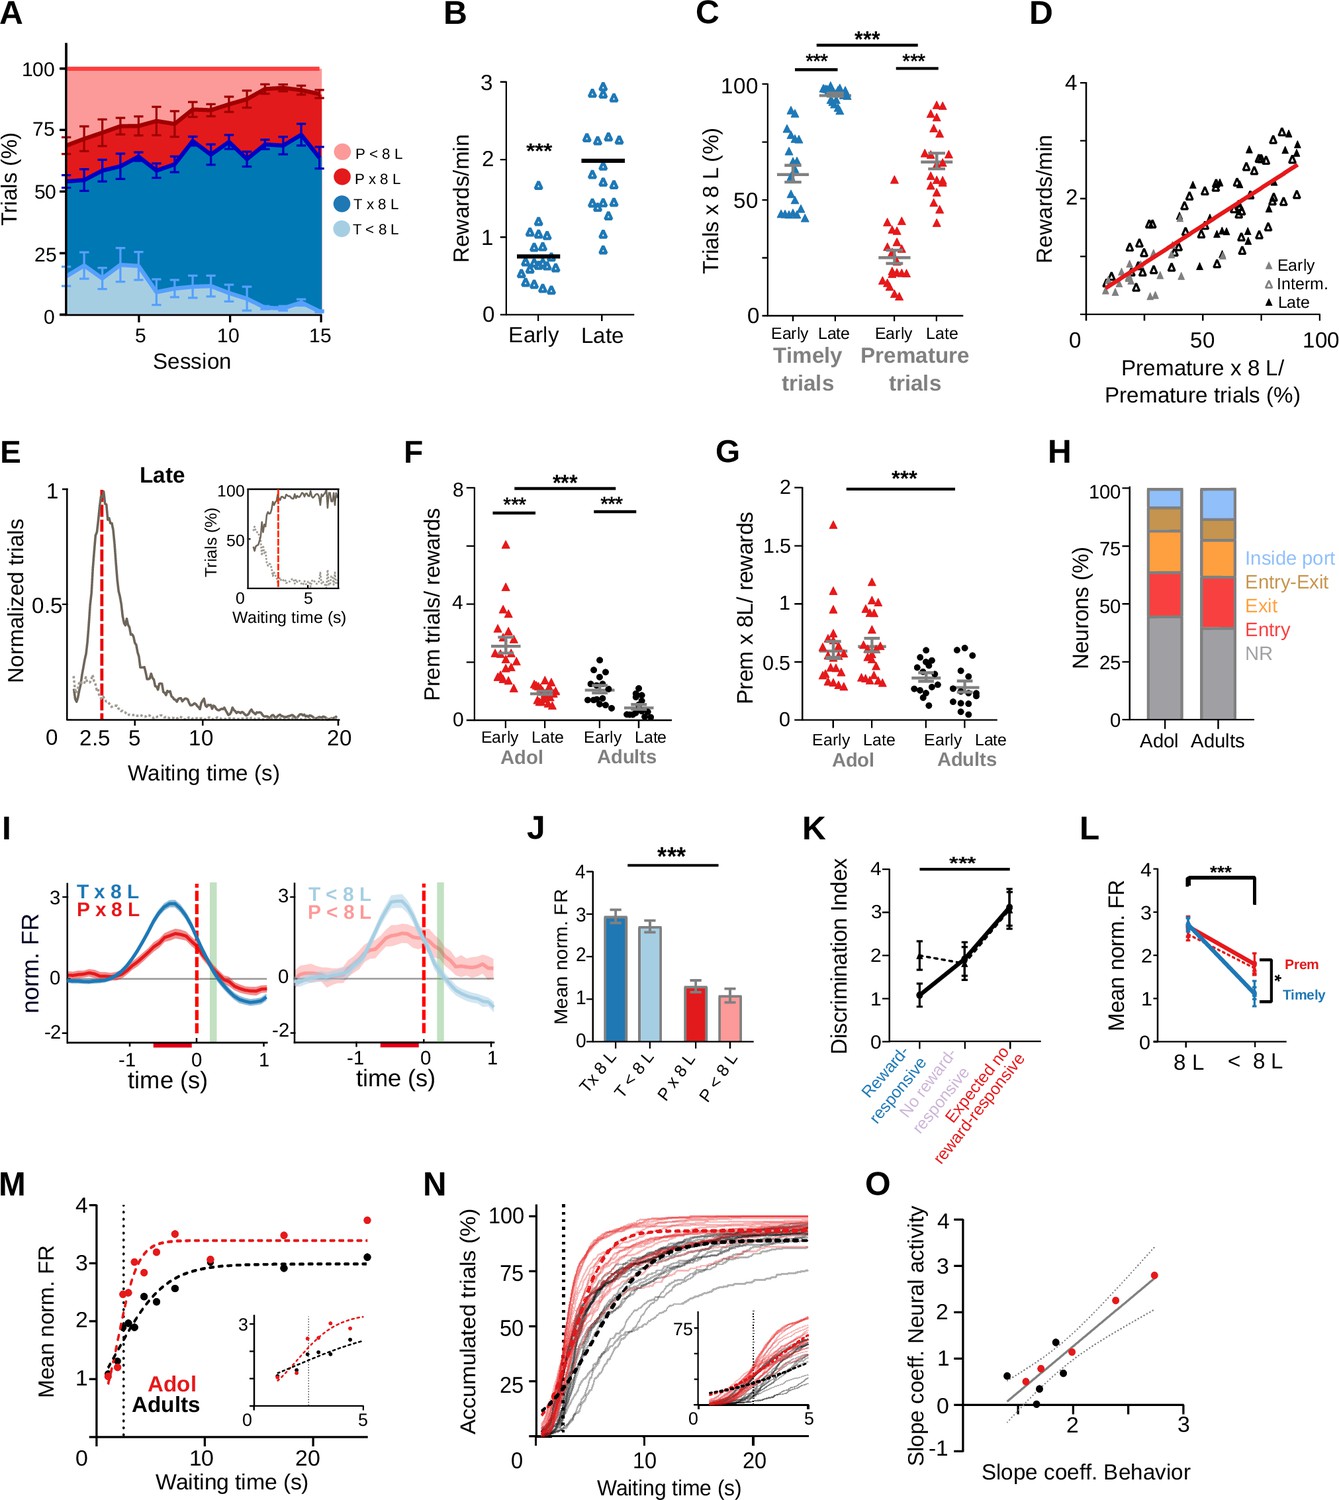
Data come from six adolescent and five adult rats performing the standard 2.5-s waiting time task. (A–E) Behavior of adolescent rats in the 2.5-s waiting time task. (A) Percentage of the different trial types per session. (B) Reward rates for each training stage. (C) Proportion of trials followed by 8-lick sequences at early and late learning stages.(B, C) Data are expressed as mean ± standard error of the mean (SEM), n = 20 early and 20 late sessions, *** p<0.001; *p<0.05. (D) Correlation between percentage of prematurely initiated trials followed by an 8-lick sequence and reward rate (Y = 0.026*X + 0.112, Slope significantly different from zero, p = 5.88 × 10⁻²², n=86 sessions from 6 rats). (E) Normalized frequency distributions of trial initiation times (waiting time), separated for trials with (dark gray) and without (light gray dotted line) 8-lick sequences, in late stages of training (n = 20 sessions). Inset: Percentage of trials with and without 8-lick sequences for each bin, zoomed around the criterion time. (F) Ratio between the number of premature trials and obtained rewards for adolescent and adult rats, ***p<0.001. (G) Proportion of premature trials with 8-lick sequence per obtained rewards for adolescent and adult rats, ***p<0.001. (H) Percentage of neurons showing task-related firing rate modulations in adolescent rats. (I) Average peri-event time histogram (PETH) of entry-related neurons, during premature and timely trials, for trials with (x8L) or without an 8-lick sequence (<8L), in adolescent rats. (J) Average striatal activity corresponding to the PETH shown in (I), ***p<0.001. (K) Outcome-related neuronal activity: Discrimination index between 8-lick timely unrewarded and premature trials for different types of outcome responsive neurons from adolescent and adult rats. (L) Port exit-related activity: mean normalized firing rate at the time of port exit for trials with or without 8-lick sequence for both ages. (K, L) Dashed lines correspond to adolescents and full lines to adults,***p<0.001; *p<0.05. (M) Waiting time modulation of anticipatory activity: mean normalized firing rate for each of the waiting time segments for each age group. Dashed lines show the logistic function fitted to the binned neuronal activity data. Inset: Detail around 2.5-s waiting time. (N) Cumulative frequency distribution of 8-lick trial initiation times for adolescent and adult rats. Each light color line shows an individual session. Dashed lines show the logistic function fitted to the behavioral data. Inset: Detail around 2.5-s waiting time. (O) Correlation between p2 slope coefficients of the logistic functions fitting the behavioral and neurophysiological data of each rat.
Figure 7—figure supplement 1
Adolescent rats make more premature trials.
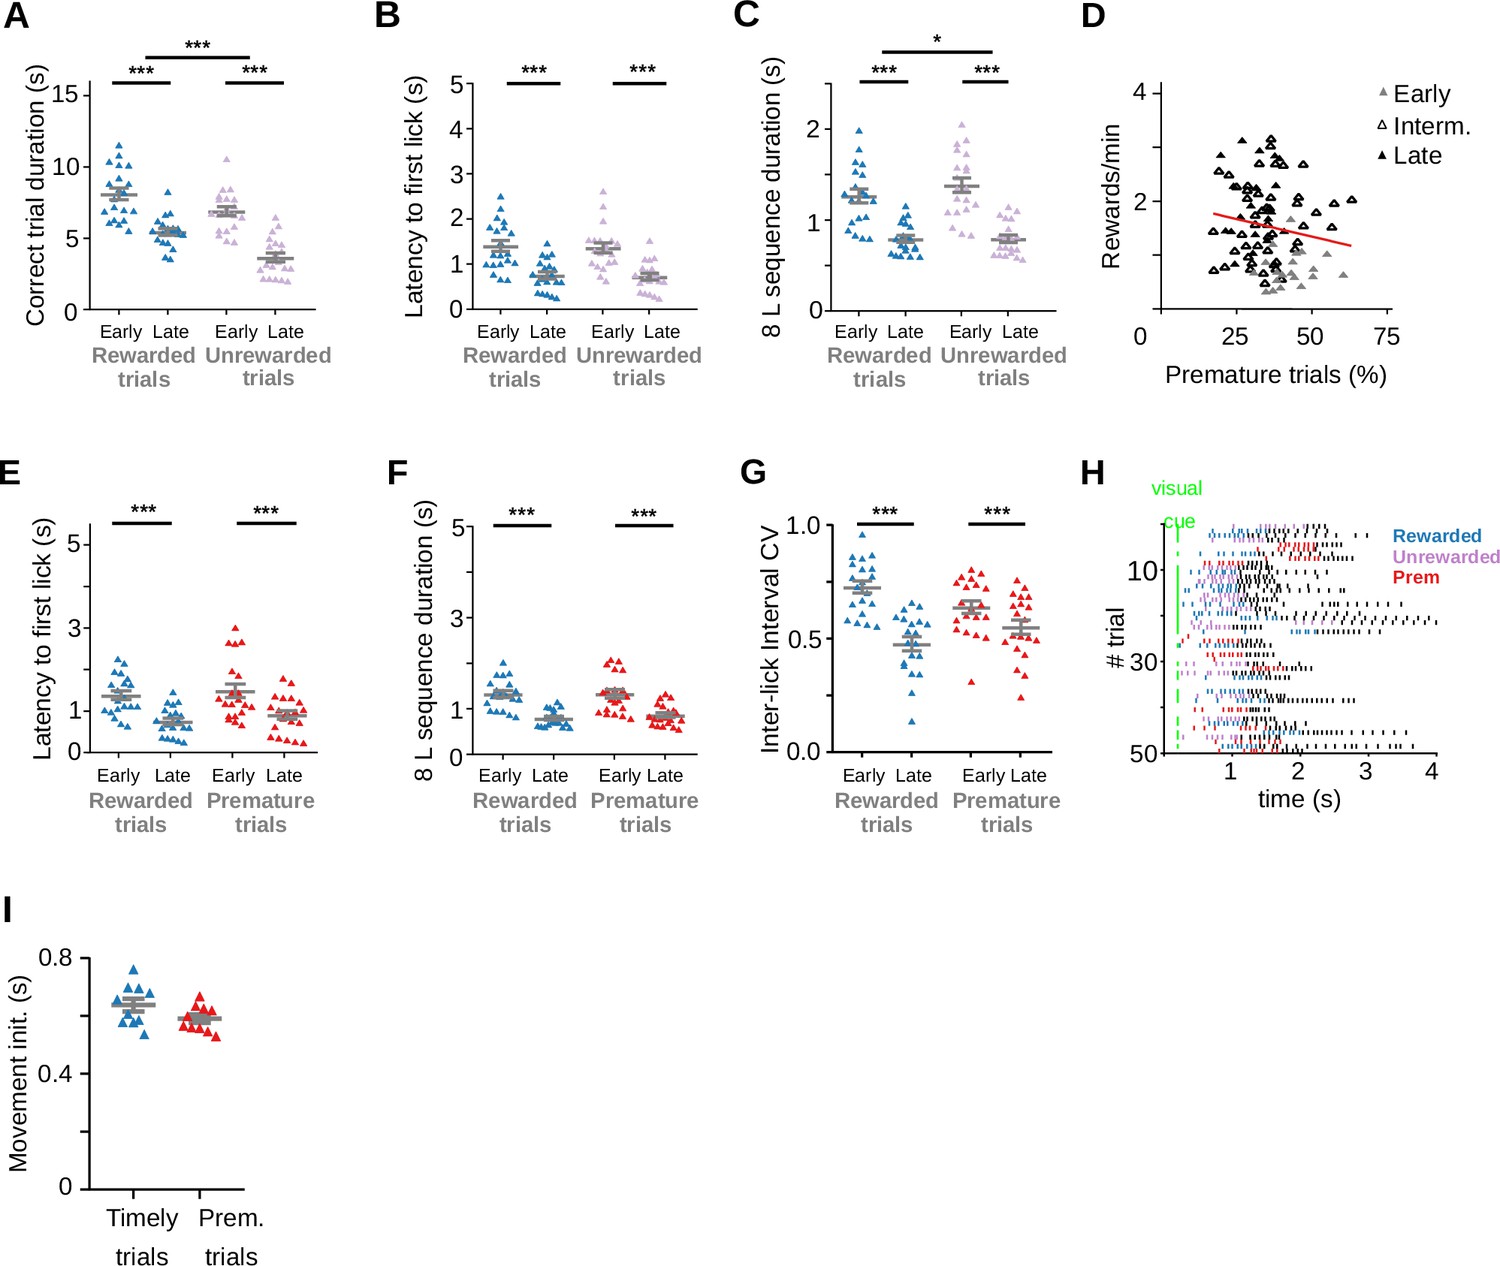
(A) Trial duration for correct trials at each training stage, Two-way RM ANOVA, Training stage, F(1, 19) = 91.81, ***p = 1.04 × 10⁻⁸; Type of trial, F(1, 19) = 41.67, ***p = 3.46 × 10⁻⁶; Interaction Training stage × Type of trial, F(1, 19) = 2.63, p = 0.121. (B) Latency to the first lick during correct trials, Two-way RM ANOVA, Training stage, F(1, 19) = 26.74, ***p = 5.43 × 10⁻⁵, Type of trial, F(1, 19) = 0.68, p = 0.418, Interaction Training stage × Type of trial, F(1, 19) = 0.01, p = 0.905. (C) Time to complete the 8-lick sequence, Two-way RM ANOVA, Training stage, F(1, 19) = 0.68, ***p = 2.12 × 10⁻⁷; Type of trial, F(1, 19)=6.01; *p=0.024, Interaction Training stage × Type of trial p = 7.65 × 10⁻³. (D) Correlation between prematurely initiated trials and reward rate, Linear regression Y = −0.01307*X + 1.996, Slope significantly different from zero: p = 0.131, R2 = 0.026, F(1,26) = 2.33, n=86 sessions from 6 rats. (E) Latency to first lick for prematurely and timely initiated trials, at early and late learning stages, Two-way RM ANOVA, Training stage, F(1, 19) = 16.17, ***p = 7.30 × 10⁻⁴; Type of trial, F(1, 19) = 3.81, p = 0.066.; Interaction Training stage × Type of trial, F(1, 19) = 0.11, p = 0.745. (F) Time to complete the 8-lick sequence, Two-way RM ANOVA, Training stage F(1, 19) = 43.68, ***p = 2.52 × 10⁻⁶, Type of trial, F(1, 19) = 1.53, p = 0.231; Interaction Training stage × Type of trial, F(1, 19) = 1.54, p = 0.230. (G) Coefficient of variation of the 8-lick sequence inter-lick intervals for prematurely and timely initiated trials, at early and late learning stages, Two-way RM ANOVA, Training stage, F(1, 19) = 26.68, ***p = 5.50 × 10⁻⁵; Type of trial, F(1, 19) = 0.21, p = 0.649, Interaction Training stage × Type of trial, F(1, 19) = 38.55, p = 5.78 × 10⁻⁶. Data are expressed as mean ± standard error of the mean (SEM), n = 20 sessions. (H) Raster plot of the licks from 100 trials at a late training session of one of the adult rats. Colored dashes show the first eight licks of the trial (timely rewarded trials: blue, timely unrewarded trials: lilac, premature trials: red). (I) Time from port entry to movement initiation for timely and premature trials. Data were obtained from a total of 10 training sessions of two animals. t(9) = 1.54, p = 0.159.
Figure 7—figure supplement 2

Striatal activity also marks transitions between behavioral states of the task in adolescent animals.
(A) Individual peri-event time histograms (PETHs) of all the recorded striatal neurons from adolescent rats during correct trials, aligned to port entry (left) or port port exit (right), with their corresponding average PETH (below). The color code for the normalized activity is shown on the right. Red dashed line: criterion time, vertical green line: time of led on. (B) Proportion of neurons showing task-related firing rate modulations. Population PETH and average firing rates aligned to port entry (top panels) and port exit (bottom panels) for (C) striatal neurons showing only port entry-related activity, (D) striatal neurons showing only port exit-related activity, (E) striatal neurons showing activity modulations at both port entry and port exit, and (F) striatal neurons showing higher activity during licking behavior. From (C–F), it is represented the mean (solid lines) and SE (shaded area). Colored bars over the x-axis show the interval used to detect firing rate modulations (red: entry, orange: exit, purple: active during the task). The color code for the mean normalized FR is shown on the right (A).
Figure 7—figure supplement 3
Anticipatory, reward-responsive and exit activity in striatal neurons of adolescent rats.
(A) Population peri-event time histogram (PETH) and average firing rates of striatal units showing positive firing rate modulations during reward delivery, reward omission, and premature trials. (B) Bar graphs showing statistical comparisons between trial conditions. Top: Reward-responsive neurons, Rewarded versus Unrewarded trials, ***q(28) = 10.76, p = 1.86 × 10⁻¹¹; Rewarded versus Premature trials, ***q(28) = 13.60, p = 7.33 × 10⁻¹⁴; Unrewarded versus Premature trials *q(28) = 3.22, p = 0.003, Tukey test after significant one-way RM ANOVA (***F(1.99, 55.62) = 50.81, p = 2.33 × 10⁻⁹). Middle: No reward-responsive neurons, Rewarded versus Unrewarded trials ***q(25) = 10.24, p = 1.96 × 10⁻¹⁰, Rewarded versus Premature trials ***q(25) = 4.46, p = 1.52 × 10⁻⁴, Unrewarded versus Premature trials *q(25) = 3.28, p = 0.003, Tukey test after significant one-way RM ANOVA (***F(1.57, 39.27) = 18.33, p = 1.17 × 10⁻⁴). Bottom: Expected no reward-responsive neurons, Rewarded versus Unrewarded trials *q(31) = 4.19, p = 2.14 × 10⁻⁴, ***Rewarded versus Premature trials q(31) = 13.49, p = 1.63 × 10⁻¹⁴, Unrewarded versus Premature trials ***q(31) = 8.78, p = 6.58 × 10⁻¹⁰, Tukey test after significant one-way RM ANOVA (***F(1.95, 60.58) = 43.19, p = 1.34 × 10⁻⁸). (C) Discrimination index for each of the groups of neurons shown in B–D, Rewarded versus Unrewarded *q(25) = 0.51, Adjusted p value = 0.128, Rewarded versus Premature q(28) = 2.84, Adjusted p value = 0.128, Unrewarded versus Premature q(25) = 2.92, Adjusted p value = 0.118, Tukey test after significant mixed-effects model (Restricted Maximum Likelihood, REML), *F(1.93, 51.19) = 3.34, p = 0.045. (D) PETH showing lick rates during the three trial conditions, centered at the eighth lick, with its corresponding average and statistical analysis at the bottom. The color code for the normalized activity is shown on the right. (E) Average firing rate of neurons responding to port exit, during premature and timely trials, for trials with an 8-lick sequence and trials where less than 8 licks were emitted. (F) Average striatal activity corresponding to the PETH shown in (E), Two-way RM ANOVA, Licks’ sequence ***F(1,255) = 116.04, p = 1.51 × 10⁻²², Training F(1,255) = 1.98, p = 0.160, ***Interaction Sequence × Training F(1,255) = 27.57, p = 3.19 × 10⁻⁷.
Figure 7—figure supplement 4
Behavioral performance of non-implanted adolescent and adult rats.
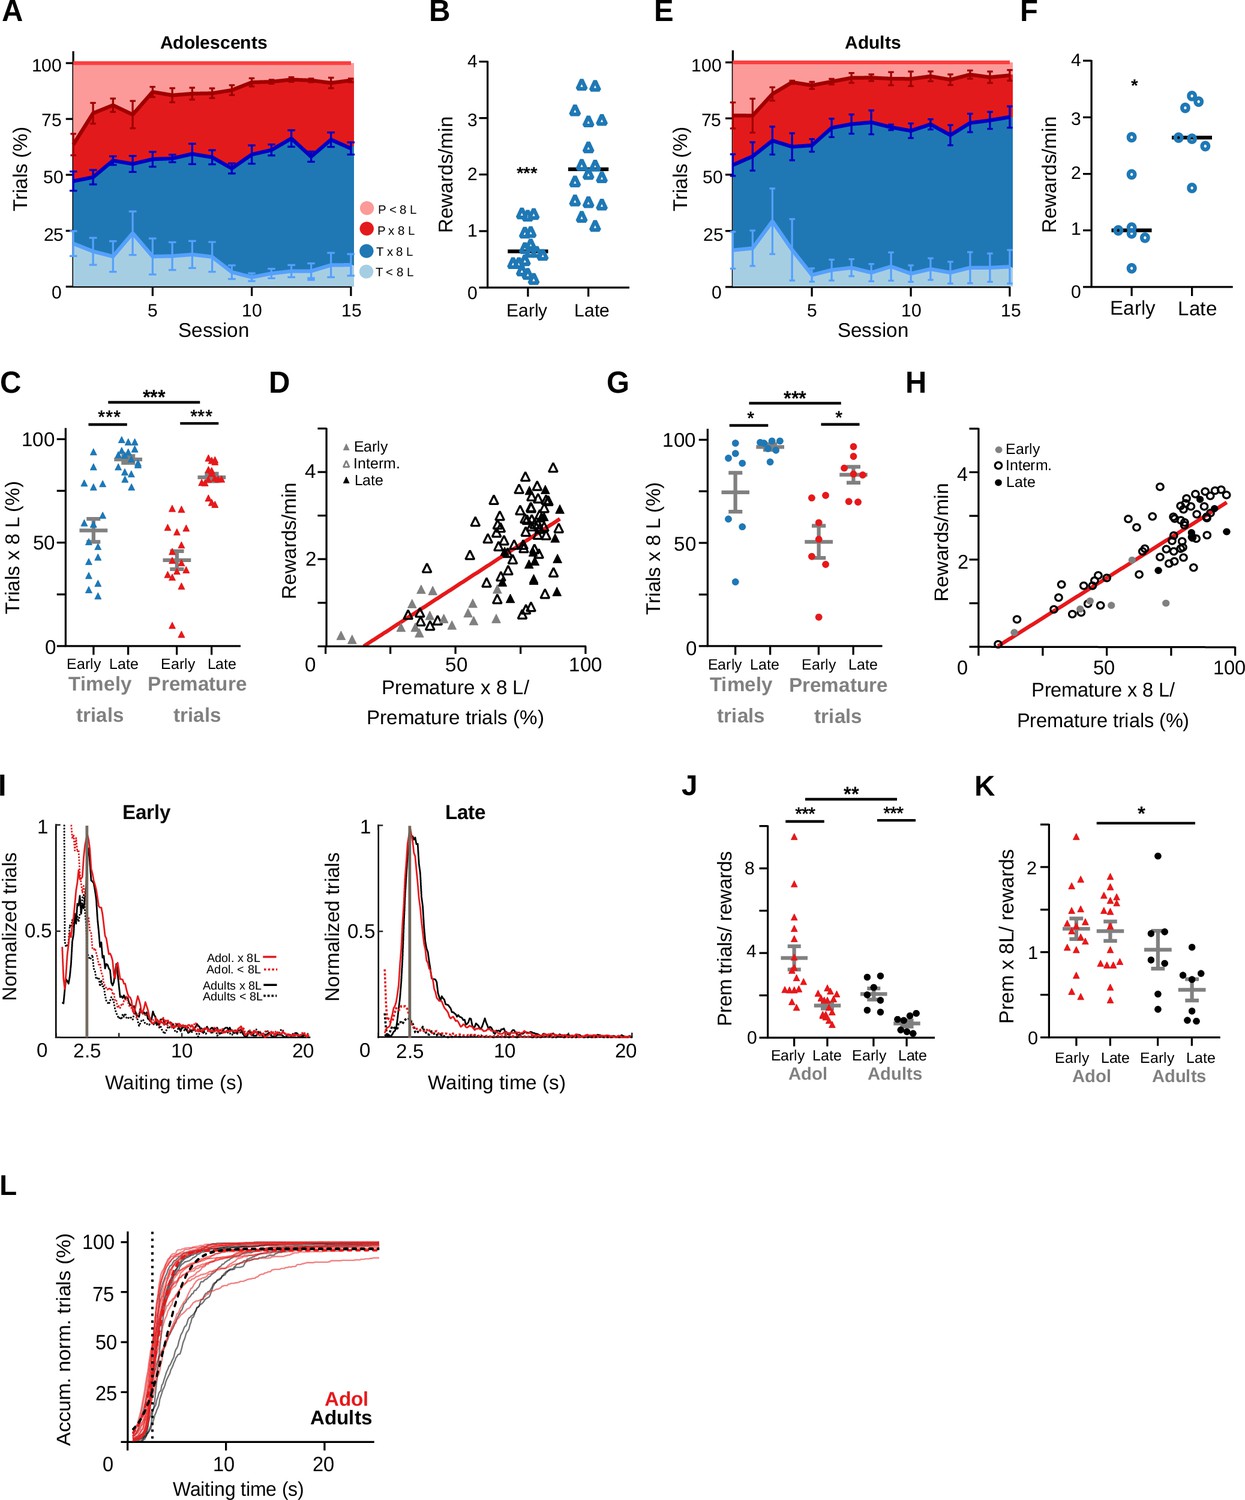
(A) Percentage of the different trial types per session of adolescent rats (n = 6). (B) Reward rates for each training stage of adolescent rats, Wilcoxon matched pairs signed-rank test, ***p = 6.12 × 10⁻²⁶, n = 16 pairs. (C) Proportion of trials followed by 8-lick sequences at early and late learning stages of adolescent rats, ***Two way RM ANOVA, F(1,15) = 68.02, p = 5.91 × 10⁻⁷, n = 16 sessions. (D) Correlation between percentage of prematurely initiated trials followed by an 8-lick sequence and reward rate in adolescent rats (Linear regression Y = 0.038*X − 0.554, Slope significantly different from zero, F(1, 90) = 82.88, p = 2.51 × 10⁻¹⁴, R2 = 0.4850, n = 92 sessions from 6 rats). (E) Percentage of the different trial types per session of adult rats (n = 6). (F) Reward rates for each training stage of adult rats, *p = 0.0156, n = 7 pairs. (G) Proportion of trials followed by 8-lick sequences at early and late learning stages of adult rats, ***Two way RM ANOVA F(1, 6) = 9.81, p = 0.020, n = 7 sessions. (H) Correlation between percentage of prematurely initiated trials followed by an 8-lick sequence and reward rate in adult rats (Linear regression Y = 0.037*X − 0.265, Slope significantly different from zero, F(1, 69) = 205.78, p = 5.88 × 10⁻²², R2 = 0.749, n=71 sessions from 6 rats). (I) Normalized frequency distributions of the trial initiation times (waiting time), separated for trials with (red line: adolescents, black line: adults) and without (red dotted line: adolescents, black dotted line: adults) 8-lick sequenc0es, in the early and late stages of training. (J) Ratio between the number of premature trials made and the obtained rewards for adolescents and adults, Two-way RM ANOVA, ***effect of training F(1, 21) = 16.33, p = 6.00 × 10⁻⁴, **effect of age F(1, 21) = 8.43, p = 0.008, Interaction F(1, 21) = 0.91, p = 0.350. (K) Premature trials with 8-lick sequences made per obtained rewards for adolescents and adults. Two-way RM ANOVA effect of training F(1, 21) = 3.75, p = 0.066, *effect of age F(1, 21) = 7.46, p = 0.012, Interaction F(1, 21) = 2.96, p = 0.099. (L) Accumulated normalized trials versus Waiting time for adolescents. Light color lines show each individual session. Hatched lines show the logistic function fitted to the behavioral data. Inset: detail around 2.5-s waiting time. p2 coefficient of the logistic function, profile likelihood estimation of 95% confidence interval: Adolescents mean = 1.262, 95% CI: 1.223–1.304, and Adults mean = 0.8490, 95% CI: 0.8032–0.8984, F(1, 5652) = 170.3, p = 2.71 × 10–38.
Videos
Video 1
Behavior in a late training session of an adolescent rat.
Tables
Table 1
Detailed experimental data.
| Rat ID | Age: group/training start | Training protocol (waiting time) | Experiments | Recording sessions | Neurons | ||
|---|---|---|---|---|---|---|---|
| 7 | Adult (p118) | 2.5 s | Behavior | Electrophysiology | 15 | 32 | |
| 11 | Adult (p85) | 2.5 s | Behavior | Electrophysiology | 7 | 62 | |
| 12 | Adult (p82) | 2.5 s | Behavior | Electrophysiology | 16 | 69 | |
| 19 | Adult (p82) | 2.5 s | Behavior | Electrophysiology | 25 | 106 | |
| 29 | Adult (p128) | 2.5 s | Behavior | Electrophysiology | 16 | 108 | |
| 21 | Adolescent (p36) | 2.5 s | Behavior | Electrophysiology | 19 | 79 | |
| 25 | Adolescent (p35) | 2.5 s | Behavior | Electrophysiology | 18 | 166 | |
| 26 | Adolescent (p37) | 2.5 s | Behavior | Electrophysiology | 13 | 307 | |
| 45 | Adolescent (p42) | 2.5 s | Behavior | Electrophysiology | 10 | – | |
| 47 | Adolescent (p46) | 2.5 s | Behavior | Electrophysiology | Accelerometer | 14 | 95 |
| 49 | Adolescent (p39) | 2.5 s | Behavior | Electrophysiology | Accelerometer | 15 | 229 |
| 31 | Adult (p96) | 5 s | Behavior | Electrophysiology | 6 | 41 | |
| 33 | Adult (p60) | 5 s | Behavior | Electrophysiology | 6 | 51 | |
| 2.5 s | Behavior | Electrophysiology | 2 | 25 | |||
| 34 | Adult (p99) | 5 s | Behavior | Electrophysiology | 7 | – | |
| 35 | Adult (p70) | 2.5–5 s | Behavior | Electrophysiology | 22 | 279 | |
| 37 | Adult (p80) | 2.5–5 s | Behavior | Electrophysiology | 10 | – | |
| 41 | Adult (p91) | 2.5–5 s | Behavior | Electrophysiology | 9 | 94 | |
| 42 | Adult (p89) | 2.5 s | Behavior | Accelerometer | 5 | – | |
| 43 | Adult (p89) | 2.5 s | Behavior | Accelerometer | 6 | – | |
| 16 | Adult (p83) | 2.5 s | Behavior | ||||
| 17 | Adult (p83) | 2.5 s | Behavior | ||||
| 601 | Adult (p60) | 2.5 s | Behavior | ||||
| 602 | Adult (p60) | 2.5 s | Behavior | ||||
| 603 | Adult (p70) | 2.5 s | Behavior | ||||
| 604 | Adult (p70) | 2.5 s | Behavior | ||||
| 22 | Adolescent (p35) | 2.5 s | Behavior | ||||
| 24 | Adolescent (p33) | 2.5 s | Behavior | ||||
| 352 | Adolescent (p36) | 2.5 s | Behavior | ||||
| 353 | Adolescent (p28) | 2.5 s | Behavior | ||||
| 354 | Adolescent (p30) | 2.5 s | Behavior | ||||
| 355 | Adolescent (p30) | 2.5 s | Behavior | ||||
Additional files
Download links
A two-part list of links to download the article, or parts of the article, in various formats.
Downloads (link to download the article as PDF)
Open citations (links to open the citations from this article in various online reference manager services)
Cite this article (links to download the citations from this article in formats compatible with various reference manager tools)
Dorsal striatum coding for the timely execution of action sequences
eLife 11:e74929.
https://doi.org/10.7554/eLife.74929


