First-order visual interneurons distribute distinct contrast and luminance information across ON and OFF pathways to achieve stable behavior
- Institute of Developmental Biology and Neurobiology, Johannes-Gutenberg University Mainz, Germany
- Göttingen Graduate School for Neurosciences, Biophysics, and Molecular Biosciences (GGNB) and International Max Planck Research School (IMPRS) for Neurosciences at the University of Göttingen, Germany
Figures
Figure 1
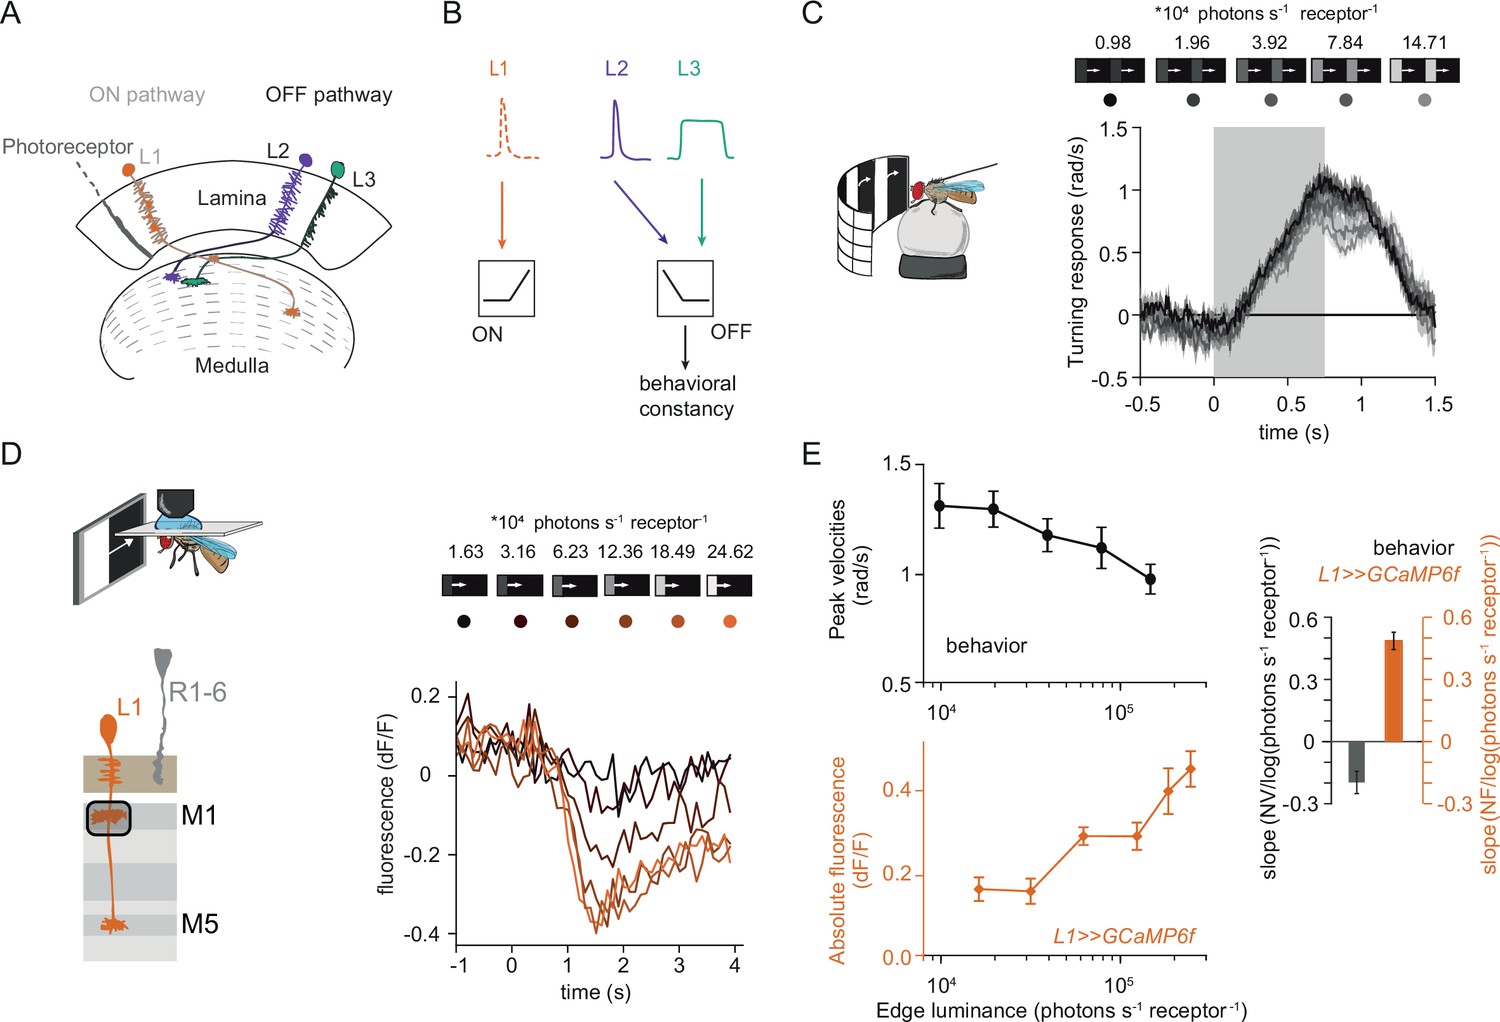
Fly behavioral responses to ON contrast do not co-vary with L1 responses.
(A) Schematic of lamina neurons projecting from the lamina to the medulla. L1 is considered the main input to the ON-pathway, whereas L2 and L3 are thought to provide input to the OFF pathway. (B) Transient L2 and sustained L3 neurons provide contrast and luminance information, respectively, to the OFF pathway to guide contrast-constant behavior (Ketkar et al., 2020). L1 is thought to have physiological properties very similar to L2 (Clark et al., 2011) and provides contrast information to the ON selective pathway. (C) Turning response to multiple moving ON edges, moving at 160°/s, displayed on an LED arena that surrounds a fly walking on an air-cushioned ball. The edge luminance takes five different values, and the background is dark (~0 luminance), all resulting in 100% contrast. Turning responses are color-coded according to the edge luminance. The gray box indicates motion duration. n = 10 flies. (D) In vivo calcium signals of L1 axon terminal in medulla layer M1 in response to moving ON edges of six different luminances. Calcium responses of single L1 axon terminal are shown. (E) Top: peak turning velocities calculated from (C), bottom: absolute step responses of L1. Sample size for L1: n = 6 (15) flies(cells). Right: slope quantification of luminance dependency for normalized behavior and L1 fluorescence signals. NV = normalized peak velocity, NF = normalized fluorescent signal. Traces and plots in C and E show mean ± SEM.
Figure 2 with 1 supplement
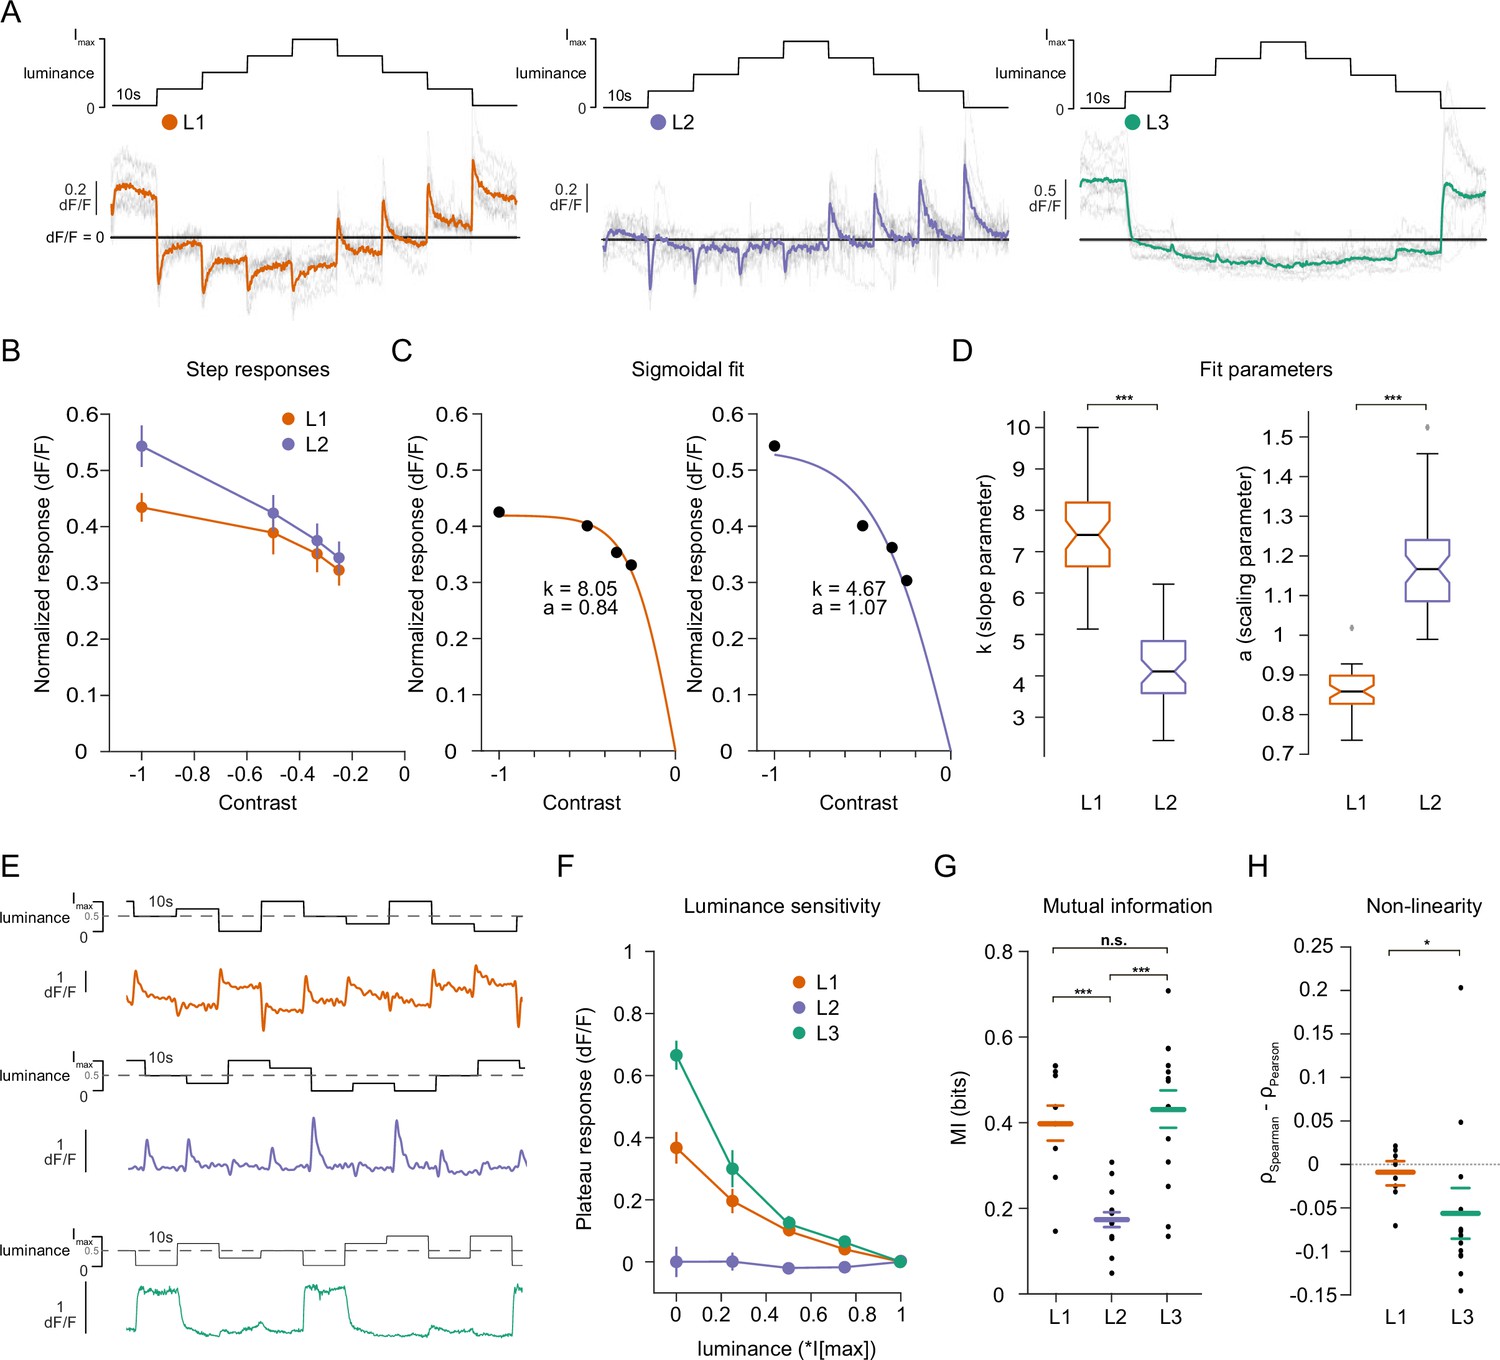
Lamina neuron types L1-L3 are differently sensitive to contrast and luminance.
(A) Schematic of the ‘staircase’ stimulus, Imax = 2.17 × 10⁵ photons s–1 photoreceptor–1. Luminance sequentially steps up through five values and then sequentially steps down. Shown below are the calcium responses of L1 (orange), L2 (purple), and L3 (green) axon terminals. Colored traces show the mean response, grey traces show individual fly means. (B) Normalized step responses of L1 and L2 neurons to OFF contrasts of the staircase stimulus. (C) Individual bootstrapping examples of sigmoidal fits where k is the slope parameter and a is the scaling parameter. (D) Comparison of fit parameters between L1 and L2, Student t-test, ***p < 0.001 (E) Example calcium traces of single L1, L2, and L3 axon terminals to a stimulus comprising 10 s full-field flashes varying randomly between five different luminances. (F) Plateau responses of the three neuron types, quantified from the responses to the stimulus in (E). (G) Mutual information between luminance and calcium signal, ***p < 0.001, one-way ANOVA followed by multiple comparison test corrected with Bonferroni. (H) Non-linearity quantification of luminance-dependent signals of L1 and L3 in (C), *p < 0.05, tested by a wilcoxon rank sum test. Sample sizes for (A and B) L1: n = 8 (54), L2: n = 11(48), L3: n = 12(103), for (D) we used 50 times bootstrapping from the dataset in (A), and for (E–H) L1: n = 9 (71), L2: n = 14(74), L3: n = 14(88) flies(cells). Calcium traces show mean and quantification plots (B, F, G, H) show mean ± SEM. Boxplots in (D) show median, 25% and 75% percentiles and whiskers extend to the most extreme data points.
Figure 2—figure supplement 1
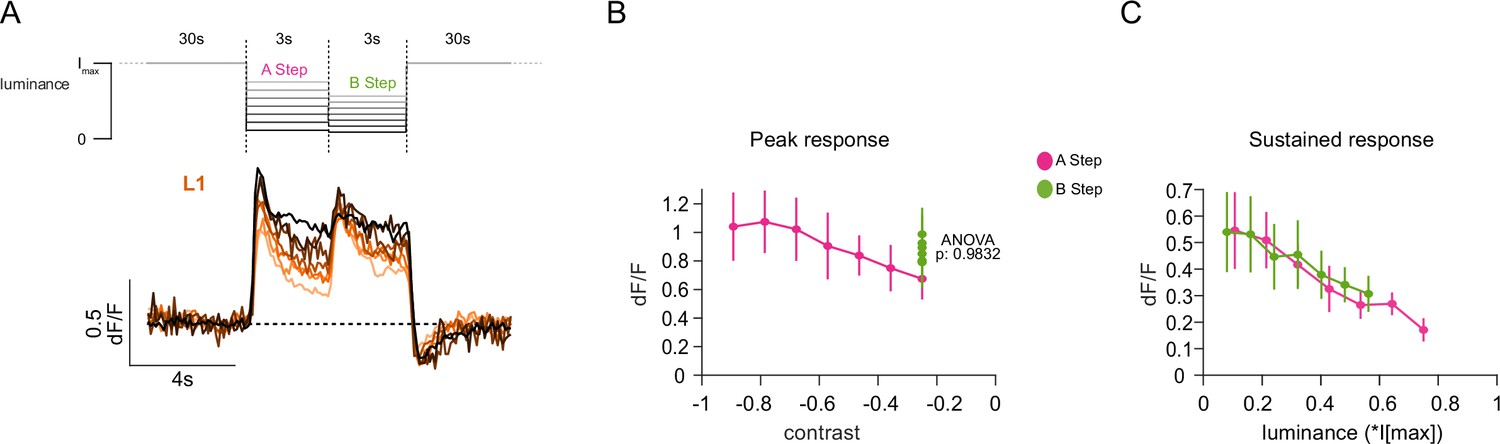
L1 has contrast and luminance-sensitive components.
(A) Shown above is the schematic of the stimulus where seven different A-B-step combinations are illustrated by the grayscale of the stimulus traces. Imax = 2.17 × 10⁵ photons s–1 photoreceptor–1. Below, calcium traces of L1 (orange) are shown, where traces depict mean of flies for each A-B step combination where darker traces correspond to larger OFF steps. (B) Peak calcium responses of L1 to A (magenta) and B (light green) steps plotted against contrast. p value shown is from one-way ANOVA of the B step responses. (C) Responses of the mean of the last 500ms of A and B step epochs plotted against luminance. Sample size is L1: n = 9 (58), flies(cells). Quantification plots (B, C) show mean ± SEM.
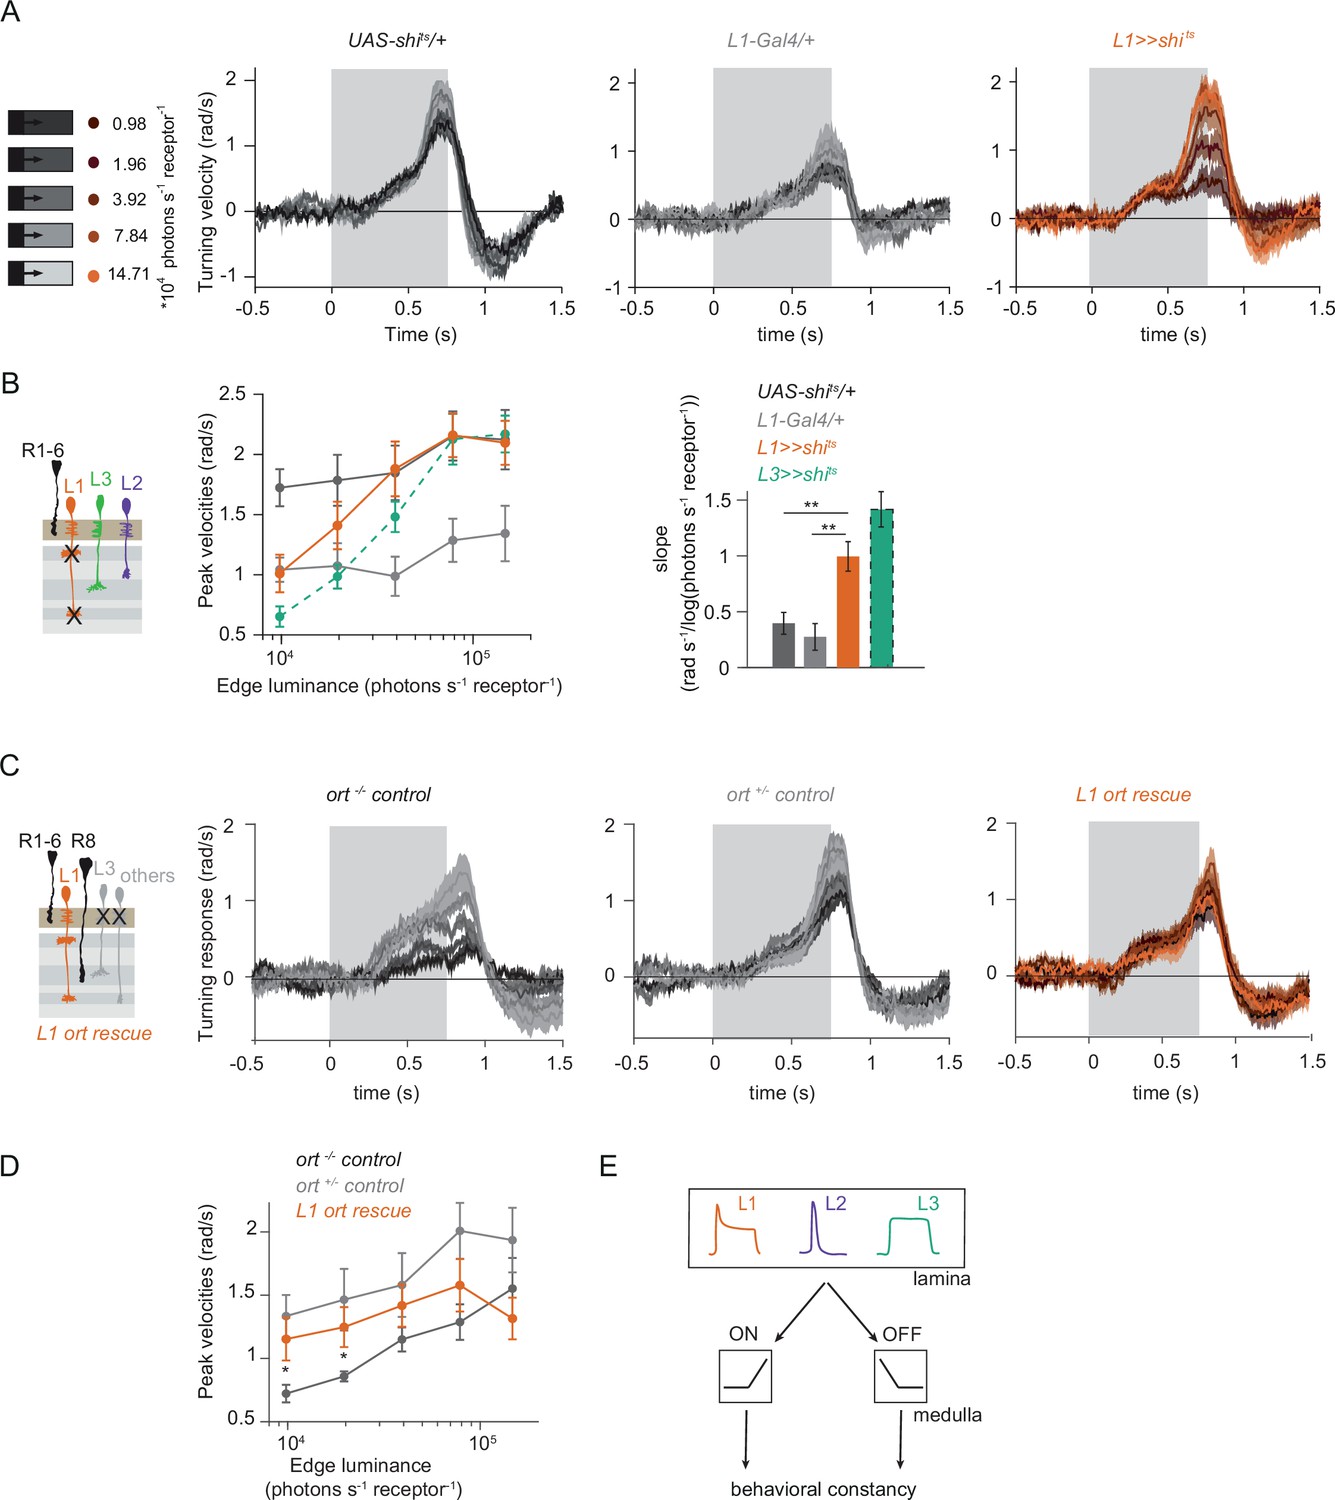
Figure 3 with 1 supplement
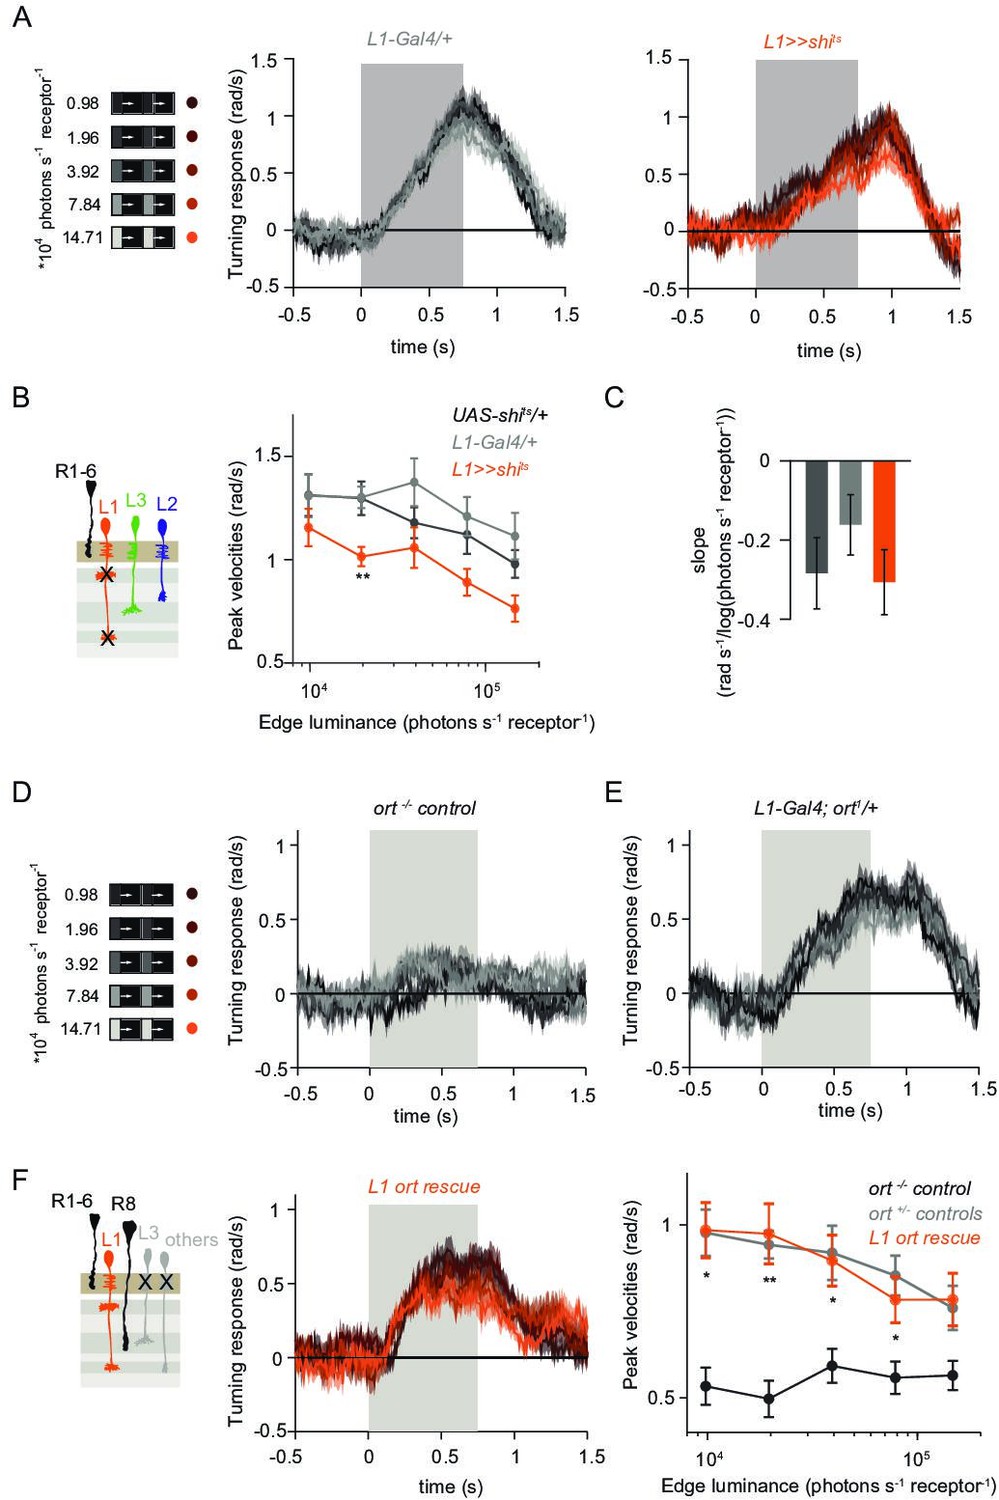
L1 is not required but sufficient for ON behavior across luminance.
(A) Turning responses of L1-silenced flies (orange) and their specific Gal4 control (gray) to moving 100% contrast ON edges at five different luminances. (B) Peak velocities quantified for each of the five edges during the motion period, also including the control UAS-shits/+, **p < 0.01, two-tailed Student’s t-tests against both controls, with Bonferroni-Holm correction. (C) Relationship of the peak velocities with luminance, quantified as slopes of the linear fits to the data in (B). Sample sizes are n = 10 flies for each genotype. (D–E) Schematic of the stimulus (same as in A) and turning responses of the ort null mutant (ort-/- controls, D) and heterozygous ort controls (ort+/-±, E). (F) Schematic of the L1 ort rescue genotype and turning responses of L1 ort rescue flies (left). Peak turning velocities of L1 ort rescue flies and the respective controls (right); *p < 0.05, **p < 0.01, two-tailed Student’s t-tests against both controls, with Bonferroni-Holm correction. The gray box region in (A,D,E,F) indicates motion duration. Traces and plots show mean ± SEM.
Figure 3—figure supplement 1
L1 is required for ON behavior across a range of contrasts.
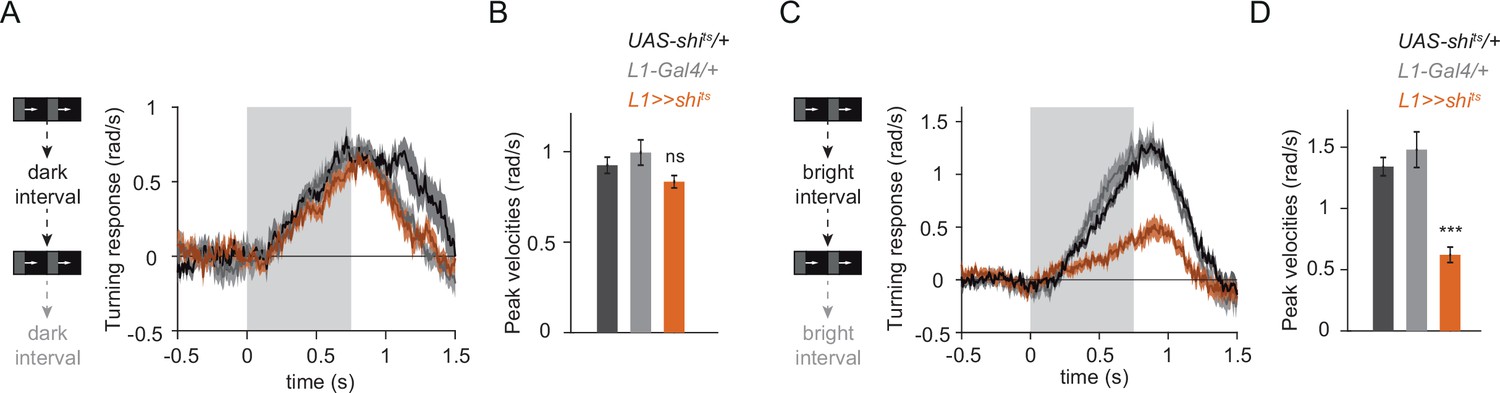
(A) Turning responses of controls (gray) and L1-silenced flies (orange) in response to moving ON edges of a single luminance. Epochs were interleaved with dark inter-stimulus intervals. n = 7 for all genotypes. (B) Peak turning velocities quantified during the motion period in (A). (C) As in A, except a bright inter-stimulus interval was used. n = 8 for all genotypes. (D) Peak turning velocities quantified during the motion period in (C). ***p < 0.001, two-tailed Student’s t-test against both controls with Bonferroni-Holm correction. Traces and plots show mean ± SEM. The gray box region in (A) and (C) indicates motion duration.
Figure 4
L1 and L3 together provide luminance signals required for ON behavior.
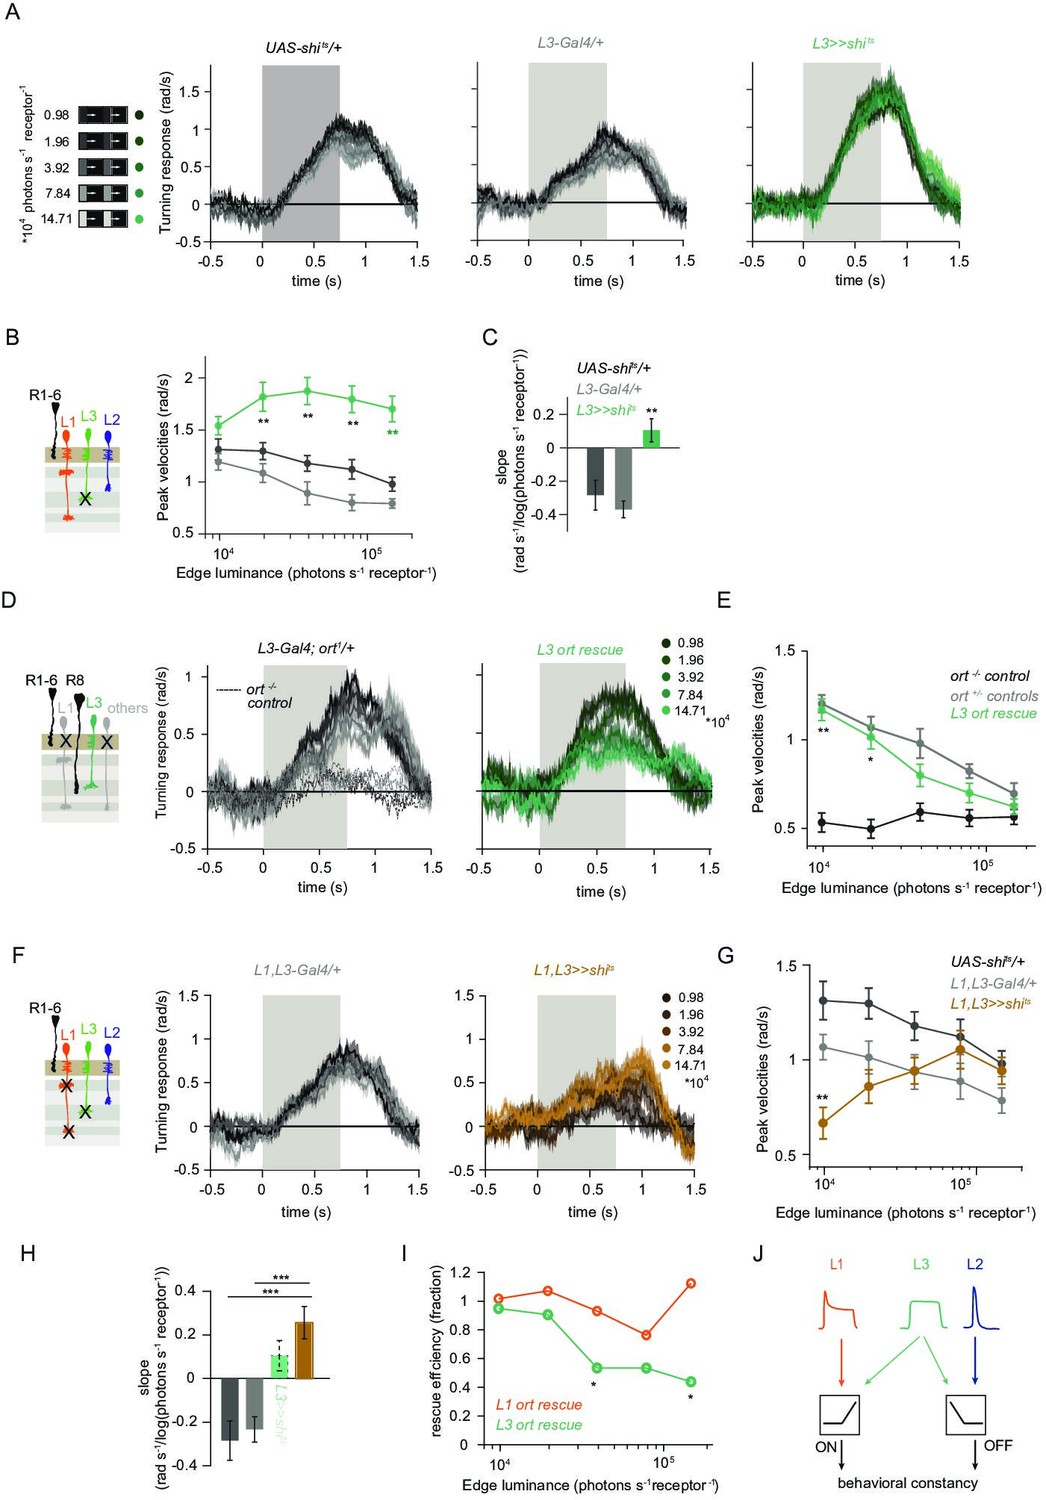
(A) Turning velocities of the controls (gray) and L3-silenced flies (green) in response to five moving ON edges of 100% contrast. The gray box region indicates motion duration. (B) Peak turning velocities for five ON edges quantified during the motion period, **p < 0.01, two-tailed Student’s t-tests against both controls, with Bonferroni-Holm correction. (C) Relationship of the peak velocities with luminance, quantified as slopes of the linear fits to the data in (B). Fitting was done for individual flies. Sample sizes are n = 10 (UAS-shits/+,L3 >>shits) and n = 8 (L30595-Gal4/+). **p < 0.01, two-tailed Student’s t-tests against both controls, with Bonferroni-Holm correction. (D) Schematic of the L3 ort rescue genotype and turning responses of the heterozygous control (gray) and rescue (green) flies. (E) Peak turning velocities, *p < 0.05, **p < 0.01, two-tailed Student’s t-tests against both controls, with Bonferroni-Holm correction. (F) Turning responses of flies where L1 and L3 were silenced together (golden brown) and their specific Gal4 control (gray), color-coded according to ON edge luminance. The same five moving ON edges of 100% contrast as in Figure 1C were shown. Responses of the other control UAS-shits/+ to these stimuli have been included in Figure 1C. (G) Peak velocities quantified for each of the five edges during the motion period, also including the control UAS-shits/+, **p < 0.01, two-tailed Student’s t-tests against both controls, with Bonferroni-Holm correction (H) Relationship of the peak velocities with luminance, quantified as slopes of the linear fits to the data in (G). Slopes from the L3-silenced flies (green, dashed) responding to the same stimuli (Figure 3C) are included again for comparison. Fitting was done for individual flies. Sample sizes are n = 10 (UAS-shits/ + and L1,L3 >>shits) and n = 7 (L1c2025-Gal4/+;L30595-Gal4/+). (I) Efficiency of the L1 and L3 behavioral rescue, calculated for each edge luminance as (rescue - ort-/- control) / (ort+/- control - ort-/- control). ± < 0.05, permutation test with Bonferroni correction, 1,000 permutations over the L1 ort rescue and L3 ort rescue flies. (J) Summary schematic. The ON pathway in addition to the OFF pathway receives a prominent input from L3. Like the OFF pathway, the ON pathway drives contrast constant behavior. Traces and plots show mean ± SEM.
Figure 5 with 1 supplement
The contrast-sensitive L2 provides input to the ON-pathway.
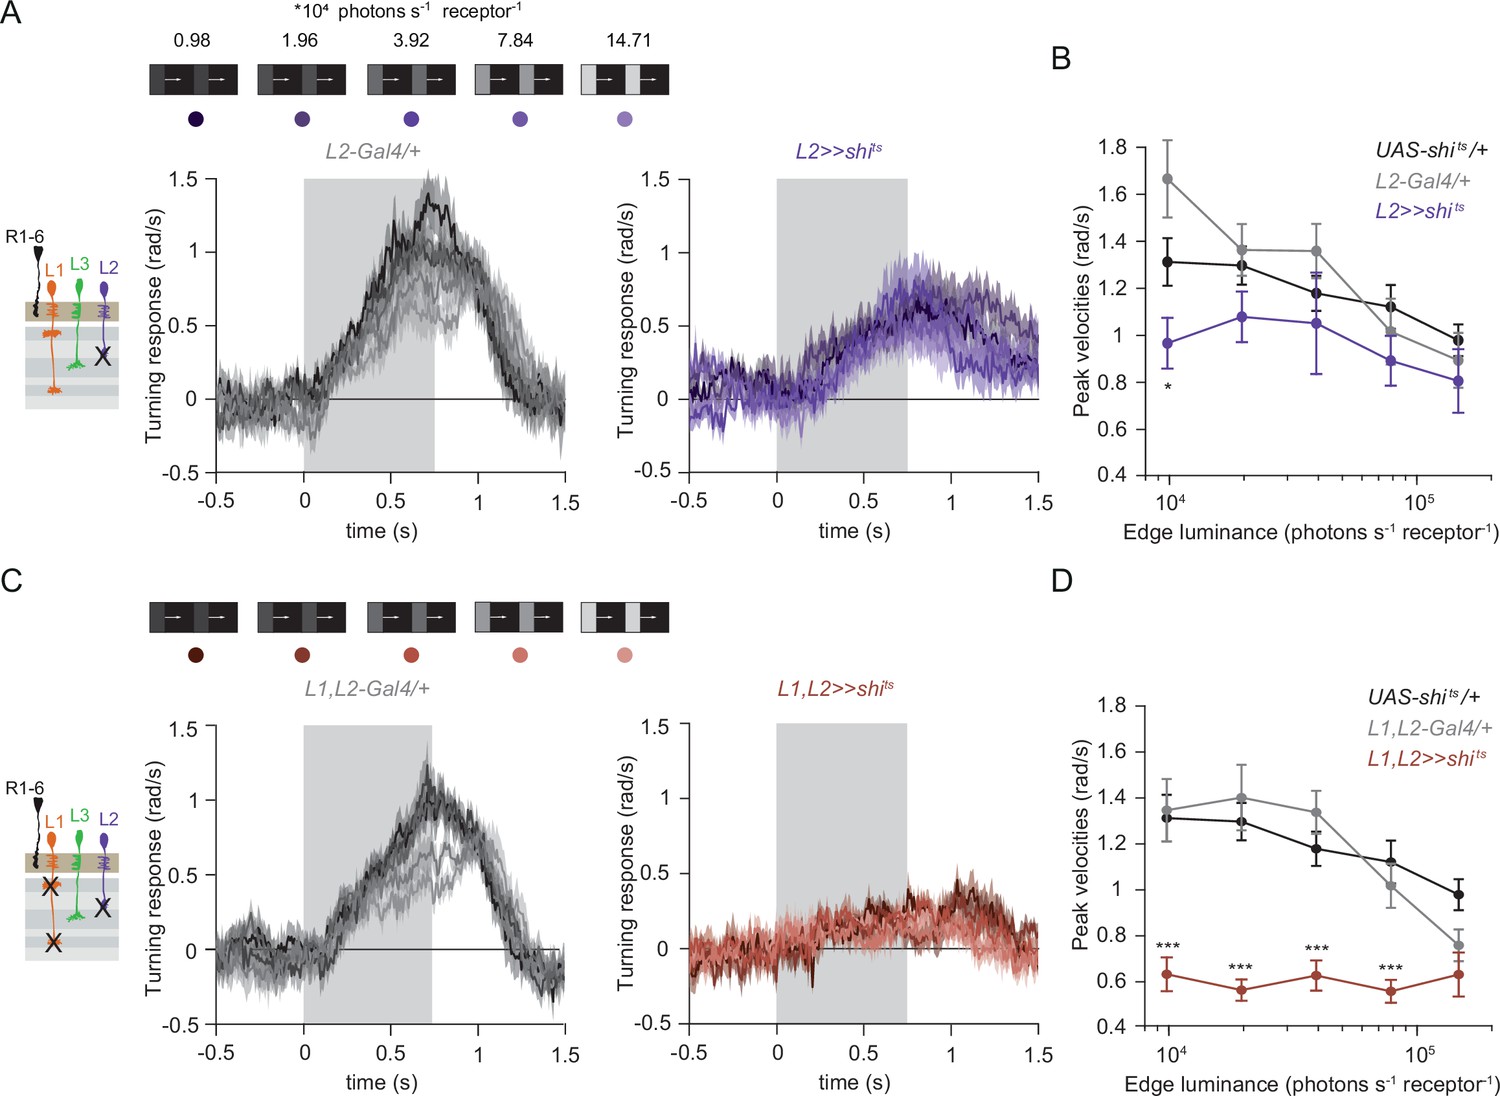
(A) Turning responses of flies where L2 was silenced (purple) and their specific Gal4 control (gray), color-coded according to 100% contrast ON edge at five different luminances. Sample sizes are n = 9 (L221Dhh >> shits) and n = 6 (L221Dhh-Gal4/+). (B) Peak velocities quantified for each of the five edges during the motion period, *p < 0.05, two-tailed Student’s t tests against both controls, with Bonferroni-Holm correction. (C) Turning responses of flies where L1 and L2 were silenced together (brown) and their specific Gal4 control (gray), color-coded according to ON edge luminance. Sample sizes are n = 9 (L1c2025,L221Dhh >> shits) and n = 8 (L1c2025-Gal4/+;L221Dhh-Gal4/+). (D) Peak velocities quantified for each of the five edges during the motion period, ***p < 0.001, two-tailed Student’s t-tests against both controls, with Bonferroni-Holm correction. Traces and plots show mean ± SEM.
Figure 5—figure supplement 1
L1 and L2 together are required for ON behavior across a range of contrasts.
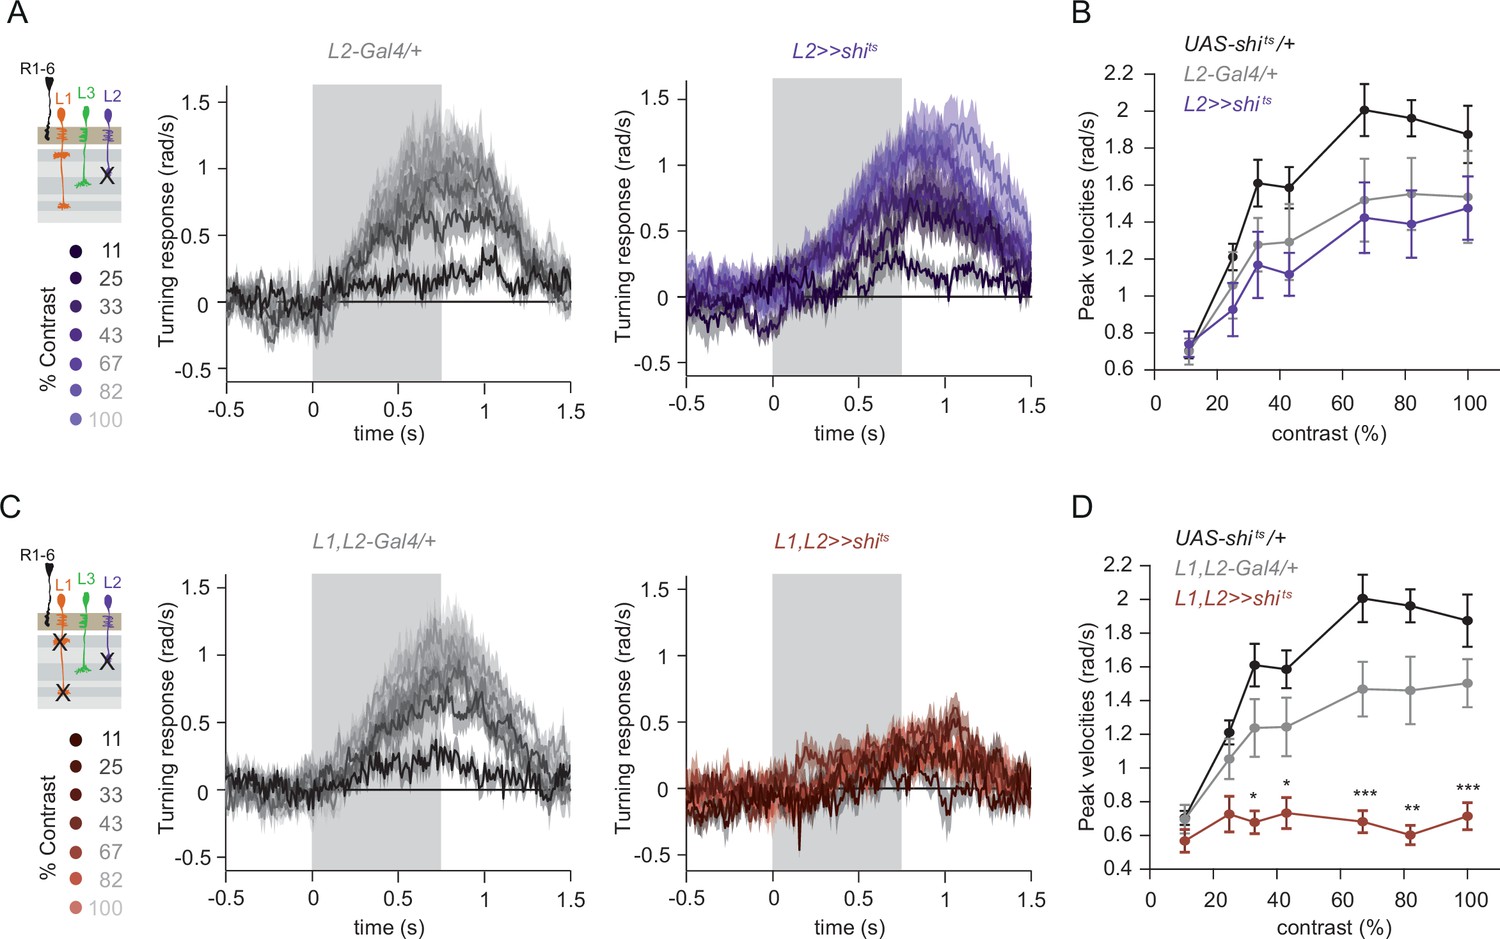
(A) Turning velocity time traces of the Gal4 control (gray) and L2-silenced flies (purple) in response to the moving ON edges of different contrasts, ranging from 11% to 100%. (B) Peak turning velocities quantified during the motion period. Sample sizes are n = 9 (UAS-shits/+), n = 8 (L221Dhh >> shits) and n = 8 (L221Dhh-Gal4/+). (C) Turning velocity time traces of the Gal4 control and L1,L2-silenced flies (brown) in response to the moving ON edges of different contrasts, ranging from 11% to 100%. (D) Peak turning velocities quantified during the motion period, *p < 0.05, **p < 0.01, ***p < 0.001, two-tailed Student’s t-test against both controls withß Bonferroni-Holm correction. Sample sizes are n = 9 (UAS-shits/+),n = 8 (L1,L2 >>shits) and n = 9 (L1,L2 -Gal4/+). Traces and plots show mean ± SEM. The gray box region in (A) and (C) indicates motion duration.
Figure 6
L1 function is required and sufficient for OFF behavior.
(A) Turning responses of L1-silenced flies (orange) and the controls (gray) to five OFF edges moving onto different backgrounds. (B) Peak velocities quantified for each of the five edges during the motion period, also including the peak velocities of L3-silenced flies. Shown next to it is the relationship of the peak velocities with luminance, quantified as slopes of the linear fits to the data. **p < 0.01, two-tailed Student’s t-tests against both controls, with Bonferroni-Holm correction (not significant against the L3 >>shits slopes). UAS-shits data in (A) and ort-/- data in (C) have been adapted from Figure 1B and 7C in Ketkar et al., 2020, L3 >>shits data in (B) have been re-quantified from data shown in Figure 4B in Ketkar et al., 2020. Sample sizes are n = 7 (L1-Gal4/+) and n = 10 for other genotypes. (C) Schematics of the L1 ort rescue genotypes followed by its turning responses to the moving OFF edges. (D) Peak turning velocities of L1 ort rescue flies and the respective controls; *p < 0.05, two-tailed Student’s t-tests against both controls, with Bonferroni-Holm correction. Sample sizes are n = 11 flies (ort-/-control) and n = 10 for other genotypes. The gray box region in (A) and (C) indicates motion duration. (E) Summary schematic. Lamina neurons L1-L3 distribute different visual features necessary for both ON and OFF pathways to guide contrast-constant behavior. Traces and plots show mean ± SEM.
Tables
Table 1
Genotypes used in this study.
| Name | Genotype | Figure |
|---|---|---|
| Imaging | ||
| L1 >>GCaMP6 f | w+; L1c202a-Gal4 /+; UAS-GCaMP6f /+ | Figure 1, Figure 2—figure supplement 1 |
| L2 >>GCaMP6 f | w+; UAS-GCaMP6f /+; L221Dhh-Gal4 /+ | Figure 2, Figure 2—figure supplement 1 |
| L3 >>GCaMP6 f | w+; L3MH56-Gal4 /+; UAS-GCaMP6f /+ | Figure 2, Figure 2—figure supplement 1 |
| Behavior | ||
| UAS-shibirets control | w+; +/+; UAS-shits /+ | Figures 1 and 3—6, Figure 2—figure supplement 2–1, Figure 5—figure supplement 5–1 |
| L3-Gal4 control | w+; +/+; L30595-Gal4 /+ | Figure 4 |
| L3 silencing | w+; +/+; L30595-Gal4 / UAS- shits | Figure 4 |
| L1-Gal4 control | w+; L1c202a-Gal4 /+; +/+ | Figures 3 and 6, Figure 3—figure supplement 1 |
| L1 silencing | w+; L1c202a-Gal4 /+; +/UAS- shits | Figures 3 and 6, Figure 3—figure supplement 1 |
| L1-Gal4, L3-Gal4 control | w+; L1c202a-Gal4 /+; L30595-Gal4/+ | Figure 4 |
| L1, L3 silencing | w+; L1c202a-Gal4 /+; L30595-Gal4/UAS- shits | Figure 4 |
| ort mutant | w+; UAS-ort /+; ort1, ninaE1/Df(3 R)BSC809 | Figures 3, 4 and 6 |
| L3 ort±control | w+; +/+; L30595-Gal4, ort1, ninaE1 /+ | Figure 4 |
| L3 ort rescue | w+; UAS-ort /+; L30595-Gal4, ort1, ninaE1/Df(3 R)BSC809 | Figure 4 |
| L1 ort±control | w+; L1c202a-Gal4/+, ort1, ninaE1/+ | Figures 3 and 6 |
| L1 ort rescue | w+; UAS-ort/+; L1c202a; ort1,ninaE1/Df(3 R)BSC809 | Figures 3 and 6 |
| L2-Gal4 control | w+; +/+; L221Dhh-Gal4/+ | Figure 5, Figure 5—figure supplement 1 |
| L2 silencing | w+; +/+; L221Dhh-Gal4/UAS- shits | Figure 5, Figure 5—figure supplement 1 |
| L1-Gal4, L2-Gal4 control | w+; L1c202a-Gal4/+; L221Dhh-Gal4/+ | Figure 5, Figure 5—figure supplement 1 |
| L1, L2 silencing | w+; L1c202a-Gal4/+; L221Dhh-Gal4/UAS- shits | Figure 5, Figure 5—figure supplement 1 |
Additional files
Download links
A two-part list of links to download the article, or parts of the article, in various formats.
Downloads (link to download the article as PDF)
Open citations (links to open the citations from this article in various online reference manager services)
Cite this article (links to download the citations from this article in formats compatible with various reference manager tools)
First-order visual interneurons distribute distinct contrast and luminance information across ON and OFF pathways to achieve stable behavior
eLife 11:e74937.
https://doi.org/10.7554/eLife.74937


