Intrinsic mechanical sensitivity of mammalian auditory neurons as a contributor to sound-driven neural activity
- Department of Physiology and Cell Biology, University of Nevada, Reno School of Medicine, United States
- Laboratory of Auditory Neurophysiology, Medical School, Campus Gasthuisberg, University of Leuven, Belgium
Figures
Figure 1 with 7 supplements
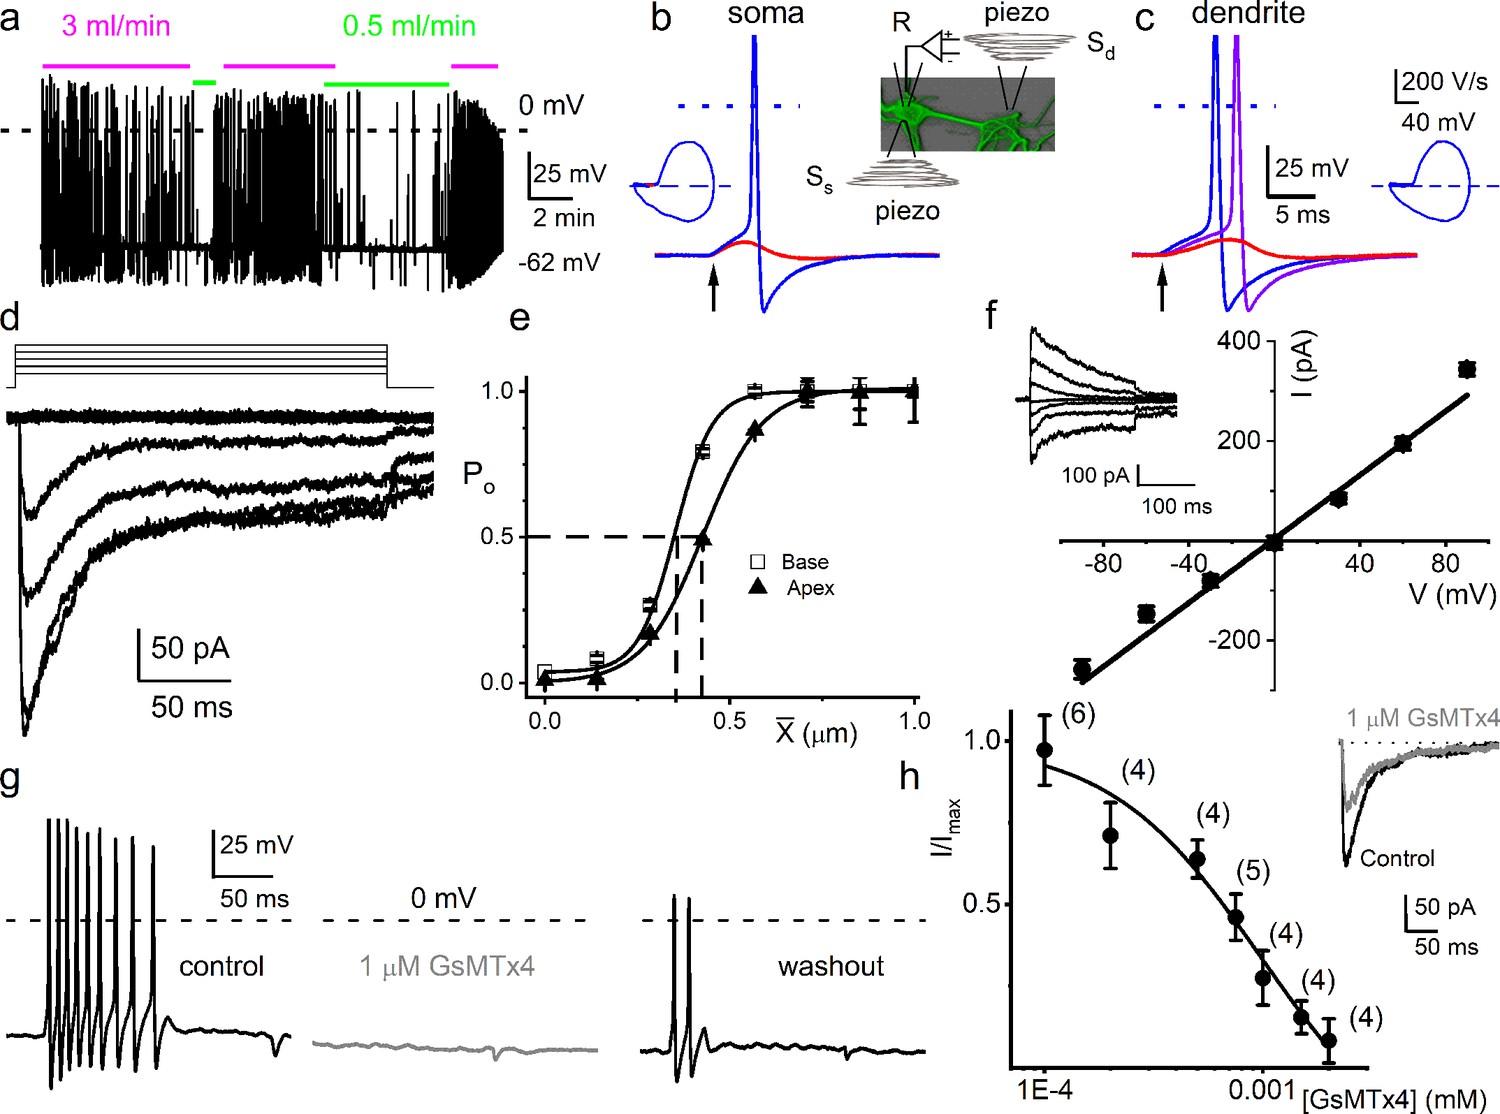
Mouse primary auditory neurons are mechanically sensitive.
(a) Responses of 8-week-old basal spiral ganglion neuron (SGN) to bath solution flow rate shown with colored bars (3 ml/min, magenta; 0.5 ml/min, green). Vrest = –62 mV. (b) Mechanical displacement (20 ms rectangular-pulse injection) of apical SGN soma, subthreshold (0.15 μm, red), and threshold (0.4 μm, blue) responses. Arrow indicates pulse initiation. Inset depicts the patch-clamp recording electrode (R) and stimulating probe (piezoelectric actuator represented as spring), placed ~180o from the patch electrode at the soma (Ss) or on the substrate to stimulate dendrites (Sd). (c) Responses of basal SGN to dendrite-substrate ramp-displacement at slew rates (μm/ms) 0.1 (red), 0.5 (purple), and 1.0 (blue). Arrow indicates the time of pulse initiation. Action potential (AP) latency increased as the slew rate decreased rate, 1 μm/ms, latency = 4 ± 0.1 ms; 0.5 μm/ms = 6 ± 0.2 ms (n = 14). The corresponding phase plots (dV/dt versus V) of the responses are shown next to the traces. (d) Current traces from displacement-clamp (X = 0–1.2 μm, step size ΔX = ~0.24 μm) recordings at a holding voltage of –70 mV. Data are obtained from apical SGNs; for basal SGNs data, see S2. (e) Summary data of displacement-response relationship of IMA represented as channel open probability (Po) as a function of displacement, fitted by a single Boltzmann function. Data are from apical (▲) and basal (□) SGNs. The one-half-maximum displacements (X0.5) are indicated by the vertical dashed lines (X0.5 = 0.42 ± 0.01 μm (apical SGNs) and 0.35 ± 0.01 μm (basal SGNs), n = 14 for both). (f) Average I-V relationship of MA currents. Inset shows traces of IMA evoked at different holding voltages (−90 to 90 mV, ΔV = 30 mV, X = 0.4 μm). The regression line indicates a reversal potential of the MA current (EMA) of –1.4 ± 2.1 mV (cumulative data from apical SGNs, n = 17). The whole-cell conductance derived from the regression line is 3.2 ± 0.2 nS (n = 17). (g) APs from basal SGN evoked in response to 0.8 μm displacement of neurite substrate (first black trace; Vrest = –59 mV; dashed line = 0 mV). Effect of 1 μM GsMTx4 (middle gray trace) and partial recovery after washout (last black trace; n = 5). (h) Dose-response relationship of IMA as function of blocker GsMTx4, IC50 = 0.9 ± 0.2 μM (n = 4). Numbers of SGNs at different concentrations of GsMTx4 are shown in brackets. Inset shows IMA in response to a 0.3 μm displacement at –70 mV holding voltage (gray trace is 1 μM GsMTx4; black trace is control).
-
Figure 1—source data 1
Mechanical sensitivity of SGNs.
- https://cdn.elifesciences.org/articles/74948/elife-74948-fig1-data1-v2.xlsx
Figure 1—figure supplement 1
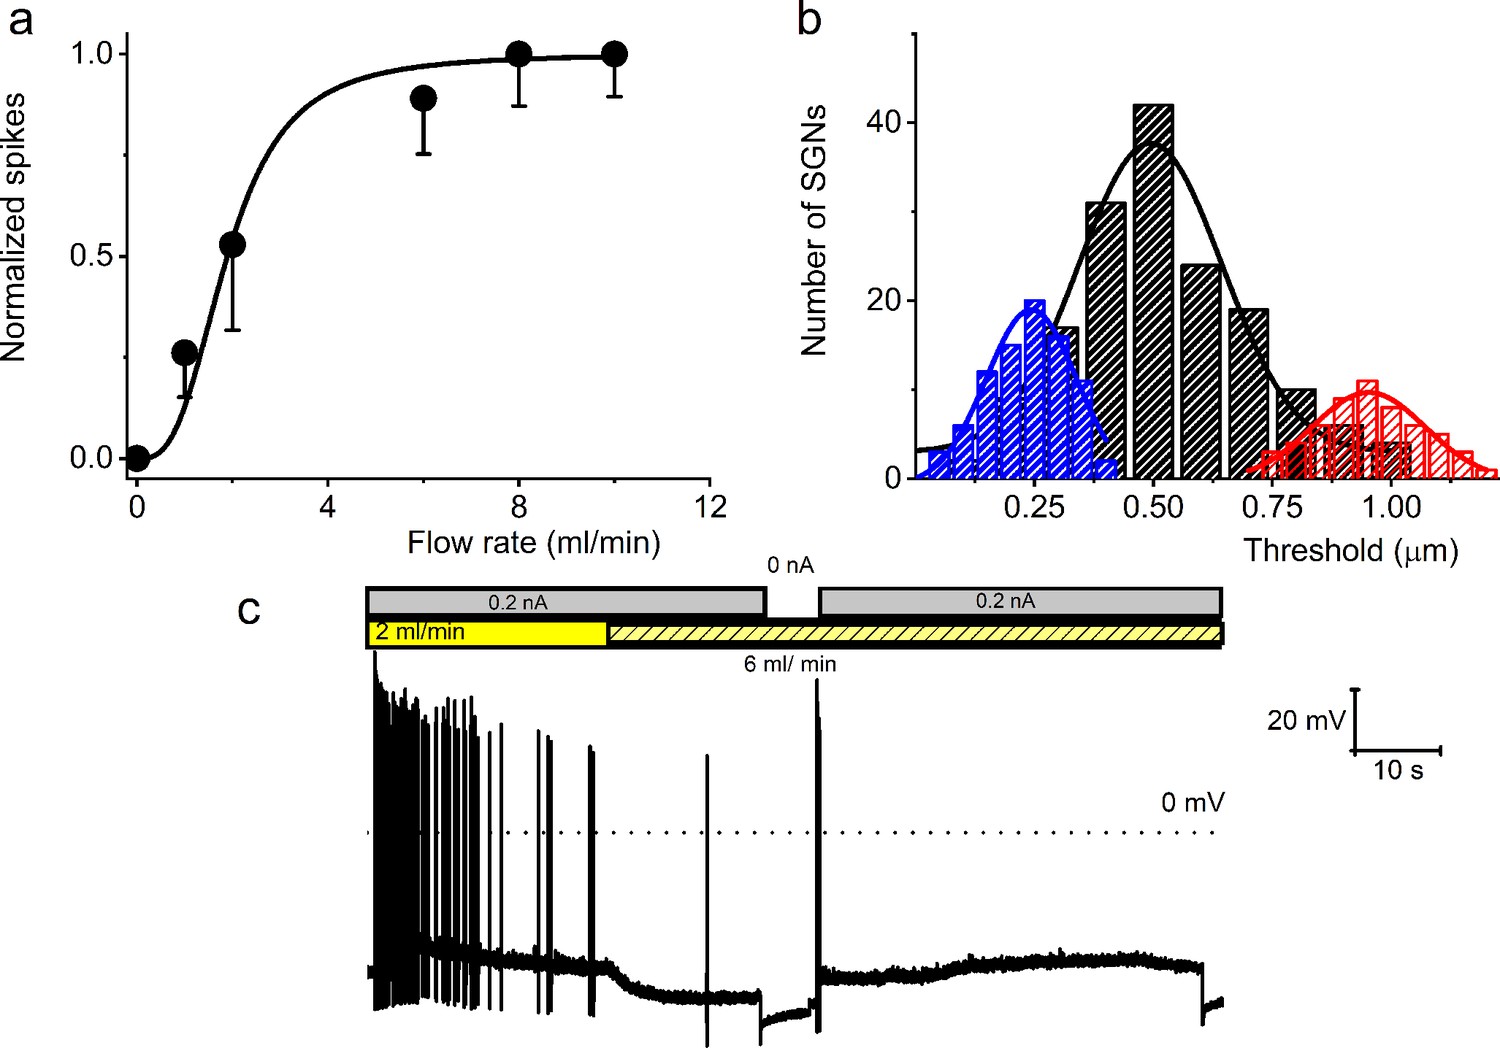
Effect of bath solution flow rate on the spiral ganglion neuron (SGN) firing rate.
(a) Summary data from four 8-week-old SGNs showing changes in normalized spike rate at different bath solution flow rates. The normalized spike rate saturated at ~8 ml/min. (b) Cumulative binomial distribution of the mechanical threshold (mean cell-body displacement in μm) to elicit action potentials (APs) in mechanically sensitive SGNs. Three distinct peaks were observed: 0.24 ± 0.01, n = 85 (blue); 0.51 ± 0.01, n = 164 (black); and 0.95 ± 0.02, n = 56 (red). (c) A membrane response of an 8-week-old apical SGN at a current injection of 0.2 nA and perfusion flow rates of 3 and 6 ml/min. The shift from slow (3 ml/min) to fast (6 ml/min) rate caused membrane hyperpolarization and reduced spike activity.
-
Figure 1—figure supplement 1—source data 1
Effects of bath flow rate on SGN response properties.
- https://cdn.elifesciences.org/articles/74948/elife-74948-fig1-figsupp1-data1-v2.xls
Figure 1—figure supplement 2
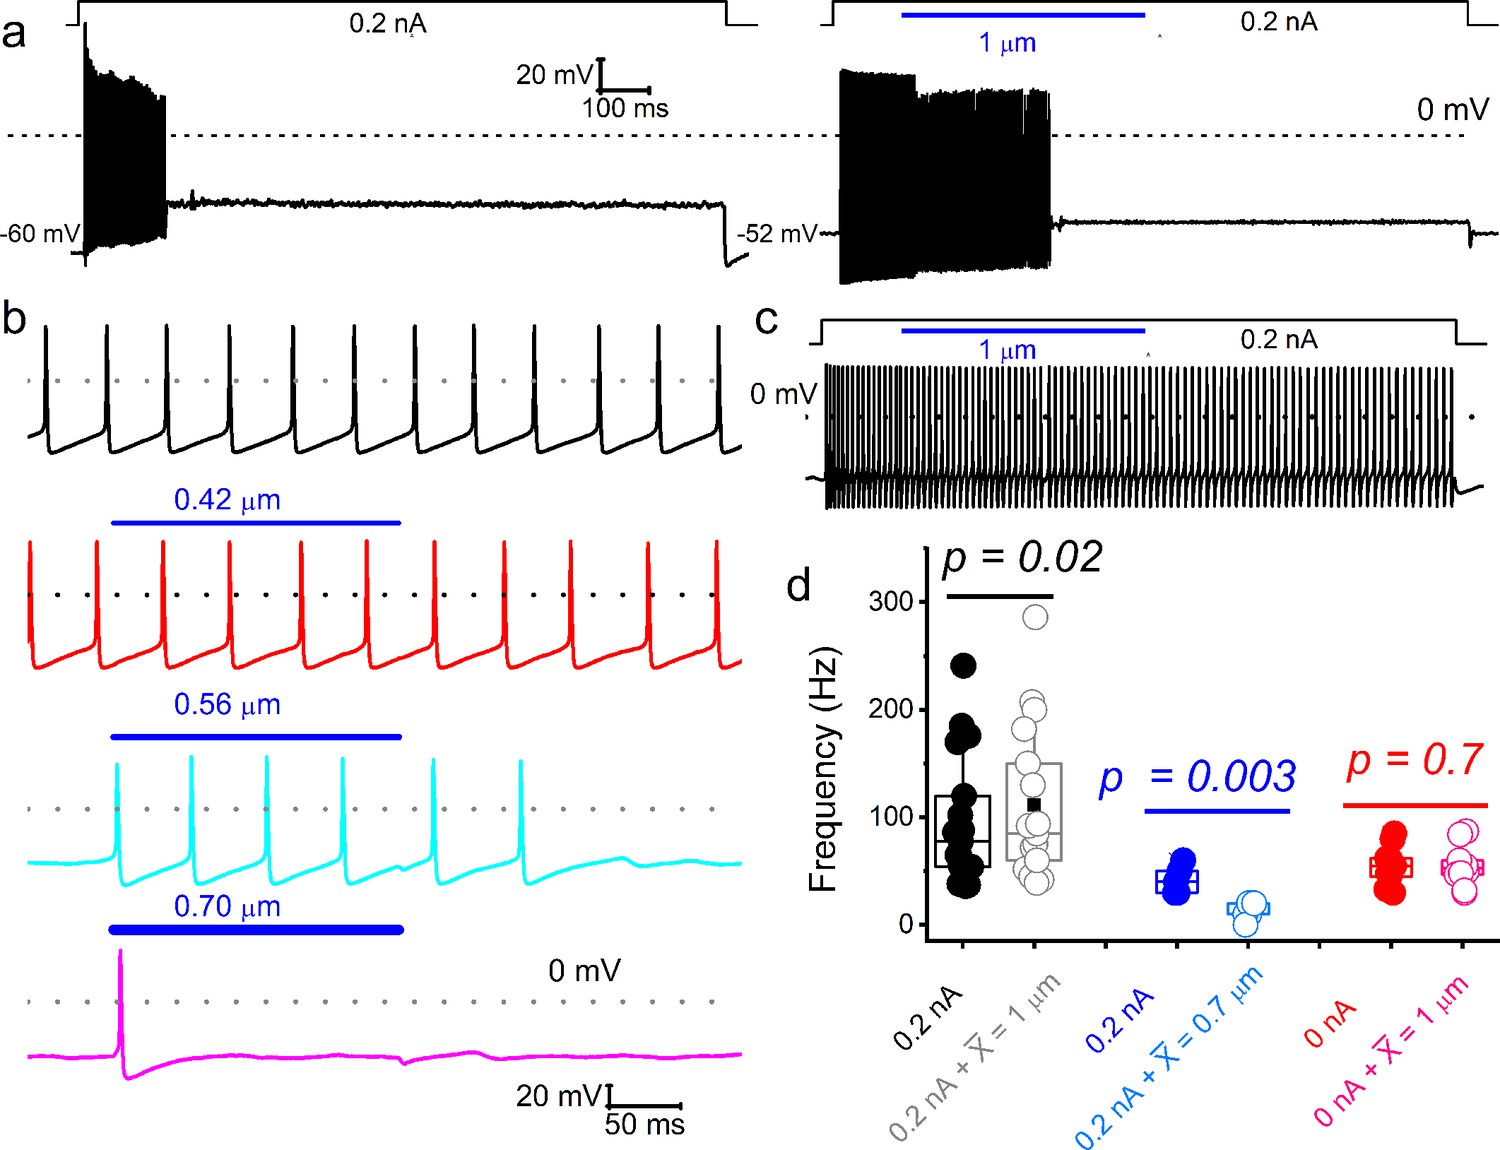
Varied responses to combined mechanical and electrical stimulation of spiral ganglion neurons (SGNs).
Representative current-clamp responses evoked by current injection and combined mechanical displacement (blue) were applied in soma displacement (1 μm). (a) Shown is an example of a basal SGN response injected with a 0.2 nA current alone (left panel) to invoke firing responses, which were subsided despite maintained current injection. When both stimuli are applied simultaneously (right panel), the firing rate increases. Note that the spike activity halted before ending the mechanical displacement. Vrest shifted by ~8 mV in depolarizing direction, in the right trace, which may account for the spike amplitude reduction. The firing rate increased in many (~38%; 12 out of 32 SGNs) adapting neurons when the current injection was combined with mechanical displacement. (b) In spontaneously active SGNs, gradual increase (0–0.7 μm; see lower panels) in dendritic substrate displacement resulted in reduced spike rate (31%; 10 out of 32 SGNs). (c) For this non-adapting basal neuron, the firing rate remained unchanged (~31%; 10 out of 32 SGNs). (d) Summary data, showing the response properties of SGNs to current alone and combined current and mechanical displacement (indicated). Data are grouped into SGN subgroups in which paired current and mechanical displacement resulted in increased (black symbols), reduced (blue), and unaltered (red) spike frequencies.
-
Figure 1—figure supplement 2—source data 1
Combined current and mechanical stimulation of SGNs.
- https://cdn.elifesciences.org/articles/74948/elife-74948-fig1-figsupp2-data1-v2.xls
Figure 1—figure supplement 3
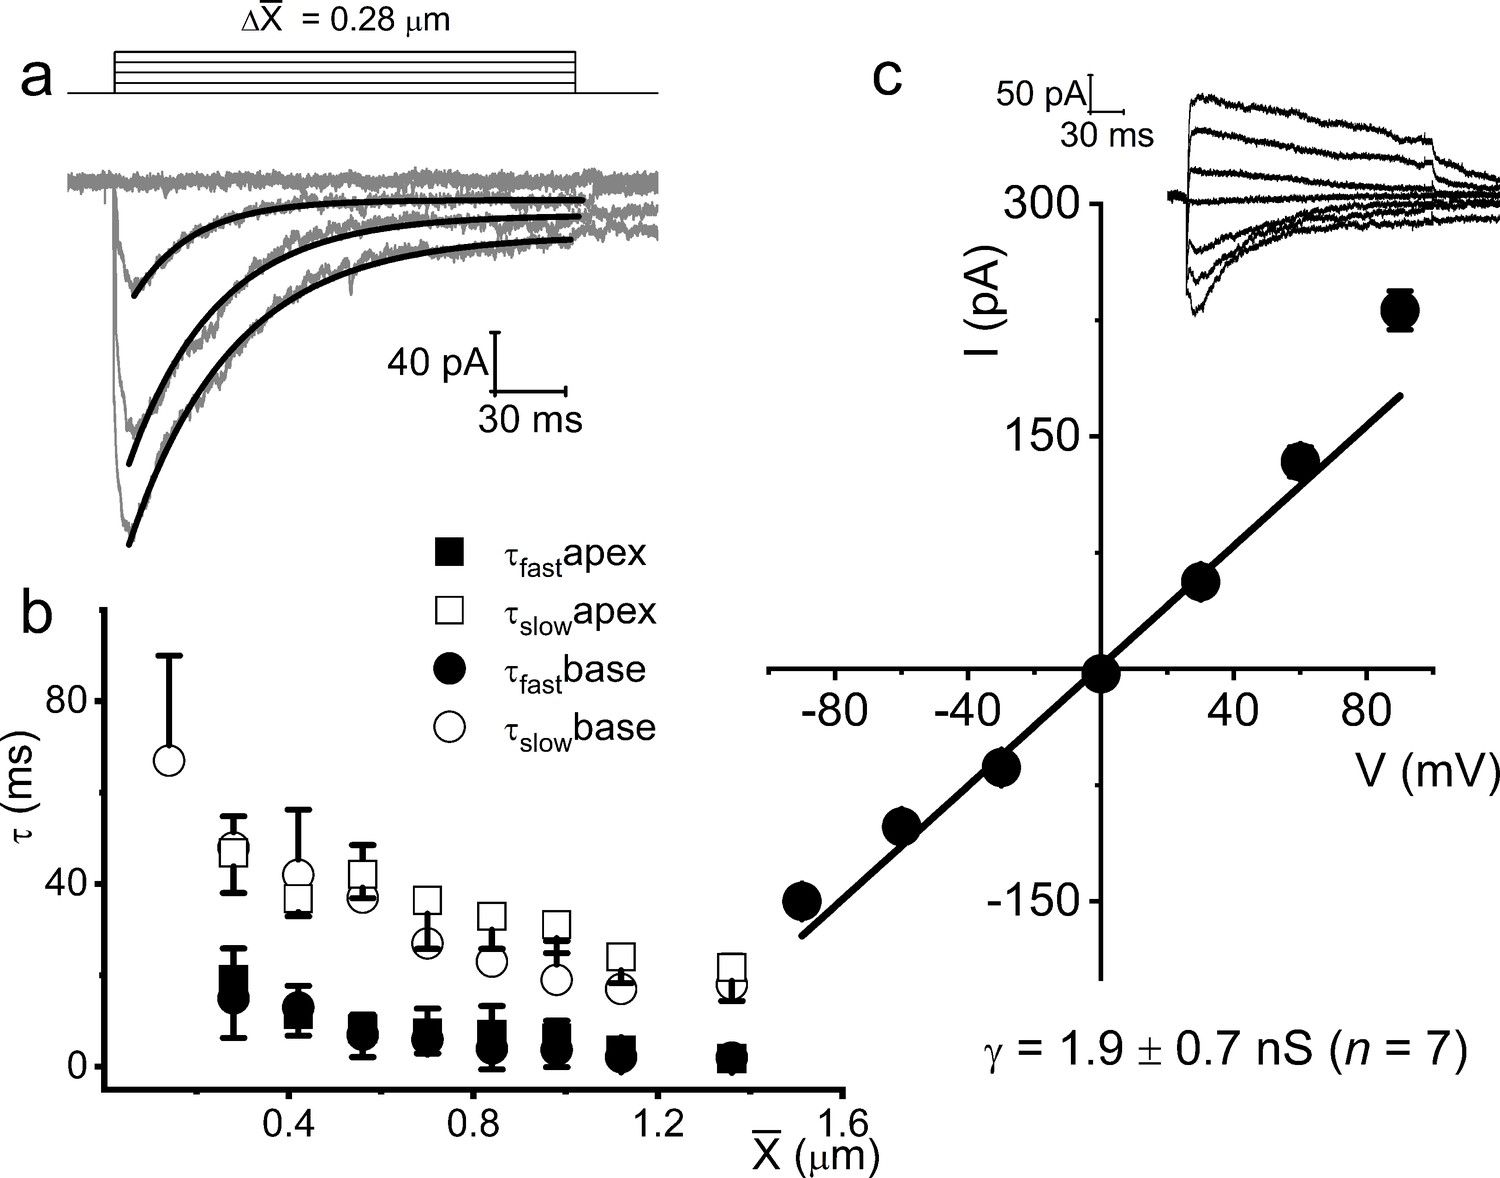
Displacement-clamp current recordings from 8-week-old adult spiral ganglion neurons (SGNs).
(a) Current traces (dark gray) in response to ~215 ms mechanical stimulus steps of ~0.28 μm increments in SGNs from the basal cochlear turn in the mouse. The holding potential was –70 mV. The solid black lines represent the double exponential fits for the current decay kinetics. (b) Summary data of the decay time constant (τ) as a function of displacement for (X) for currents recorded from SGNs from apical (n = 17) and basal (n = 15) cochleae. (c) Shown is the average I-V relationship of mechanically activated (MA) currents evoked at different membrane potentials (−90 to 90 mV), using ~0.4 μm displacement. The regression line indicates an MA current reversal potential (EMA) of –2.7 ± 2.1 mV (n = 13). The inset shows an example of representative MA current (IMA) traces with membrane voltages stepped in 30 mV increments, from –90 to 90 mV.
-
Figure 1—figure supplement 3—source data 1
Displacement-clamp of SGNs.
- https://cdn.elifesciences.org/articles/74948/elife-74948-fig1-figsupp3-data1-v2.xls
Figure 1—figure supplement 4
Chinchilla primary auditory neurons are equally mechanically sensitive.
(a) Response properties (from left to right: fast, medium, and slow adapting) of three different chinchilla spiral ganglion neurons (SGNs) to 0.2 nA square pulse injection (upper panel, green) and 0.3 μm soma displacement (lower panel, magenta). Note that the responses to mechanical displacement and current injection differed greatly. (b) Current traces of an SGN soma (apical cochlear turn) in response to displacement-clamp stimuli from 0 to 1.2 μm in ~0.24 μm, at a holding potential of –70 mV. (c) Displacement-response relationship of apical SGNs (n = 9), same as Figure 1e, but for chinchilla; X0.5 is 0.49 ± 0.05 μm (vertical dashed line). (d) Average I-V relationship of MA currents. Holding voltages range from –90 to 90 mV in increments of 30 mV; the inset shows IMA traces at different holding voltages for a soma displacement of 0.4 μm. The regression line through the data points indicates an EMA of 8.1 ± 5.5 mV (n = 5) and a whole-cell conductance of 1.4 ± 0.6 nS (n = 5).
-
Figure 1—figure supplement 4—source data 1
Chinchilla auditory neurons are mechanically sensitive.
- https://cdn.elifesciences.org/articles/74948/elife-74948-fig1-figsupp4-data1-v2.xls
Figure 1—figure supplement 5
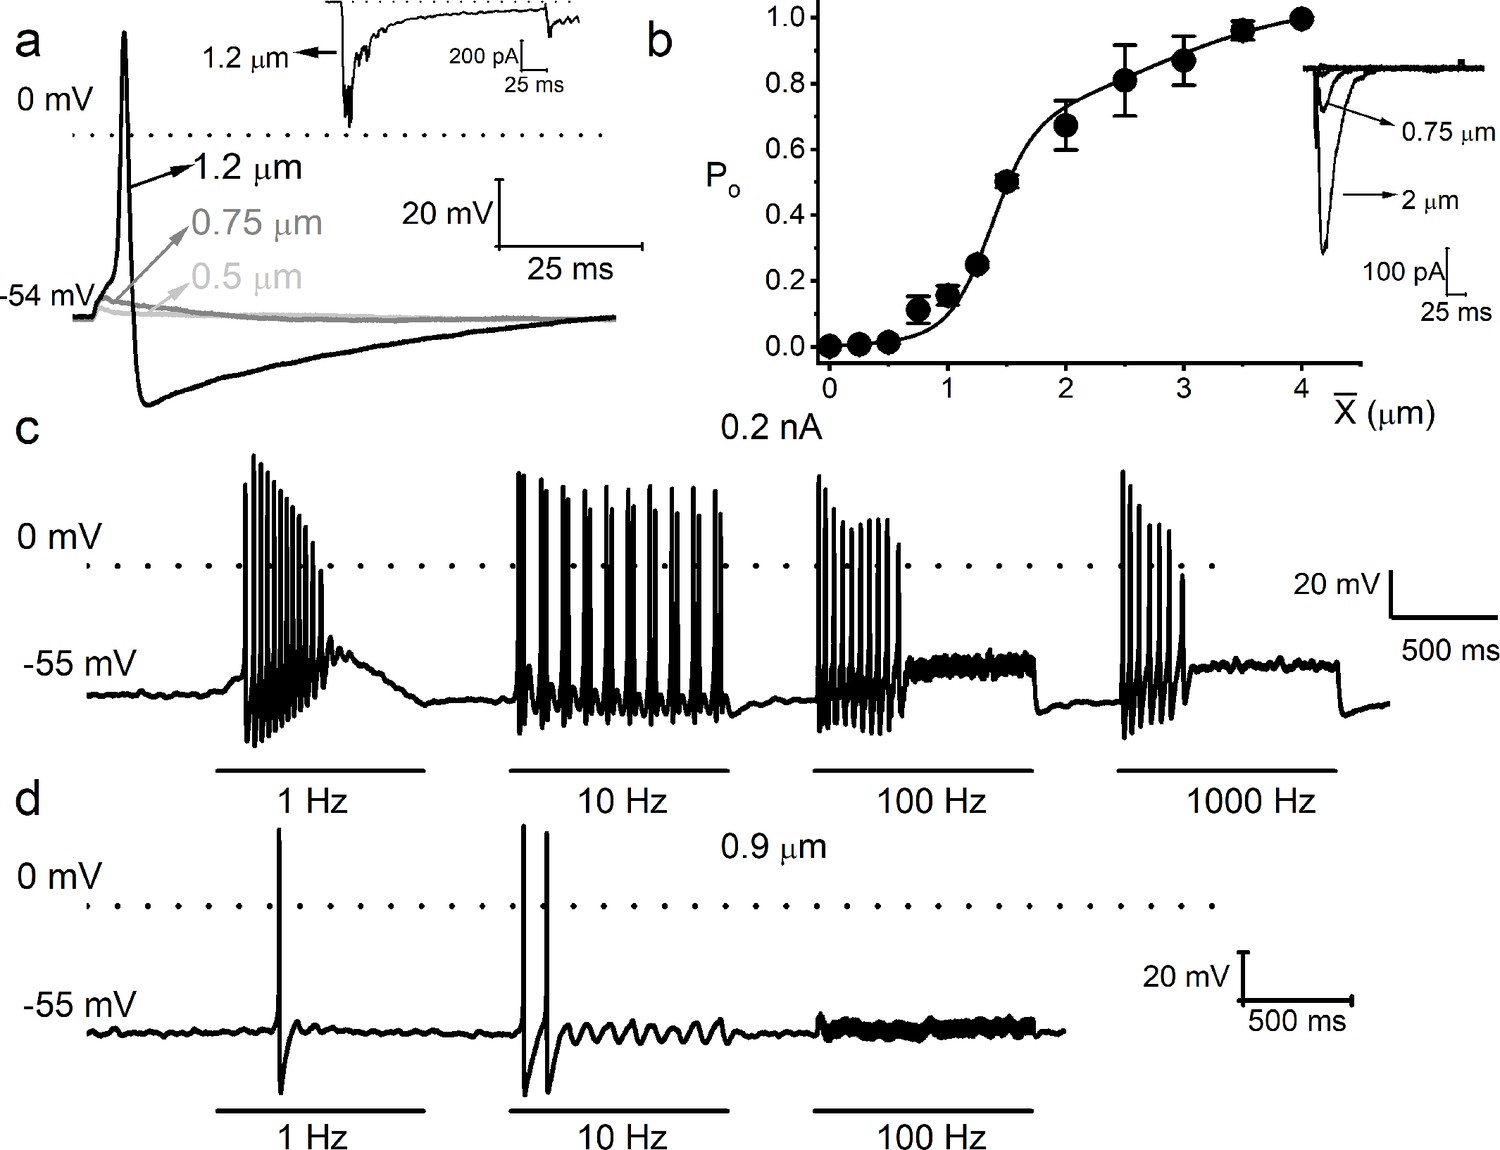
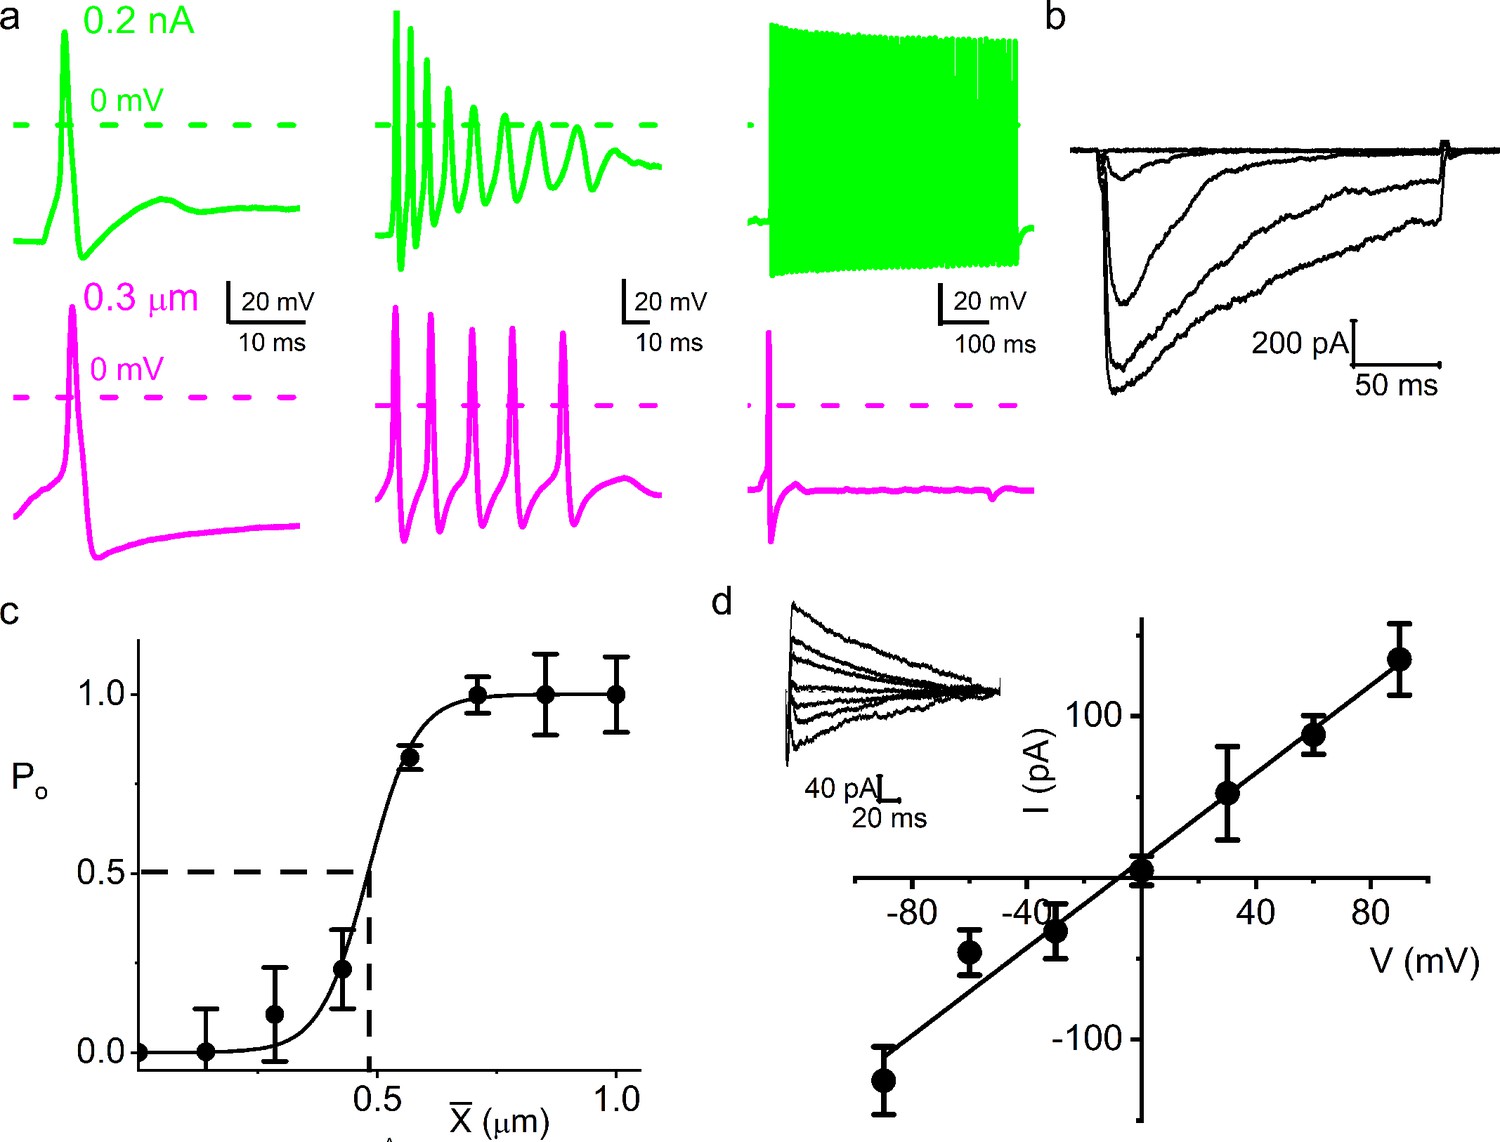
Mechanical sensitivity of mouse vestibular ganglion neurons.
(a) Response properties of a 6-week-old mouse vestibular neuron to square pulse mechanical displacements. The magnitudes of the displacement at the soma are indicated. The dotted line denotes 0 mV, and the resting membrane potential (Vrest) is indicated. The inset shows the inward current generated from the same neuron in voltage-clamp mode at –70 mV holding voltage. (b) Summary data of displacement-response relationship of IMA represented as channel open probability (Po) as a displacement function, fitted by a two-state Boltzmann function. The one-half-maximum displacements (X0.5) were 1.37 ± 0.10 μm and 2.60 ± 0.97 (n = 7). Inset shows example traces elicited in a mouse vestibular neuron. (c) Eight-week-old vestibular neurons were injected with sinusoidal current with 0.2 nA peak-to-peak amplitude and varying frequencies (in Hz, 1, 10, 100, and 1000). (d) Mechanical displacements were applied to the same cell using similar oscillatory frequencies with a peak-to-peak amplitude of ~0.9 μm to elicit action potentials (APs). Only rates at 1 and 10 Hz sufficed to elicit spikes.
-
Figure 1—figure supplement 5—source data 1
Mouse auditory neuron response properties to mechanical stimuli.
- https://cdn.elifesciences.org/articles/74948/elife-74948-fig1-figsupp5-data1-v2.xls
Figure 1—figure supplement 6
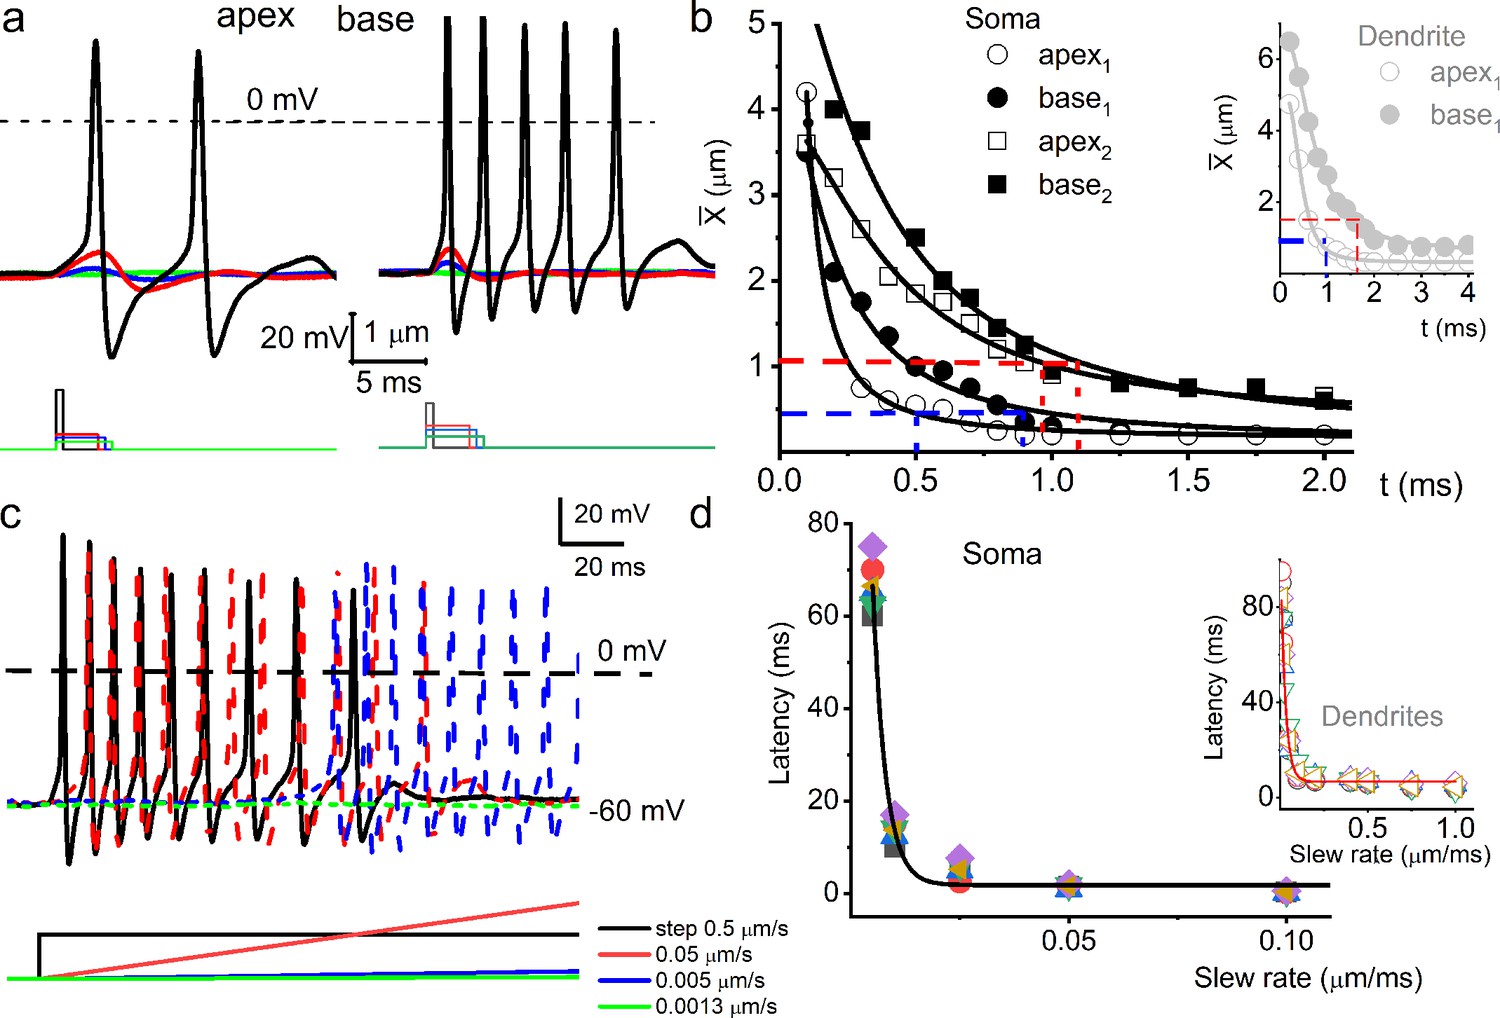
Response properties of adult mouse spiral ganglion neurons (SGNs) to mechanical stimulation.
(a) Membrane voltage responses to the cell-body displacement, from apical (left panel) and basal (right panel) cochlear neurons. As indicated, the amplitude and duration of soma displacement were in the form of rectangular steps. The amplitude and duration for the left panel (apical SGN) were as follows (in μm and ms), 2 and 0.5 (black); 0.5 and 3 (red); 0.4 and 3.5 (blue); 0.25 and 4 (green). The amplitude and duration for the right panel (basal SGN) were as follows (in μm and ms), 1 and 0.5 (black); 0.5 and 3 (red); 0.4 and 3.5 (blue); 0.25 and 4 (green). (b) A plot of mean rheobase using soma displacement of apical and basal neurons and their respective chronaxie indicated in red and blue dashed lines. The inset shows the mean rheobase displacement of dendritic substrate for SGNs from the cochlea’s apex and the base. (c) Family of action potentials (APs) evoked using step displacement (0.5 μm) and varying slew rates, indicated by color codes. The differences in latency of AP initiation are visible. (d) The plot shows the relation between AP latency and the slew rate of mechanical displacement (n = 5). AP latency using the indirect movement of dendrites through substrate displacement at varying slew rates for four SGNs is plotted as inset.
-
Figure 1—figure supplement 6—source data 1
Mouse SGN responses to mechanical sinuisodal stimuli.
- https://cdn.elifesciences.org/articles/74948/elife-74948-fig1-figsupp6-data1-v2.xls
Figure 1—figure supplement 7
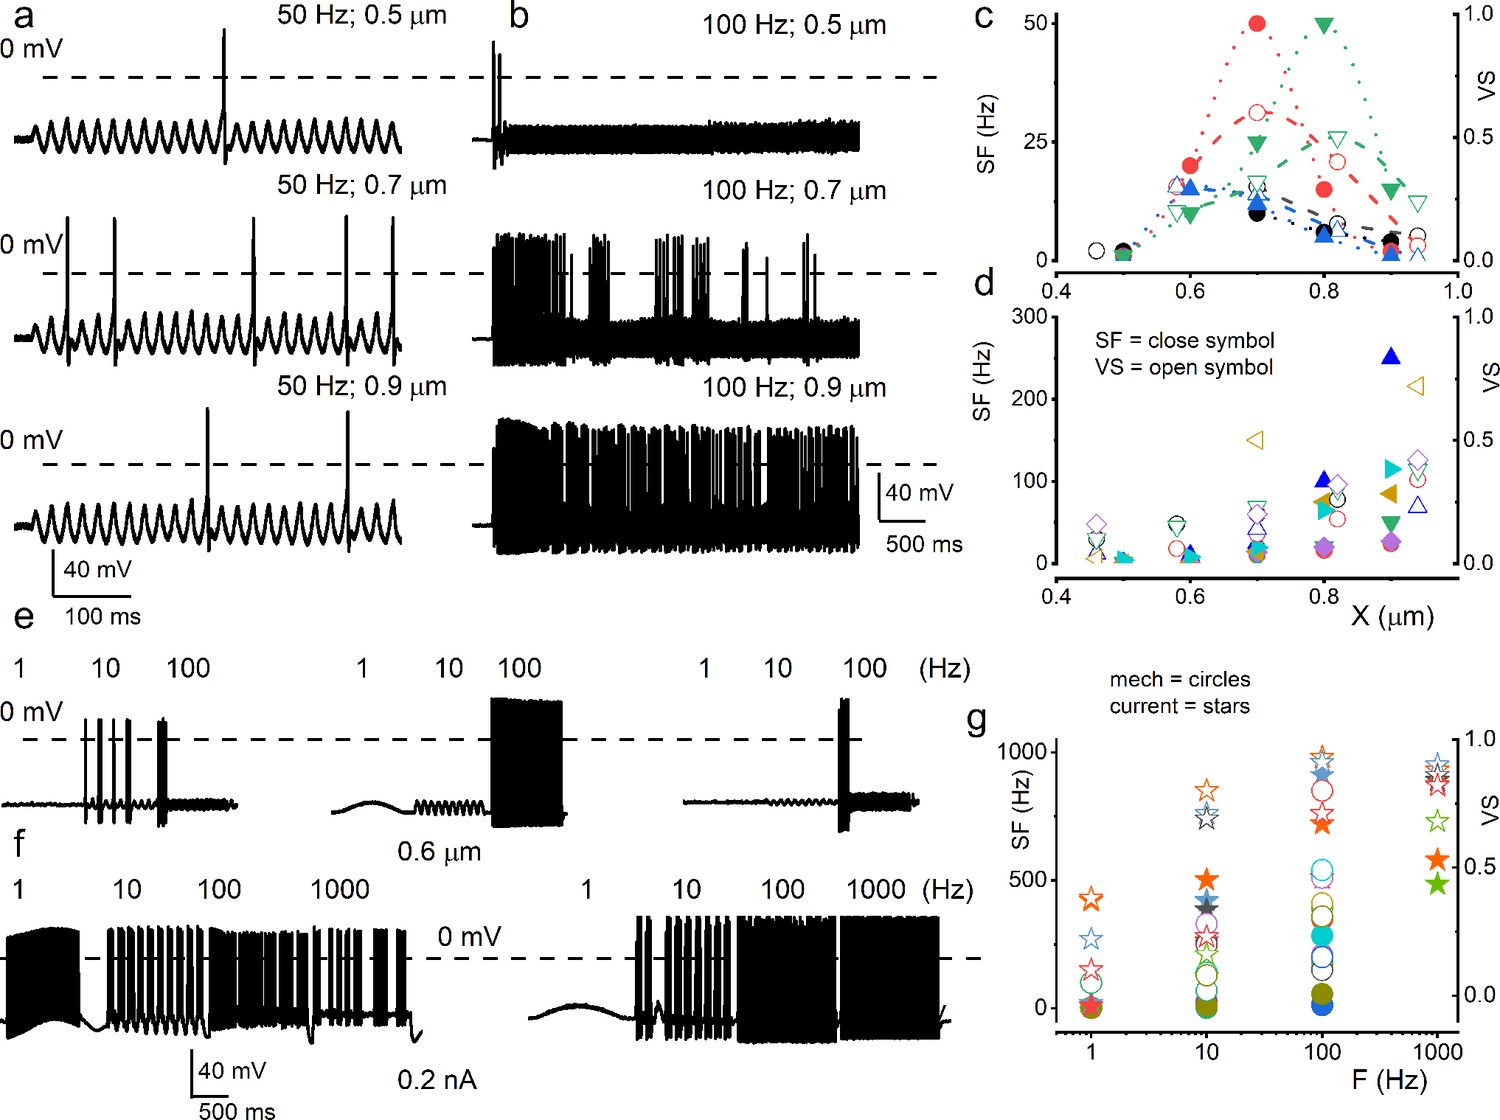
Mouse spiral ganglion neuron (SGN) response properties to sinusoidal mechanical and current stimulation.
(a) Characteristic apical SGN stimulated with 0.5 μm mechanical displacement at 50 Hz. Subsequent traces below show the responses with 0.7 and 0.9 μm sine wave displacements at 50 Hz. (b) Another apical SGN presented with 0.5 mm mechanical displacement at 100 Hz and increased stimulus amplitudes. The data represent SGNs that elicit increasing action potentials (APs) frequency with increasing mechanical displacement amplitude (b) and ones that show peak firing at specific displacement amplitude (a). (c–d) Summary data of the two sets of SGNs, showing the relationship between displacement amplitude, spike frequency (SF; in solid symbols), and vector strength (VS; in open symbols). Each symbol represents a different SGN (c) n = 4; (d n = 6). (e) Exemplary three different basal SGN stimulated with constant displacement (0.6 μm) at 1, 10, and 100 Hz. When presented with a constant displacement, neurons appeared to respond at a narrow frequency range (1–100 Hz), contrasting to current injection (1–1000 Hz) (f). (g) Summary data show the relationship between displacement or current frequency, SF (in solid circles), and VS (in open circles). Each symbol represents a different SGN (n = 6). Data from the current injection are represented with star symbols (n = 5).
-
Figure 1—figure supplement 7—source data 1
Combined current and mechanical sensitive of mouse SGNs.
- https://cdn.elifesciences.org/articles/74948/elife-74948-fig1-figsupp7-data1-v2.xls
Figure 2 with 1 supplement

Mechanical stimulation of spiral ganglion neuron (SGN) cell body increased sensitivity to current injection and affected phase locking.
(a) (Upper panel) Shown is a schematic diagram of the SGN and projections to inner hair cells (IHCs) and outer hair cells (OHCs). The myelinated and unmyelinated segments and nerve fibers are indicated. The heminode, the action potential (AP) initiation site, is labeled. (Lower panel) Horizontal section of whole-mount intact SGNs and HCs of a 5-week-old mouse cochlea, showing neuron (in red, anti-TUJ1) and myelin (in cyan, anti-myelin basic protein). The white dashed line shows the expected location of the basilar membrane. HCs are in green (anti-Myo7a). Note that the nerve terminals are devoid of myelin. Scale bar = 20 μm. (b) (Upper panel) Voltage response to combined subthreshold sinusoidal mechanical displacement (in magenta; 50 Hz, 0.1 μm, ~ 2 s) and subthreshold sinusoidal current injection (in green, 50 Hz, 0.05-nA, ~ 2 s), delivered in-phase. Current injection and mechanical displacement overlapped for ~1 s. Combined subthreshold mechanical and current stimulation evoked APs. (Lower panel) We show conditions similar to the upper panel, but subthreshold current injection preceded subthreshold mechanical displacement here. Subthreshold stimuli, when paired, became suprathreshold. (c–d) Spike rate, normalized to maximum, as a function of displacement (c), and current injection (d). The leading stimulus was primed with a subthreshold sinusoidal current or displacement, respectively. (e–f) The extent of sensitivity to current and displacement is represented as a plot of the half-maximum displacement (X0.5) and half-maximum current (I0.5) as a function of current and displacement. The slopes of the corresponding linear plots were, –1.4 μm/nA (n = 5) (e) and –0.5 nA/μm (n = 5) (f). (g) (Upper panel) Slowly adapting SGN response to 0.2 nA injection at 100 Hz, overlapping with a pre-determined threshold (0.3 μm displacement at 100 Hz) mechanical stimulus. For this example, the vector strength (VS) transitioned from 0.82 to 0.98 upon combined (current plus mechanical displacement) stimulation (see Table 1 for summary data). (Lower panel) Moderately adapting SGN, stimulated with the same stimuli as the upper panel, transitioned from VS of 0.72–0.82 (Table 1). (h) (Upper and lower panels) Stimulation of fast-adapting SGN in response to 100 Hz, a 0.3 μm displacement superimposed with 100 Hz 0.2 nA current injection. For the examples shown, the VS transitioned from unmeasurable to 0.94 for the upper panel and 0.9 for the lower panel. (i–j) A summary of VS changes when either current or displacement is used as a primer for concurrent stimulation (Figure 1, Table 1, Figure 1—figure supplement 7).
-
Figure 2—source data 1
SGN mechanical responses.
- https://cdn.elifesciences.org/articles/74948/elife-74948-fig2-data1-v2.xlsx
Figure 2—figure supplement 1
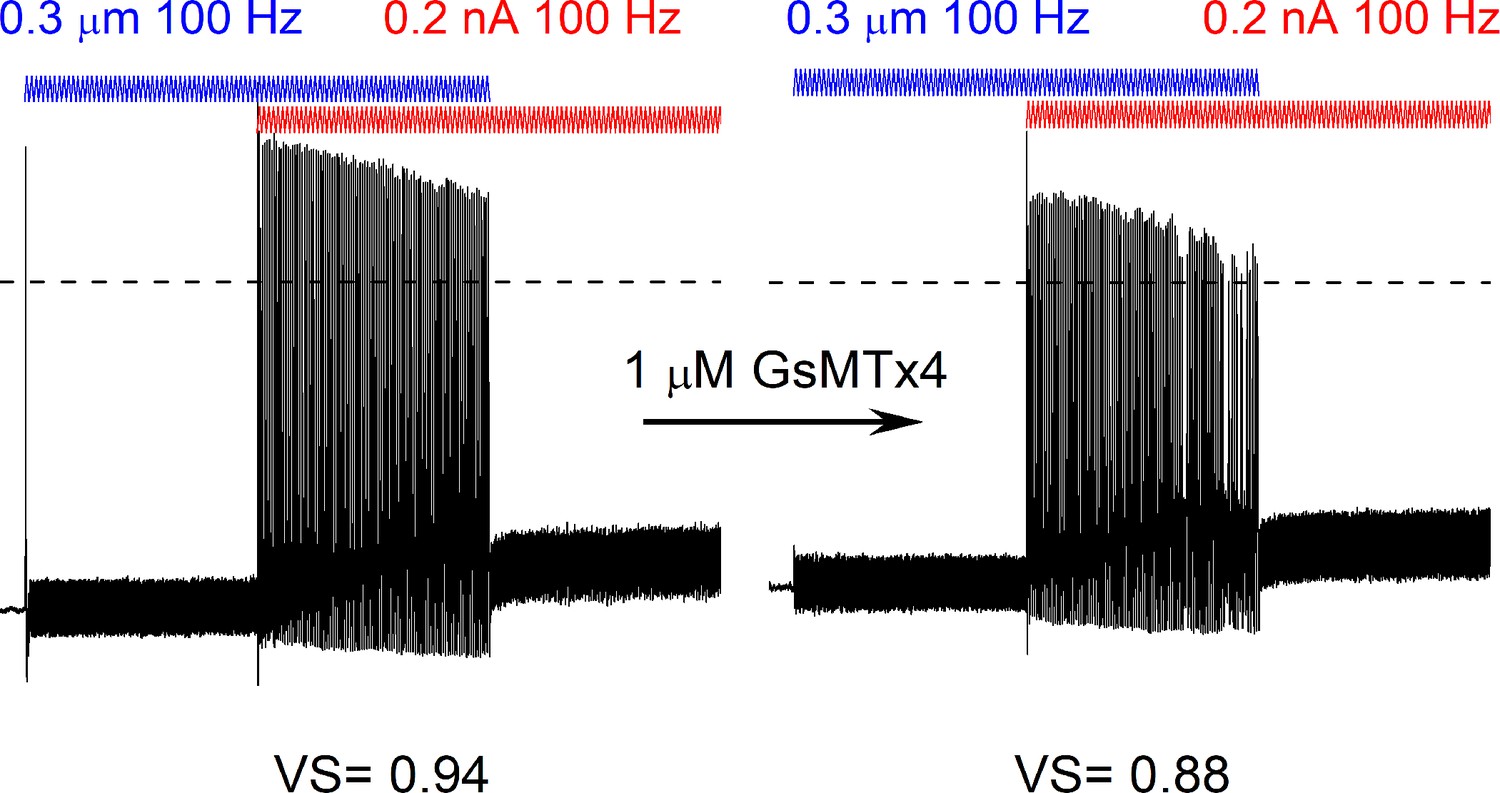
GsMTx4 reduced facilitation and spike timing after dual current injection and mechanical stimulation.
Bath perfusion of GsMTx4 (1 μM), decreased facilitation, and spike timing resulting in reduced vector strength (VS) of the response to the simultaneous application of 100 Hz mechanical displacement (0.3 μm, blue) and current injection (0.2 nA, red) in an 8-week-old spiral ganglion neurons (SGN).
-
Figure 2—figure supplement 1—source data 1
Combined mechanical and current stimuli in SGN and GsMTx4 effects.
- https://cdn.elifesciences.org/articles/74948/elife-74948-fig2-figsupp1-data1-v2.xls
Figure 3 with 3 supplements
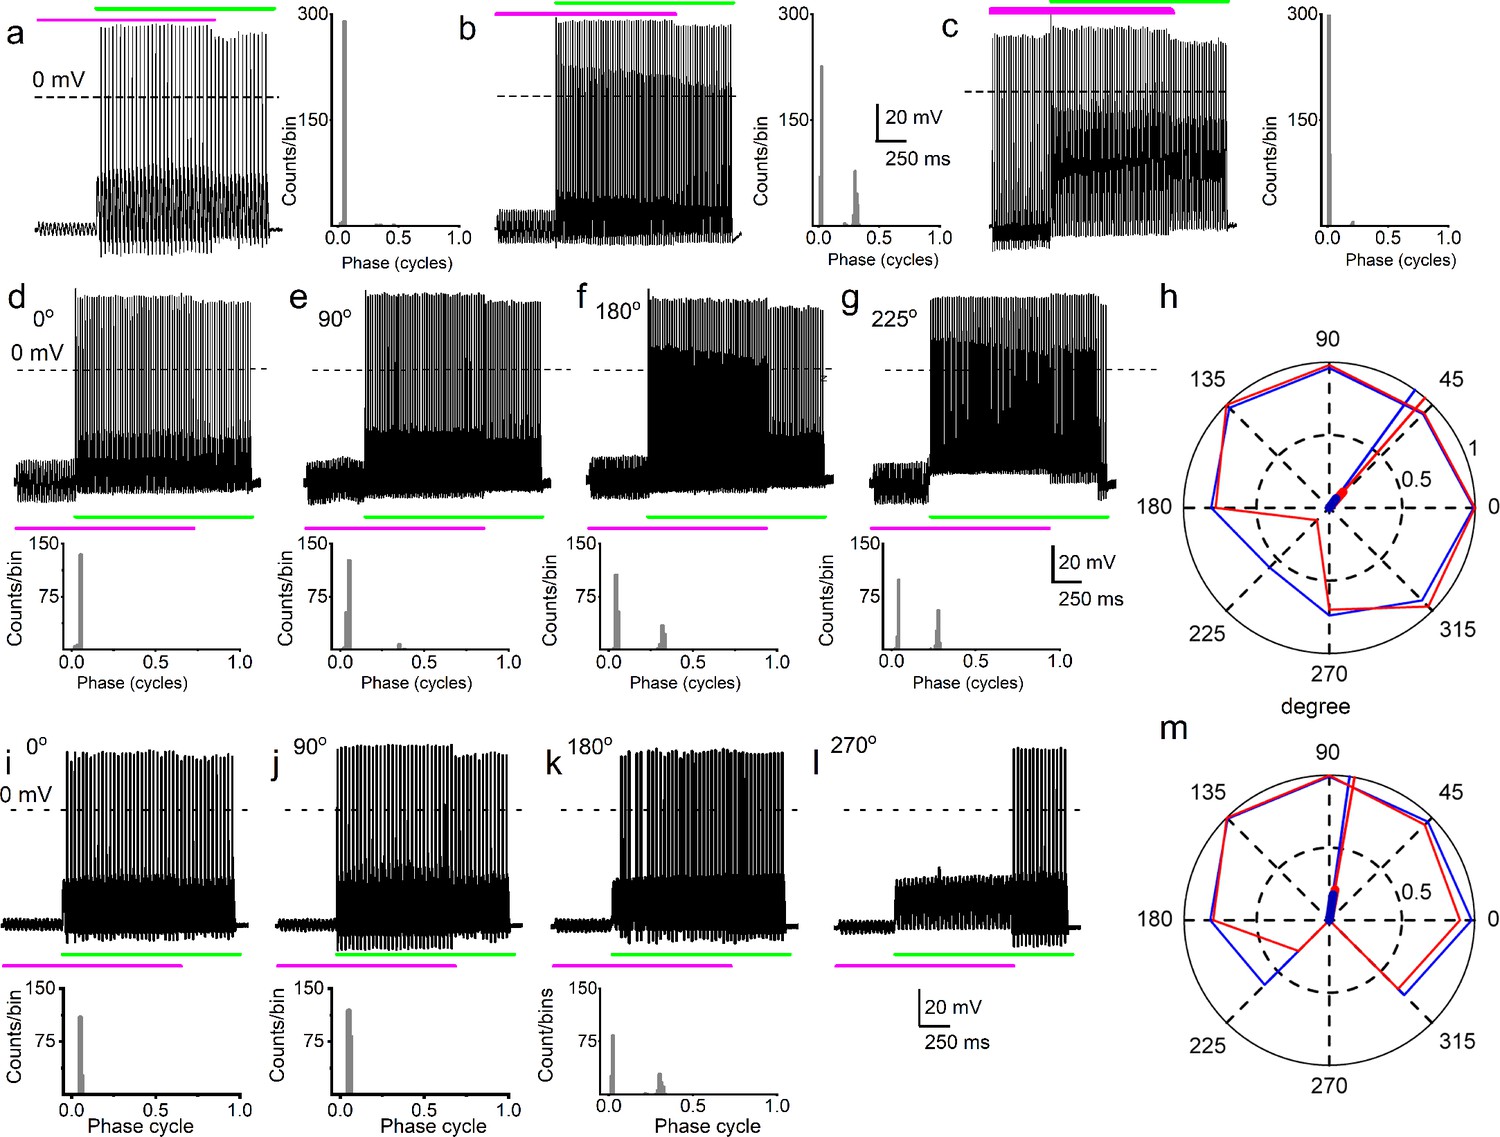
Simultaneous mechanical and electrical stimulation of spiral ganglion neurons (SGNs) can generate peak-splitting and rate suppression.
(a) SGN response properties and corresponding cycle histograms generated by simultaneous sinusoidal mechanical subthreshold displacement (0.1 μm, 50 Hz; magenta) and sinusoidal current injection (0.2 nA, 50 Hz; green). The relative phase angle of the two stimuli was at 0o. The amplitude criterion of a valid action potential (AP) was 0 mV (dashed line). (b, c) The cycle histograms transitioned to two peaks and back to one peak as the amplitude of mechanical displacement increased to 0.2 μm (b) and 0.3 μm (c). (d–g) Response properties and corresponding cycle histograms for the same SGN as in (a–c), but using different relative phase angles (0°, 90°, 180°, 225°) between mechanical displacement (0.15 μm) and current injection (0.3 nA). At 180° and 225° phase angles, two peaks are evident in the cycle histograms shown in the panels below. (h) Polar plot summarizing data averaged over three stimulus repetitions derived from the SGN illustrated in d–g. The angular scale specifies the phase lead of the current relative to the mechanical stimulus and the two data points at each of the eight angles plotted are derived from data as shown in individual panels d–g: average rate is shown in blue and is normalized to its maximum (listed in Table 3); VS is shown in red. The data are summarized with a vector (resultant of vectorial addition of data at eight angles) whose magnitude and angle are shown with thick and thin solid lines, respectively, using the same color code. The close angular alignment of the red and blue lines shows that a high firing rate is accompanied by strong phase locking, and vice versa that peak-splitting is associated with low firing rates. (i–l) Phase angle-dependent response reduction (180o), and suppression (270o) during combined stimulation for a different neuron. (m) A polar plot as in h but for the neuron illustrated in (i–l). Data for the polar plots spike rates, magnitude and phase of resultant vectors, and statistics are provided in Table 3.
-
Figure 3—source data 1
Combined current and mechanical stimuli and SGN peak splitting rate, and suppression.
- https://cdn.elifesciences.org/articles/74948/elife-74948-fig3-data1-v2.xlsx
Figure 3—figure supplement 1
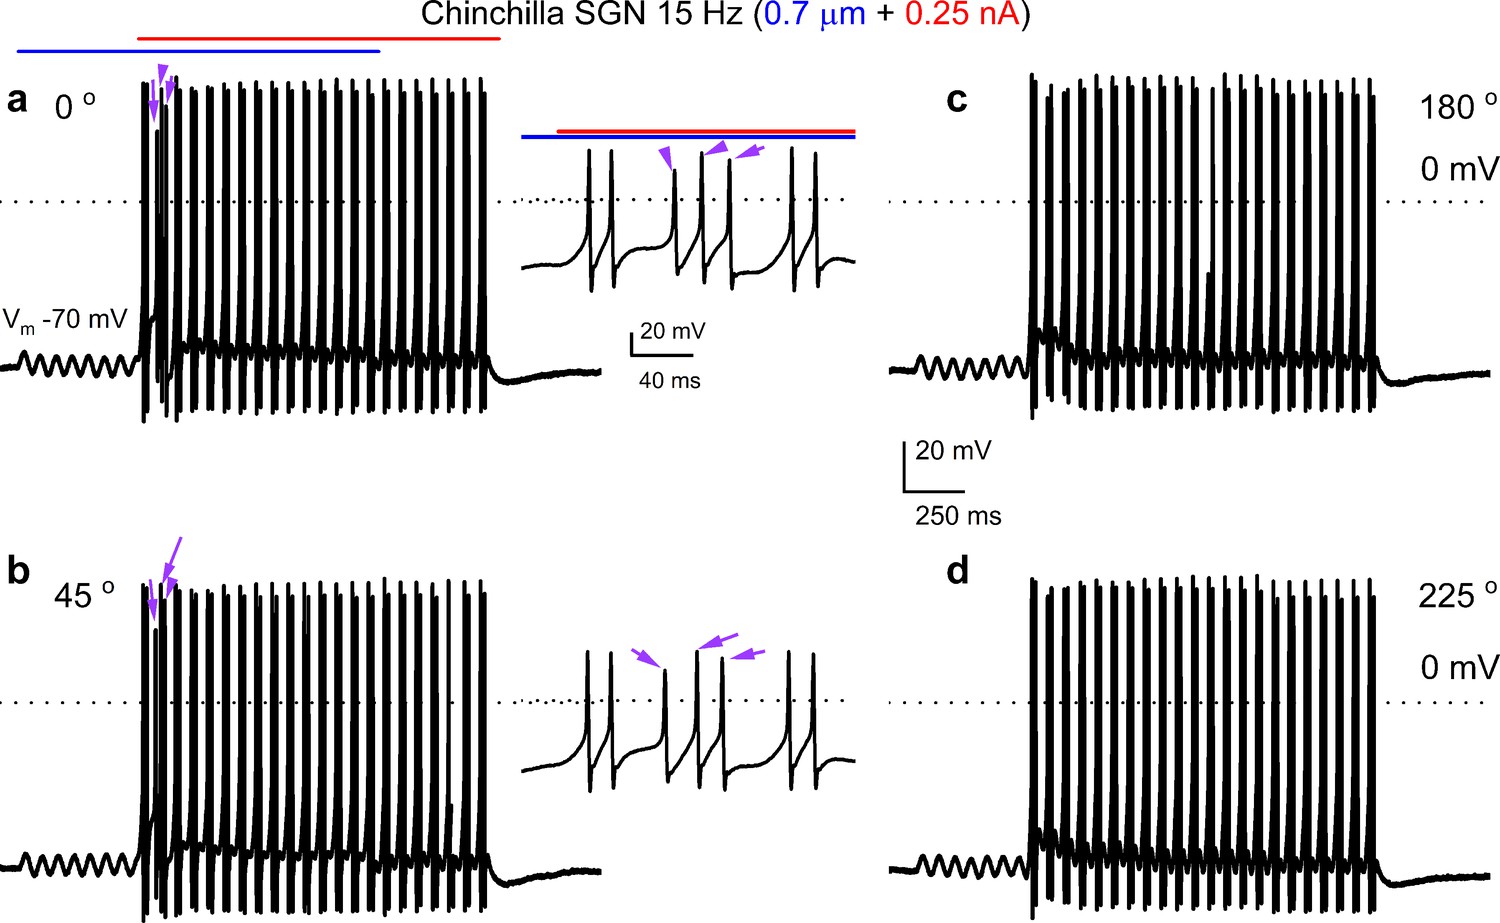
Combined displacement and current injection yield more than two action potentials per cycle in chinchilla spiral ganglion neurons (SGNs).
Shown are voltage responses of chinchilla SGNs evoked with sinusoidal (15 Hz) mechanical displacement (0.7 μm, in blue) combined with sinusoidal (15 Hz) current injection (0.25 nA, in red) at four different relative phase angles (a–d, 0°, 45°, 180°, 225°, respectively). Two action potentials were elicited per cycle for most cycles, which was the case for all four relative phase angles tested. A s seen in (a and b) the second cycle yielded three action potentials (purple arrows) for the 0°, and 45o relative phased angles (insets).
-
Figure 3—figure supplement 1—source data 1
Combined current and mechanical stimulation of SGN.
- https://cdn.elifesciences.org/articles/74948/elife-74948-fig3-figsupp1-data1-v2.xls
Figure 3—figure supplement 2
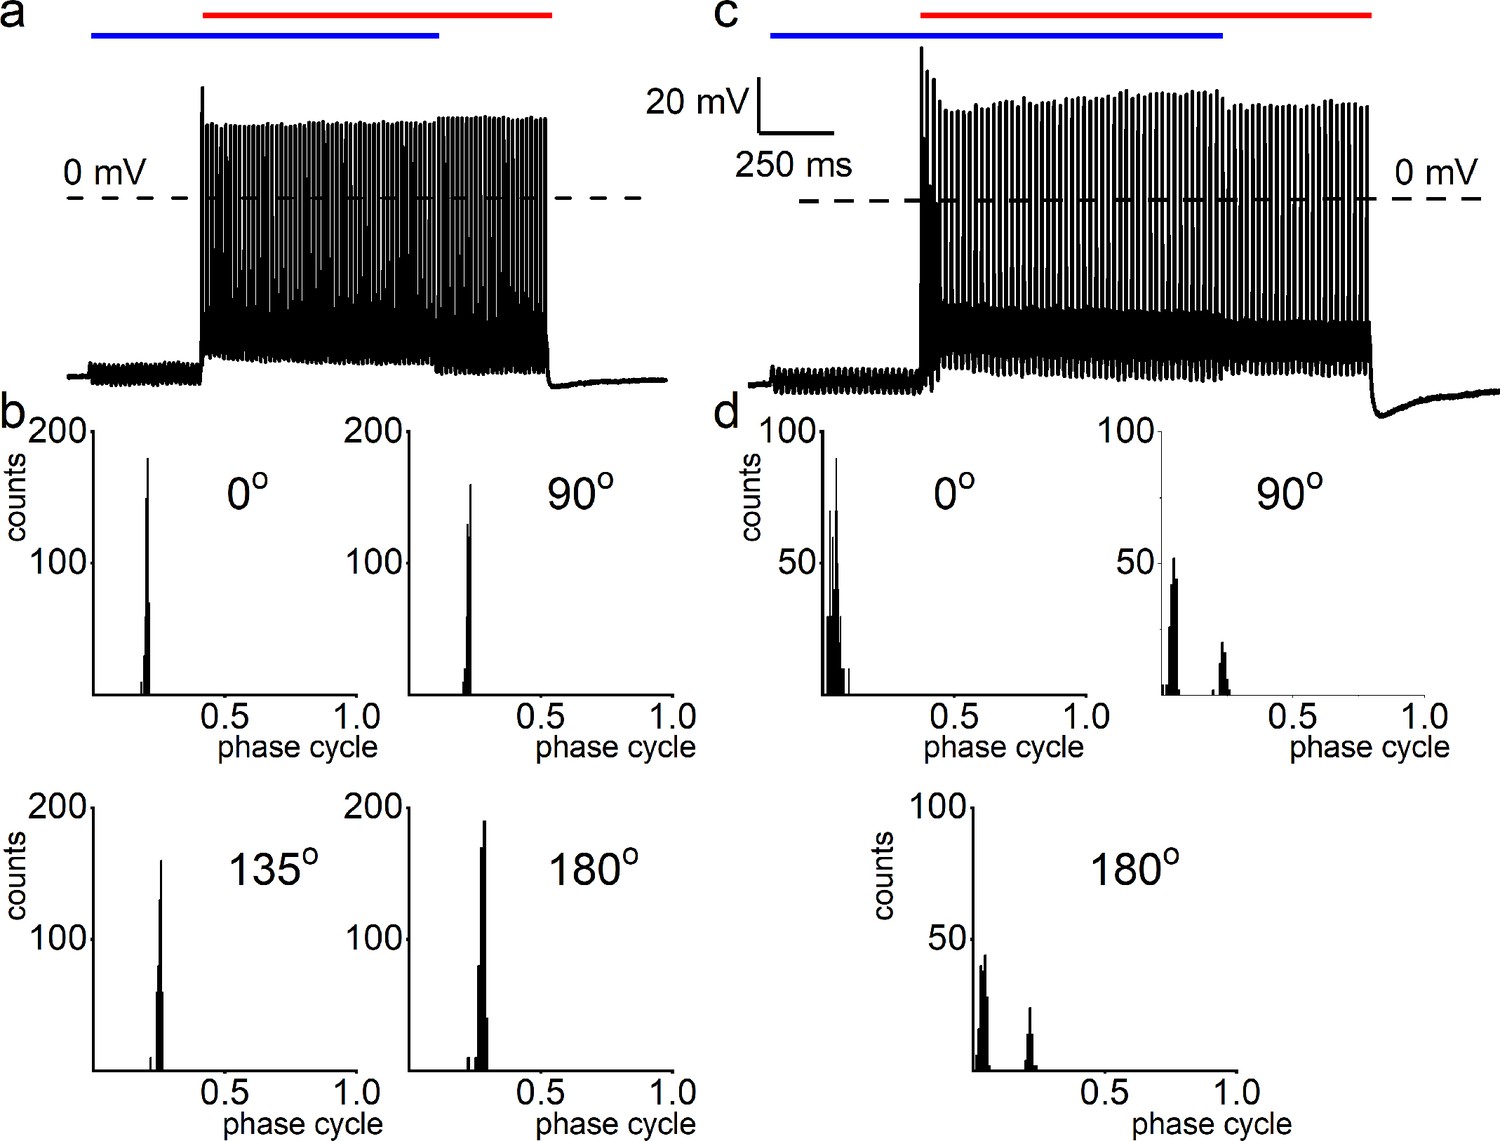
Mechanical sensitivity of chinchilla spiral ganglion neurons (SGNs).
(a) Response properties of chinchilla SGNs to sinusoidal current injection (50 Hz, amplitude, 0.2 nA) and cell-body sinusoidal mechanical displacement (50 Hz; amplitude, 0.3 μm), and overlap of the two stimuli at ~90o phase angle. (b) Cycle histograms of the same neuron for four relative phase angles, showing single-mode distributions with small changes in the response phase. (c) Example of chinchilla SGN exhibiting peak-splitting in the cycle histogram during combined cell-body mechanical displacement and current injection using 50 Hz sinusoidal stimuli. (d) Cycle histograms with two modes were obtained at 90o and 180o phase angles.
-
Figure 3—figure supplement 2—source data 1
Mechanical sensitivity of Chinchilla SGN.
- https://cdn.elifesciences.org/articles/74948/elife-74948-fig3-figsupp2-data1-v2.xls
Figure 3—figure supplement 3
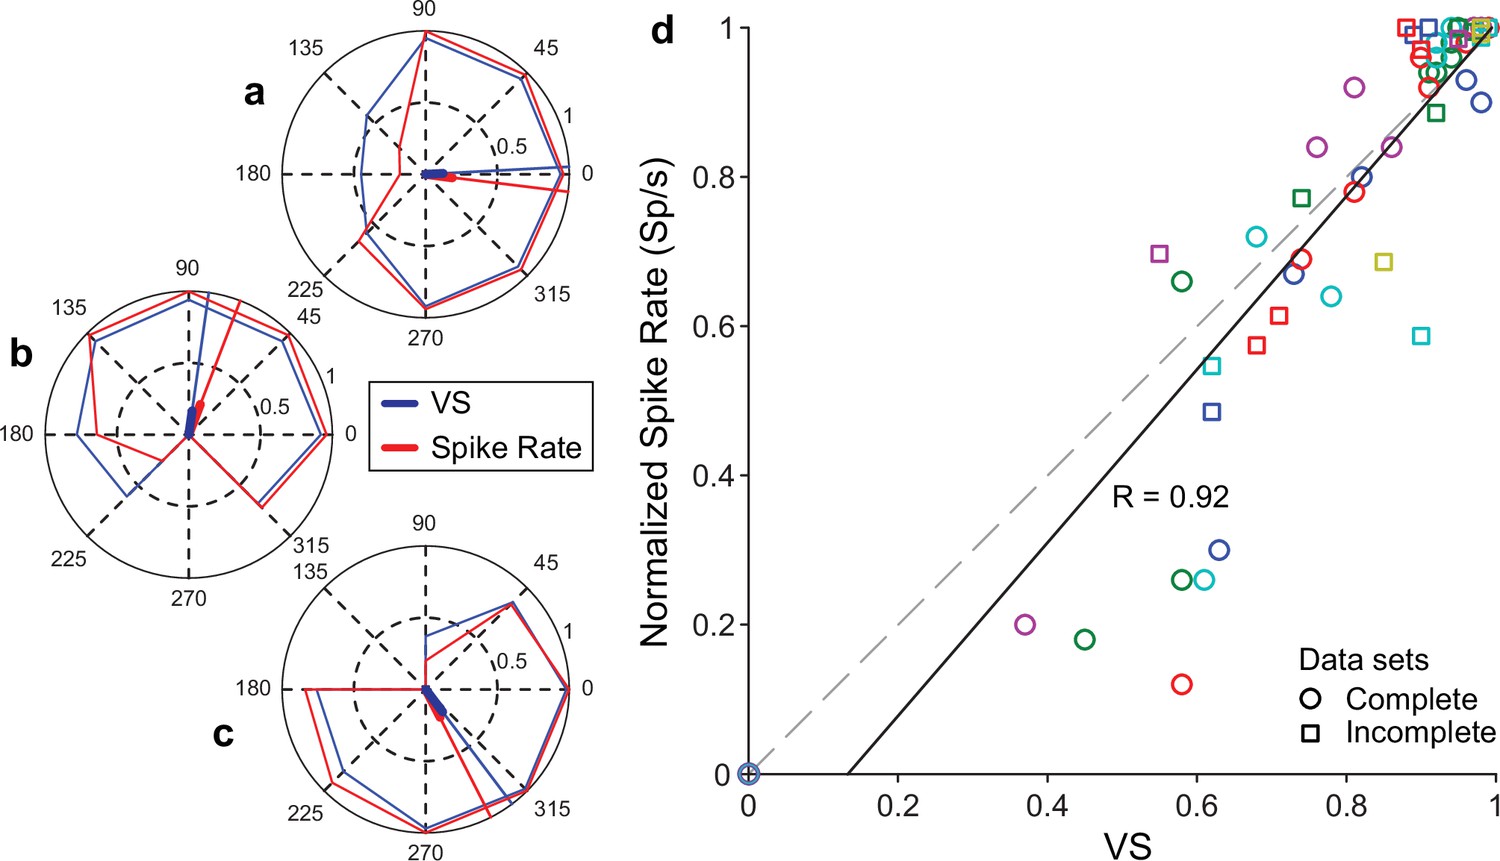
Additional examples of the relationship between firing rate and vector strength (VS) for different relative phase angles between mechanical and current stimulation.
(a–c) Polar plots for three neurons in which a full circle of relative phase angles was tested. Conventions as in Figure 3h and m. Magnitude and phase of resultant vectors and a maximal number of spikes and statistical significance are listed in Table 3. All polar plots differed significantly from uniform distributions. (d) The relationship between spike rate and VS for all tests, including incomplete datasets. Symbols with circles indicate complete measurement series (n = 5) (0°–315° in steps of 45°) with different colors indicating different experiments. Square symbols are from incomplete phase sets (n = 6, containing three or four phase measurements). The spike rates are normalized to the maximum within each series. The dashed line indicates unity, and the black line is the least-square fit, with R the Pearson correlation.
Figure 4 with 1 supplement
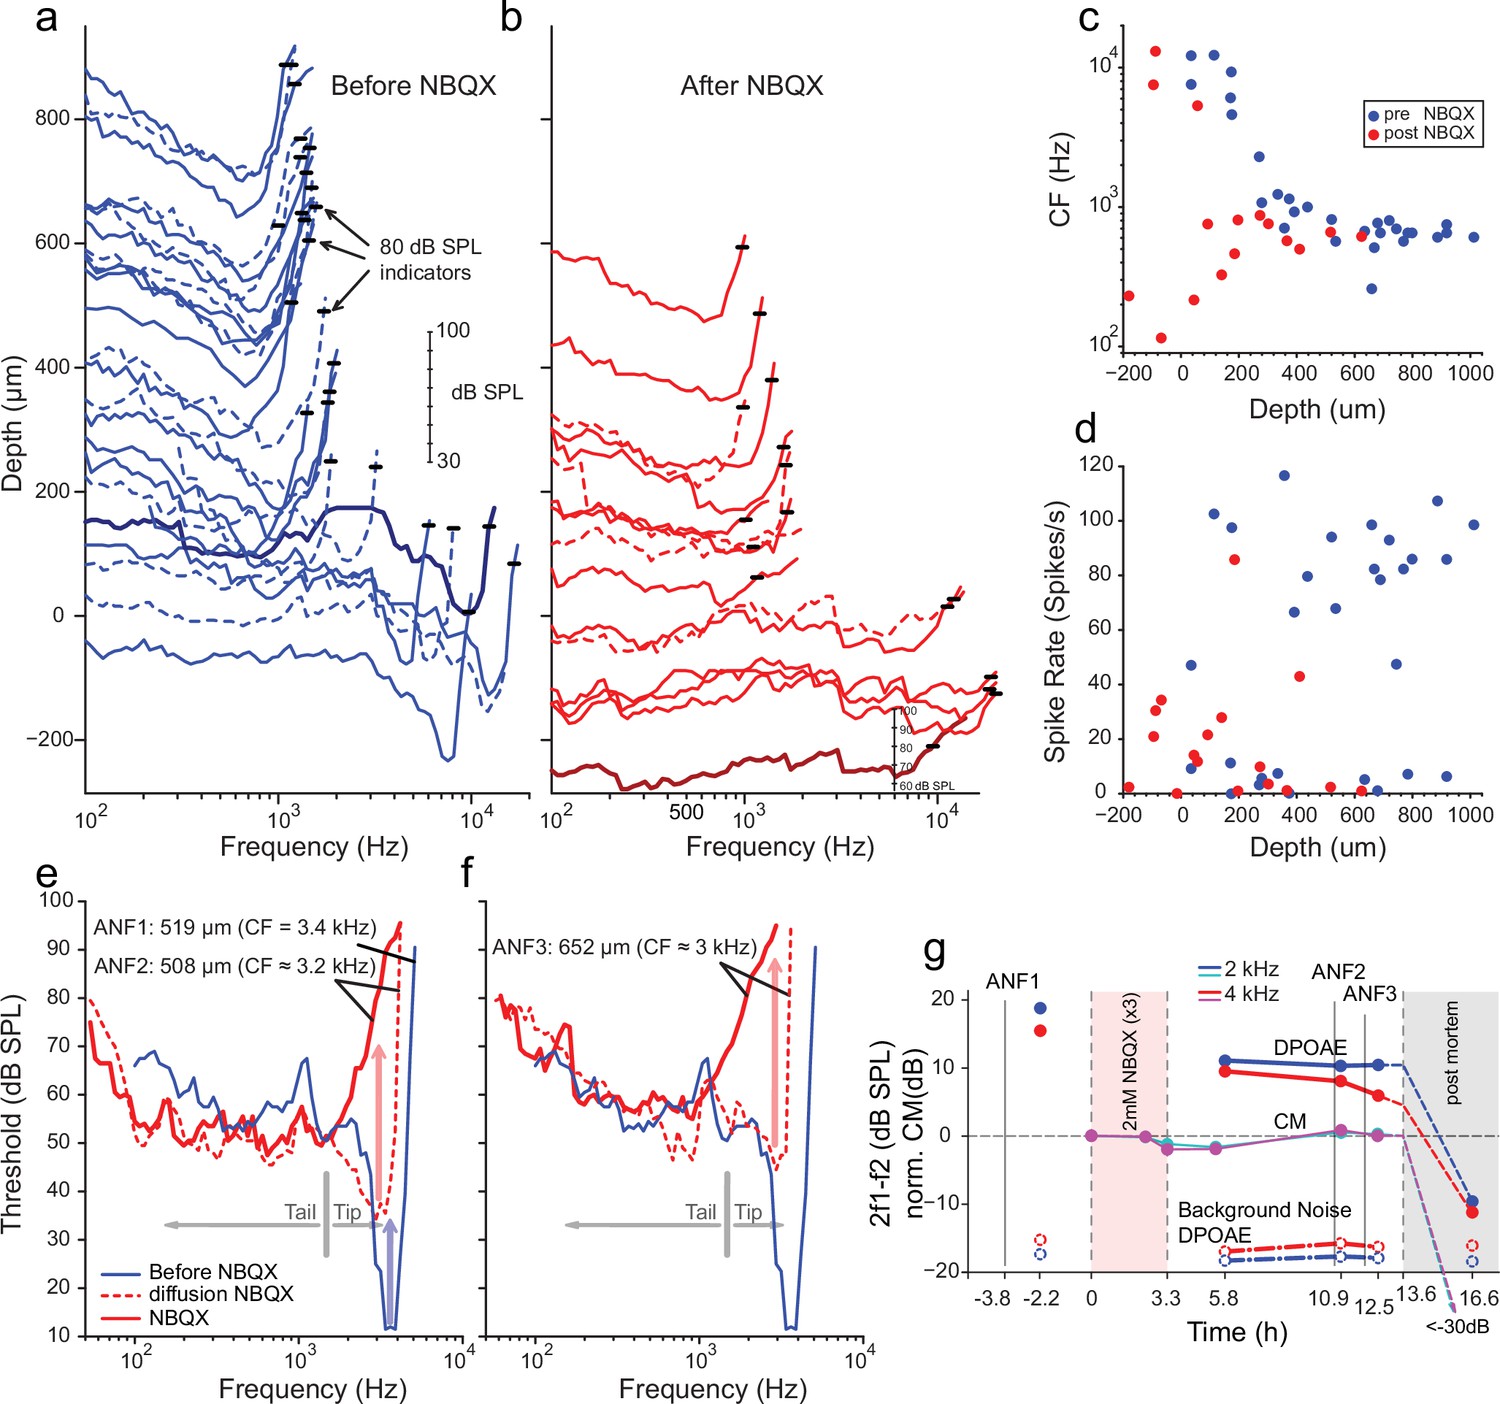
Effects of blocking synaptic transmission on auditory nerve (AN) activity in vivo.
(a–b) Frequency threshold tuning curves of AN fibers from a single chinchilla, obtained at different recording depths in the nerve, before (blue) and after (red) round window application of 2,3-dihydroxy-6-nitro-7-sulfamoyl-benzo[f]quinoxaline (NBQX). Each curve shows the threshold (in dB sound pressure level [SPL]) of a single AN fiber over a range of frequencies: the curves are anchored to the y-axis (recording depth) by the small black horizontal bar at 80 dB SPL. The dB scale in a applies to all traces in (a,b). Dashed lines are sometimes used to disambiguate traces. After applying NBQX, frequency tuning vanishes at the shallow recording depths (toward the bottom of a and b), where high-frequency fibers were found before applying NBQX. Fibers tuned to lower frequencies, found at greater depth (toward the top of a and b), are less affected, likely due to limited diffusion of NBQX to the apical turns. (c) Characteristic frequencies (CFs) as a function of recording depth (frequency of lowest threshold) before and after application of NBQX in the same cochlea. In the initial recording sessions, before the application of NBQX (blue symbols), high CFs dominate at shallow recording depths, while at depths >250 µm CFs are between 0.5 and 1 kHz. After the application of NBQX (red symbols), the lowest thresholds of superficial fibers are predominantly at low frequencies (<1 kHz). (d) Spontaneous rates as a function of recording depth. Formatting as in c. (e) The effect of NBQX on repeated measurement of a threshold tuning curve of AN fiber 2 (ANF2) recorded initially (red dashed: CF = 3.2 kHz) and after several minutes (red solid: CF = 630 Hz), compared to a tuning curve of a fiber (ANF1) with comparable CF recorded before NBQX application (blue). (f) Same as in (e) but for a different AN fiber (ANF3): CF changed from 3 to 0.9 kHz. (g) Monitoring of the mechanical cochlear state during the experiment in (e and f) at two relevant frequencies, using Distortion Product OtoAcoustic Emissions (DPOAEs) and compound receptor potentials (cochlear microphonic, CM). Amplitudes of DPOAEs are shown in dB SPL; CM amplitudes are in dB and are normalized to the level measured before application of NBQX (measurements 1–2). CM and DPOAEs are relatively stable after the NBQX injection but vanish postmortem. The measurement noise floors (dash-dotted lines) are stable over the entire experiment.
-
Figure 4—source data 1
Auditory Nerve Data NBQX.
- https://cdn.elifesciences.org/articles/74948/elife-74948-fig4-data1-v2.xlsx
Figure 4—figure supplement 1
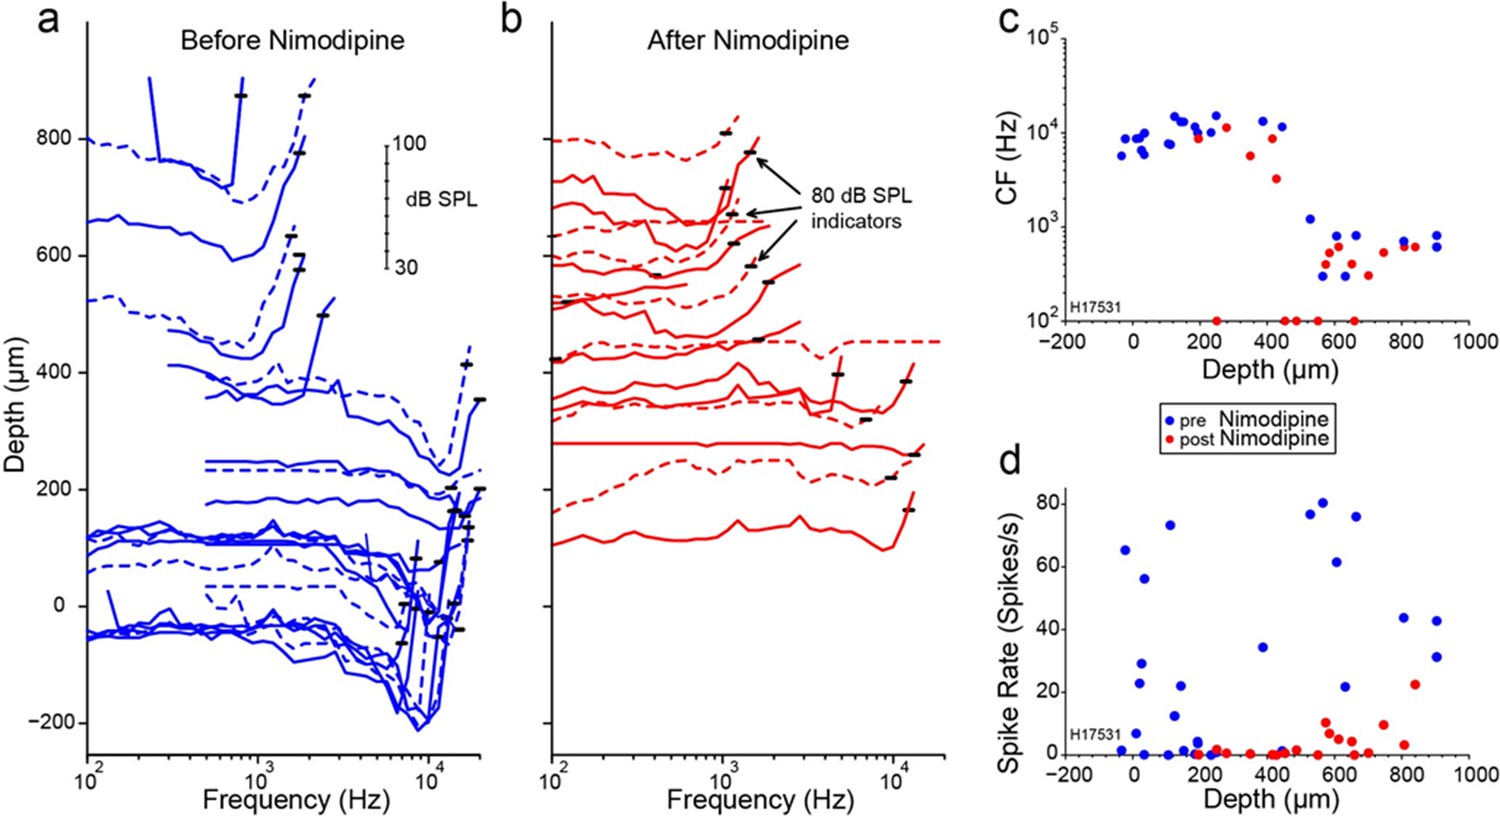
Influence of applied toxins on auditory nerve (AN)-fiber responses.
Layout as for Figure 4, but using the Ca2+ channel blocker nimodipine. Data from chinchilla.
Figure 5
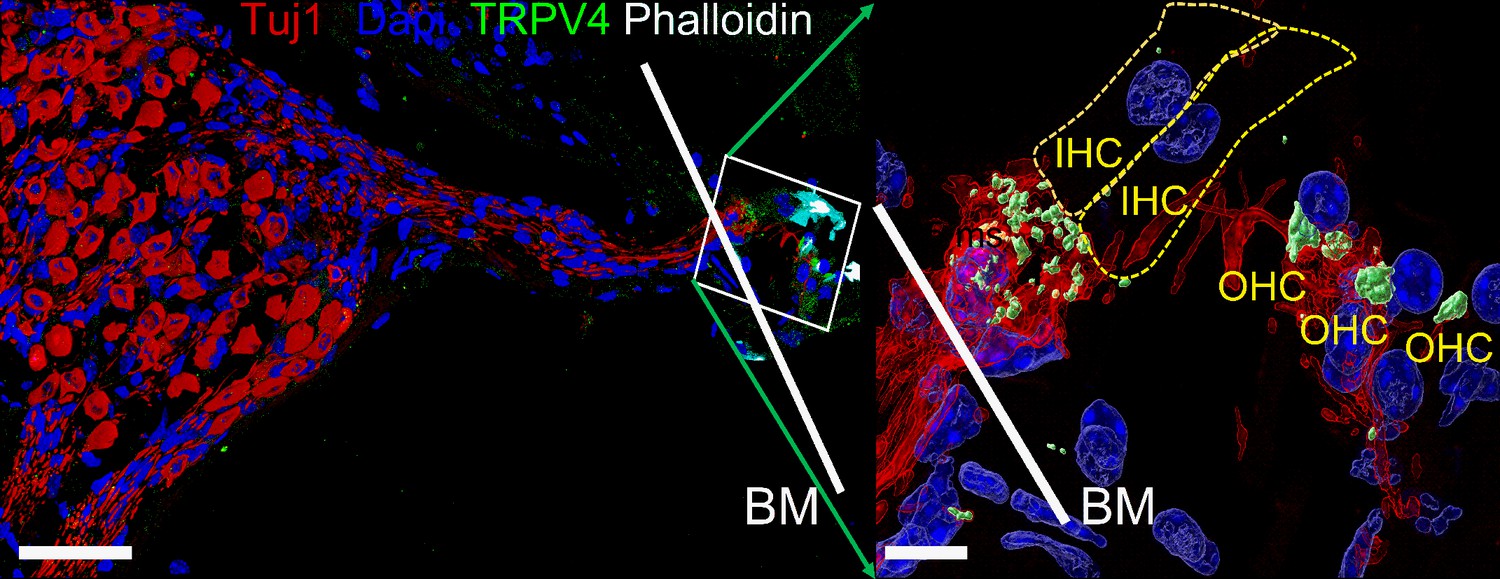
Expression of transient receptor potential vanilloid IV (TRPV4) in spiral ganglion neurons (SGNs).
Positive reactivity of SGN nerve terminals to TRPV4 antibody (green). Reaction at the cell body (soma) was low. Table 4 provides a summary of TRP channels tested and a qualitative evaluation. Scale bar low magnification (left panel = 30 μm), high magnification (right panel = 5 μm).
Tables
Table 1
Summary of changes in spike rate I and VS using in-phase current and mechanical stimulations.
The significance level of VS is given in the column with p-values obtained with the Rayleigh test for uniformity (Mardia, 1972).
| SGN | Current (I)R (spike/s) VS | Rayleigh p | Mech stim (X)R (spike/s) VS | Rayleigh p | I + XR (spike/s) VS | Rayleigh p | |||
|---|---|---|---|---|---|---|---|---|---|
| 13830002 | 0.5 | NA | NA | 0 | NA | NA | 40 | 0.96 | 0.0013 |
| 13830003 | 0 | NA | NA | 0 | NA | NA | 40 | 0.91 | 0.003 |
| 13903009 | 50 | 0.97 | 0.01 | 0 | NA | NA | 74 | 0.95 | 0.001 |
| 13903030 | 7.5 | 0.98 | 0.02 | 2.5 | 0.14 | 0.11 | 95 | 0.94 | 0.011 |
| 13903043 | 21 | 0.96 | 0.01 | 14 | 0.95 | 0.02 | 99 | 0.99 | 0.0003 |
| 13903044 | 11.5 | 0.95 | 0.01 | 51 | 0.98 | 0.01 | 100 | 0.99 | 0.0086 |
| 13903029 | 23 | 0.94 | 0.04 | 0 | NA | NA | 89 | 0.96 | 0.0002 |
| 13903010 | 49 | 0.98 | 0.01 | 0.5 | NA | NA | 69 | 0.94 | 0.0012 |
| 13903058 | 45 | 0.98 | 0.01 | 12 | 0.97 | 0.02 | 96 | 0.97 | 0.0003 |
| 13903059 | 24.5 | 0.94 | 0.03 | 50.5 | 0.98 | 0.01 | 92 | 0.96 | 0.002 |
| 13904007 | 0.5 | NA | NA | 0 | NA | NA | 99.5 | 0.99 | 0.009 |
| 13904008 | 0 | NA | NA | 22.5 | 0.94 | 0.03 | 100 | 0.997 | 0.0001 |
| 13904023 | 1.5 | 0.15 | 0.43 | 0 | NA | NA | 99.5 | 0.99 | 0.0002 |
| 13904024 | 0 | NA | NA | 1 | NA | NA | 100 | 0.96 | 0.003 |
| 13904037 | 2 | 0.1 | 0.67 | 0 | NA | NA | 55 | 0.89 | 0.008 |
| 13904038 | 0 | NA | NA | 2.5 | 0.15 | 0.32 | 50.5 | 0.995 | 0.008 |
| 13909008 | 0.5 | NA | NA | 0 | NA | NA | 64 | 0.96 | 0.012 |
| 13909009 | 0 | NA | NA | 1.5 | 0.12 | 0.52 | 62 | 0.96 | 0.013 |
| 13909024 | 36 | 0.87 | 0.02 | 0 | NA | NA | 50 | 0.98 | 0.011 |
| 13909025 | 0 | NA | NA | 0.5 | NA | NA | 50.5 | 0.95 | 0.012 |
| 13909040 | 0 | NA | NA | 0 | NA | NA | 16 | 0.94 | 0.007 |
| 13909041 | 0 | NA | NA | 0 | NA | NA | 13 | 0.75 | 0.052 |
| 13913008* | 45.5 | 0.72 | 0.04 | 0 | NA | NA | 43 | 0.82 | 0.036 |
| 13913009* | 35 | 0.87 | 0.03 | 1 | NA | NA | 50.5 | 0.9 | 0.027 |
| 14900012* | 18 | 0.76 | 0.02 | 3 | 0.15 | 0.34 | 64.5 | 0.95 | 0.011 |
| 14903018* | 0.5 | NA | NA | 5 | 0.2 | 0.36 | 31.5 | 0.87 | 0.021 |
| 14903021* | 1.5 | 0.1 | 0.25 | 0.5 | NA | NA | 45.5 | 0.91 | 0.010 |
| 14903083 | 32.5 | 0.68 | 0.02 | 0.5 | NA | NA | 44.5 | 0.83 | 0.008 |
| 15800101 | 0.5 | NA | NA | 3 | 0.1 | 0.31 | 72.5 | 0.96 | 0.006 |
| 15800110 | 56 | 0.95 | 0.01 | 1 | NA | NA | 62 | 0.93 | 0.007 |
| 15800099 | 32 | 0.94 | 0.02 | 0 | NA | NA | 70.5 | 0.96 | 0.041 |
| 15810007 | 56 | 0.98 | 0.01 | 3.5 | 0.2 | 0.14 | 58 | 0.97 | 0.020 |
| 15800291 | 0 | NA | NA | 5 | 0.25 | 0.08 | 94.5 | 0.99 | 0.001 |
| 15800292 | 0.5 | NA | NA | 3 | 0.10 | 0.56 | 56.5 | 0.92 | 0.005 |
| 15800293 | 3 | 0.15 | 0.09 | 1 | NA | NA | 95.5 | 0.99 | 0.0001 |
| 15800295 | 2.5 | 0.1 | 0.27 | 3 | 0.1 | 0.53 | 68.5 | 0.89 | 0.004 |
| 15800301 | 1 | NA | NA | 8 | 0.3 | 0.18 | 46.5 | 0.96 | 0.0002 |
| 15800308 | 48 | 0.87 | 0.02 | 1 | NA | NA | 92 | 0.98 | 0.003 |
| 15800319 | 1 | NA | NA | 7 | 0.25 | 0.11 | 89.5 | 0.94 | 0.003 |
| 15800320 | 0 | NA | NA | 5 | 0.3 | 0.11 | 49.5 | 0.91 | 0.003 |
| 15800401 | 16.5 | 0.71 | 0.02 | 17 | 0.55 | 0.03 | 56.5 | 0.89 | 0.021 |
| 15800402 | 7 | 0.25 | 0.05 | 1 | NA | NA | 42.5 | 0.91 | 0.025 |
| 15800511 | 3 | 0.1 | 0.18 | 1 | NA | NA | 40 | 0.94 | 0.008 |
| 15800513 | 5 | 0.2 | 0.09 | 6 | 0.14 | 0.17 | 52 | 0.94 | 0.006 |
| 15800515 | 1 | NA | NA | 94.5 | 0.98 | 0.003 | 89.5 | 0.99 | 0.002 |
| 16900101 | 0 | NA | NA | 97.5 | 0.95 | 0.01 | 99.5 | 0.998 | 0.002 |
| 16900107 | 5 | 0.2 | 0.05 | 3 | 0.1 | 0.21 | 75.5 | 0.96 | 0.001 |
| 16900111 | 9 | 0.3 | 0.05 | 5 | 0.15 | 0.11 | 98 | 0.995 | 0.007 |
| 16900123 | 1 | NA | NA | 6 | 0.12 | 0.24 | 72.5 | 0.96 | 0.0002 |
| 16900127 | 19 | 0.74 | 0.01 | 1 | NA | NA | 92 | 0.95 | 0.008 |
| 16900131 | 9 | 0.25 | 0.03 | 1 | NA | NA | 45.5 | 0.75 | 0.037 |
| 16900139 | 5 | 0.2 | 0.12 | 4 | 0.1 | 0.67 | 56 | 0.9 | 0.009 |
-
SGN = spiral ganglion neuron, R (spike rate) = spike/s, VS = vector strength, * substrate dendrite displacement, NA = not applicable.
Table 2
Effects of GsMTx4 on spike rate (R) and VS.
The significance level of VS is given in the column with p-values obtained with the Rayleigh test for uniformity on the effects of GsMTx4.
| SGN | Current (I)R (spike/s) VS | Mech stim (X)R (spike/s) VS | I + XR (spike/s) VS | |||
|---|---|---|---|---|---|---|
| 19830002GsMTx4 | 33 | 0.150.15 | 1.50 | 0.1NA | 415 | 0.900.24 |
| 19830002GsMTx4 | 45.549.5 | 0.740.75 | 10 | NANA | 4842 | 0.860.72 |
| 19830043GsMTx4 | 911 | 0.620.62 | 50 | 0.3NA | 3113 | 0.890.58 |
| 19830059GsMTx4 | 75 | 0.380.37 | 140 | 0.64NA | 4511 | 0.890.37 |
-
SGN = spiral ganglion neuron, R (spike rate) = spike/s, VS = vector strength, NA = not applicable.
Table 3
Summary data for polar plots of Figure 3 and Figure 3—figure supplement 3.
The header of the vertical columns provides a reference to the relevant figure panel. The top four datalines are for the polar plots based on spike rate. First line gives the maximum number of spikes, to which the rate plot was normalized. The second and third lines give the angle and magnitude of the resultant vector. Last line indicates level of significance (Rayleigh test of uniformity). The bottom three datalines give corresponding values based on measurement of phase locking.
| Figure 3m | Figure 3—figure supplement 3a | Figure 3—figure supplement 3b | Figure 3—figure supplement 3c | ||
|---|---|---|---|---|---|
| Polar plot spike rate | |||||
| Max #spikes | 147 | 150 | 210 | 278 | 150 |
| Angle resultant | 49.1 | 79.6 | 352.6 | 69.1 | 297.4 |
| Magnitude resultant | 0.15 | 0.21 | 0.19 | 0.23 | 0.22 |
| p-Value Rayleigh test | <0.001 | <0.001 | <0.001 | <0.001 | <0.001 |
| Polar plot phase locking | |||||
| Angle resultant | 54.1 | 81.5 | 3.0 | 81.9 | 307.0 |
| Magnitude resultant | 0.08 | 0.18 | 0.12 | 0.17 | 0.20 |
| p-Value Rayleigh test | 0.003 | <0.001 | <0.001 | <0.001 | <0.001 |
Table 4
Expression of transient response potential (TRP) channel in spiral ganglion neuron (SGN) soma and nerve terminals.
The table shows a summary of immunofluorescent detection of TRP channels at SGN cell body (soma) and nerve terminals.
| Channel | Soma | Nerve terminals |
|---|---|---|
| TRPA1 | - | - |
| TRPC3 | - | ++ |
| TRPC6 | ++ | + |
| TRPV1 | - | - |
| TRPV4 | + | +++ |
-
- = no reactivity.
-
+, ++, and +++ , = low, medium, and high reactivity, respectively.
Additional files
Download links
A two-part list of links to download the article, or parts of the article, in various formats.
Downloads (link to download the article as PDF)
Open citations (links to open the citations from this article in various online reference manager services)
Cite this article (links to download the citations from this article in formats compatible with various reference manager tools)
Intrinsic mechanical sensitivity of mammalian auditory neurons as a contributor to sound-driven neural activity
eLife 11:e74948.
https://doi.org/10.7554/eLife.74948


