Controllability boosts neural and cognitive signatures of changes-of-mind in uncertain environments
- Laboratoire de Neurosciences Cognitives et Computationnelles, Institut National de la Santé et de la Recherche Médicale (Inserm), France
- Institut Jean Nicod, Centre National de la Recherche Scientifique (CNRS), France
- Département d’Études Cognitives, École Normale Supérieure, Université Paris Sciences et Lettres (PSL University), France
- Université de Paris, France
- Department of Neurobiology, Harvard Medical School, United States
Figures
Figure 1

Experimental paradigm probing changes-of-mind across two controllability conditions.
(A) Participants underwent two experimental conditions that varied only in the degree of control over stimuli. In the uncontrollable condition (C-, blue), observers were asked to monitor the category from which stimuli were drawn. In the controllable condition (C+, pink), agents were asked to select an action that will produce stimuli from either category. The evidence available for each choice, but also all stimuli and motor responses were tightly matched across conditions (see ‘Materials and methods’). (B) Task structure. The hidden state reversed unpredictably after a pseudo-random number of trials. In the C+ condition, the category drawn at trial t only depends on the hidden state st. In the C- condition, the category drawn at trial t depends on both the hidden state st and the previous response rt-1, as indicated by pink arrows. (C) On each trial, participants were presented with sequences of 2–8 stimuli drawn from either category and were asked to indicate their choice and the associated confidence using four response keys. Confidence keys (low, high) were assigned to the inner and outer keys of each choice (left and right). A schematic sequence of events related to information seeking is depicted. Hidden-state reversals are determined by the experimental design (‘task event’). During an exploratory decision, several steps co-occur: a covert change-of-mind (‘cognitive event’) about the expected reward of the current option; an overt response switch (‘behavioral event’); and information seeking, i.e., an active search for information about the new option being considered, which is only possible in the C+ condition, where participants have control. (D) Stimuli were oriented bars drawn from either of two categories (orange and blue), whose means are orthogonal to each other. The generative probability distributions of drawn orientation for each category are depicted.
Figure 2 with 3 supplements
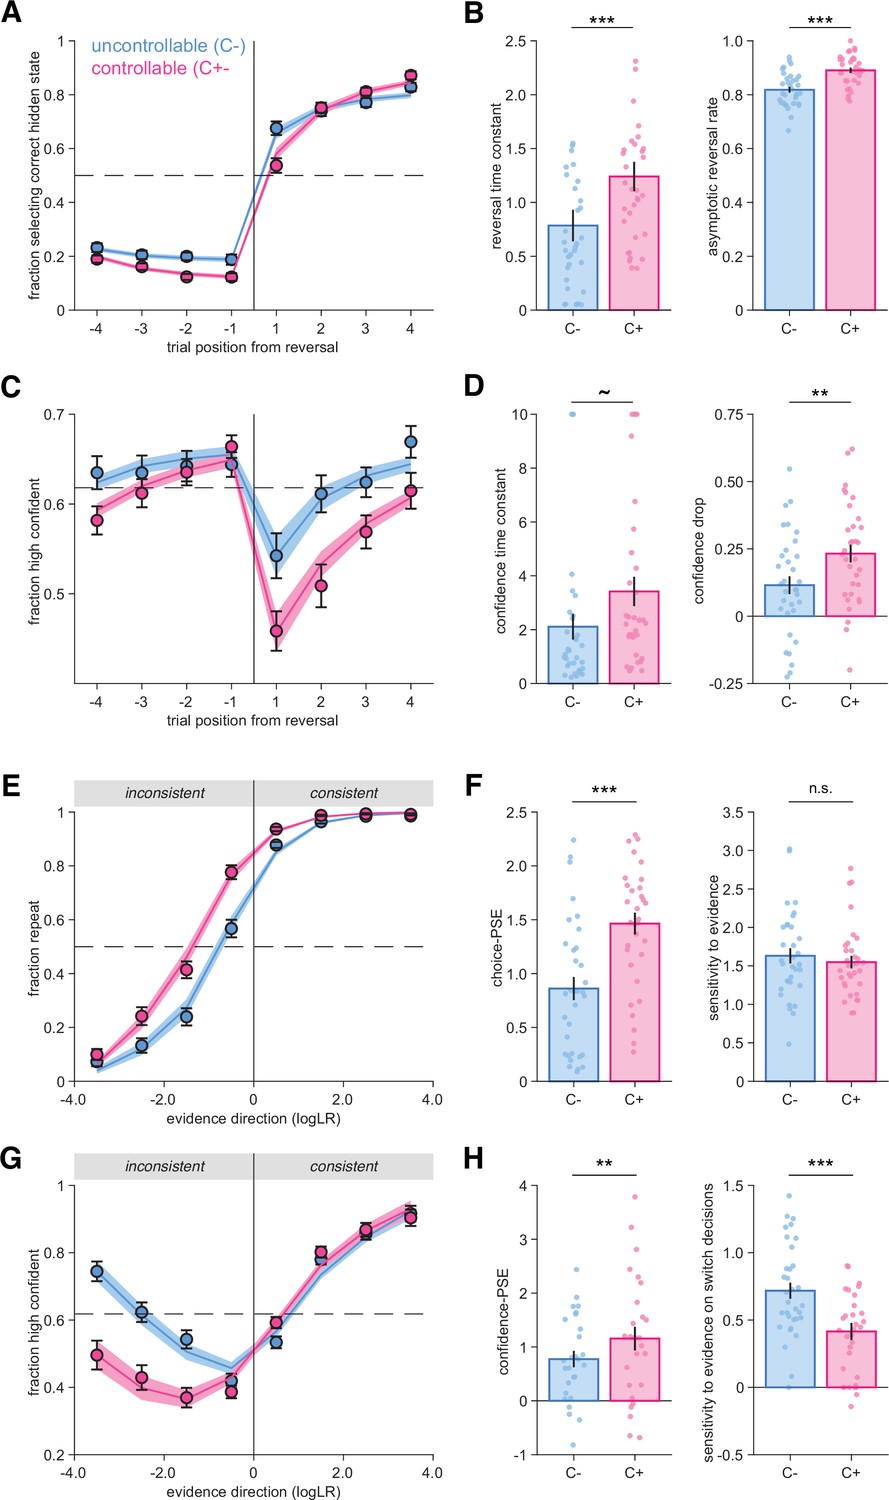
Behavioral reversal and repetition curves characterizing participants’ responses and their confidence.
(A) Fraction of hidden state correctly reported as a function of trial number before and after a reversal. Vertical lines indicate the position of reversals. Horizontal dotted line indicates chance level. Circles and error bars indicate mean and SEM across participants (N = 33). Shaded areas indicate mean and SEM of psychometric predictions from the best-fitting truncated exponential functions. (B) Psychometric parameters ‘reversal time constant’ and ‘asymptotic reversal rate’ characterizing the fitted response reversal curve in (A) (see ‘Materials and methods’). Circles indicate individual participants, and bars and error bars indicate the mean and SEM across participants. ***p<0.001, paired t-tests. (C) Fraction of high-confidence responses as a function of trial number before and after a reversal. Horizontal dotted line indicates mean confidence. Circles and error bars indicate mean and SEM across participants (N = 33). Shaded areas indicate mean and SEM of psychometric predictions from the best-fitting sigmoid functions. (D) Psychometric parameters ‘confidence time constant’ and ‘confidence drop’ for the fitted confidence reversal curve in (B). Circles indicate individual participants, and bars and error bars indicate the mean and SEM across participants. **p<0.01, ~p=0.064 paired t-test and p<0.008 Wilcoxon signed-rank test. (E) Fraction of response repetitions as a function of whether the evidence was consistent (in favor of repeating) or inconsistent with the previous choice. Circles indicate human data (N = 33), and error bars display SEM across participants. Shaded areas indicate mean and SEM of psychometric predictions from the best-fitting truncated exponential functions. (F) Psychometric parameters ‘point of subjective equivalence’ (choice-PSE) and ‘sensitivity to evidence’ (slope) characterizing the response repetition curves in (E). ***p<0.001, n.s., not significant, paired t-tests. (G) Fraction of high-confidence responses as a function of whether the evidence was consistent or inconsistent with the previous choice. Circles indicate human data (N = 33), and error bars display within-participant SEM. Within-participant error bars are represented to allow a comparison between conditions without an influence of inter-individual variability about the use and calibration of the high- and low-confidence responses. Shaded areas indicate mean and SEM of psychometric predictions from the best-fitting mixture of two sigmoid functions for repeat and switch trials respectively. (H) Psychometric parameters characterizing the confidence repetition curves in (G). Left panel: ‘confidence-PSE’ (point of subjective equivalence) representing the quantity of evidence for which participants are as confident in their repeat decisions as in their switch decisions. **p<0.01, Wilcoxon signed-rank test (see ‘Materials and methods’). Right panel: ‘sensitivity to evidence’ for the switch trials. ***p<0.001, paired t-test. Circles indicate individual participants, and bars and error bars indicate the mean and SEM across participants. In all panels, uncontrollable (C-) condition is in blue and controllable (C+) condition in pink.
Figure 2—figure supplement 1
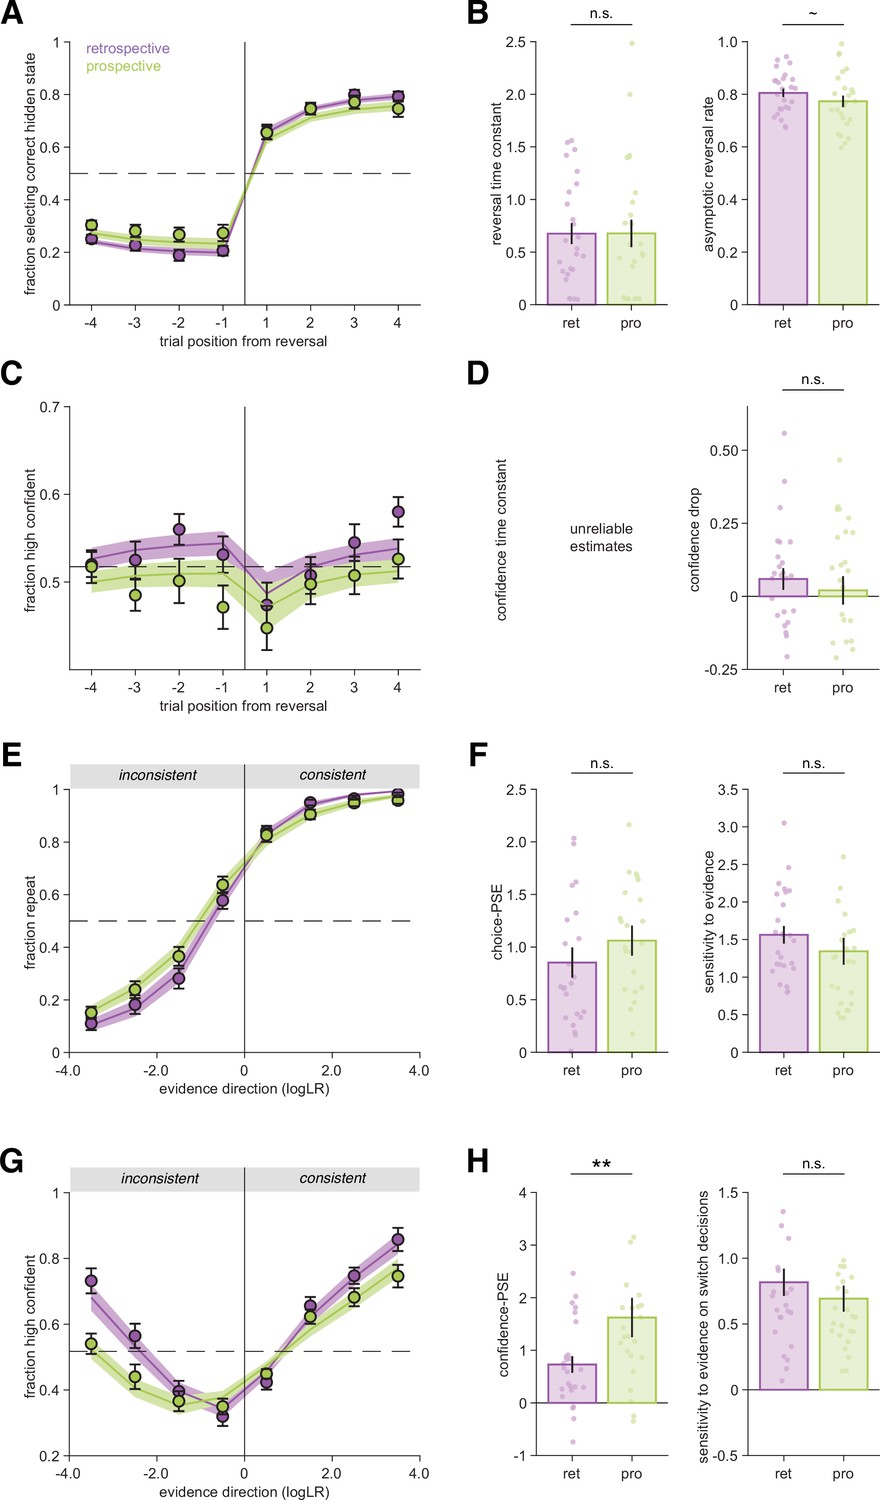
Psychometric analysis of choice and confidence reversal and repetition curves in retrospective (purple) and prospective (green) conditions (Experiment 3).
(A) Fraction of hidden state correctly reported as a function of trial number before and after a reversal. Vertical lines indicate the position of reversals. Horizontal dotted line indicates chance level. Circles and error bars indicate mean and SEM across participants (N = 25). Shaded areas indicate mean and SEM of psychometric predictions from the best-fitting truncated exponential functions. (B) Psychometric parameters ‘reversal time constant’ and ‘asymptotic reversal rate’ characterizing the fitted response reversal curve in (A) (see ‘Materials and methods’). Circles indicate individual participants, and bars and error bars indicate the mean and SEM across participants. ~p=0.038, n.s., not significant, paired t-tests. (C) Fraction of high-confidence responses as a function of trial number before and after a reversal. Vertical lines indicate the position of reversals. Horizontal dotted lines indicate mean confidence. Circles indicate human data, and error bars display SEM across participants. Shaded areas indicate psychometric predictions from the best-fitting sigmoid functions. (D) Psychometric parameter for the confidence reversal curve in (C). Dots indicate individual participants. Because confidence drop is not different from zero in both conditions, confidence time constants are not reliably estimable and therefore are not presented. n.s., not significant, paired t-tests. (E) Fraction of response repetitions as a function of whether the evidence was consistent (in favor of repeating) or inconsistent with the previous choice. Circles indicate human data, and error bars display SEM across participants. Shaded areas indicate mean and SEM of psychometric predictions from the best-fitting truncated exponential functions. (F) Psychometric parameters ‘point of subjective equivalence’ (choice-PSE) and ‘sensitivity to evidence’ (slope) characterizing the response repetition curves in (E). n.s., not significant, paired t-tests. (G) Fraction of high-confidence responses as a function of whether the evidence was consistent or inconsistent with the previous choice. Circles indicate human data, and error bars display within-subject SEM. Within-subject error bars are presented to allow a comparison between conditions without an influence of inter-individual variability about the use and calibration of the high- and low-confidence responses. Shaded areas indicate mean and SEM of psychometric predictions from the best-fitting mixture of two sigmoid functions for repeat and switch trials, respectively (see ‘Materials and methods’). (H) Psychometric parameters characterizing the confidence repetition curves in (G). Left panel: ‘confidence-PSE’ (point of subjective equivalence) representing the quantity of evidence for which participants are as confident in their repeat decisions as in their switch decisions. **p<0.01, Wilcoxon signed-rank test (see ‘Materials and methods’). Right panel: ‘sensitivity to evidence’ for the switch trials. Dots indicate individual participants, and bars and error bars indicate the mean and SEM across participants. Panels (A, B, E, F) were adapted from Weiss et al., 2021.
Figure 2—figure supplement 2
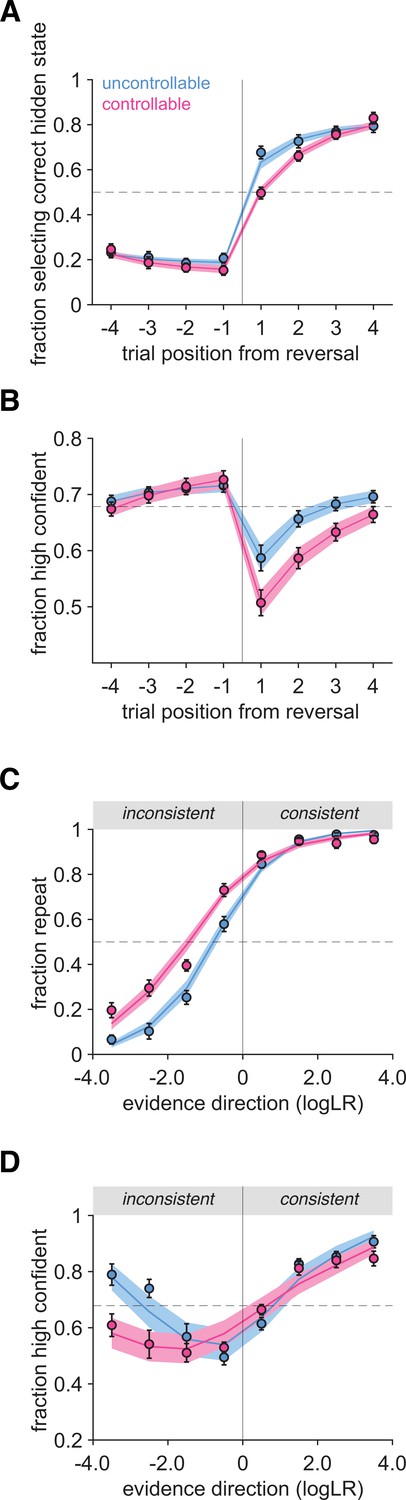
Psychometric analysis of Experiment 2B.
(A) Fraction of hidden state correctly reported as a function of trial number before and after a reversal. Vertical line indicates the position of reversals. Horizontal line indicates chance level. Shaded areas indicate mean and SEM of psychometric predictions from the best-fitting truncated exponential functions. (B) Fraction of response repetitions as a function of whether the evidence was consistent (in favor of repeating) or inconsistent with the previous choice. Shaded areas indicate mean and SEM of psychometric predictions from the best-fitting sigmoid functions. (C) Fraction of high-confidence responses as a function of trial number before and after a reversal. Horizontal dotted lines indicate mean confidence. Shaded areas indicate mean and SEM of psychometric predictions from the best-fitting sigmoid functions. In (A–C), circles and error bars indicate mean and SEM across participants. (D) Fraction of high-confidence responses as a function of whether the evidence was consistent or inconsistent with the previous choice. Circles indicate human data, and error bars display within-subject SEM. Within-subject error bars allow a comparison between conditions without an influence of inter-individual variability about the use and calibration of high- and low-confidence responses. Shaded areas indicate mean and SEM of psychometric predictions from the best-fitting mixture of two sigmoid functions for repeat and switch trials, respectively. Bars and error bars indicate mean and SEM across participants, and dots indicate individual participants. Blue: uncontrollable (C-) condition; pink: controllable (C+) condition. In all panels, sample size is N = 18 participants.
Figure 2—figure supplement 3
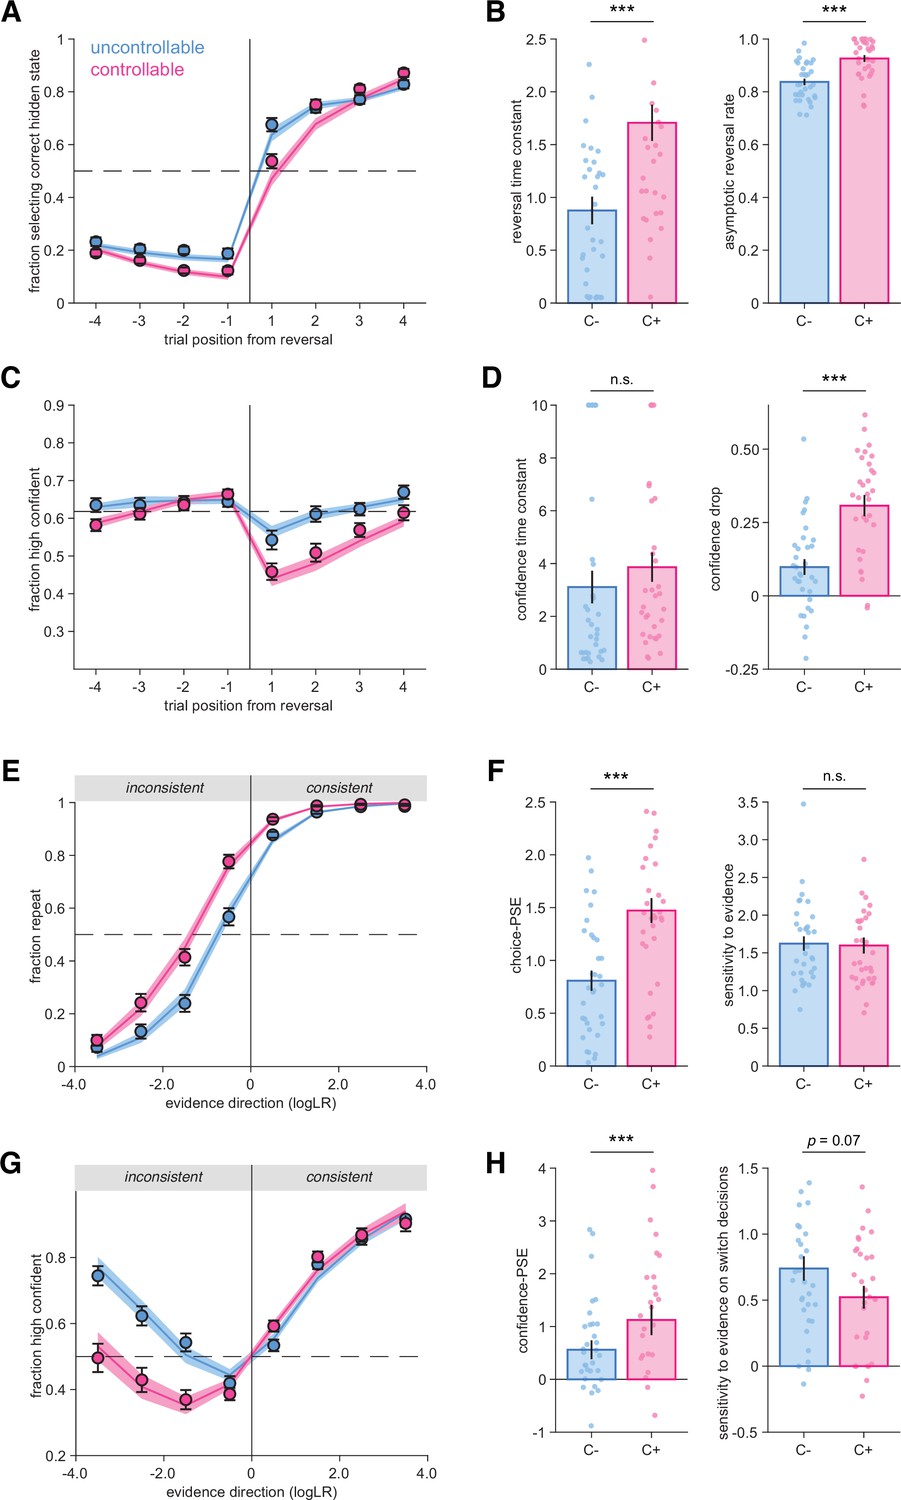
Behavioral signatures of choice and confidence validate the computational model.
Simulations from the best-fitting parameters (shaded areas) in uncontrollable (C-, blue) and controllable (C+, pink) conditions. Same conventions as Figure 2. (A) Fraction of hidden state correctly reported as a function of trial number before and after a reversal. (B) Psychometric parameters ‘reversal time constant’ (***p=9.5 × 10⁻⁷, t32 = −6.0) and ‘asymptotic reversal rate’ (***p=2.0 × 10⁻⁷, t32 = −6.6) characterizing the fitted response reversal curve in (A) (paired t-tests). (C) Fraction of high-confidence responses as a function of trial number before and after a reversal. (D) Psychometric parameters ‘confidence time constant’ and ‘confidence drop’ for the fitted confidence reversal curve in (B). n.s., not significant, p=0.62, t32 = 0.50; ***p=1.0 × 10⁻⁵, t32 = −5.22; paired t-tests. (E) Fraction of response repetitions as a function of whether the evidence was consistent or inconsistent with the previous choice. (F) Psychometric parameters ‘point of subjective equivalence’ (choice-PSE) and ‘sensitivity to evidence’ (slope) characterizing the response repetition curves in (E). ***p=1.7 × 10⁻⁹, t32 = −8.3; n.s., not significant, p=0.43, t32 = 0.79; paired t-tests. (G) Fraction of high-confidence responses as a function of whether the evidence was consistent or inconsistent with the previous choice. (H) Psychometric parameters characterizing the confidence repetition curves in (G). Left panel: ‘confidence-PSE’ (point of subjective equivalence) representing the quantity of evidence for which participants are as confident in their repeat decisions as in their switch decisions. ***p=0.00033, z = −3.69, Wilcoxon signed-rank test. Right panel: ‘sensitivity to evidence’ for the switch trials. t32 = 1.86, p=0.07, paired t-test. In all panels, sample size is N = 33. In panels (B, D, F, H), bars and error bars are mean and SEM.
Figure 3 with 1 supplement
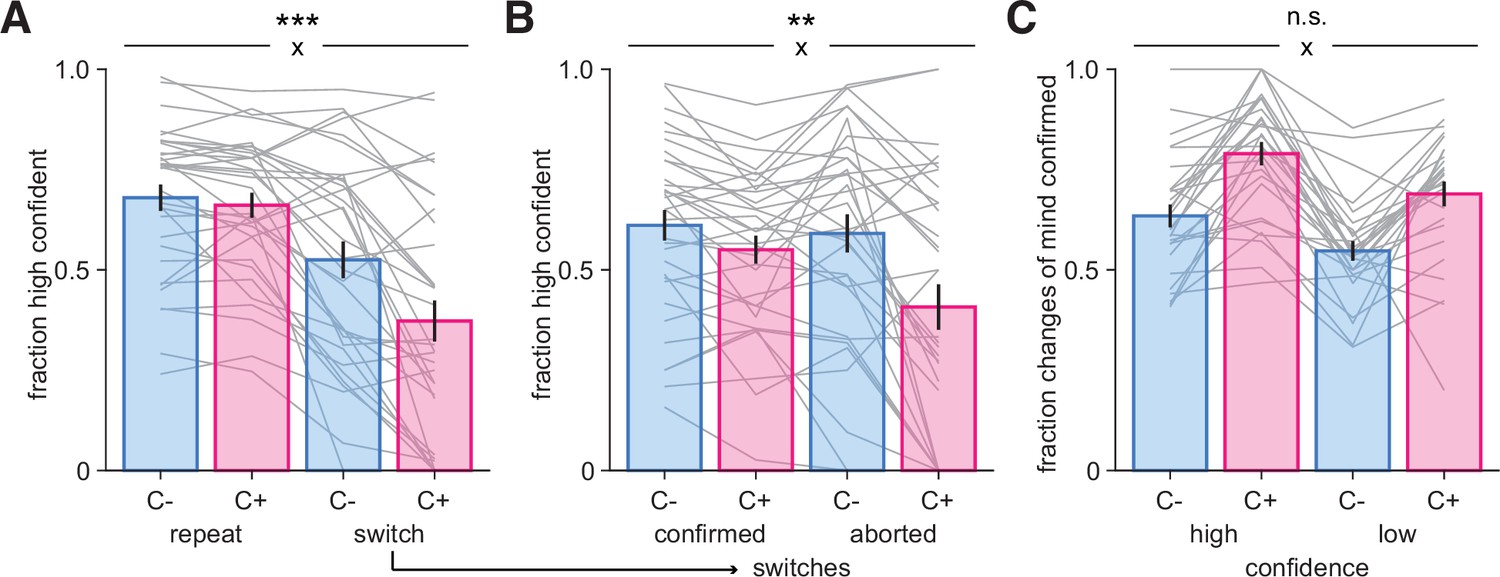
A possible role for confidence in changes-of-mind.
(A) Fraction of high-confidence responses as a function of whether participants repeated their previous choice (‘repeat’) or changed their mind (‘switch’) in the uncontrollable (C-, blue) and controllable (C+, pink) conditions. (B) Fraction of high-confidence responses following switch decisions that were confirmed or aborted, i.e., when participants return back to their previous response in the two conditions. Bars and error bars indicate mean and SEM across participants, and gray lines display individual data points (N = 33). (C) Fraction of switch decisions confirmed on the next trial (see ‘Materials and methods’) as a function of whether the change-of-mind was performed with high or low confidence, for each condition. Bars and error bars indicate mean and SEM across participants (N = 28, due to some participants not exhibiting all types of responses [see ‘Materials and methods’]; note that jackknifed statistics with all 33 participants provided virtually identical results). In all panels, statistical significance from an ANOVA is indicated for the interaction (cross) between response type (repeat, switch) and condition (C-, C+). ***p<0.001, **p<0.005, n.s., nonsignificant.
Figure 3—figure supplement 1
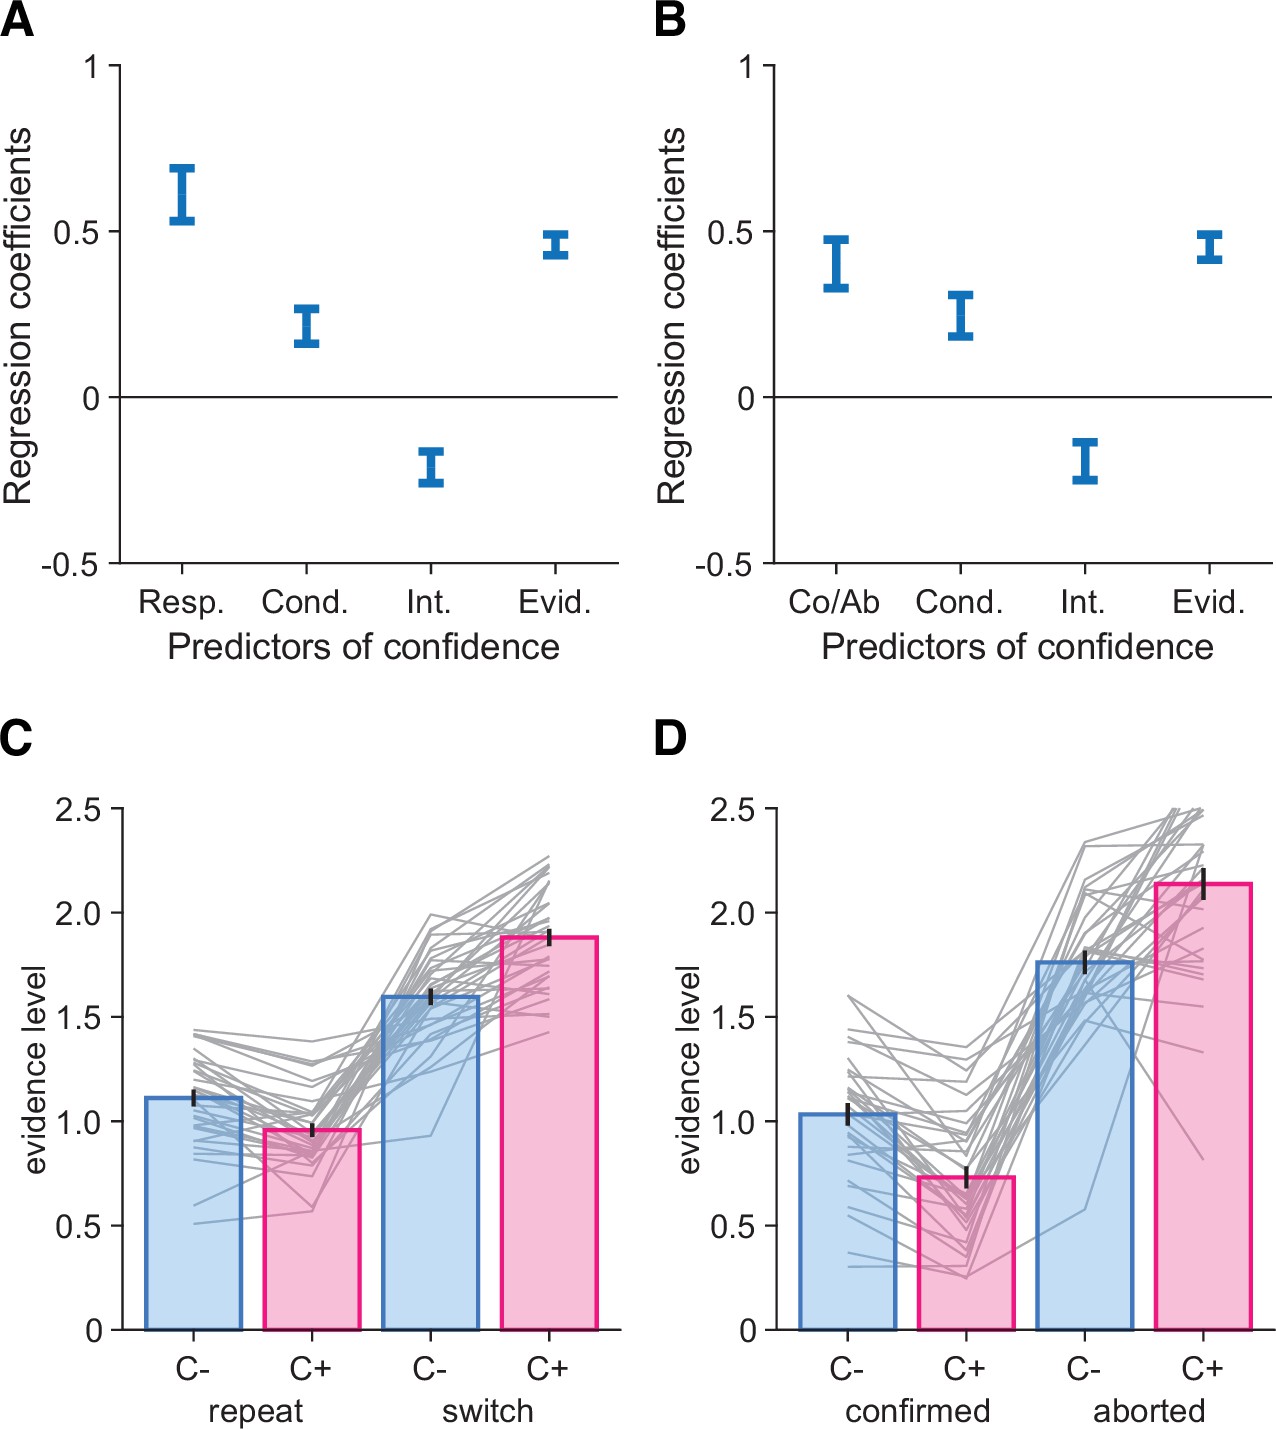
Isolating the interaction between controllability and changes-of-mind on confidence.
(A) Logistic regression predicting confidence as a function of response type (Resp.) (repeat, switch), condition (Cond.) (C-, C+), their interaction (Int.), and the strength of evidence in favor of repeating the previous response (Evid.). (B) Logistic regression predicting confidence as a function of whether the change-of-mind of the previous response was confirmed or aborted (Co/Ab), condition (Cond.) (C-, C+), their interaction (Int.), and the strength of evidence in favor of repeating the previous response (Evid.). (C) Mean evidence level as a function of whether participants repeated their previous choice (‘repeat’) or changed their mind (‘switch’) in the uncontrollable (C-, blue) and controllable (C+, pink) conditions. (D) Mean evidence levels following switch decisions that were confirmed or aborted, i.e., when participants return back to their previous response in the two conditions. Note that individual variability is higher on the right panel because there are less events per participant in each of the cases. Bars and error bars indicate mean and SEM across participants, and gray lines display individual data points (N = 33).
Figure 4 with 4 supplements

Bayesian normative model describing choices and confidence.
(A) Model schematic of computations. The model updates a belief about category from the evidence acquired through the sequence of stimuli, additionally corrupted by inference noise that scales with sequence length, and with a hazard rate controlling reversal occurrence. Based on the strength of the belief about category, responses above (resp. below) a confidence threshold are given with high (resp. low) confidence, with choices and confidence therefore being based on the same posterior belief. An imperfect readout of the posterior belief is modeled by metacognitive noise, and a confidence gain parameter selectively applied of switch trials (see ‘Materials and methods’). (B) Best-fitting model parameters: inference noise, hazard rate, confidence threshold, metacognitive noise, and confidence gain in the uncontrollable (C-, blue) and controllable (C+, pink) conditions. Circles and error bars indicate mean and SEM across participants (N = 33), and gray lines display individual parameter values. ***p<0.00001, n.s., nonsignificant, paired t-tests.
Figure 4—figure supplement 1

Parameter recovery analysis.
Pairwise correlations between generative and recovered inference noise, hazard rate, confidence threshold, metacognitive noise, and confidence gain parameters, in both conditions (blue: uncontrollable [C-]; pink: controllable [C+]). We simulated choice and confidence sequences using generative parameters randomly sampled in a uniform distribution between the minimum and maximum of participants’ best-fitting parameter values in each condition. This procedure ensures that generative parameters were independently sampled. We then fitted these data using the same fitting procedure as for participants (see ‘Materials and methods’). The diagonal line corresponds to a very satisfactory recovery with strong correlations between generative and fitted parameters. Bottom-right panel: confusion matrix for the five parameters indicating a satisfactory recovery.
Figure 4—figure supplement 2
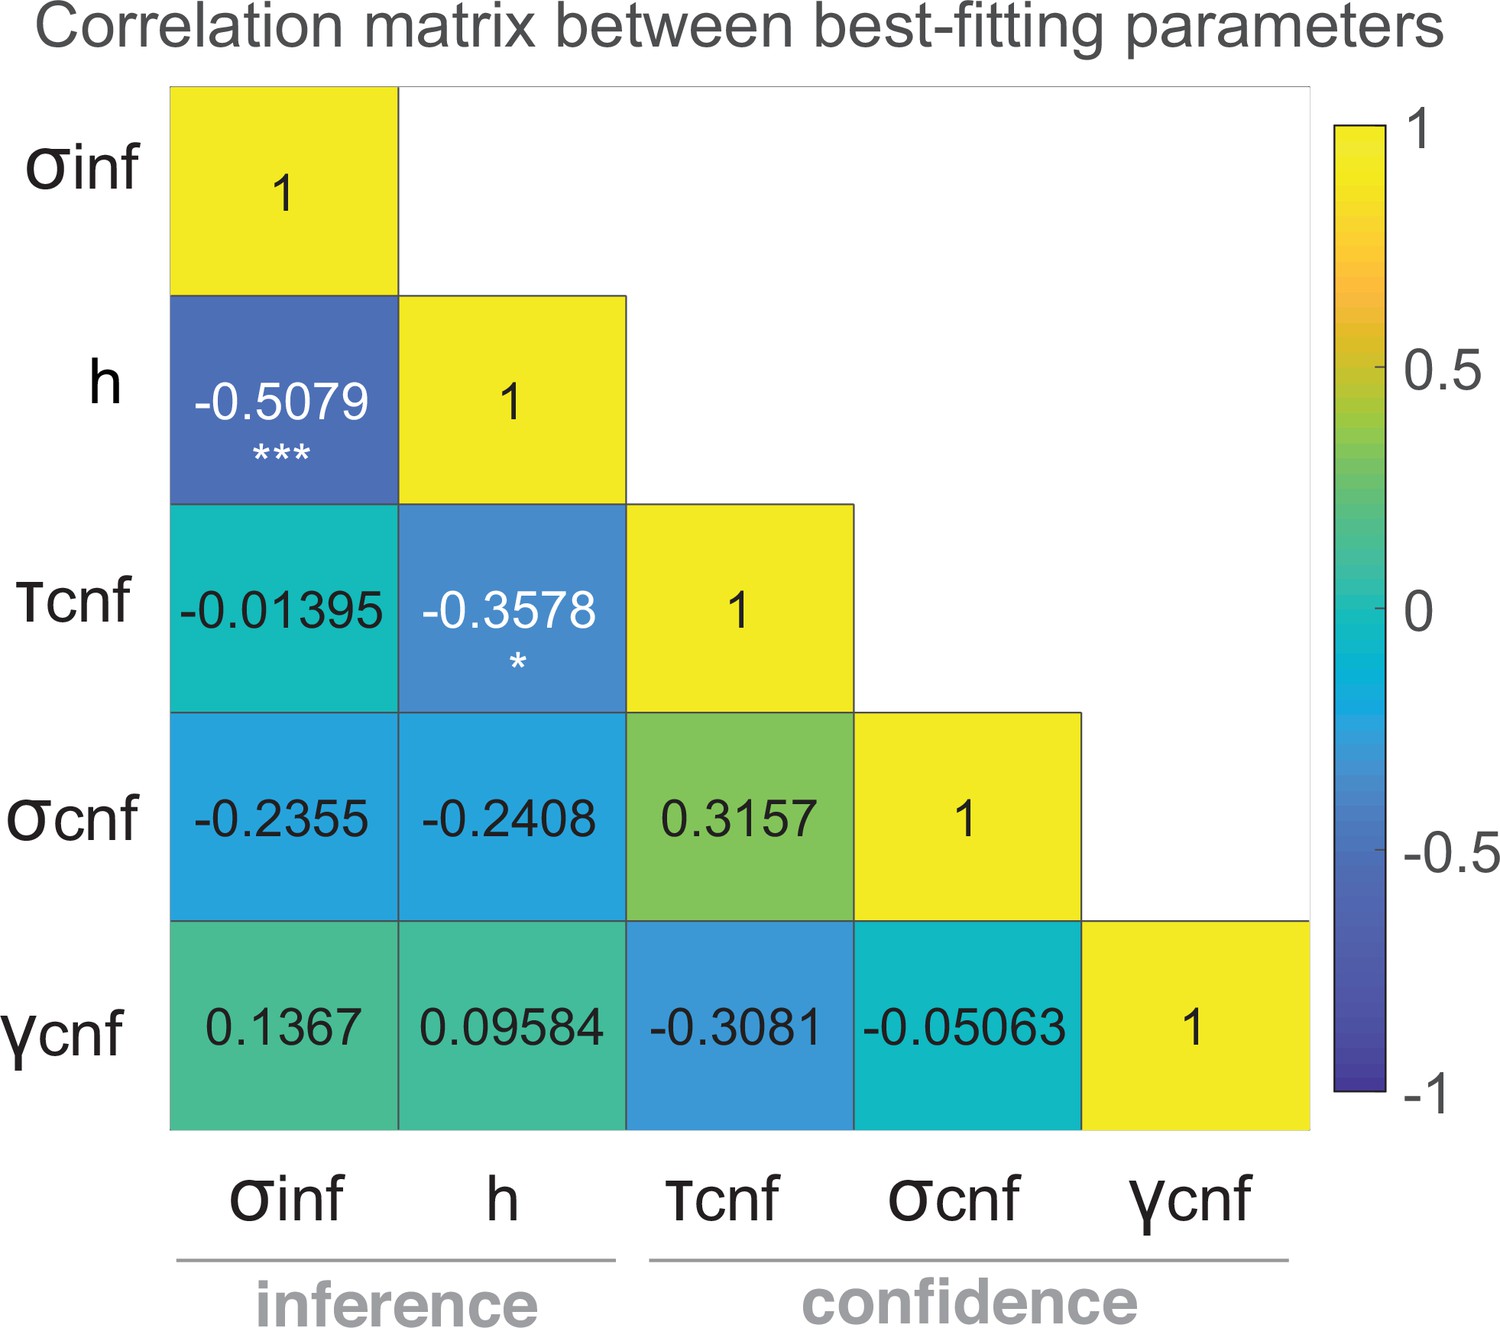
Correlation between model parameters.
Individual best-fitting parameters are averaged across conditions. (1) inference noise; (2) hazard rate; (3) confidence threshold; (4) metacognitive noise; (5) confidence gain. ***p=0.0025, *p=0.041 indicates the significant correlations (N = 33 participants). All other correlations were not significant (all abs(ρ) < 0.32, all p>0.074).
Figure 4—figure supplement 3
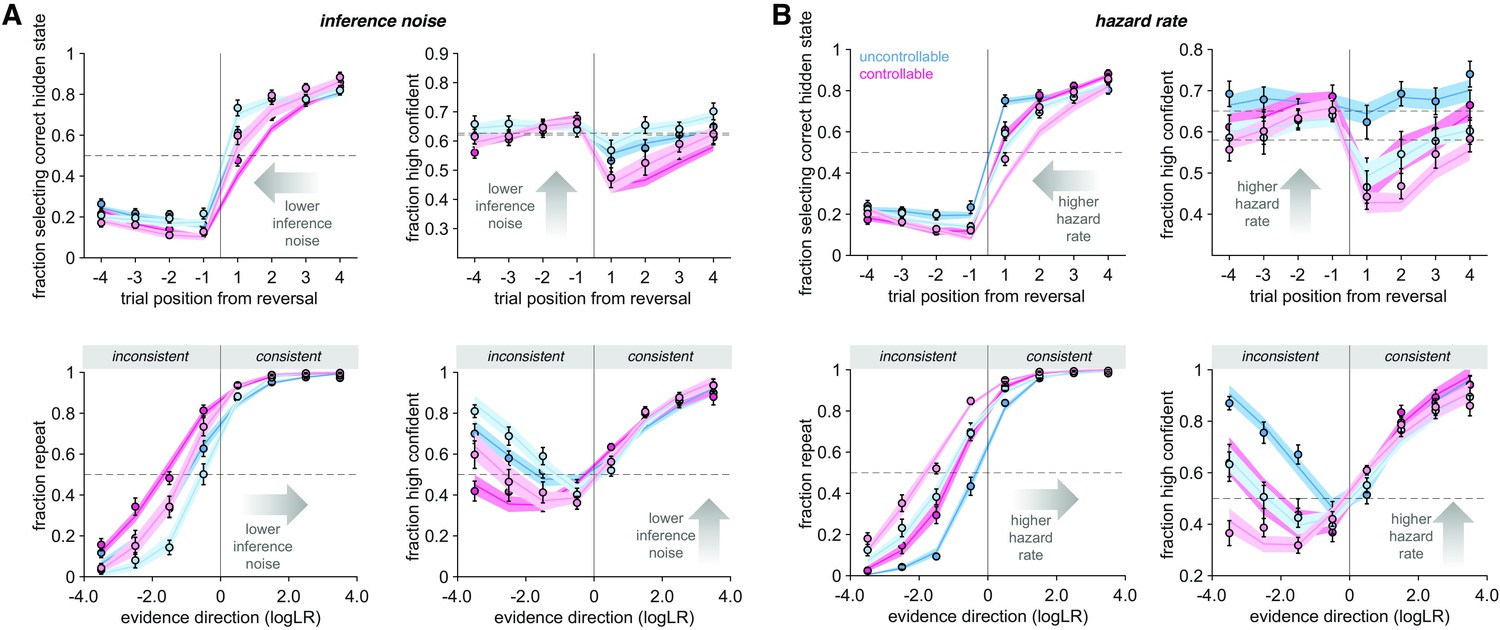
Effect of inference noise and hazard rate parameters on choice and confidence patterns.
(A, B) Effect of inference noise (A) and perceived hazard rate (B) parameters on choice and confidence patterns. Reversal and repetition curves for responses and confidence, with human data (circles) and simulations from the best-fitting computational model (shaded area) in uncontrollable (C-, blue) and controllable (C+, pink) conditions. Circles and error bars represent mean and SEM across participants (N = 16 per group, median split of best-fitting inference noise and hazard rate, respectively). Lighter colors indicate lower parameter values in all panels. Same conventions as Figure 2 and Figure 3.
Figure 4—figure supplement 4
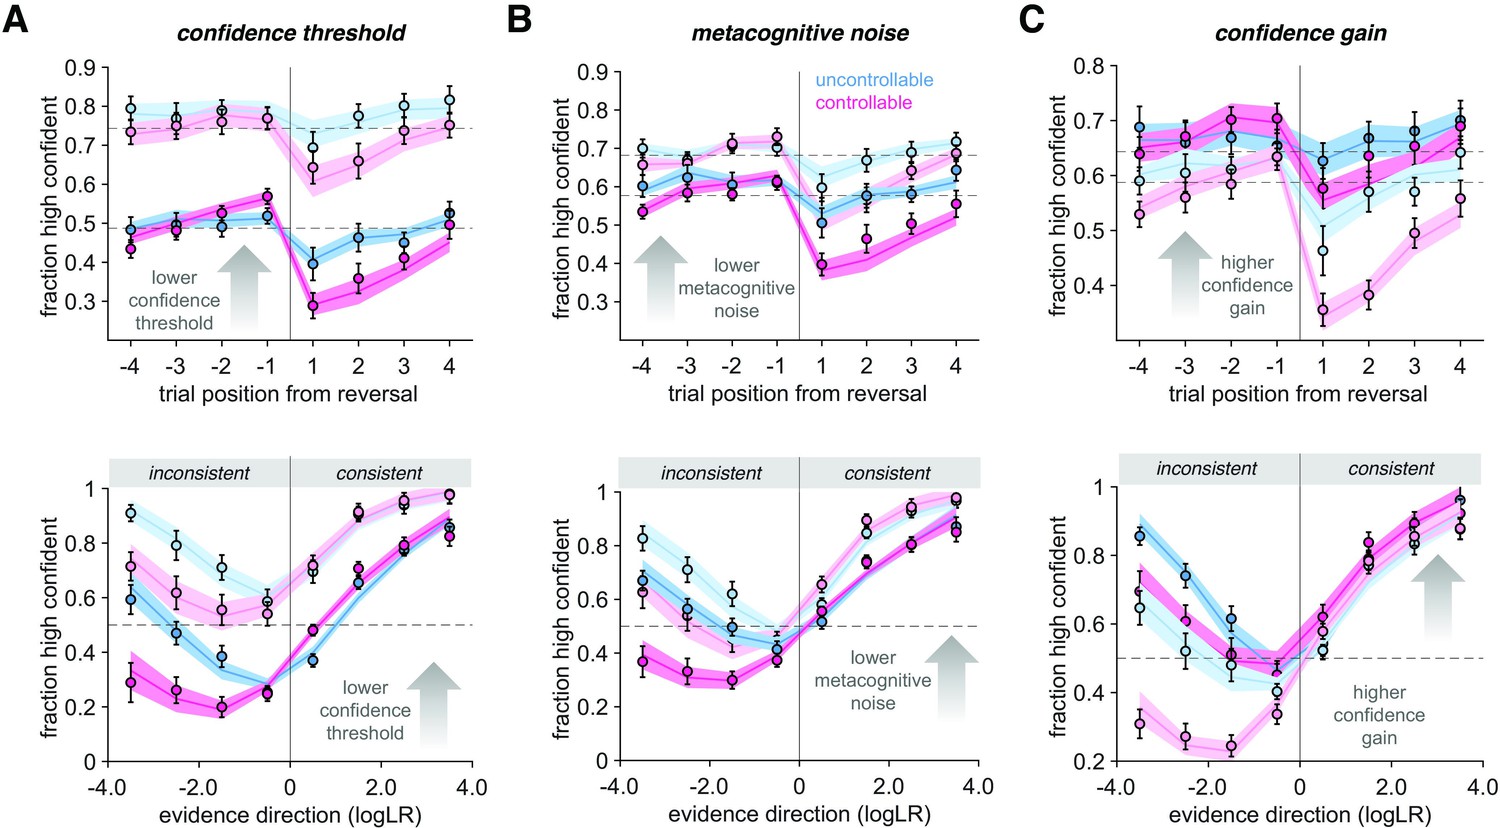
Effect of confidence threshold, metacognitive noise, and confidence gain parameters on confidence patterns.
(A–C) Effect of confidence threshold (A), metacognitive noise (B), and confidence gain (C) parameters on confidence patterns. Reversal and repetition curves for confidence, with human data (circles) and simulations from the best-fitting computational model (shaded area) in uncontrollable (C-, blue) and controllable (C+, pink) conditions. Bars and error bars represent mean and SEM across participants (N = 16 per group, median split of best-fitting confidence threshold, metacognitive noise, and confidence gain, respectively). Note that choice curves are not shown because the three confidence parameters have no effect on choices, by definition. Lighter colors indicate lower parameter values in all panels. Same conventions as Figure 2 and Figure 3.
Figure 5
Bayesian normative model describing choices and confidence.
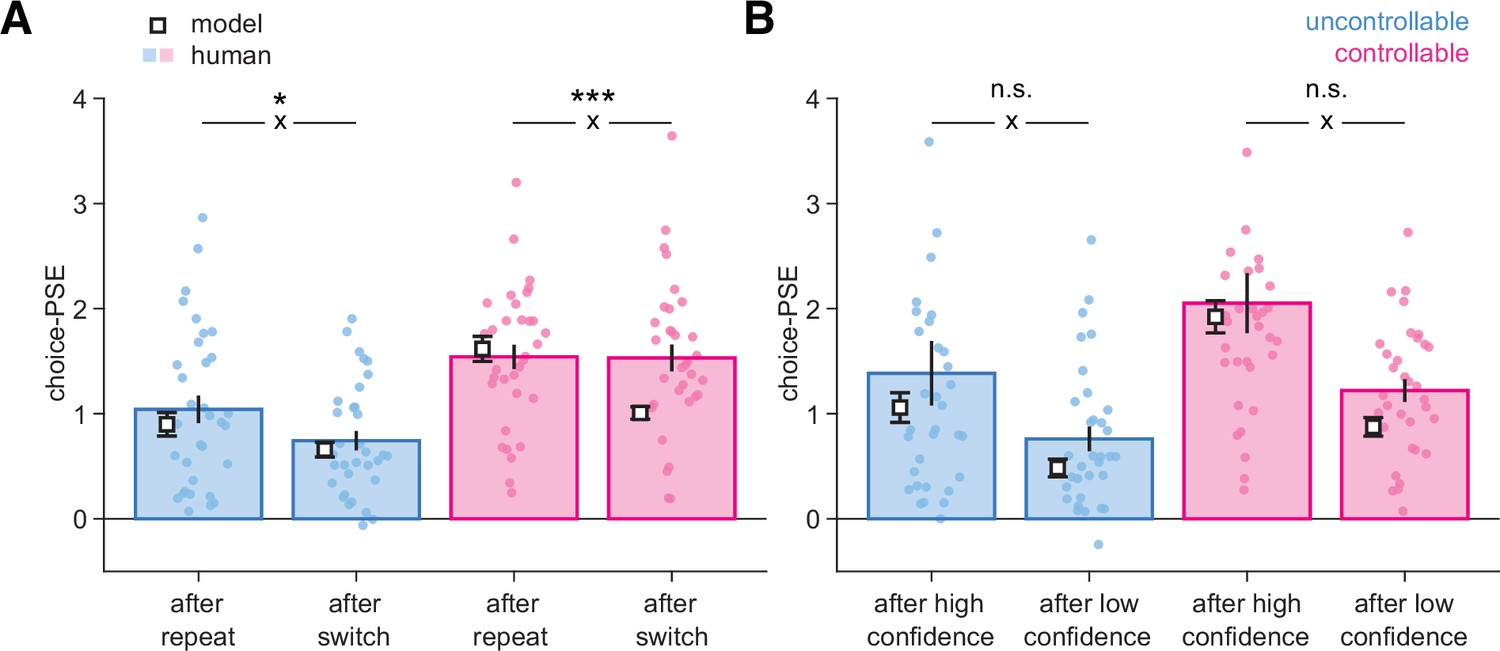
(A) Psychometric parameter choice-PSE (point of subjective equivalence) fitted separately on trials following a repeat vs. a switch in the uncontrollable (C-, blue) and controllable (C+, pink) conditions. Statistical significance from an ANOVA is indicated for the interaction (cross) between response type (after a repeat, after a switch) and data type (human, model). *p=0.027, ***p=0.000025, n.s., nonsignificant. (B) Psychometric parameter choice-PSE fitted separately on trials following a high-confidence vs. a low-confidence response in each condition. Small circles indicate individual data points (N = 33), bars and error bars indicate mean and SEM for human data. White squares and error bars indicate mean and SEM for model simulations of different participant sessions. Statistical significance from an ANOVA is indicated for the interaction (cross) between response type (after high confidence, after low confidence) and data type (human, model). n.s., nonsignificant.
Figure 6 with 3 supplements
Alpha-band magnetoencephalography (MEG) as a window onto the neural basis of changes-of-mind (Experiment 4).
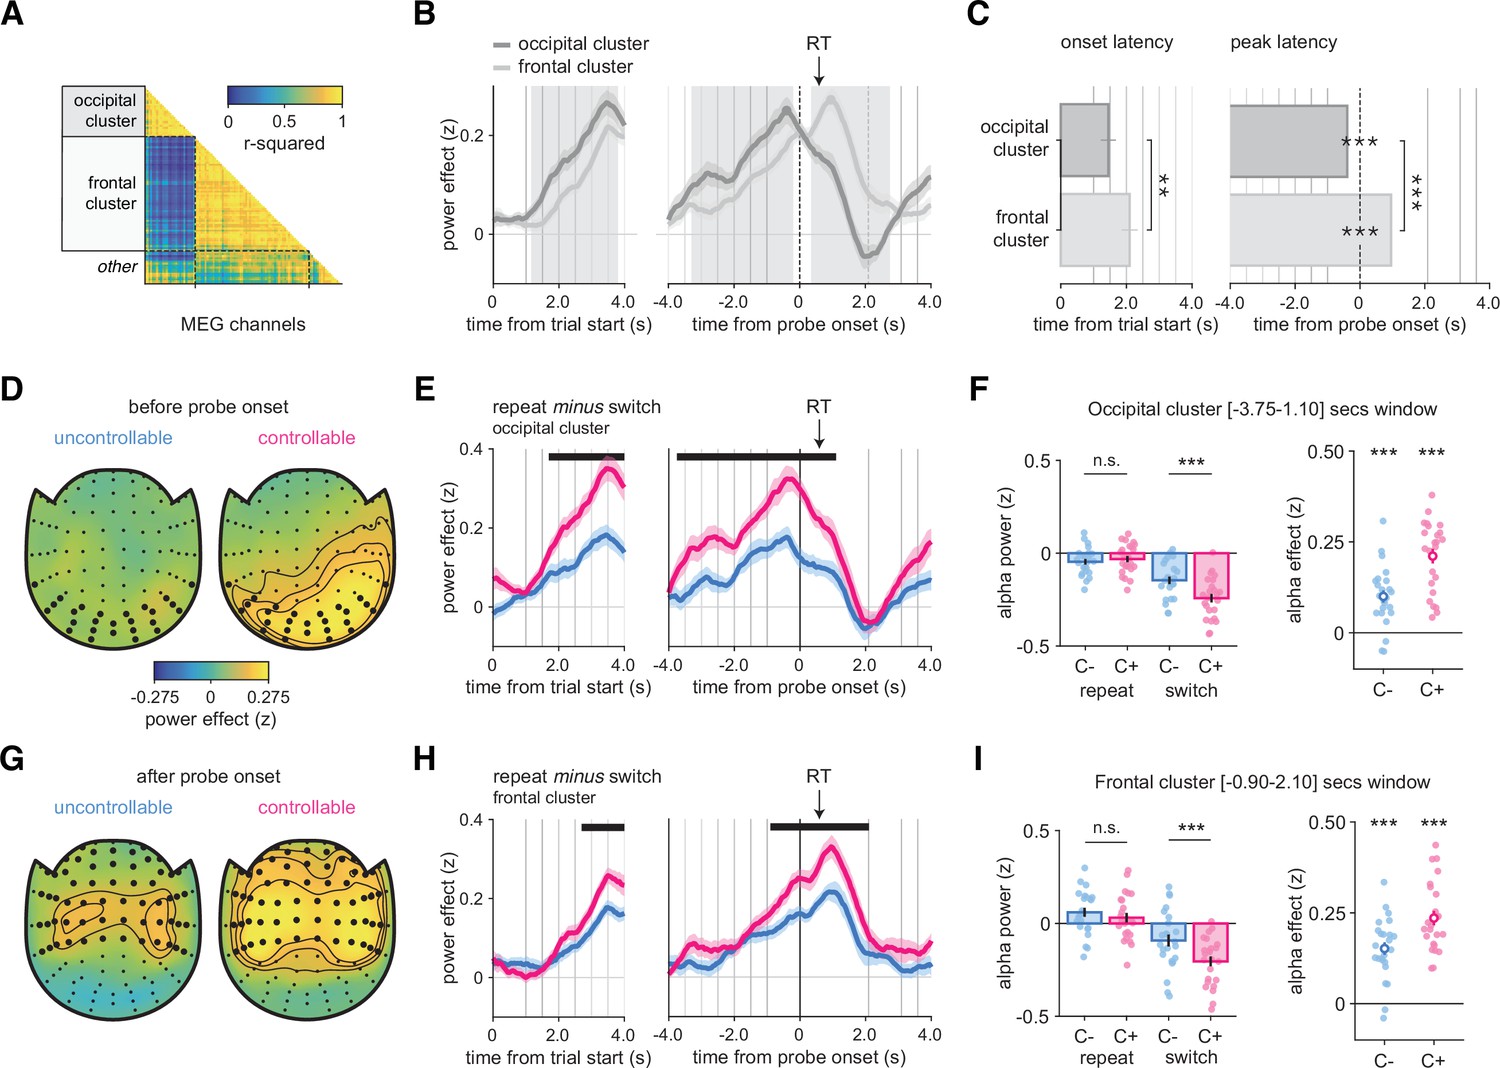
(A) Pairwise correlation matrix of time courses of alpha-band contrast between repeat and switch trials across all MEG channels, grouped into two main clusters, labeled as occipital and frontal based on their localization. (B) Average time course of alpha-band contrast between repeat and switch trials for the occipital (dark gray) and frontal (light gray) clusters, time-locked at trial onset (left panels) or response probe onset (right panels). Shaded areas indicate time windows (1: before probe onset, 2: after probe onset) in which time courses in the two clusters significantly differ. (C) Left panel: onset latency of the contrast between repeat and switch trials, locked to trial onset. Right panel: peak latency of the contrast between repeat and switch trials, time-locked to response probe onset. Bars and error bars indicate jackknifed means and SEM. (D, G) Spatial topography of the contrast between repeat and switch trials in the time window (1) before probe onset (D) and in the time window (2) after probe onset (G), in the uncontrollable (left) and controllable conditions (right). (E, H) Contrast of repeat minus switch trials in the C- (blue) and C+ (pink) conditions time-locked at the trial onset (left panels) or response probe onset (right panels). Horizontal lines indicate statistical significance at p<0.05 corrected. Vertical lines indicate trial events: probe onset, samples of the sequence, and the response probe onset. The black arrow indicates the average response time across conditions and participants. (F, I) Left panels: stars indicate significance from post hoc tests from an ANOVA with condition (C-, C+) and response type (repeat, switch) as within-participant factors on the time window statistically significant after correction identified in (E) and (H), respectively. Bars and error bars indicate mean and SEM. Right panels: stars indicate significance for paired t-tests of the contrast between repeat and switch trials in each condition separately. Circle and error bar indicate mean and SEM. *p<0.05, **p<0.01, ***p<0.001. N = 24 participants. See also Figure 6—figure supplement 1 for raw effects in occipital and frontal clusters.
Figure 6—figure supplement 1
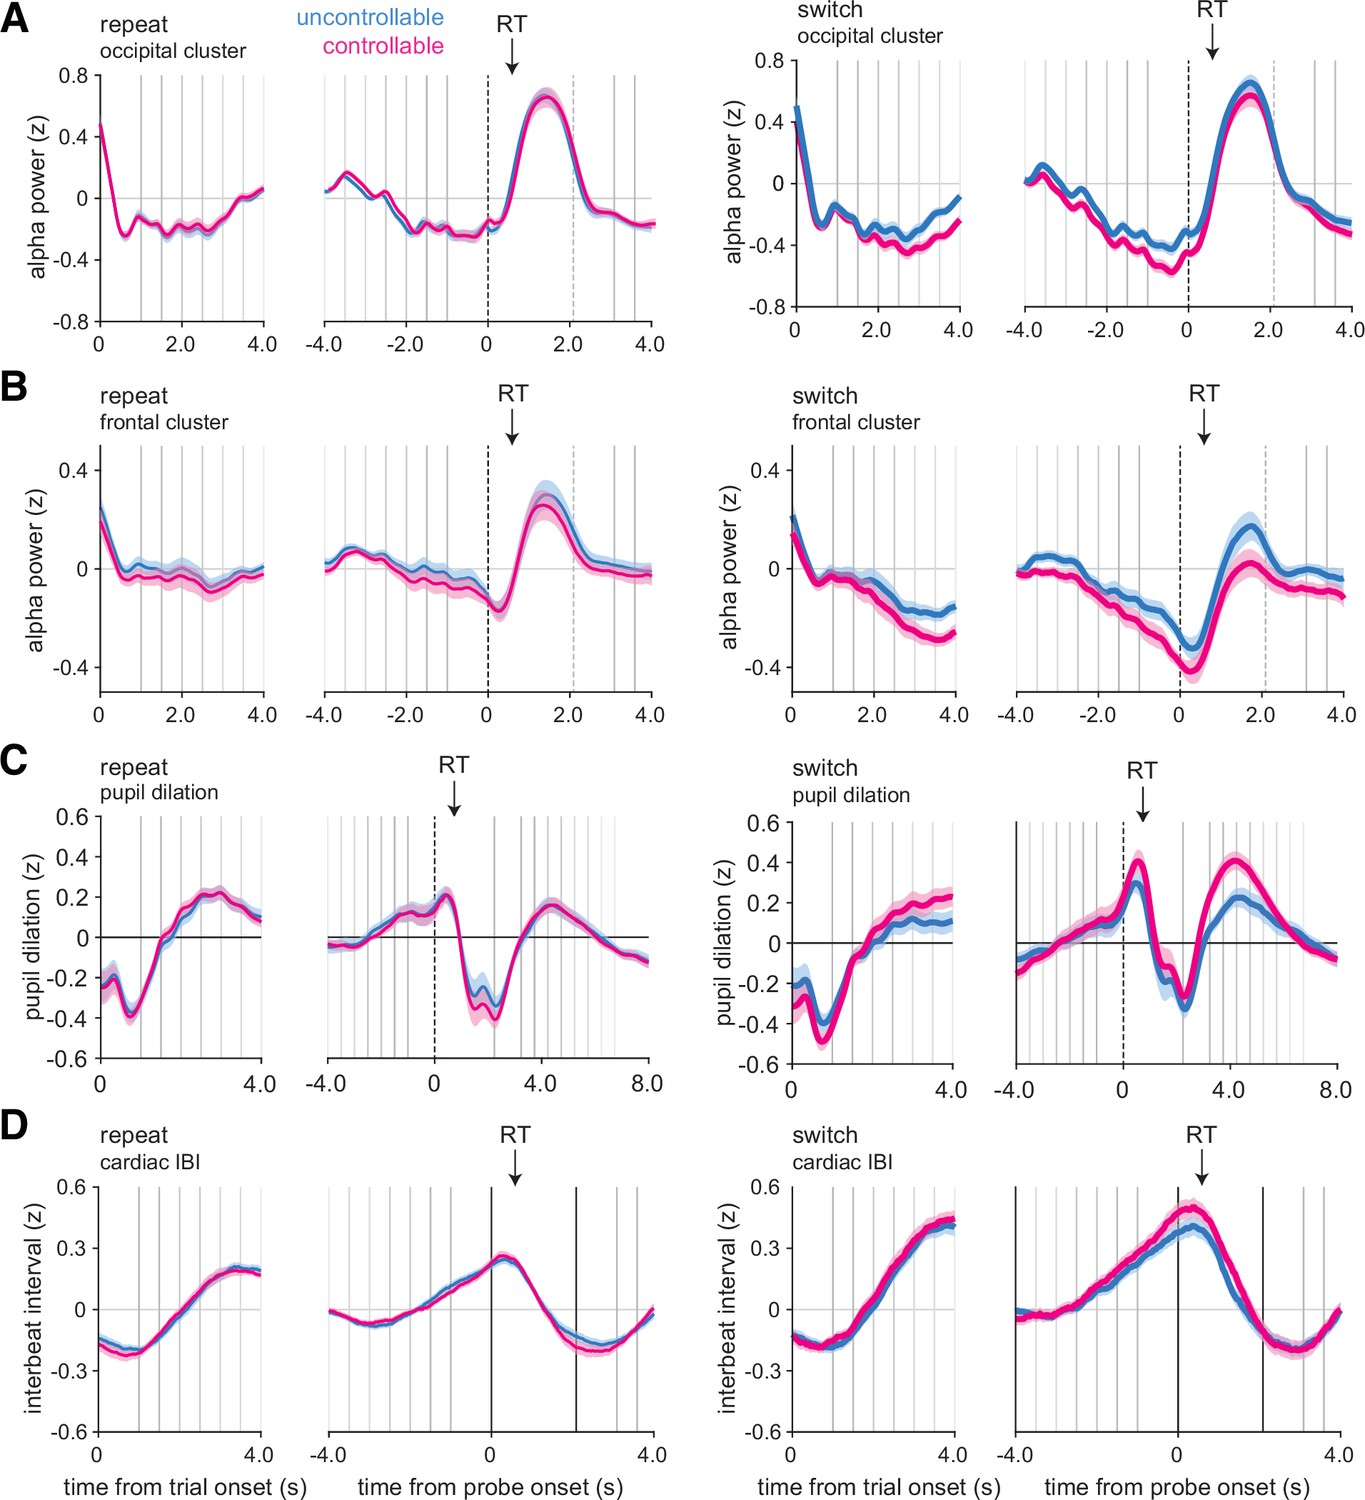
Raw time courses of magnetoencephalography (MEG), pupil, and interbeat interval (IBI) data.
(A) Raw time course of alpha-band power on repeat (left panels) and switch (right panels) trials in MEG for the occipital cluster. (B) Raw time course of alpha-band power on repeat (left panels) and switch (right panels) trials in alpha-band for the frontal cluster. (C) Raw time course of pupil dilation on repeat (left panels) and switch (right panels) trials. (D) Raw time course of cardiac IBI on repeat (left panels) and switch (right panels) trials. In all panels, physiological responses were time-locked at the trial onset or the response probe onset. Vertical lines indicate trial events: trial onset, samples of the sequence, and response probe onset. Black arrows indicate the average response time across conditions and participants. Blue, uncontrollable (C-) condition; pink, controllable (C+) condition. N = 24 participants from Experiment 4 for panels (A, B, D). N = 32 participants pooled across Experiments 1 and 2A for panel (C).
Figure 6—figure supplement 2
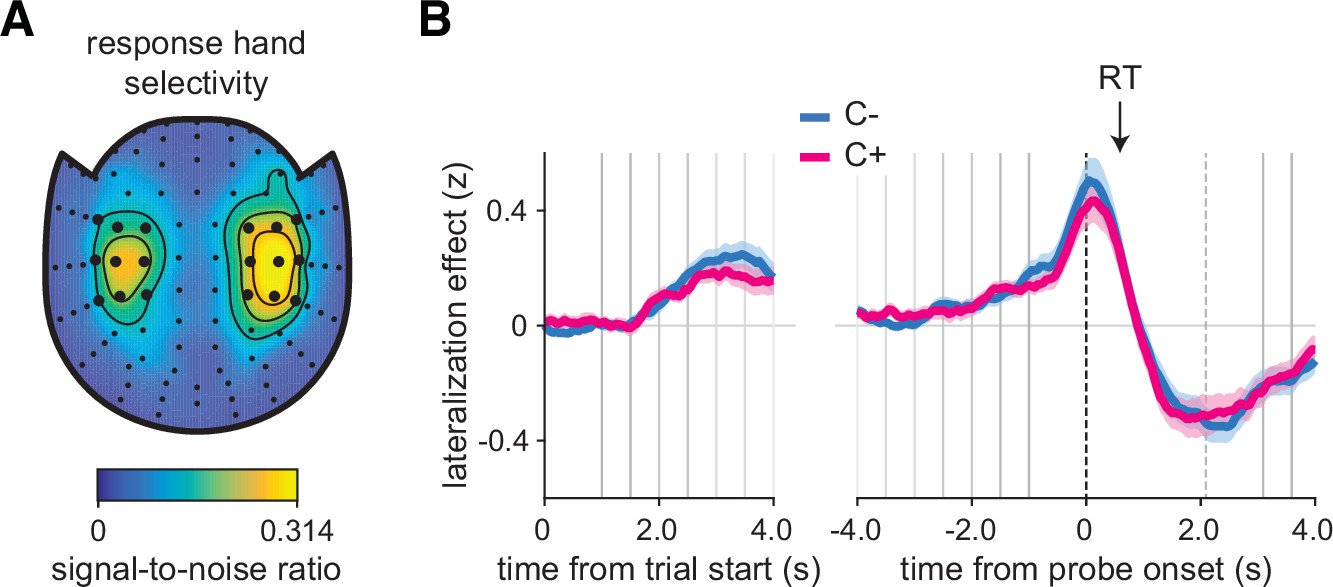
Motor response preparation effects in alpha-band magnetoencephalography (MEG) (Experiment 4).
(A) Spatial topography of response hand selectivity at response onset, measured in units of signal-to-noise ratio. Large dots indicate the left and right channels used to compute a lateralization effect over time surrounding response probe onset. (B) Contrast of switch minus repeat trials time-locked at the trial onset (left part) or the response probe onset (right part). Vertical lines indicate trial events: probe onset, samples of the sequence, and response probe onset. The black arrow indicates the average response time across conditions and participants (N = 24). Blue, uncontrollable condition (C-); pink, controllable condition (C+).
Figure 6—figure supplement 3
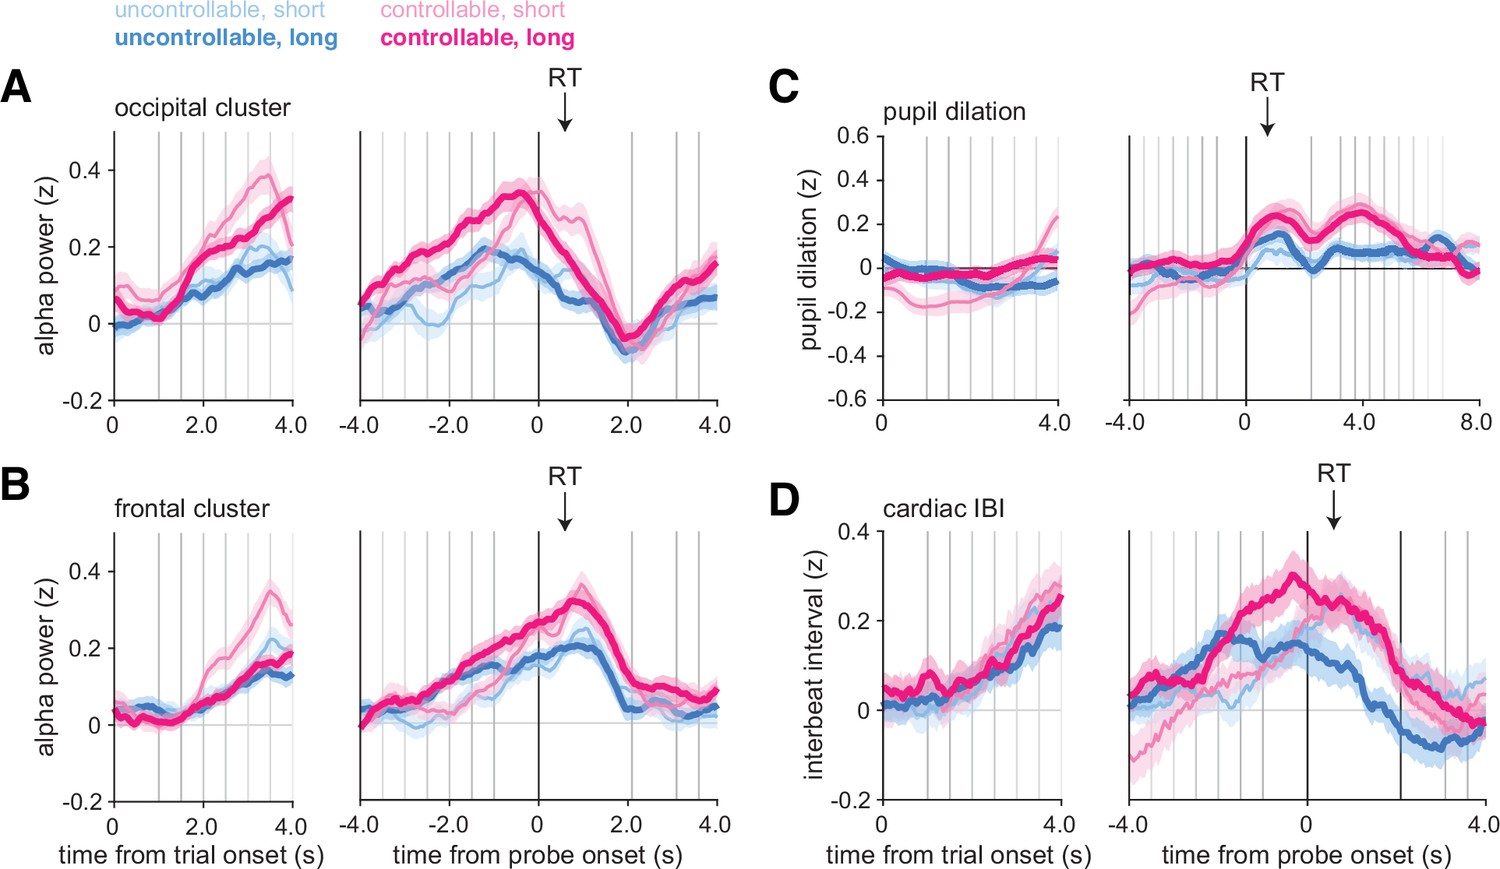
Physiological analyses controlling for sequence length.
Contrast between repeat and switch trials for alpha-band power in the occipital cluster (A) and frontal cluster (B) for pupil dilation (C) and cardiac interbeat interval (D) separately for short (2–4 samples) and long (6–8 samples) trial sequences. In all panels, physiological responses were time-locked to trial onset (left panels) or response probe onset (right panels). Lines represent averages and shaded areas SEM across participants. Vertical lines indicate trial events: probe onset, samples of the sequence, and the response probe onset. Black arrows indicate average response time across conditions and participants. Blue: uncontrollable (C-) condition; pink: controllable (C+) condition. N = 24 participants from Experiment 4 for panels (A, B, D). N = 32 participants pooled across Experiments 1 and 2A for panel (C).
Figure 7
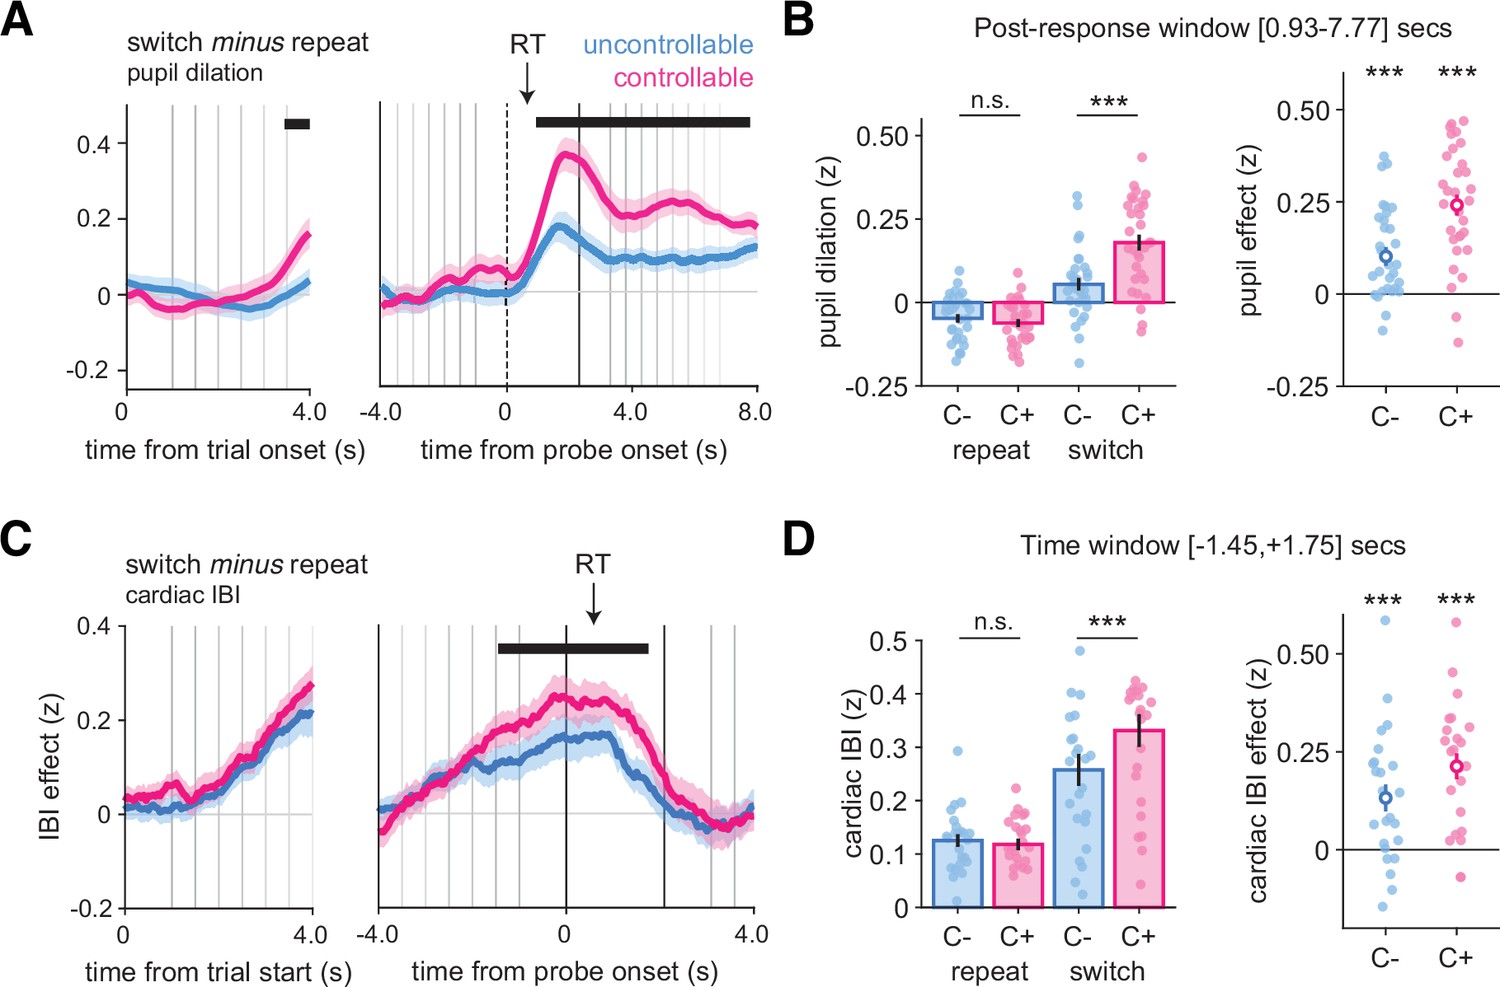
Larger pupil dilation and cardiac interbeat interval (IBI) signals on changes-of-mind.
(A) Pupil dilation on switch minus repeat decisions time-locked at the trial onset (left panels) and response probe onset (right panels). Shaded areas indicate mean and standard error across participants at each time point. The horizontal lines indicate statistical significance at p<0.05 corrected from ANOVAs with condition (C-, C+) and response type (repeat, switch) as within-participant factors. The black arrow indicates the average response time across conditions and participants (N = 31, pooled across Experiments 1 and 2). (B) Post hoc ANOVA effects on the time windows statistically significant after correction using permutation tests identified in (A). Stars correspond to significance of paired t-tests between conditions in the time window, ***p<0.001, n.s., not significant. Bars and error bars indicate mean and SEM (N = 31). (C) Cardiac IBI on switch minus repeat decisions time-locked at the trial onset (left panels) and response probe onset (right panels). Shaded areas indicate mean and standard error across participants at each time point (N = 24, Experiment 4). (D) Post hoc ANOVA effects on the time window statistically significant after correction using permutation tests identified in (C). Stars indicate significance for paired t-tests of the contrast between switch and repeat trials in each condition separately (***p<0.001). Circle and error bar indicate mean and SEM (N = 24). In all panels, vertical lines indicate trial events: trial onset, samples of the evidence, and the response probe onset (dotted line). Blue: C- condition; pink: C+ condition. See also Figure 6—figure supplement 1 for raw dynamics of pupil response and cardiac IBI.
Figure 8 with 1 supplement
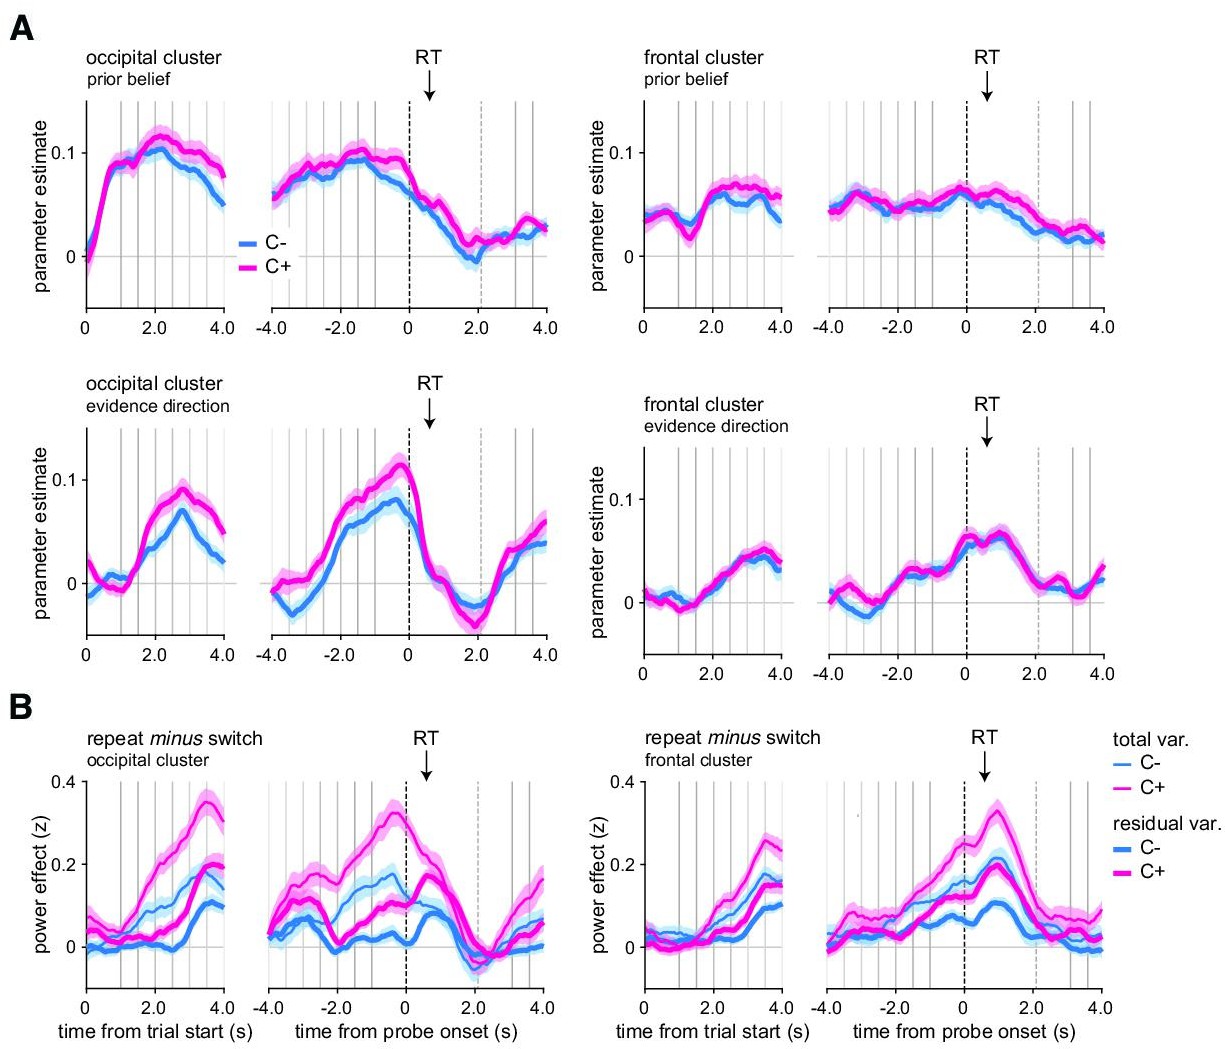
In controllable environments, changes-of-mind effects cannot be explained away by fluctuations in prior beliefs or evidence direction.
(A) Effects of prior belief and evidence direction on magnetoencephalography (MEG) alpha-band power in the occipital cluster (left panels) and frontal cluster (right panels). (B) For MEG alpha-band power in the occipital cluster (left panels) and frontal cluster (right panels), contrast between repeat and switch trials time-locked at the trial onset (left panels) or response probe onset (right panels) after removing the variance due to fluctuations in prior belief and evidence direction (thick lines, residual variance) in the uncontrollable (blue, C-) and controllable (pink, C+) conditions. Raw contrasts are displayed for comparison (thin lines, total variance). Vertical lines indicate trial events: probe onset, samples of the sequence, and response probe onset (dotted line). The black arrow indicates the average response time across conditions and participants. total var.: total variance; residual var.: residual variance after accounting for the two model variables, prior belief and evidence direction. Shaded error bars indicate SEM (N = 24).
Figure 8—figure supplement 1
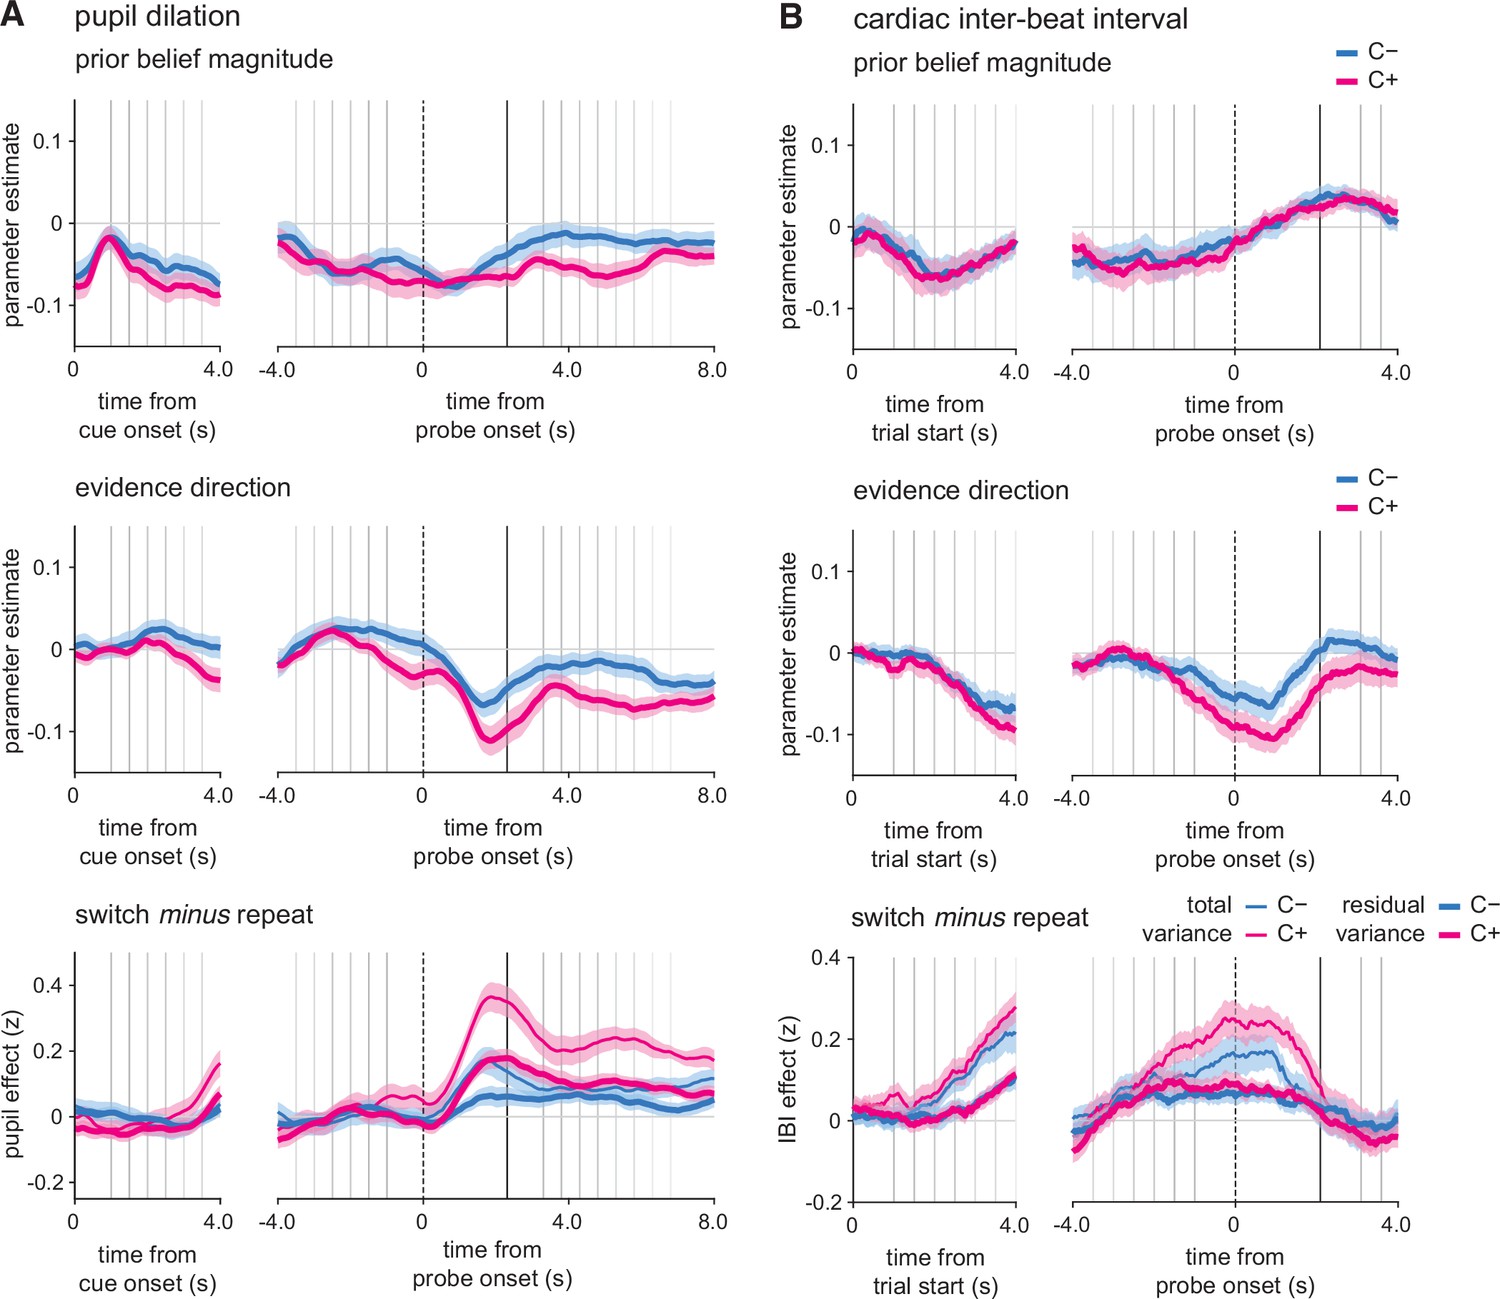
Changes-of-mind effects after accounting for fluctuations in prior beliefs or evidence direction.
(A) Effects of prior belief and evidence direction on pupil dilation (N = 31) and cardiac interbeat interval (IBI; N = 24). For pupil dilation (A) and cardiac IBI (B), contrast between repeat and switch trials time-locked at the trial onset (left panels) or response probe onset (right panels) after removing the variance due to fluctuations in prior belief and evidence direction (thick lines, residual variance) in the uncontrollable (blue, C-) and controllable (pink, C+) conditions. Raw contrasts are displayed for comparison (thin lines, total variance). Vertical lines indicate trial events: probe onset, samples of the sequence, and response probe onset (dotted line). The black arrow indicates the average response time across conditions and participants. total var.: total variance; residual var.: residual variance after accounting for the two model variables, prior belief and evidence direction. Shaded error bars indicate SEM.
Author response image 1
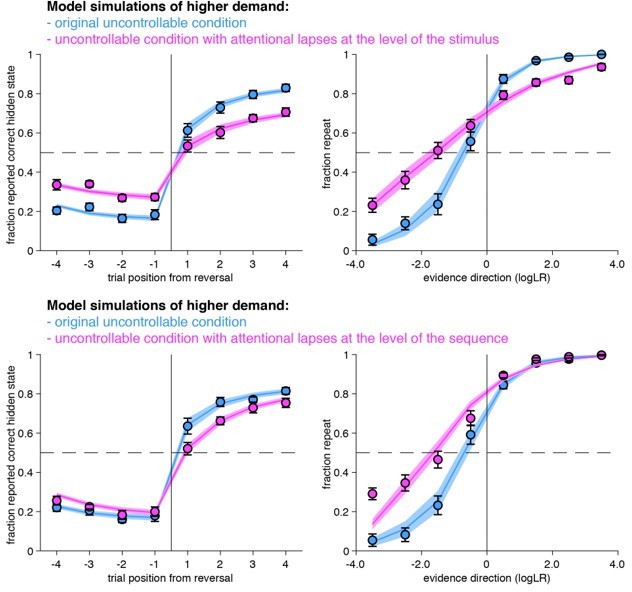
Model simulations of the original uncontrollable condition (blue) and an uncontrollable condition further altered by an increased working memory demand (purple).
Attentional lapses were implemented at the level of the stimulus within a sequence (variant 1, top row) or at the level of the whole sequence (variant 2, bottom row). Both forms of attentional lapses resulted in a slower adaptation after reversals (left column) and a decreased sensitivity to evidence (right column), all inconsistent with participants’ choice patterns observed in the C+ condition.
Additional files
Download links
A two-part list of links to download the article, or parts of the article, in various formats.
Downloads (link to download the article as PDF)
Open citations (links to open the citations from this article in various online reference manager services)
Cite this article (links to download the citations from this article in formats compatible with various reference manager tools)
Controllability boosts neural and cognitive signatures of changes-of-mind in uncertain environments
eLife 11:e75038.
https://doi.org/10.7554/eLife.75038


