Impaired astrocytic Ca2+ signaling in awake-behaving Alzheimer’s disease transgenic mice
- GliaLab at the Letten Centre, Division of Anatomy, Department of Molecular Medicine, Institute of Basic Medical Sciences, University of Oslo, Norway
- Division of Anatomy, Department of Molecular Medicine, Institute of Basic Medical Sciences, University of Oslo, Norway
- Statistics and Data Science group, Department of Mathematics, Faculty of Mathematics and Natural Sciences, University of Oslo, Norway
- Norwegian Computing Center, Norway
- Department of Neurology, Oslo University Hospital, Norway
- Department of Pharmacology, University of Oslo and Oslo University Hospital, Norway
- Department of Clinical and Molecular Medicine, Norwegian University of Science and Technology, Norway
- Office of the President, Karolinska Institutet, Sweden
Figures
Figure 1
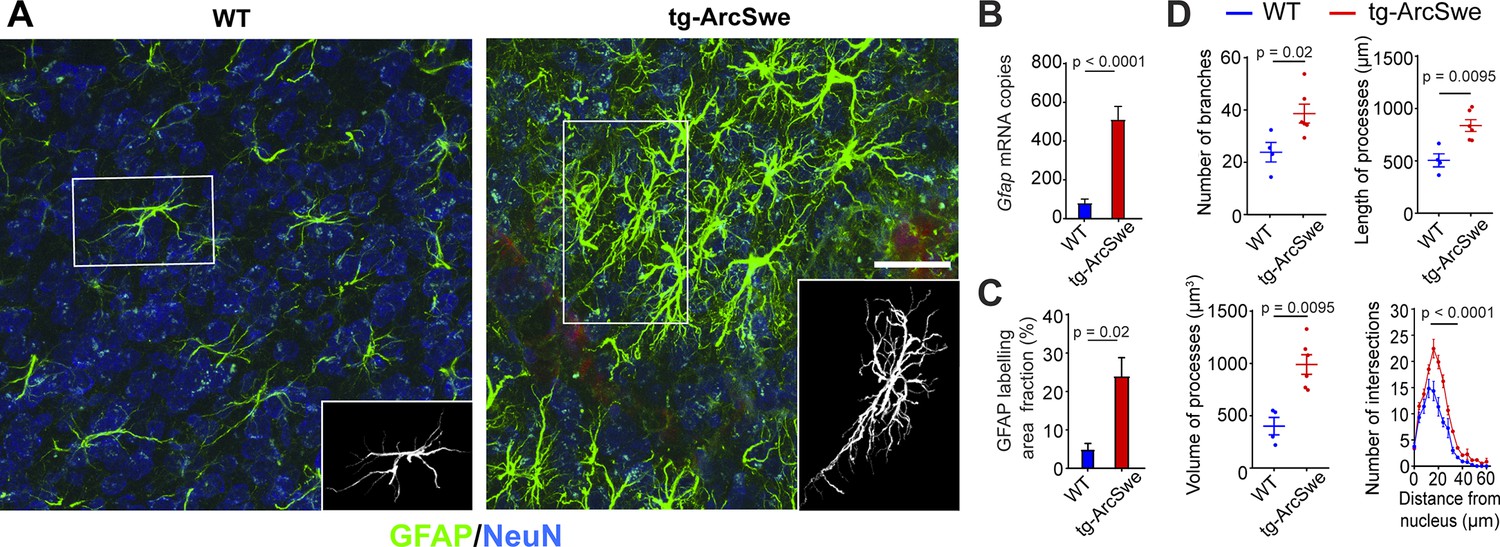
Widespread reactive astrogliosis in tg-ArcSwe mice.
(A) Representative micrographs of 15-month-old wildtype (WT) and tg-ArcSwe mice somatosensory cortex labeled with anti-GFAP antibodies (green) and anti-NeuN antibodies (blue). Scale bar: 40 μm. (B) Gfap mRNA expression was considerably higher in tg-ArcSwe mice (p<0.0001, n = 8 animals in both groups, Mann–Whitney U-test). (C) The area fraction of GFAP labeling was significantly higher in tg-ArcSwe mice compared to controls (n = 6 tg-ArcSwe and 4 WT littermates). (D) Astrocytes were isolated (inset in A) and analyzed with Simple Neurite Tracer (SNT) plugin in Fiji ImageJ. Tg-ArcSwe mice displayed an increase in the total number of branches (p=0.02), the length and volume of processes (p=0.0095 and 0.095, respectively, two-way ANOVA) of the GFAP-labeled astrocytes (n = 8 astrocytes from each animal; six tg-ArcSwe and four WT littermates), as well as an increased number of branching points and intersections at 16–32 μm distance from the nucleus (p<0.0001, two-way ANOVA).
Figure 2 with 4 supplements
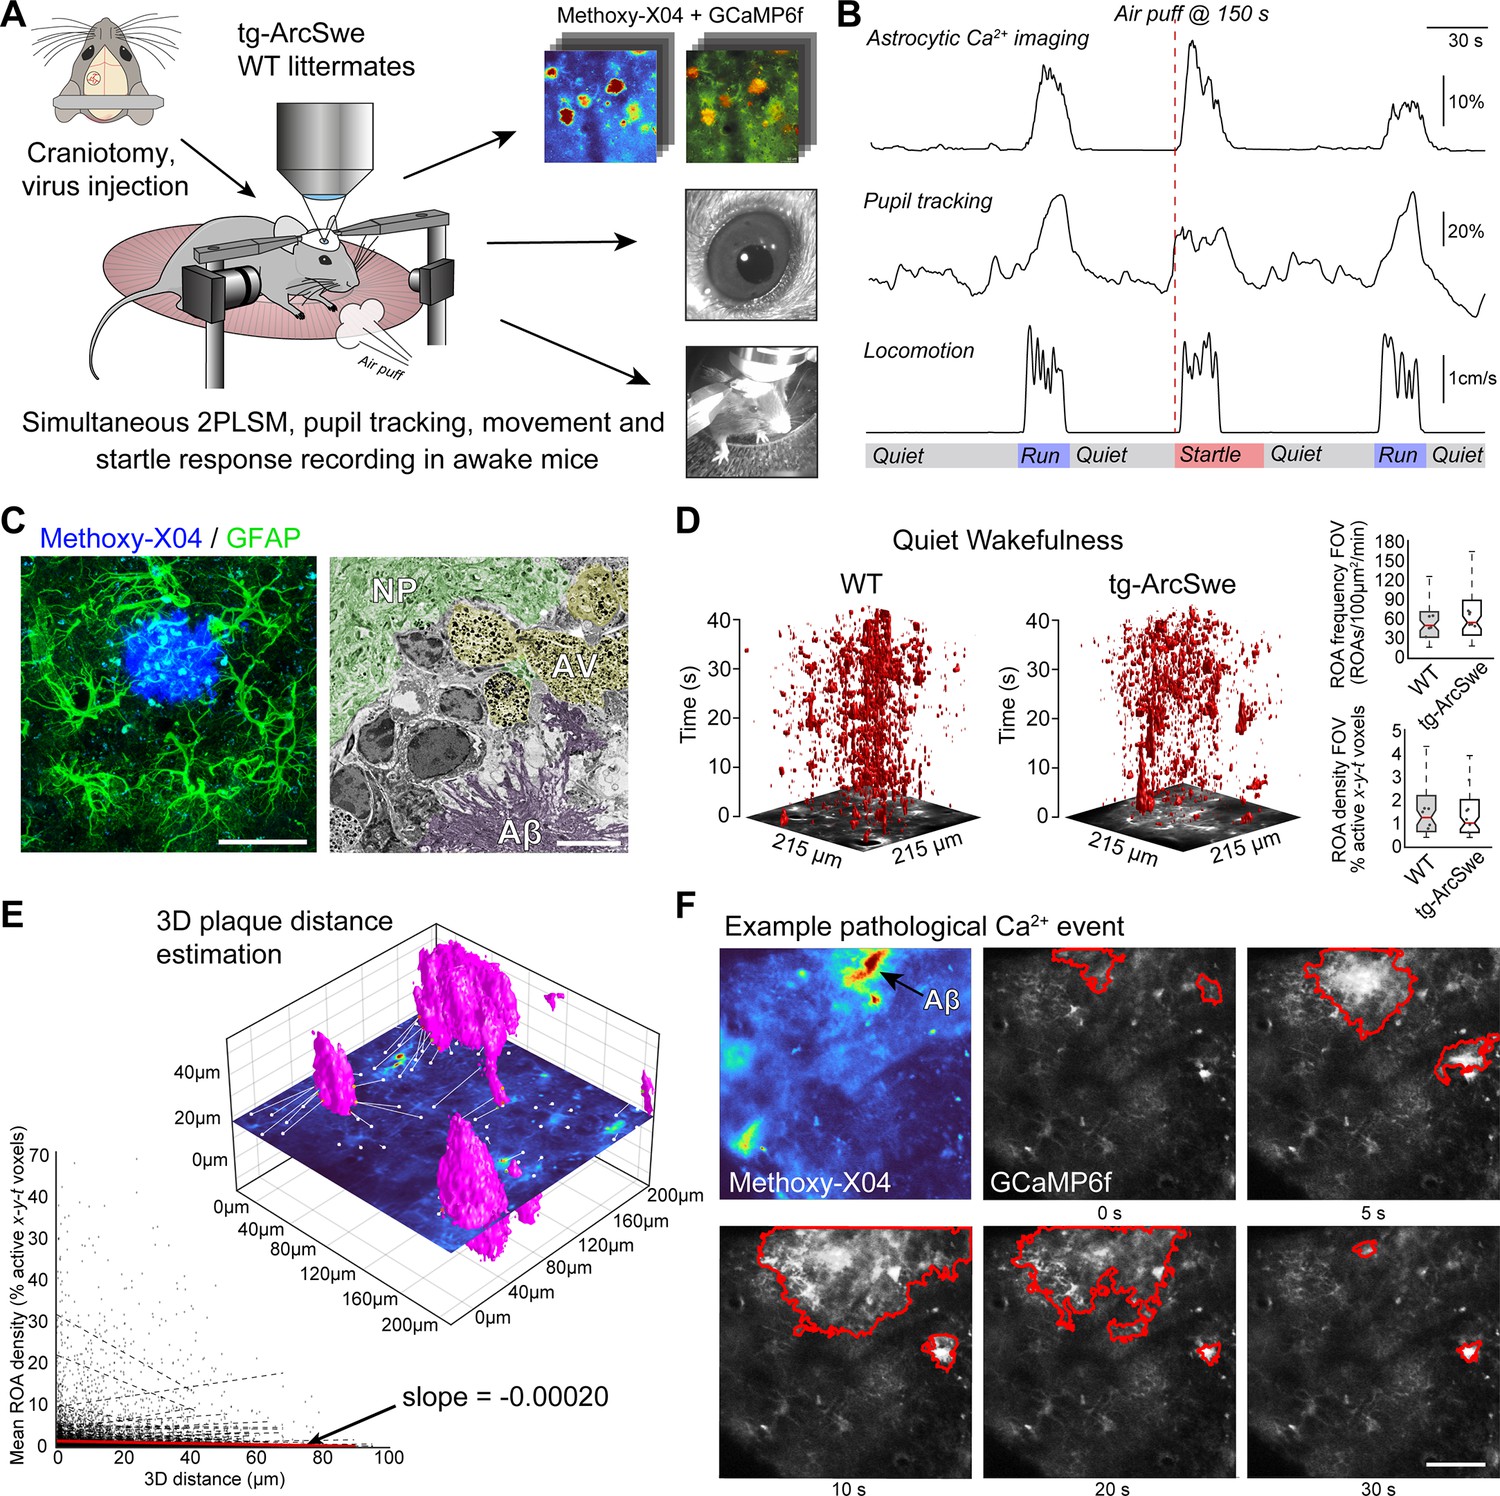
Experimental setup and astrocytic Ca2+ signaling in quiet wakefulness.
(A) A craniotomy was performed and virus encoding GCaMP6f was injected into the somatosensory cortex of tg-ArcSwe mice and wildtype (WT) littermates. After 3 weeks of recovery, mice were habituated to head fixation on a disc-shaped treadmill, allowing the mice to move freely at will. Methoxy-X04 was injected 24 hr prior to imaging to visualize amyloid-β (Aβ) plaques. During imaging, both locomotor activity and pupil responses were recorded. At 150 s in 300 s recordings, the mice were subjected to an air puff to induce a startle response. (B) A representative imaging trial. Simultaneous recording of astrocytic Ca2+ signaling, pupil diameter, and mouse locomotion during quiet wakefulness, spontaneous locomotion, and air puff-induced startle. (C) The mice were ~15 months of age during experiments, at a time when they exhibited dense-core Aβ plaques. Left image: confocal micrograph of an Aβ plaque (methoxy-X04, blue) and astrocytes (anti-GFAP, green). Scale bar: 40 μm. Right image: electron micrograph showing a dense Aβ plaque (purple overlay), autophagic vacuoles (yellow overlay), and relatively normal neuropil morphology (green overlay). Scale bar: 2 μm. (D) Astrocytic Ca2+ signals during quiet wakefulness (absence of locomotion) in the form of regions of activity (ROAs) displayed in an x-y-t 3D rendering where red regions denote signal. Box-and-whisker plots representing overall Ca2+ signals in quiet wakefulness in tg-ArcSwe mice and littermates. (E) 3D visualization of the imaging plane relative to Aβ plaques, with lines representing shortest distance from plaque to region of activity (ROI). We found a low correlation between distance to nearest plaque and the overall level of astrocytic Ca2+ signaling in quiet wakefulness. (F) Example of pathological astrocytic Ca2+ wave emanating from an Aβ plaque. Methoxy-X04 visualized by 2PL (upper left) and time series from the same field of view (FOV) of astrocytic Ca2+ imaging with a pathological signaling event outlined in red. Scale bar: 50 μm.
-
Figure 2—source data 1
A .csv file containing Ca2+ response data (region of activity [ROA] density and frequency), locomotion data, and covariates used for statistical modeling for quiet wakefulness.
- https://cdn.elifesciences.org/articles/75055/elife-75055-fig2-data1-v2.zip
Figure 2—figure supplement 1
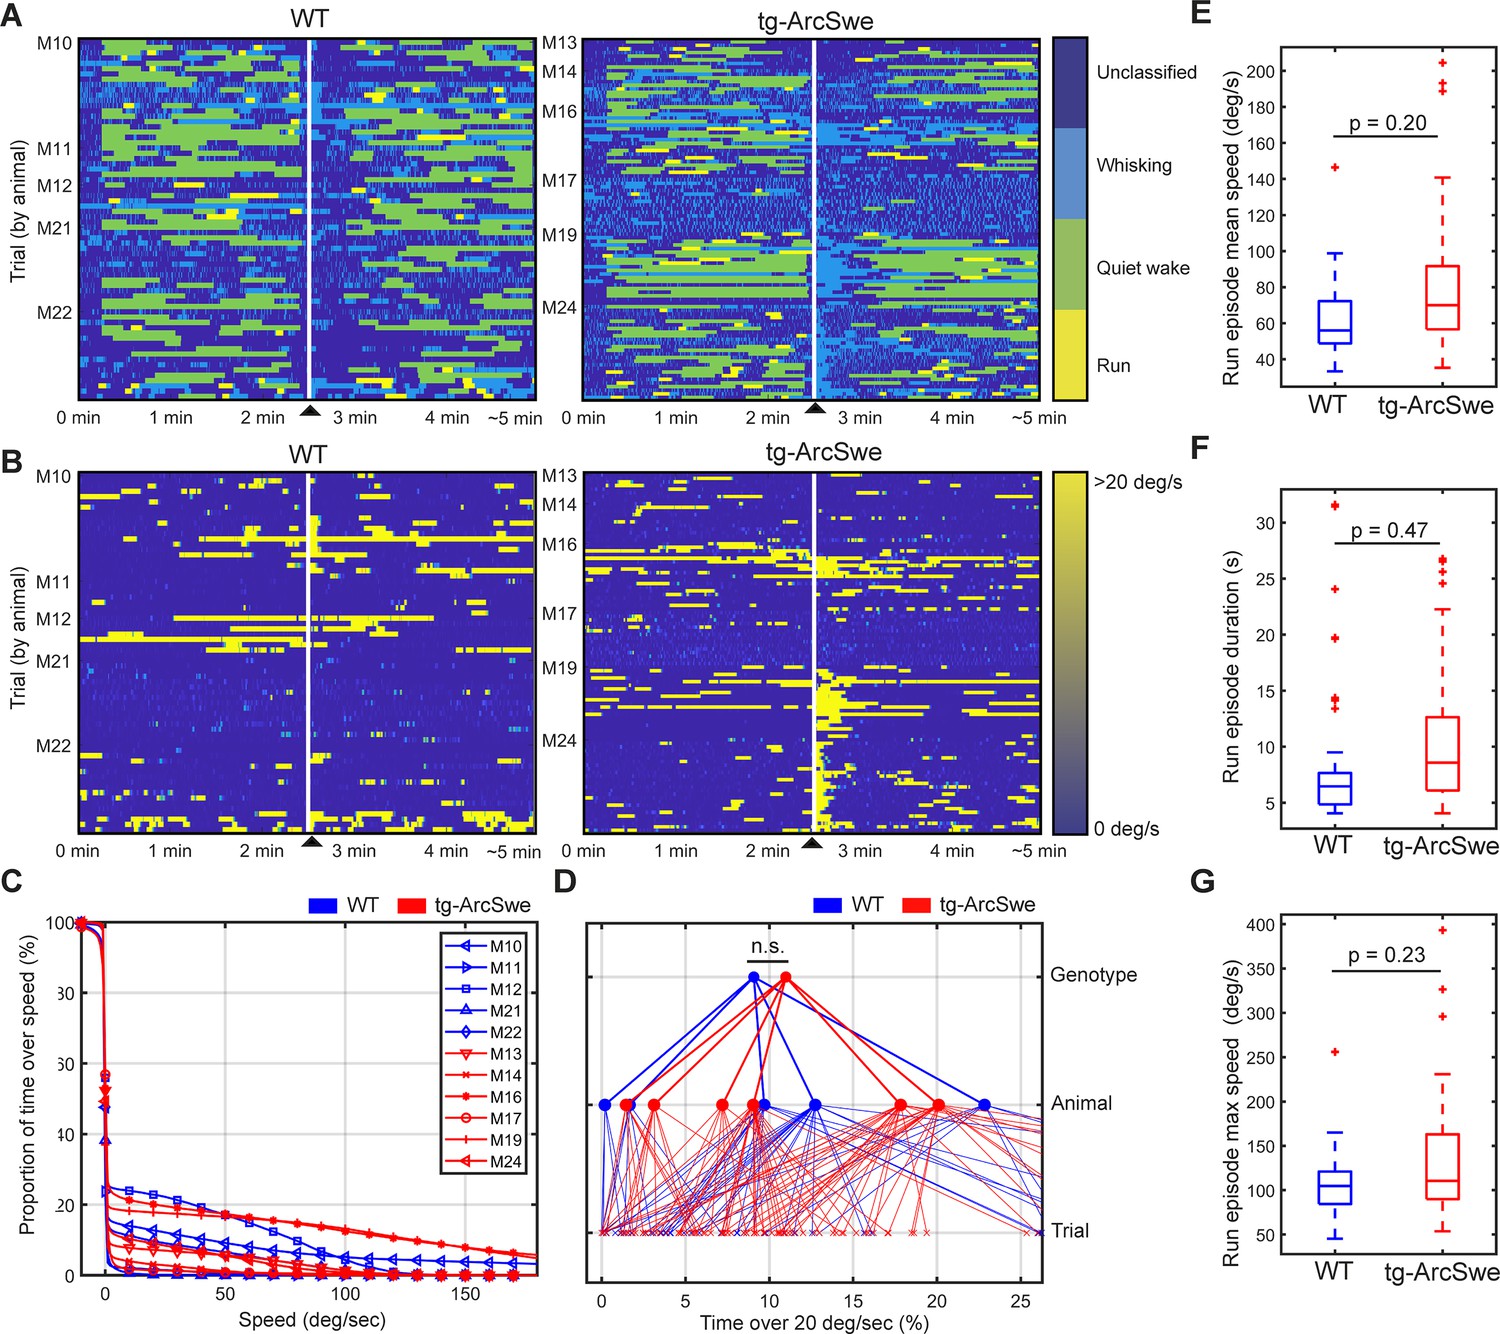
Locomotor behavior in wildtype (WT) and tg-ArcSwe mice.
▲ indicates air-puff. (A) Behavioral classification for each individual trial, grouped by mouse. See ‘Materials and methods’ for classification and filtering algorithm used. (B) Running wheel speed for each individual trial, grouped by mouse. 20 degrees of rotation of the running wheel per second was the threshold used to classify running. (C) Percentage of total time a mouse spent above a given speed across all trials. (D) Percentage of total time a mouse was running (>20°/s). Raw running data not filtered by the run classification algorithm (p=0.35). (E–G) Post-classification run episode characteristics.
Figure 2—figure supplement 2
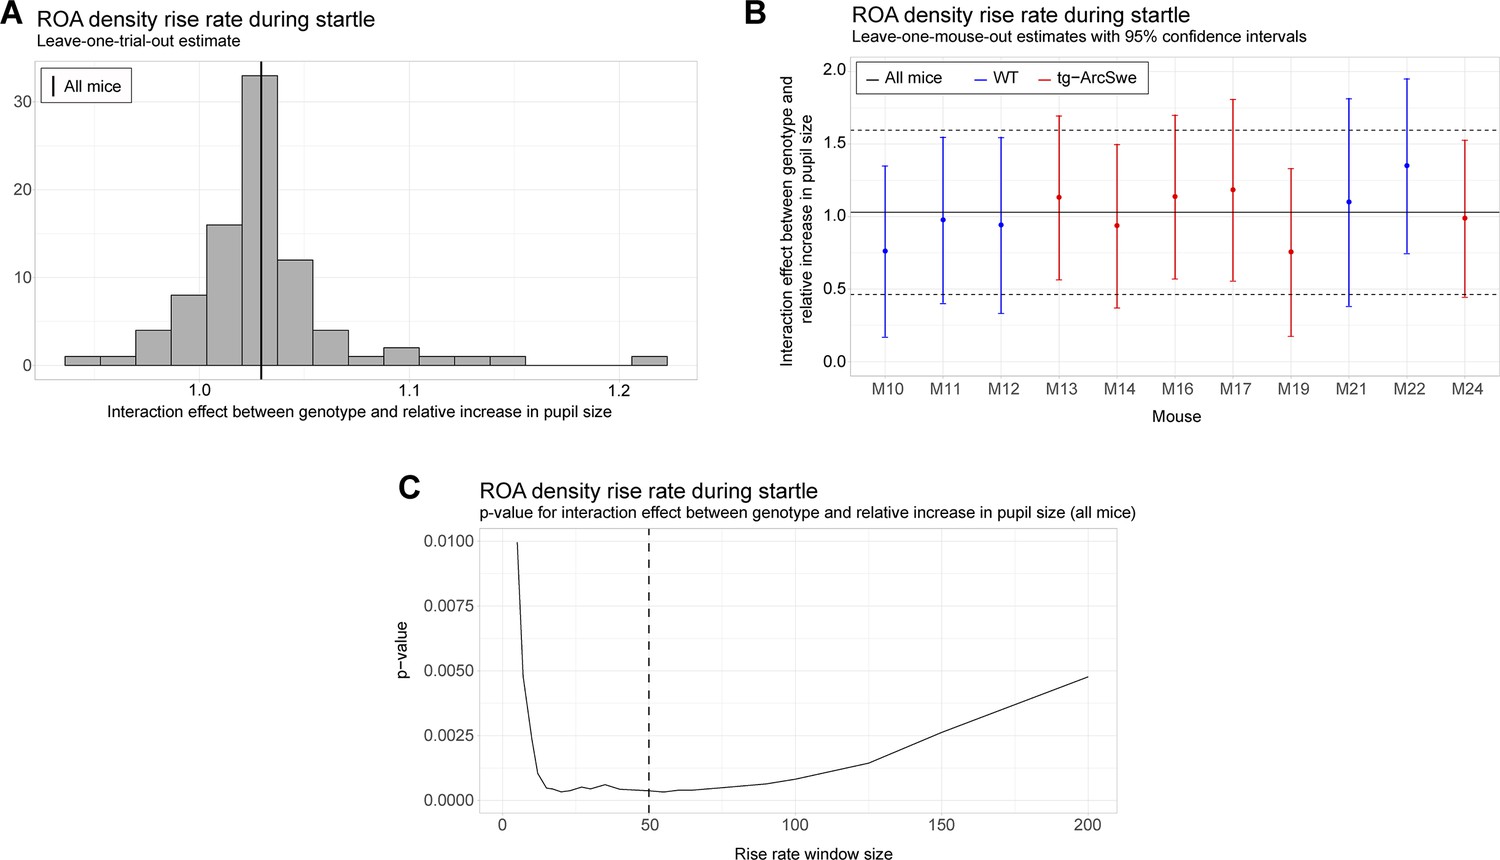
Robustness and sensitivity analyses for the uncoupling between pupil dilation and the region of activity (ROA) density rise rate.
All analyses are with respect to the interaction effect between pupil dilation and genotype. (A) Leave-one-trial-out analysis. The full model is repeatedly estimated removing one trial at the time from the dataset (as a type of jackknife resampling). The estimated interaction coefficients are shown as a histogram. Note that the histogram indicates less variation in the estimated interaction when comparing the variance or empirical quantiles of the histogram with the corresponding confidence interval obtained from the linear mixed effect model (see solid and dashed lines in plot B). (B) Leave-one-mouse-out analysis. In each iteration, one mouse, M10-M24, is removed from the estimation of the model. The estimated interaction effects with corresponding confidence intervals are then compared to the estimate and confidence interval from the full model (solid and dashed horizontal lines). Some mice influence the results more than others, but there appears to be no systematic bias associated with a single mouse. (C) The p-value for the interaction effect for different window lengths. The window length is measured in number of frames. It is clear that the significance of the interaction effect does not depend strongly on a particular choice of window length. In the analysis, we used a window of length 50 frames.
Figure 2—figure supplement 3
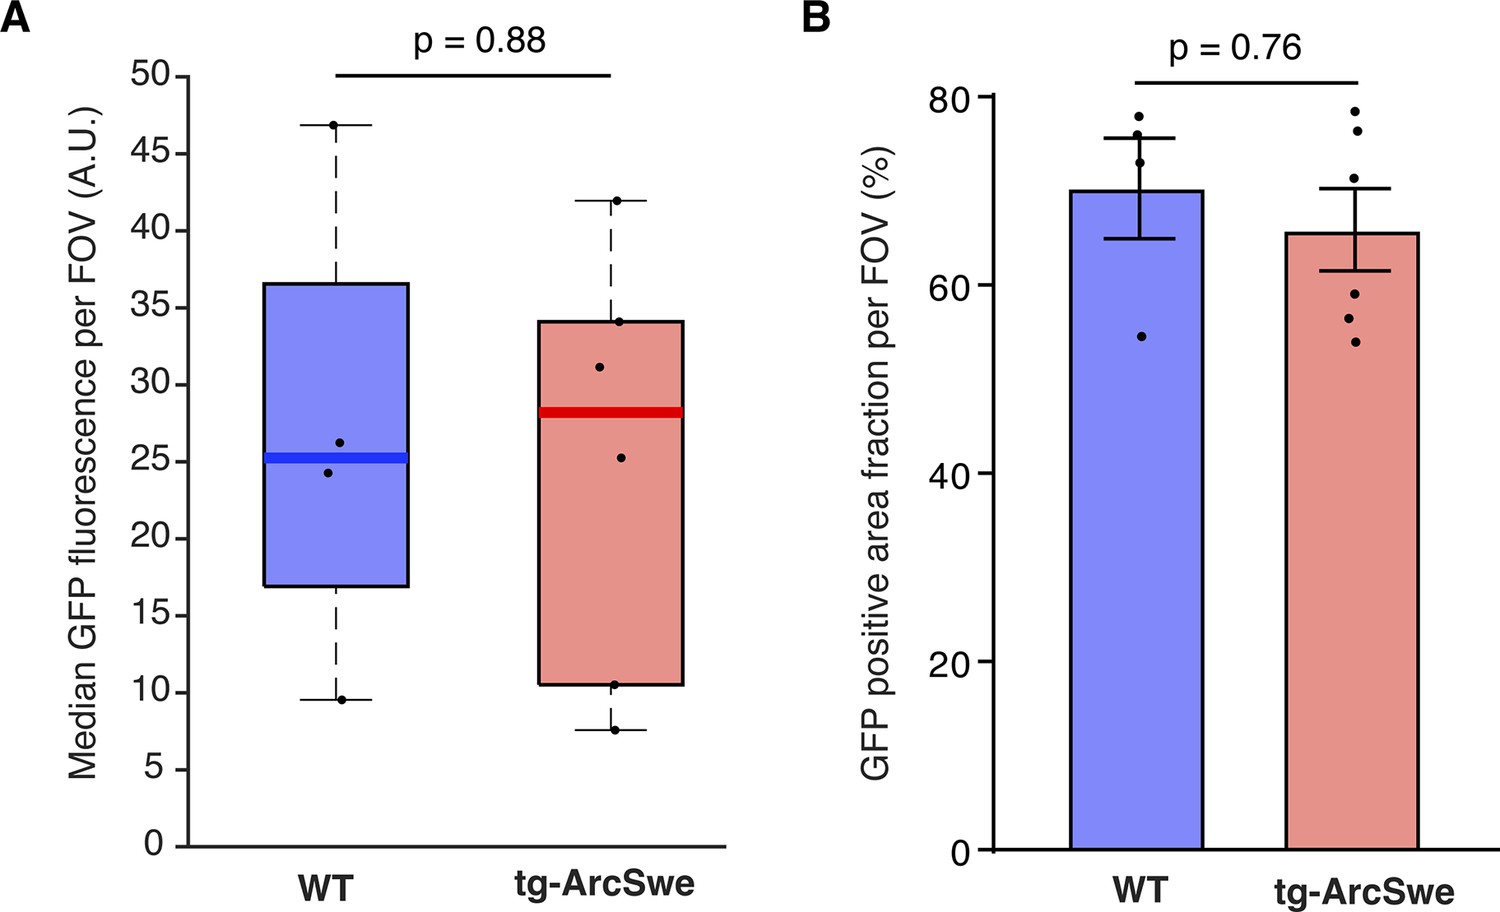
GCaMP6f expression level assessed by GFP labeling.
(A) Median GFP-labeling fluorescence indicative of GCaMP6f expression was similar in the two groups.
Dots represent median values per mouse. (B) Mean area fraction of the field of view (FOV) with GFP labeling was comparable between the two groups.
Figure 2—figure supplement 4
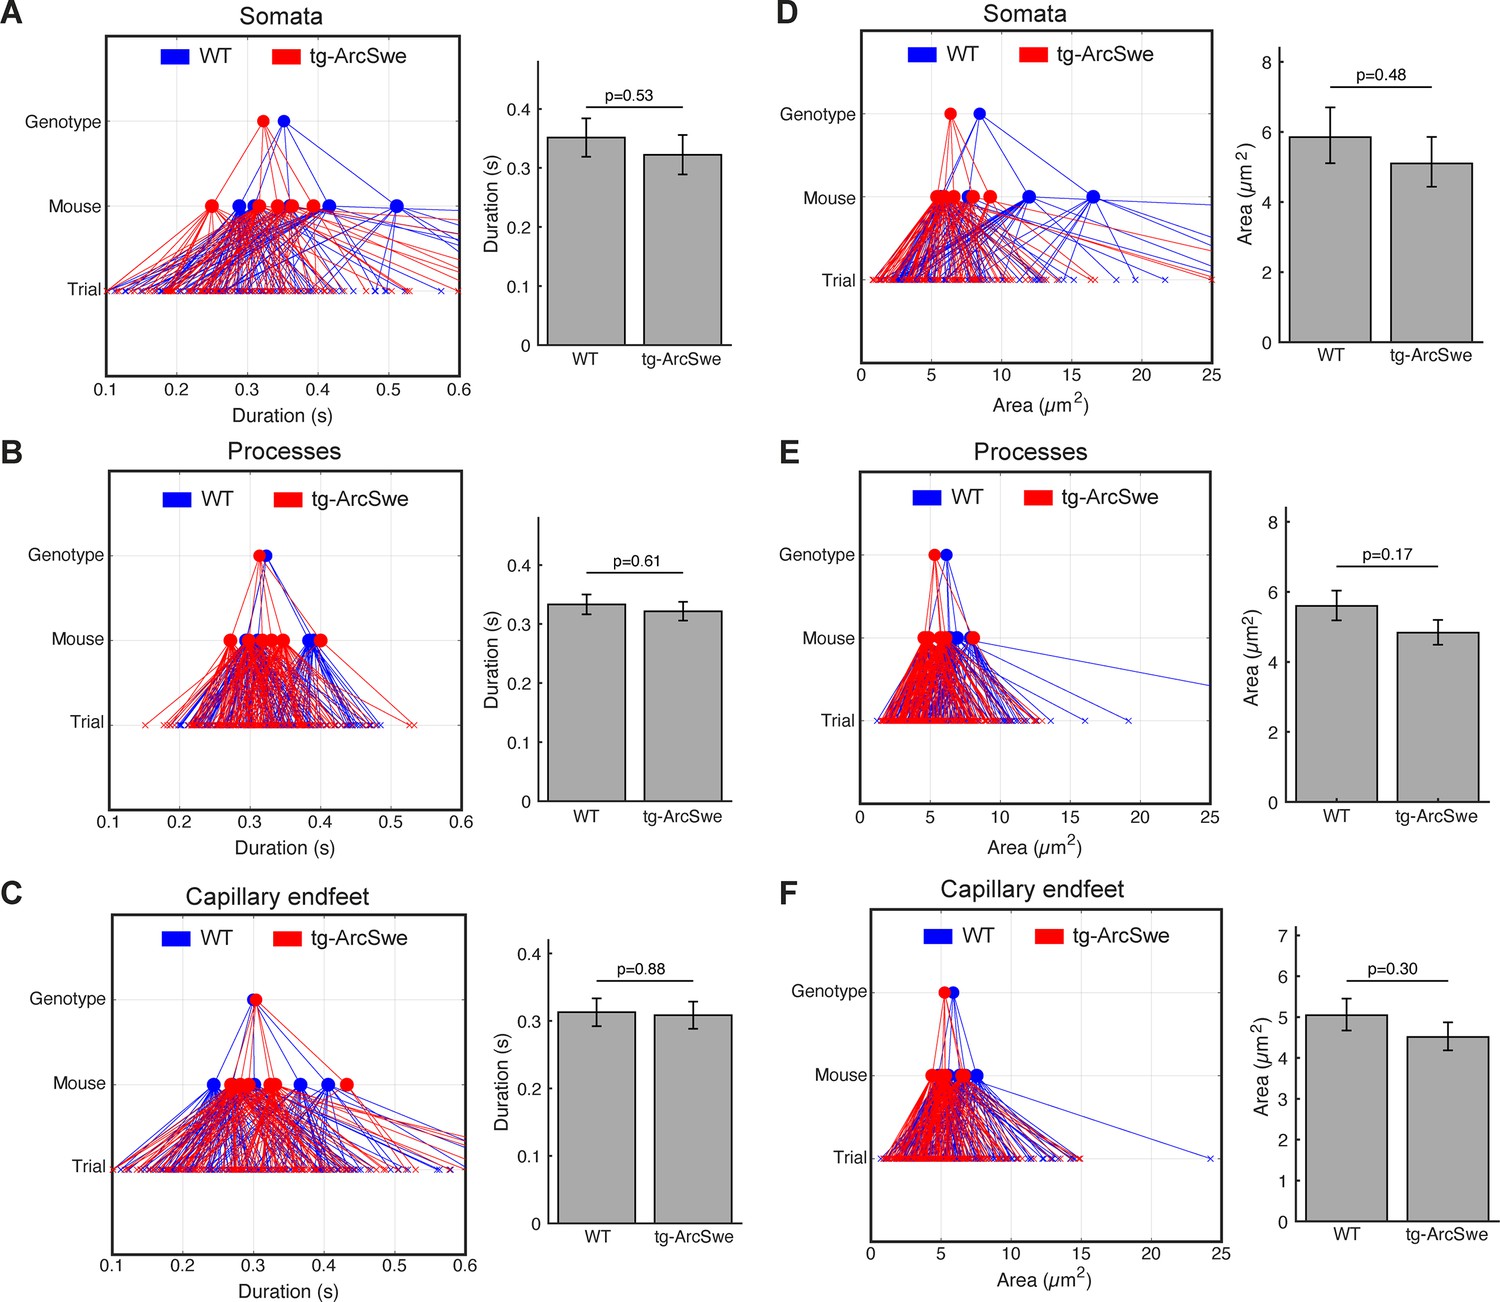
Regions of activity (ROAs) during quiet wakefulness exhibit the same characteristics in both genotypes.
During quiet wakefulness episodes, active regions detected by the ROA algorithm. Compartment association is determined by the center of the ROA. (A–C) Mean duration of active regions during quiet wakefulness in different cellular compartments. Right: GLME statistical analysis estimates. (D–F) Mean maximum size of a detected region. Right: GLME statistical analysis estimates.
Figure 3 with 1 supplement

Uncoupling of pupil dilation and astrocytic Ca2+ responses during spontaneous running.
(A) Left: Representative x-y-t rendering of regions of activity (ROAs) during quiet wakefulness and spontaneous locomotion in wildtype (WT) littermates and tg-ArcSwe mice, where red regions denote signal. A spontaneous run occurred at about 60 s. The slight increase in ROA density at 25 s is due to small locomotor activity that was not large enough to be defined as a run. Right: mean time course of (top-to-bottom) locomotion expressed as wheel speed, relative increase in pupil diameter, and astrocytic Ca2+ signals expressed as ROA density. The locomotion trace shows mean response across all trials with 95% confidence interval, pupil trace, and ROA density traces show median across all trials ± median absolute deviation. (B) Same as (A), but for tg-ArcSwe mice. A spontaneous run occurred at about 40 s. (C) Hierarchical plots showing median value per genotype in upper level, median value per mouse in middle level, and median level per trial in lower level, in the two genotypes. Upper row: plots showing the median levels of ROA density rise rate in (left-to-right) the full FOV, astrocytic somata, astrocytic processes, and astrocytic endfeet. Lower row: Same as upper row, but showing median levels of max ROA density. (D) Scatterplots of ROA density rise rate (left) and max ROA density (right) vs. relative increase in pupil size upon spontaneous running. See Table 2 for statistical analyses and p-values.
-
Figure 3—source data 1
A .csv file containing Ca2+ response data (region of activity [ROA] density and frequency), locomotion data, and covariates used for statistical modeling for spontaneous running.
- https://cdn.elifesciences.org/articles/75055/elife-75055-fig3-data1-v2.zip
Figure 3—figure supplement 1
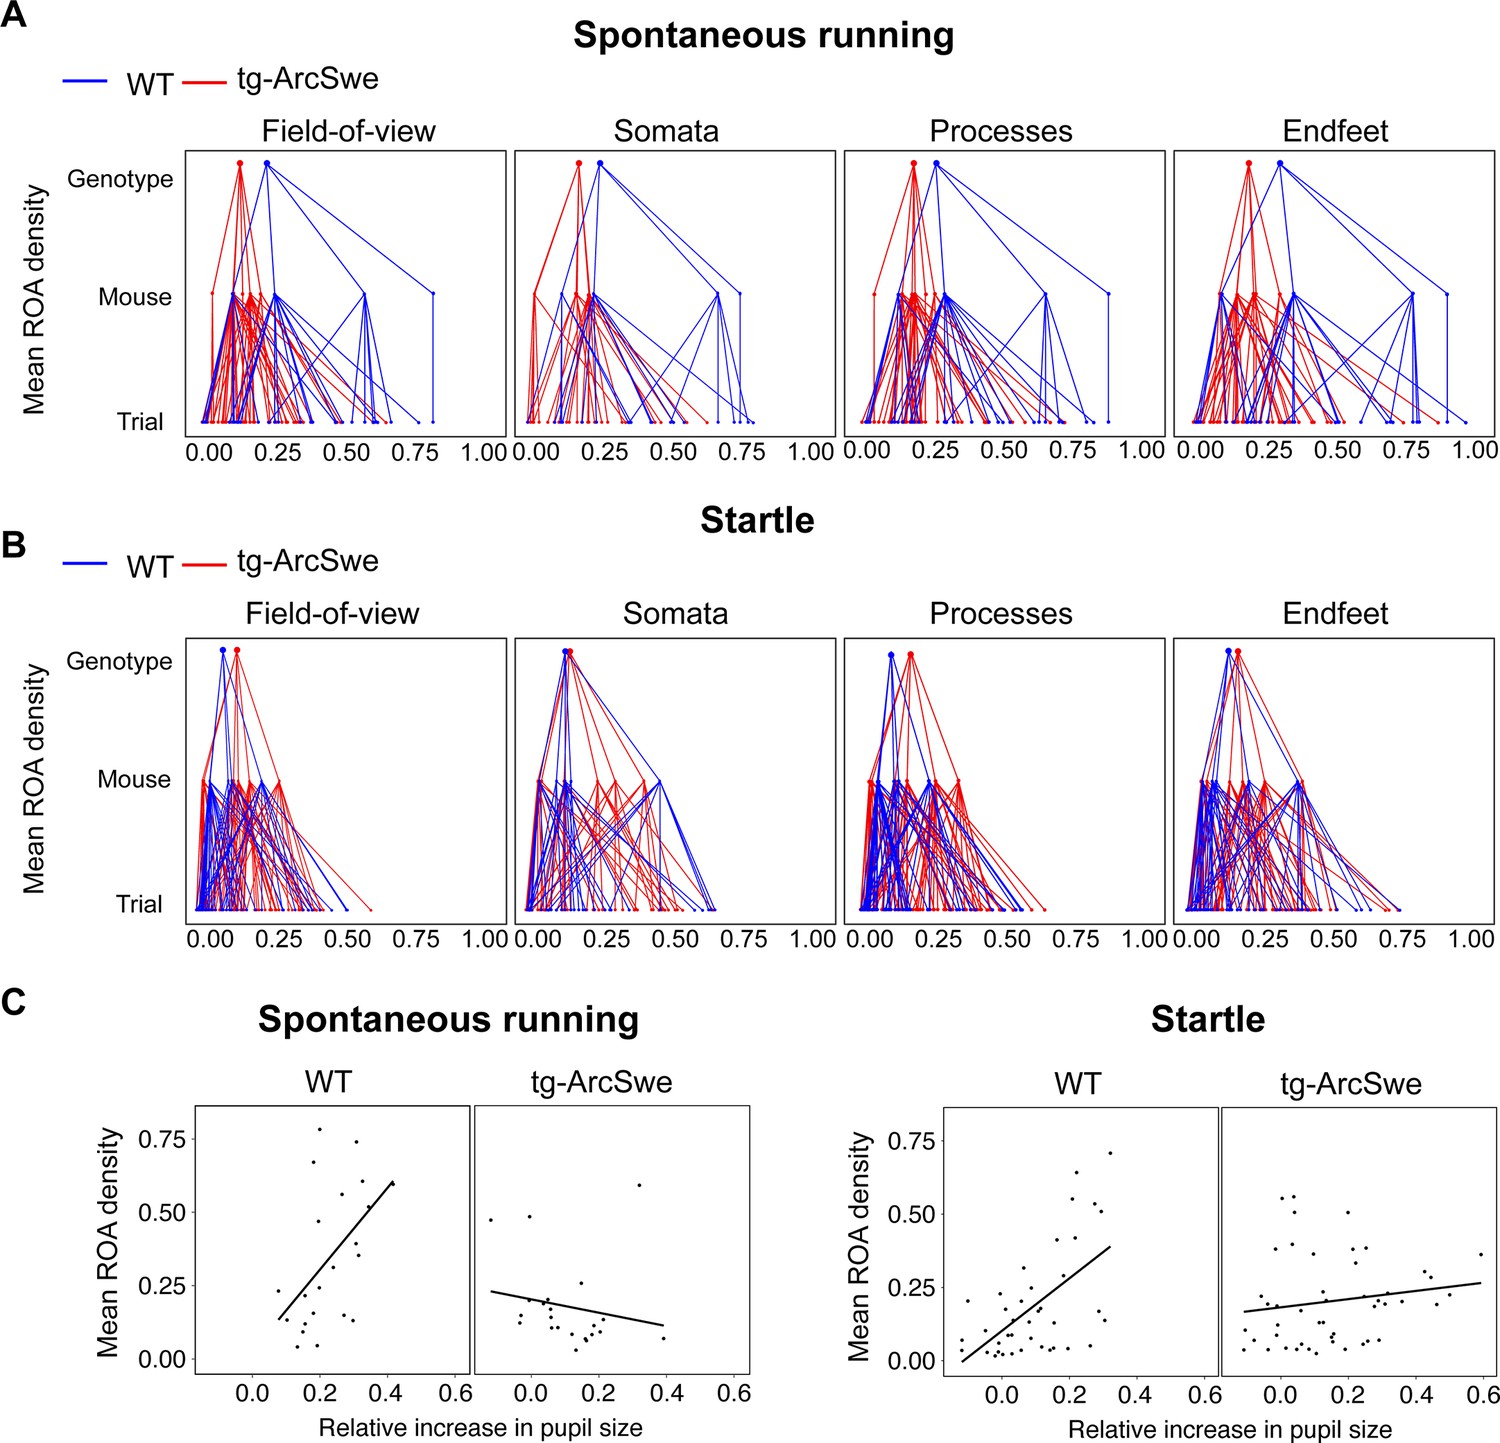
Mean region of activity (ROA) activation in active wakefulness.
(A) Hierarchical plot showing medians of mean region of activity (ROA) density per trial, mouse and genotype in the field of view (FOV), and astrocytic subcellular compartments during spontaneous runs.
(B) Same as (A) but during startle responses. (C) Scatterplots of mean ROA density vs. relative increase in pupil size in spontaneous running and startle responses.
Figure 4 with 3 supplements

Uncoupling of pupil dilation and astrocytic Ca2+ responses during startle.
(A) In wildtype (WT) mice, in an imaging trial of 300 s duration, mice were subjected to an air puff to the face/vibrissa contralateral to the imaging window at 150 s. This caused an increase in locomotor activity, pupil dilation, and a pronounced increase in astrocytic Ca2+ signaling. Region of activity (ROAs) are presented as an x-y-t 3D rendering where red regions denote signal. Locomotion trace shows mean response across trials with 95% confidence interval, pupil trace, and ROA density trace show median activation across trials ± median absolute deviation. (B) Same as (A), but for tg-ArcSwe mice. (C) Hierarchical plots showing median value per genotype in upper level, median value per mouse in middle level, and median level per trial in lower level, in the two genotypes. Upper row: plots showing the median level of the ROA density rise rate in (left-to-right) the full field of view (FOV), astrocytic somata, astrocytic processes, and astrocytic endfeet. Lower row: same as upper row but for max ROA density. (D) Scatterplots of ROA density rise rate (left) and max ROA density (right) vs. relative increase in pupil size. See Tables 3 and 4 for statistical analyses and p-values.
-
Figure 4—source data 1
A .csv file containing Ca2+ response data (region of activity [ROA] density and frequency), locomotion data, and covariates used for statistical modeling for startle responses.
- https://cdn.elifesciences.org/articles/75055/elife-75055-fig4-data1-v2.zip
Figure 4—figure supplement 1
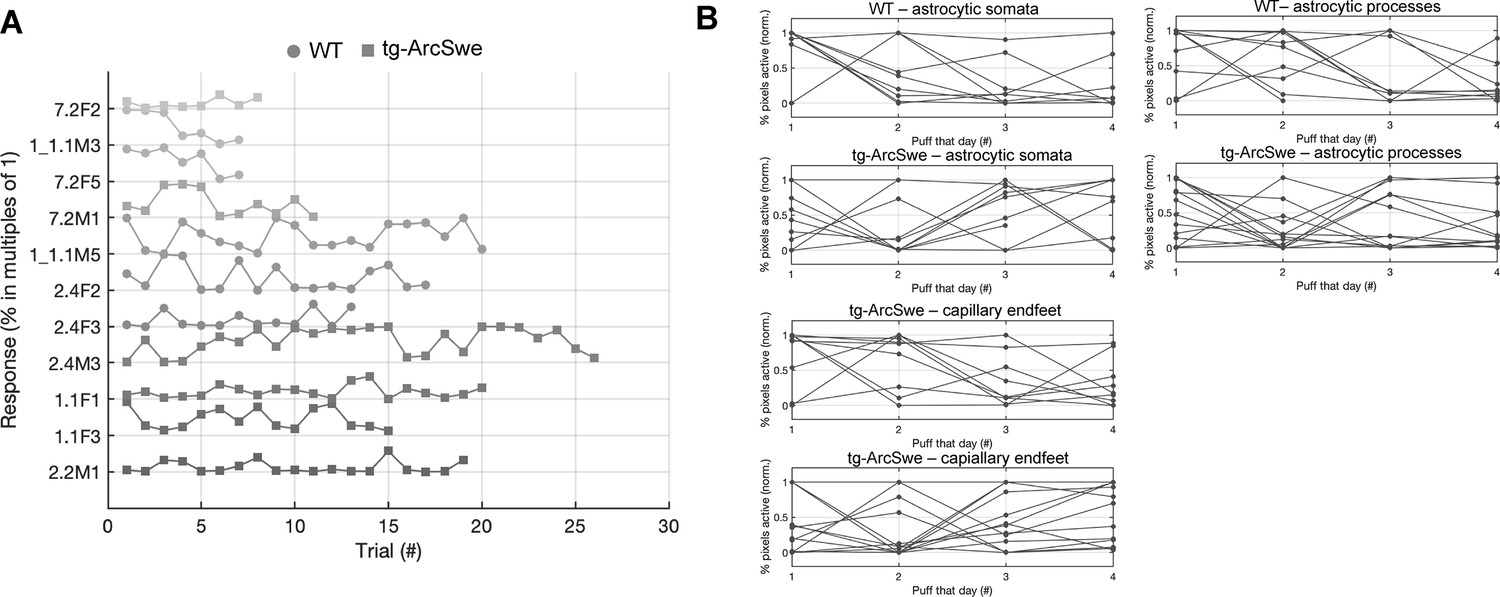
Behavioral response to air puff across trials.
(A) Neither tg-ArcSwe nor wildtype (WT) mice displayed any noticeable habituation to air puffs across all trials and experimental days.
(B) Within a single experimental day, there was no habituation to air puffs across the different trials.
Figure 4—figure supplement 2
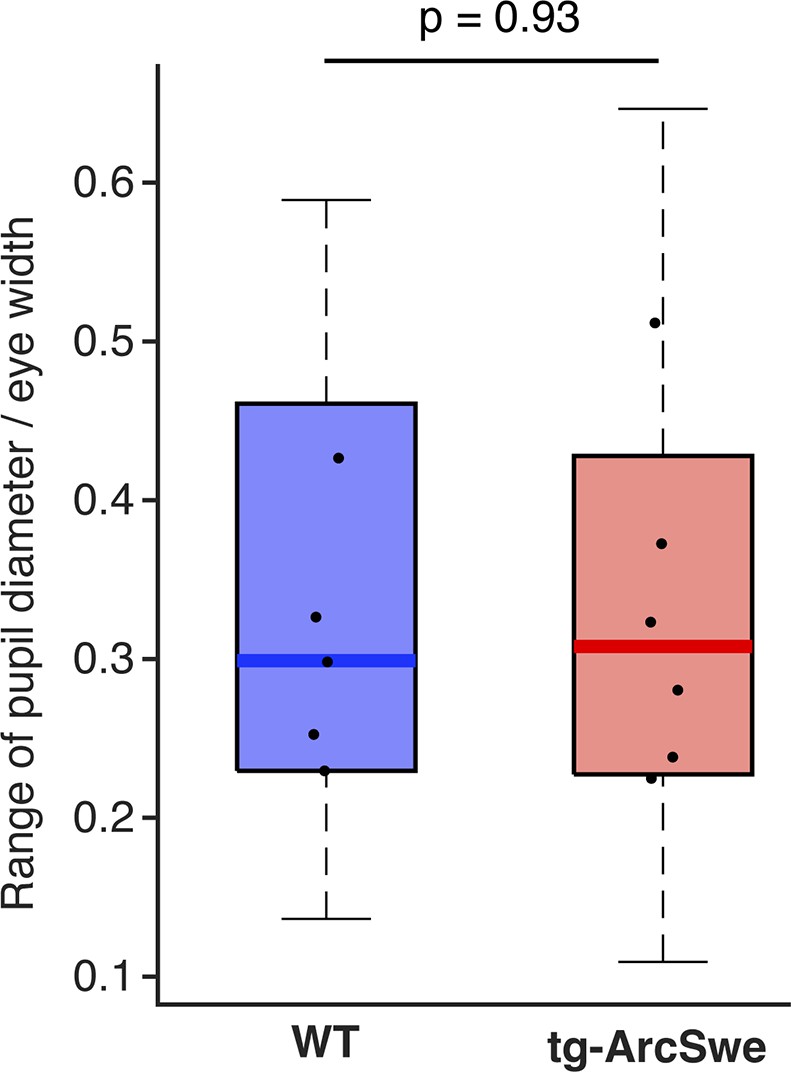
The dynamic range of pupil dilation and constrictions in the two genotypes.
Dots represent median values per mouse.
Figure 4—figure supplement 3
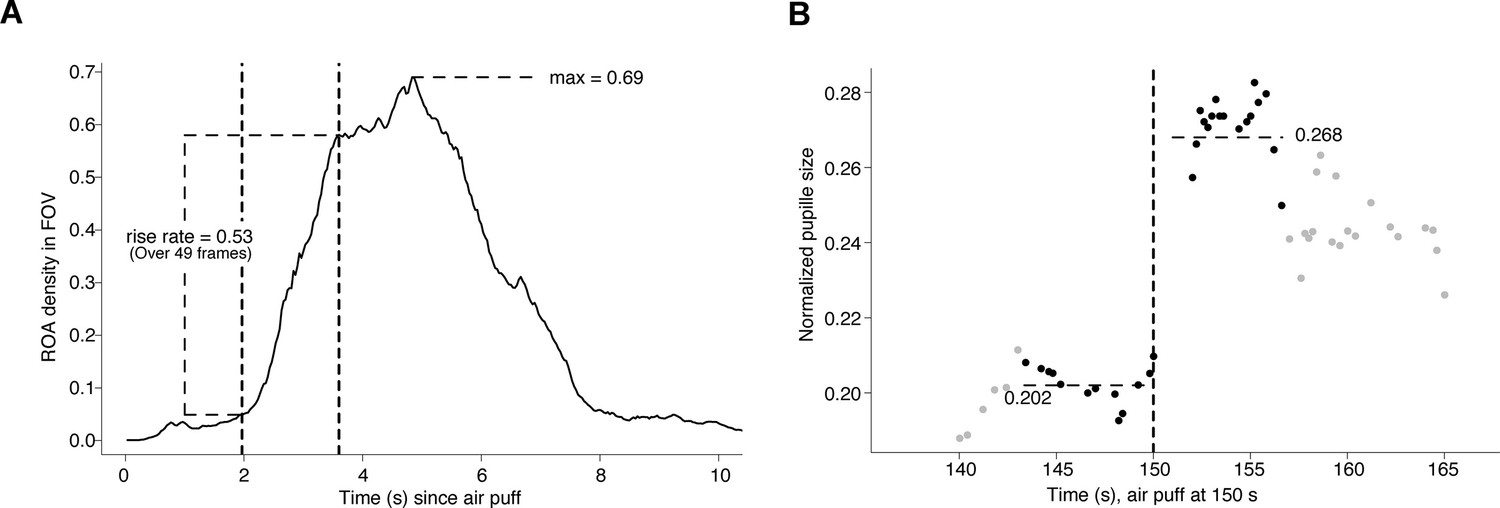
Method for assessing region of activity (ROA) density and pupil dynamics.
(A) Computation of the region of activity (ROA) density rise rate, and max ROA density, in particular startle period.
The vertical dashed lines indicate the time window that had the maximal increase in ROA density, which in this example took place over 49 frames. (B) Computation of the pupil dilation in a particular startle period, here we find (0.268–0.202)/0.202 = 0.33.
Figure 5
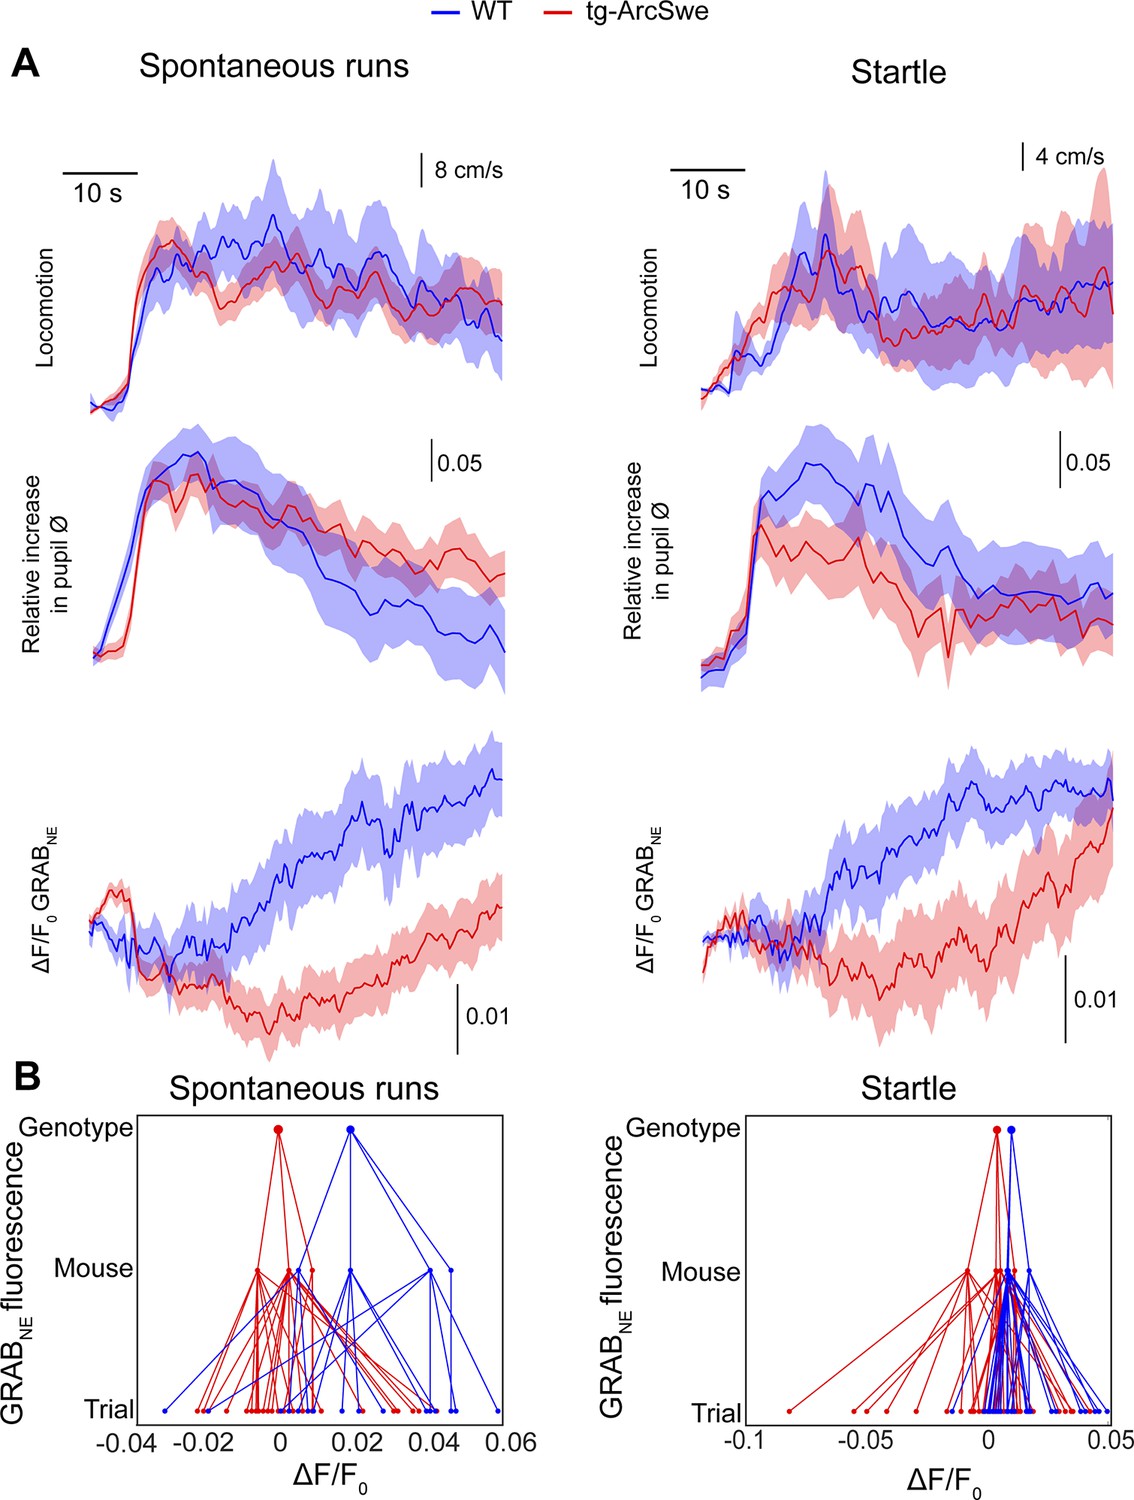
Attenuated norepinephrine responses in tg-ArcSwe mice.
Mice expressing the fluorescent extracellular norepinephrine sensor GRABNE were subjected to two-photon imaging trials similar to the astrocytic Ca2+ imaging experiments. (A) Mean traces ± standard error of locomotor responses, pupil responses and GRABNE fluorescence during spontaneous runs (left column) and during startle (right column). (B) Hierarchical plots showing median ΔF/F0 of GRABNE fluorescence per (from bottom to top) trial, mouse and genotype, in spontaneous runs and startle responses.
-
Figure 5—source data 1
A .mat file containing GRABNE fluorescence traces during spontaneous running and startle as well as locomotion data and covariates used for statistical modeling.
- https://cdn.elifesciences.org/articles/75055/elife-75055-fig5-data1-v2.zip
Tables
Table 1
Estimated statistical model for region of activity (ROA) density rise rate in the field of view (FOV) during spontaneous running.
μm per pixel has a small/no effect, but we include it for consistency. Deeper measurements tend to have lower ROA density rise rate. Given that the mice are running, a higher speed does not appear to be associated with a higher ROA density rise rate (n = 109, in 10 mice).
| Estimate | p-Value | |
|---|---|---|
| Intercept (TG) | 0.1969 | |
| Genotype (WT) | 0.1085 | 0.0318 |
| μm per pixel | –0.0055 | >0.10 |
| Depth | –0.0432 | 0.0002 |
| Maximum speed | 0.0000 | >0.10 |
Table 2
Estimated statistical model for region of activity (ROA) density rise rate in the field of view (FOV) and pupil dilation during spontaneous running.
When including pupil dynamics in the model (cf. Table 1 without pupil dynamics), the effect of genotype was no longer significant. However, the relationship between pupil dilation and ROA density rise rate was different in the two genotypes, with the wildtype (WT) mice having a significantly higher slope. μm per pixel and depth of the recording had no significant effect on the model, but we included them for consistency. The slope for the WT group is found by adding the slope in the TG group with the interaction term (e.g., –0.3537 + 1.1562 = 0.80) (n = 44, in 10 mice).
| Estimate | p-Value | |
|---|---|---|
| Intercept (TG) | 0.2297 | |
| Genotype (WT) | –0.1245 | >0.10 |
| Pupil dilation (TG) | –0.3537 | >0.10 |
| Pupil dilation × genotype (WT) | 1.1562 | 0.0070 |
| μm per pixel (binary) | 0.0306 | >0.10 |
| Depth | –0.0409 | 0.0996 |
| Maximum speed | –0.0011 | 0.0351 |
Table 3
Estimated statistical model for region of activity (ROA) density rise rate in the field of view (FOV) during startle.
Depth from the cortical surface and maximal speed during the startle response had a significant effect in the model, whereas the μm per pixel (level of magnification of the image recording) had no significant effect (n = 117 trials, in 11 mice).
| Estimate | p-Value | |
|---|---|---|
| Intercept (TG) | 0.2295 | |
| Genotype (WT) | 0.1110 | 0.0933 |
| μm per pixel (binary) | –0.0034 | >0.10 |
| Depth | –0.0696 | 0.0004 |
| Maximum speed | 0.0009 | 0.022 |
Table 4
Estimated statistical model for region of activity (ROA) density rise rate in the field of view (FOV) and pupil dilation during startle.
When including the pupil dilation in the statistical model, the two genotypes are clearly different. Moreover, depth from the cortical surface had a significant effect in the model, whereas optical zoom and maximum speed had a nonsignificant effect (n = 95 trials, in 11 mice). The slope for the wildtype (WT) group is found by adding the slope in the TG group with the interaction term (e.g., –0.0129 + 0.9235 = 0.91).
| Estimate | p-Value | |
|---|---|---|
| Intercept (TG) | 0.2199 | |
| Genotype (WT) | –0.0279 | >0.1 |
| Pupil dilation (TG) | –0.0129 | >0.1 |
| Pupil dilation × genotype (WT) | 0.9235 | 0.00043 |
| Optical zoom | 0.0036 | >0.1 |
| Depth | –0.0679 | 0.00063 |
| Maximum speed | 0.0006 | 0.0587 |
Table 5
Estimated statistical model for change in GRABNE fluorescence and pupil dilation during spontaneous runs.
The coupling between pupil responses and noradrenergic signaling is weaker in tg-ArcSwe mice compared to wildtype (WT) littermates (p=0.043, n = 100 running episodes, 43 trials, in 7 mice). The slope for the WT group is found by adding the slope in the TG group with the interaction term (e.g., 0.0030 + 0.043 = 0.046).
| Estimate | p-Value | |
|---|---|---|
| Intercept (TG) | 0.0030 | |
| Genotype (WT) | –0.0012 | >0.1 |
| Pupil dilation (TG) | 0.00022 | >0.1 |
| Pupil dilation × genotype (WT) | 0.043 | 0.042 |
| Increase in speed | –0.00000401 | >0.1 |
Table 6
Estimated statistical model for change in GRABNE fluorescence and pupil dilation during startle.
The coupling between pupil responses and noradrenergic signaling during startle responses is weaker in tg-ArcSwe mice compared to wildtype (WT) littermates (p=0.037, n = 59 trials, in 7 mice). The slope for the WT group is found by adding the slope in the TG group with the interaction term (e.g., 0.0078 + 0.037 = 0.045).
| Estimate | p-Value | |
|---|---|---|
| Intercept (TG) | 0.0078 | |
| Genotype (WT) | –0.0063 | >0.1 |
| Pupil dilation (TG) | –0.013 | >0.1 |
| Pupil dilation × genotype (WT) | 0.037 | 0.036 |
| Increase in speed | –0.0000029 | >0.1 |
Table 7
Primer used for mRNA quantification.
| Gene | Protein name | Accession | Forward (5′) | Reverse (3′) |
|---|---|---|---|---|
| Gfap | Glial fibrillary acidic protein | NM_010277.3 | GCACTCAATACGAGGCAGTG | GCTCTAGGGACTCGTTCGTG |
Additional files
Download links
A two-part list of links to download the article, or parts of the article, in various formats.
Downloads (link to download the article as PDF)
Open citations (links to open the citations from this article in various online reference manager services)
Cite this article (links to download the citations from this article in formats compatible with various reference manager tools)
Impaired astrocytic Ca2+ signaling in awake-behaving Alzheimer’s disease transgenic mice
eLife 11:e75055.
https://doi.org/10.7554/eLife.75055


