Differential regulation of cranial and cardiac neural crest by serum response factor and its cofactors
- Department of Cell, Development and Regenerative Biology, Icahn School of Medicine at Mount Sinai, United States
Figures
Figure 1 with 2 supplements
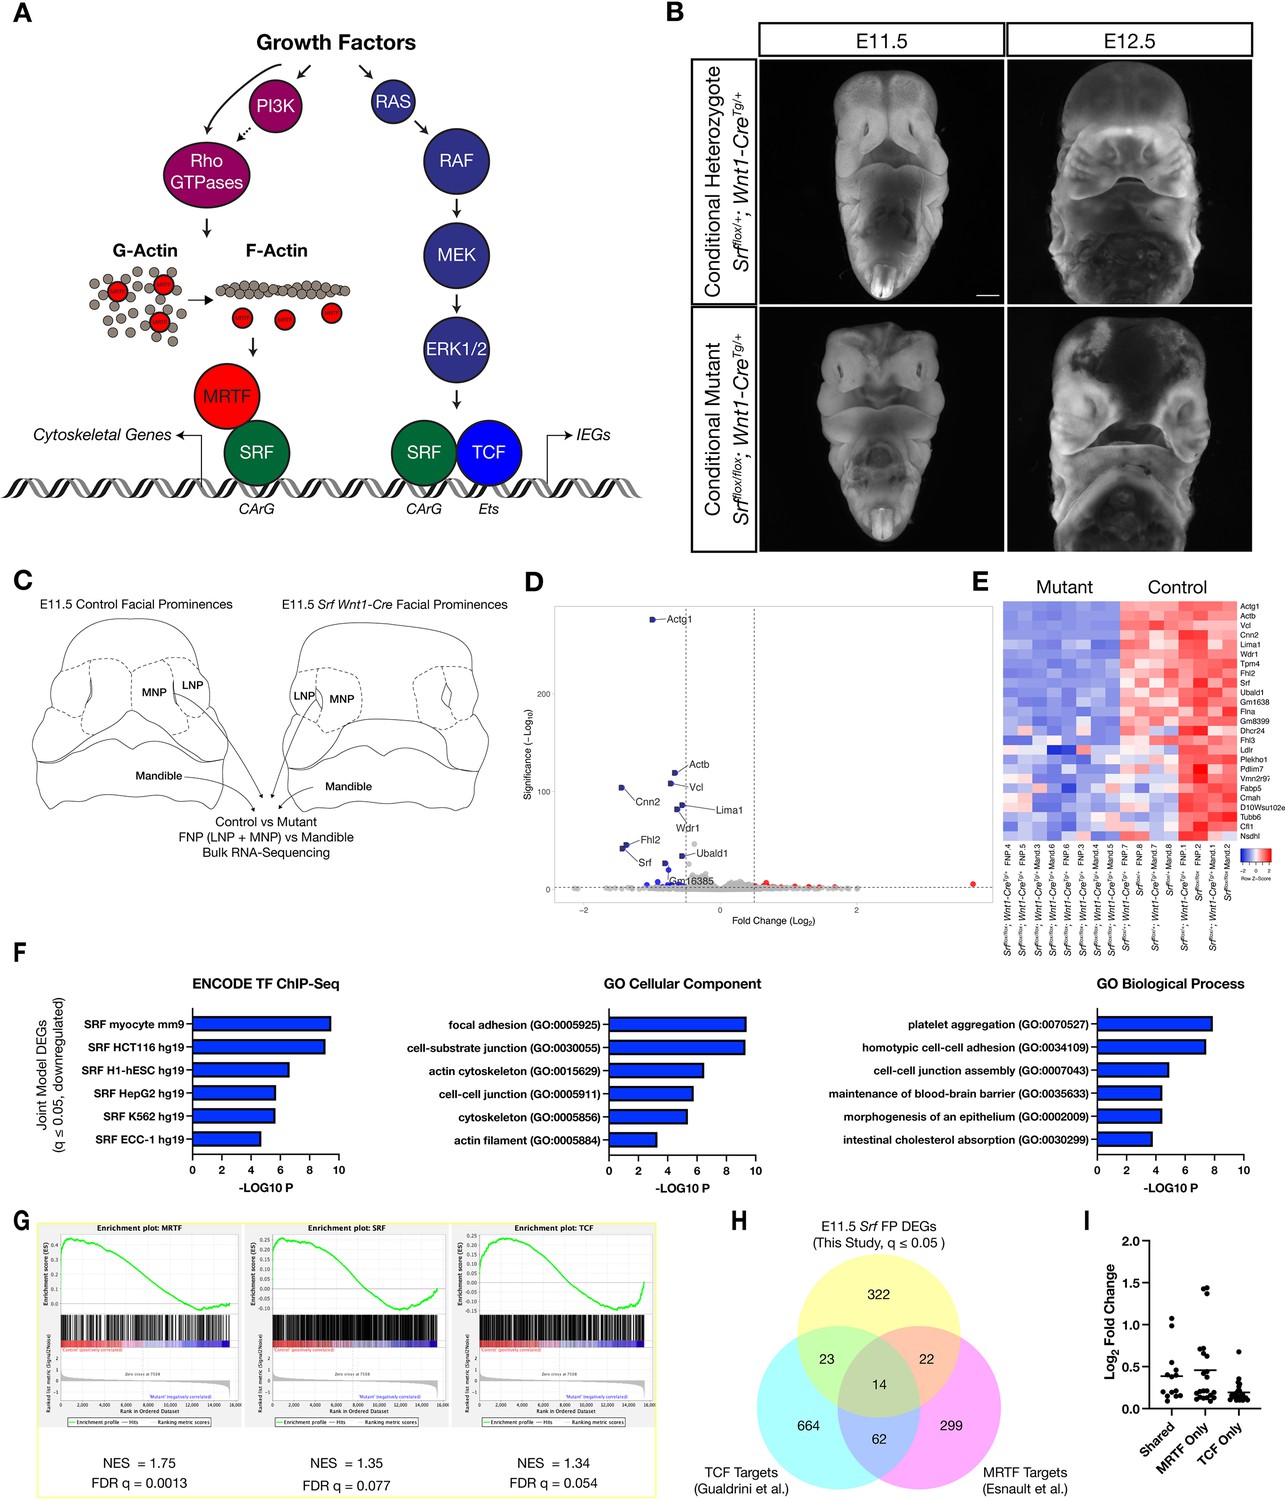
Loss of Srf in NC affects cytoskeletal gene expression.
(A) Diagram depicting SRF, its TCF and MRTF cofactors, and the upstream signals that regulate them. (B) DAPI stained embryos at E11.5 and E12.5 show a facial cleft following loss of Srf in NC. Scale bar represents 1 mm. (C) Diagram depicting RNA-sequencing strategy. (D) Volcano plot showing DEGs in Srf NC conditional mutants. Genes with a P-value < 0.01 and log2 fold change (FC) >0.25 are colored. Select genes are labeled. (E) A heatmap of the top 25 DEGs by q value. The samples cluster by genotype and are color-coded by Z-score. (F) Gene set enrichment analysis (GSEA) using a list of DEGs with q ≤ 0.05 and Log2FC ≤–0.25. Enrichment for ENCODE TF ChIP-Seq, GO Cellular Component, and GO Biological Process are shown. (G) GSEA for known SRF, MRTF, and TCF ChIP targets from previous datasets (Esnault et al., 2014; Gualdrini et al., 2016) across our entire dataset. (H) Overlap of known MRTF and TCF targets with DEGs q ≤ 0.05. (I) Absolute value of log2 FC for DEGs that overlap with each category. Horizontal bar indicates the mean (0.385 Shared, 0.378 MRTF, 0.219 TCF).
Figure 1—figure supplement 1
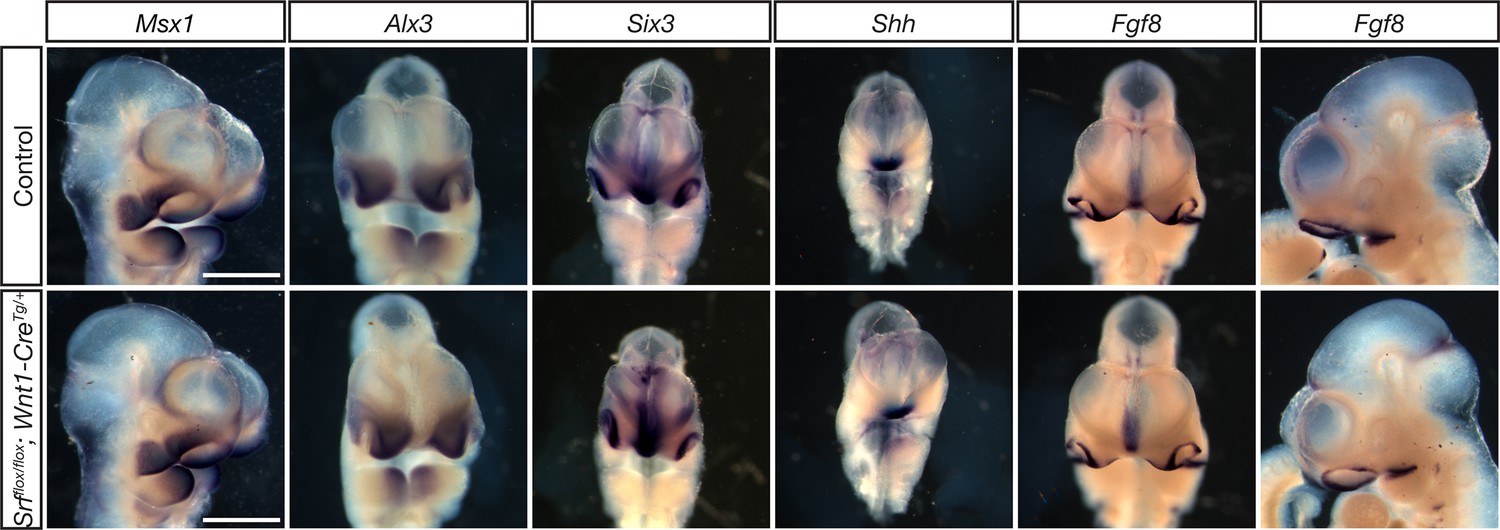
Srf NC conditional mutants do not show early patterning defects.
E10.5 embryos subject to in situ hybridization using probes against Msx1, Alx3, Six3, Shh, and Fgf8 showed no significant differences between Srf NC conditional mutants and control littermates. Msx1 embryos are shown in ¾ view to highlight maxillary expression. Fgf8 embryos are shown in frontal and profile views to highlight the ventral forebrain and mandibular expression domains, respectively. Scale bar represents 500 μm.
Figure 1—figure supplement 2

Additional data related to craniofacial RNA-Seq.
(A) Volcano plot showing genes enriched in mandible (red) versus FNP (blue) tissue. (B) Individual transcripts per million reads (TPM) values for Hand2 and Six3 plotted by genotype, showing the expected tissue enrichment. (C) PCA plots for the individual samples showing PCA1 vs PCA2 (left) and PCA1 vs PCA3 (right) indicate separation of the samples by tissue (PCA1) and genotype (PCA3). Samples are color-coded by genotype. (D) TPM values of Srf and several affected genes plotted by genotype. While Srf levels vary somewhat among the non-clefted control genotypes, downstream targets are only affected in the conditional mutants. (E) Expression of Srf and its cofactors in craniofacial tissue from this study (top) and in a separate study using sorted NC cells (Minoux et al., 2017) as well as whole E13.5 palate (Axel Visel, 2015) and passage 2 MEPMs for comparison (Vasudevan et al., 2015). (F) Overlap of DEGs from mandible (pink), FNP (cyan), and a joint model using both tissues (yellow). (G) Enrichr GSEA for upregulated genes with q ≤ 0.05 and Log2FC ≥ 0.25 from the joint model shows little enrichment and such genes may therefore be indirect targets of SRF. (H) Enrichr GSEA using a list of genes with q ≤ 0.05 and Log2FC ≤ –0.25 from each tissue showing similar terms to the joint model, with the exception of cholesterol-related GO terms specific to the FNP dataset. (I) GSEA for mandible and FNP samples compared to known SRF, MRTF, and TCF targets (Esnault et al., 2014; Gualdrini et al., 2016) showing preferential enrichment for MRTF targets in both datasets. Columns are the mean and error bars represent the standard deviation in (B) and (D).
Figure 2 with 2 supplements
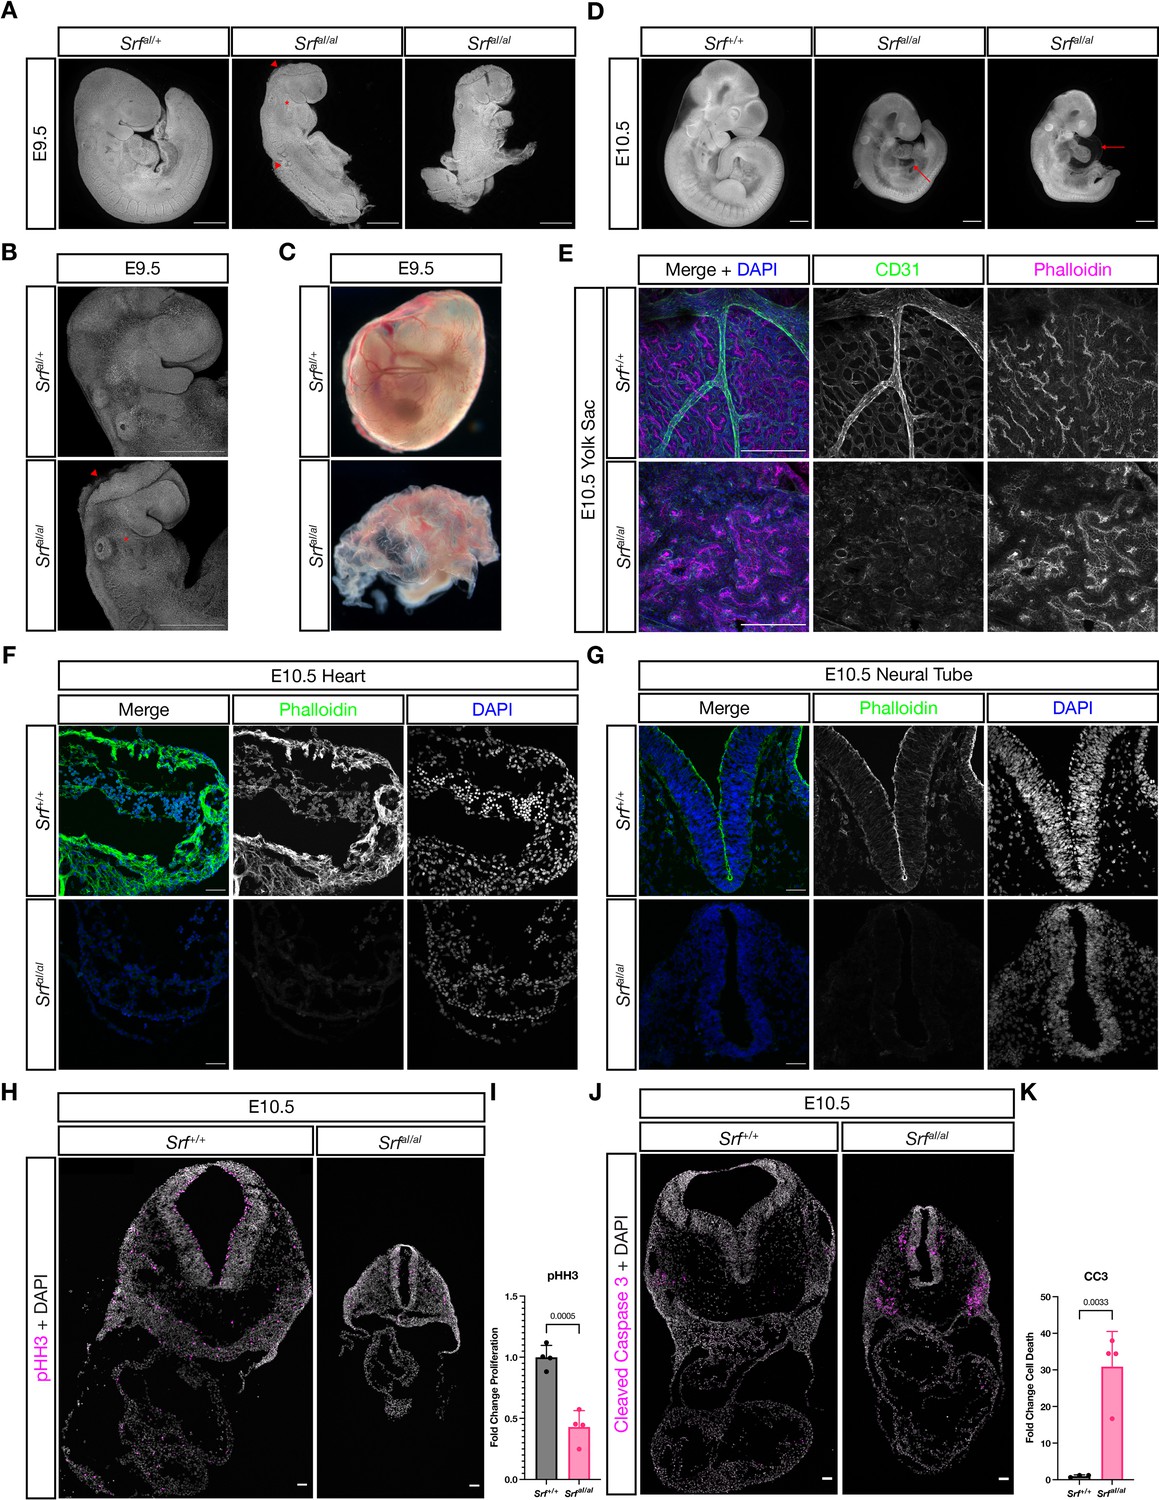
SrfaI/aI embryos succumb at E10.5 with numerous defects.
(A) DAPI stained E9.5 embryos of the indicated genotypes show that compared to SrfaI/+ embryos, SrfaI/aI embryos are growth retarded, incompletely turned, have short and disorganized tails, a wavy neural tube (red arrowhead, trunk), delayed anterior neural tube closure (red arrowhead, head), and a hypoplastic or missing second pharyngeal arch (red asterisk). Scale bar represents 500 μm. (B) Higher magnification confocal images of the first two embryos in (A). Scale bar represents 500 μm. (C) Brightfield images of E9.5 yolk sacs indicate defective vasculogenesis in mutant embryos. (D) DAPI-stained E10.5 embryos show more extensive growth retardation, a distended heart tube, and pericardial edema (red arrow). Scale bar represents 500 μm. (E) Immunofluorescent staining of E10.5 yolk sacs shows that mutant yolk sacs lack a remodeled vascular plexus or any large vessels. Images are representative of n = 4 embryos of each genotype. Scale bar represents 250 μm. (F) Transverse sections through E10.5 embryos at the level of the heart show reduced F-actin intensity via phalloidin staining. Images are representative of n = 4 embryos of each genotype. Scale bar represents 50 μm. (G) A similar pattern Is seen in the neural tube. Scale bar represents 50 μm. (H) Cell proliferation, indicated through phospho-Histone H3 (Ser10) (pHH3) staining, is reduced in mutant embryos. Scale bar represents 50 μm. (I) Quantitation of (H), n = 4 each genotype. p = 0.0005, Student’s unpaired two-tailed t-test. (J) Cell death, revealed through cleaved caspase three staining, is dramatically increased in mutant embryos. Scale bar represents 50 μm. (K) Quantitation of (J), n = 3 control embryos and n = 4 mutant embryos. p = 0.0033, Student’s unpaired two-tailed t-test. Columns are the mean and error bars represent the standard deviation in (I) and (K).
Figure 2—figure supplement 1
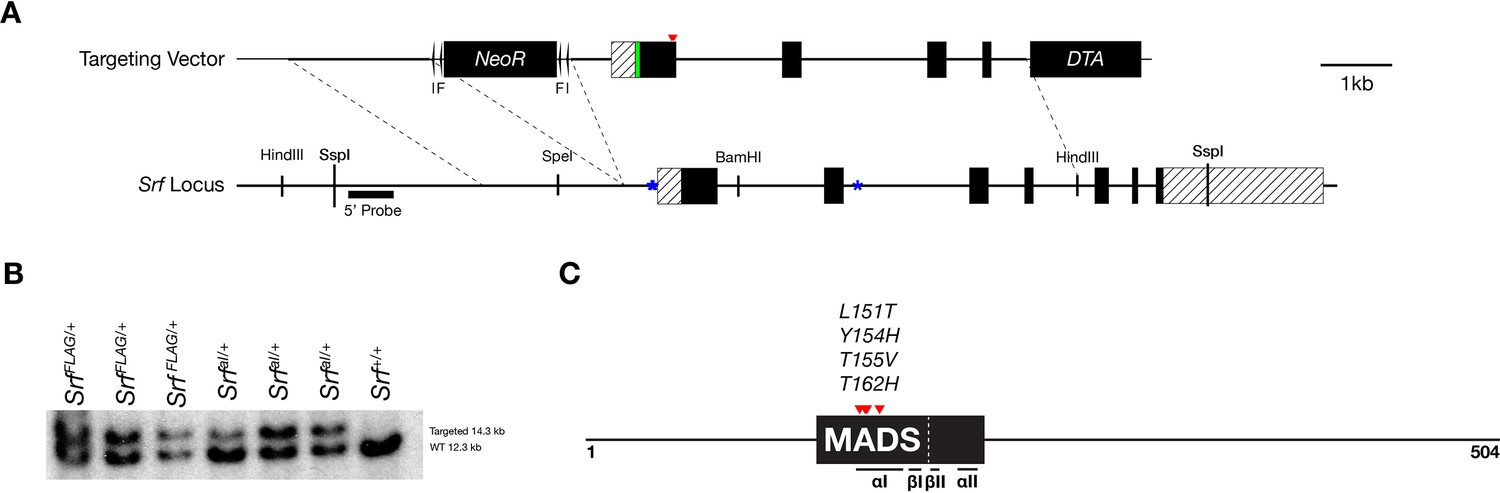
Targeting strategy and validation for SrfFlagand SrfaIalleles.
(A) A diagram of the targeting vector and the Srf locus. Homology arms containing an N-terminal 3 x FLAG tag with or without mutated SRF αI residues were cloned into a targeting vector containing a Pgk-NeoR cassette flanked by loxP (l) and FRT (F) sequences. Dotted lines demarcate the homology arms relative to the endogenous locus. Exons are dark and UTR regions are striped. The FLAG tag is green and the location of the SRF αI residues is marked by red arrowheads. Autoregulatory CarG elements at –62 bp, –82 bp, and +2800 bp are marked by blue asterisks. (B) Southern blot of SspI digested targeted clones and WT genomic DNA blotted with the P32 labeled DNA probe indicated in (A). (C) Diagram of mouse SRF protein showing the DNA-binding domain as a dark box, the core MADS domain within it is labeled, subdomains are indicated underneath, and the SRF αI mutations are red arrowheads. Domains are based on Zaromytidou et al., 2006 with amino acid numbers adjusted for mouse. The 3 x FLAG tag (not shown) was inserted just downstream of the start codon.
-
Figure 2—figure supplement 1—source data 1
Full gel image of the original scan of the Southern blot used in Figure 2—figure supplement 1B.
- https://cdn.elifesciences.org/articles/75106/elife-75106-fig2-figsupp1-data1-v2.zip
-
Figure 2—figure supplement 1—source data 2
Full gel image of the Southern blot used in Figure 2—figure supplement 1B after contrast adjustment.
- https://cdn.elifesciences.org/articles/75106/elife-75106-fig2-figsupp1-data2-v2.zip
Figure 2—figure supplement 2

SRF αI helix residues are highly conserved, but drift in clades lacking clear MRTF homologues.
Representative species from major clades were subjected to BLASTP searches for mouse SRF, MRTF-B, and ELK1. The presence of a reciprocal best BLASTP hit is denoted in green. If a hit was negative, the search was repeated for the entire clade and identification of a hit is represented in cyan. Negative hits for ELK1 were researched with mouse ETS1 to find any ETS domain proteins. SRF αI residues were manually inspected and divergence is denoted by the height of the green bar in 25% increments, representing the four residues. Red arrows indicate clades where the SRF αI residues diverge that are also missing readily identifiable MRTF homologs, although some of these lineages also lack TCF/ELK homologs. Blue arrows indicate clades where SRF αI residues are conserved along with presence of an MRTF homolog, but that lack an obvious TCF/ELK homolog. The cross indicates that there is a BLASTP hit for T. adhaerens (NCBI XP_002109236.1) that has MRTF-like N-terminal actin-binding RPEL motifs, but it is not a reciprocal best hit. This protein aligns closer to PHACTR1 when searched against mouse. PHACTR1, like the MRTFs, contains actin-binding RPEL domains and it remains unclear whether the protein in T. adhaerens is a functional MRTF or PHACTR ortholog. The asterisk indicates that although a reciprocal best BLASTP hit for MRTF-B was found in S. rosetta, the hit was a short protein fragment and it is unclear if it represents a true MRTF homolog. The genus Caenorhabditis lacks an obvious MRTF homolog, but likely MRTF homologs can be found in other nematodes such as B. malayi, L. loa, and O. flexuosa.
Figure 3
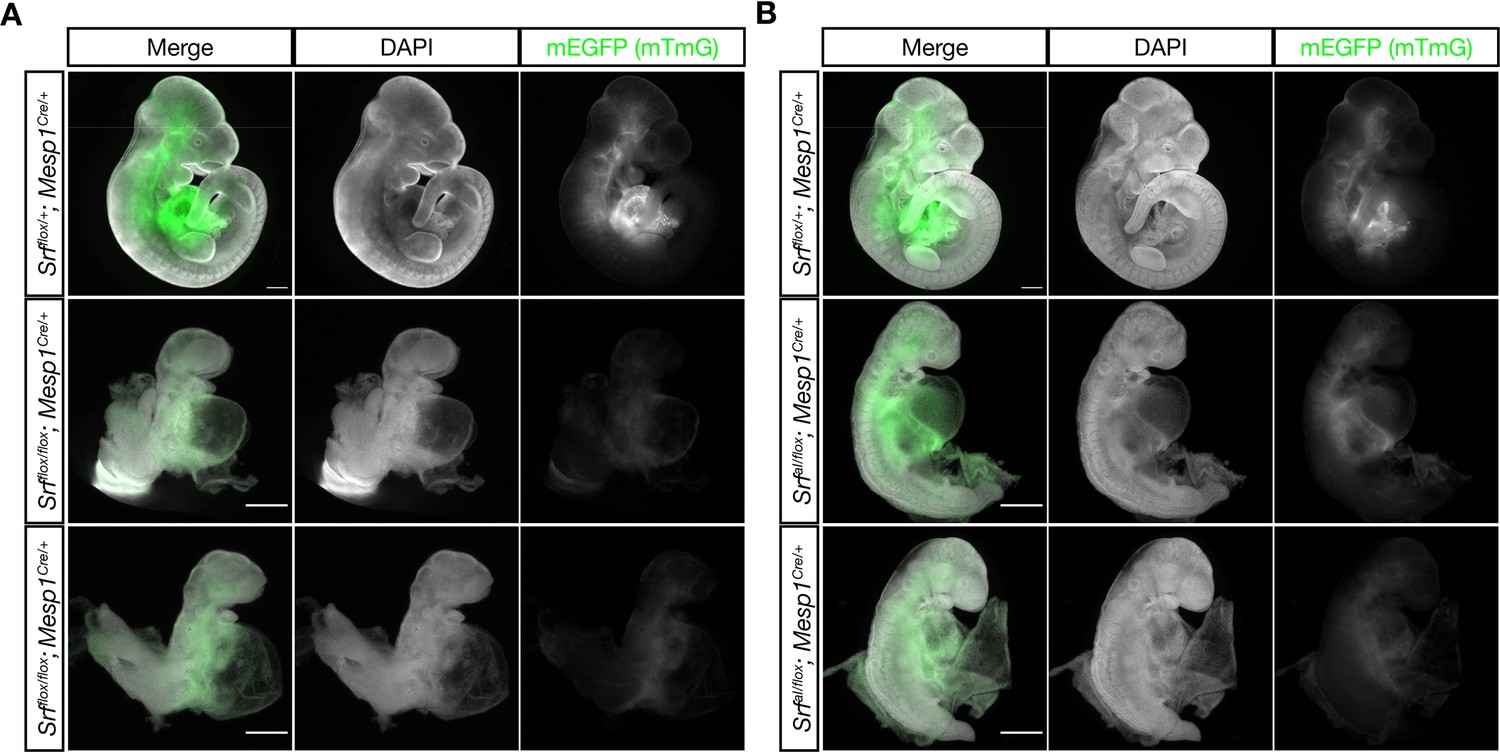
The SrfaIand Srfflox alleles exhibits similar defects in anterior mesoderm.
(A) E10.5 littermate embryos were stained with DAPI and imaged. Loss of Srf in the Mesp1-Cre lineage causes embryos to be undersized with pericardial edema, hypoplastic hearts, and turning defects. Phenotype observed in n = 3/3 mutant embryos. (B) A similar experiment in which SrfaI is the only Srf allele expressed in the Mesp1-Cre lineage. These embryos appear comparable to the mutant embryos in (A), although they are clearly less severely affected as they are slightly larger and partially turned. Phenotype observed in n = 3/3 mutant embryos. Scale bar represents 500 μm in all images. Note the 2 x higher crop in mutant embryos to better illustrate phenotypes.
Figure 4 with 1 supplement
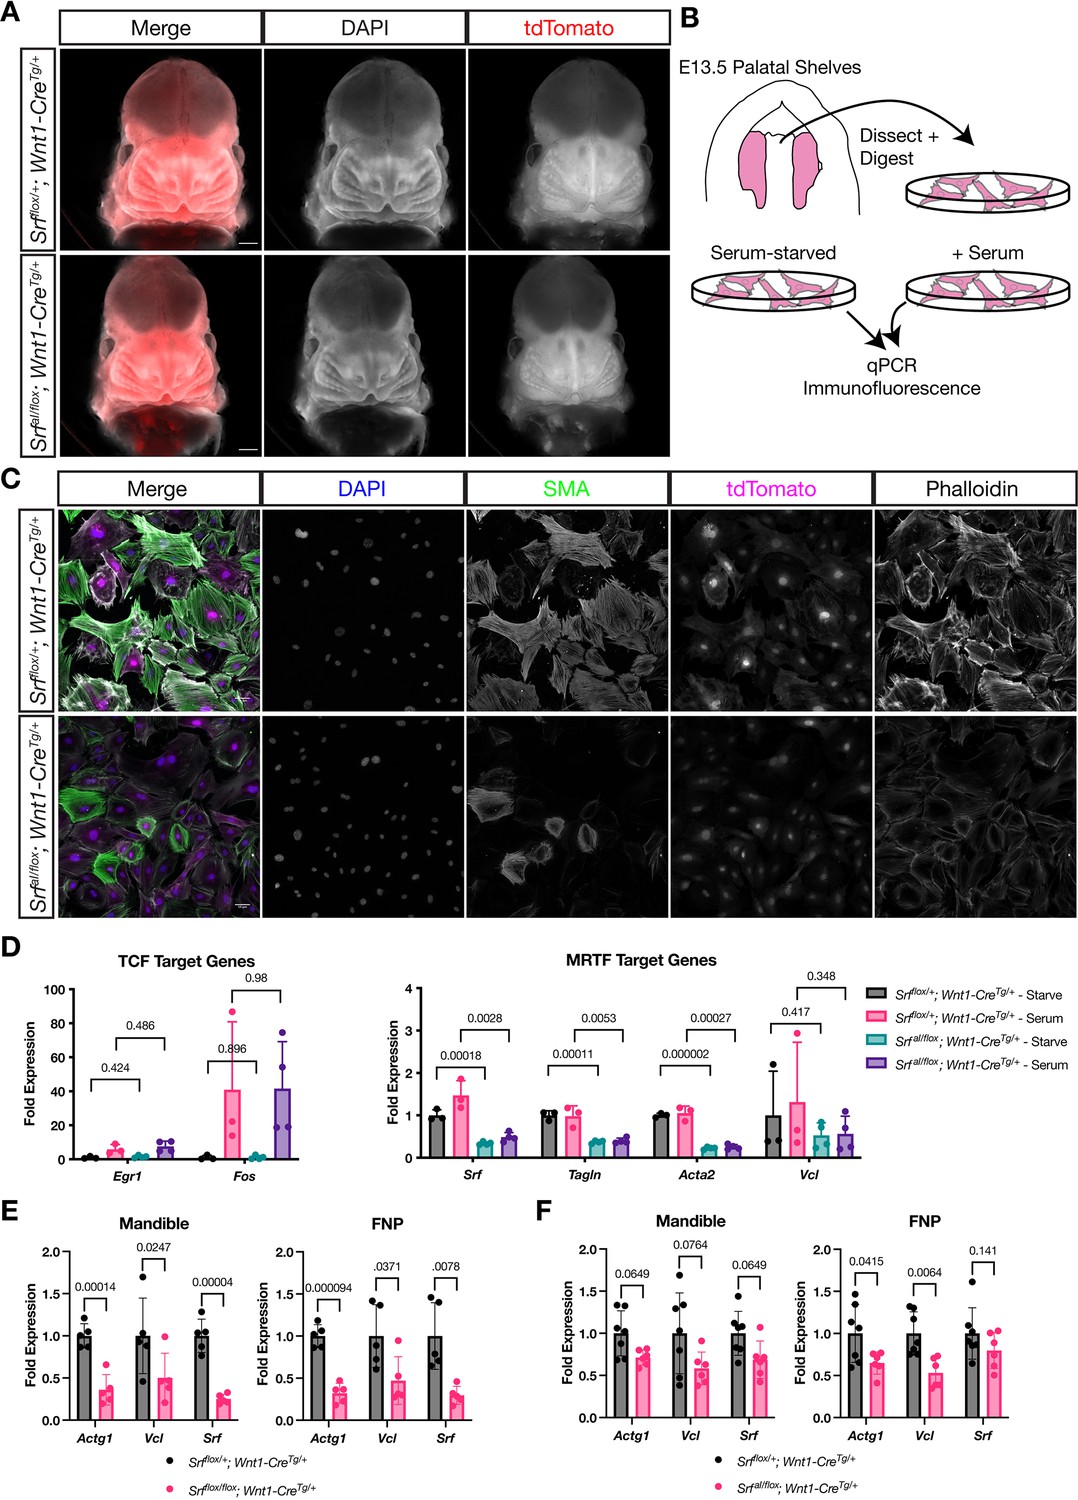
NC SrfaIconditional mutants are normal at E13.5.
(A) DAPI stained E13.5 littermate embryos carrying a ROSA26TdT/+ Cre reporter show no apparent craniofacial defects in conditional mutants. Scale bar represents 500 μm. (B) Diagram illustrating the culture of MEPM cells. (C) Immunofluorescent staining of passage 2 MEPM cells shows reduced F-actin and SMA fluorescence in mutant cells compared to cells from heterozygous littermate control embryos. Scale bar represents 50 μm. (D) RT-qPCR from serum-starved and serum-stimulated MEPM cells indicates no difference in IEG expression (Egr1, Fos) but a significant defect in Srf, Tagln,, and Acta2 expression and a downward trend in Vcl expression. Values are fold expression of control starved cells. N = 3 control lines and n = 4 mutant lines. (F) RT-qPCR from E11.5 FNPs and mandibles shows a significant reduction in Actg1, Vcl, and Srf expression in Srf NC conditional knockouts compared to control conditional heterozygous littermates. N = 5 each genotype. (G) Assaying the same genes and tissues as (F) using SrfaI NC conditional mutants shows a downward trend or significant reduction approximately half as large as (F). N = 7 controls and n = 6 mutants. For (E–G) significance was determined by Student’s unpaired t-test with two-stage step-up correction (Benjamini, Krieger, and Yekutieli) for multiple comparisons. q-values are indicated on the graphs. Columns are the mean and error bars represent the standard deviation.
Figure 4—figure supplement 1
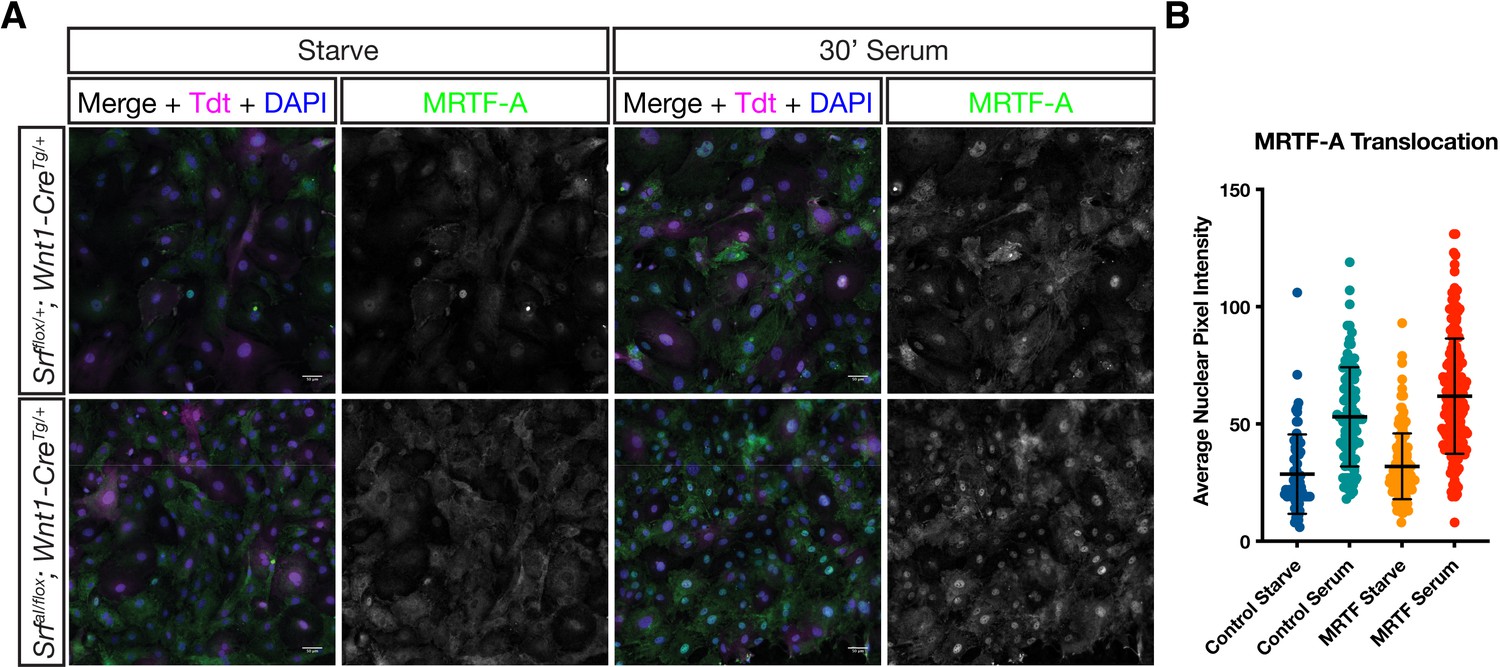
MRTF-A translocates to the nucleus normally in response to serum stimulation in mutant MEPM cells.
(A) Serum starved or stimulated P2 primary MEPM cells from SrfaI/flox; Wnt1-CreTg/+; ROSA26TdT/+ (mutant) and Srfflox/+; Wnt1-CreTg/+; ROSA26TdT/+ (control) embryos were stained for MRTF-A and DAPI. (B) Nuclear MRTF-A levels were quantified using the DAPI channel to identify nuclei. Dots represent individual cells pooled from n = 2 unique cell lines for each genotype. Horizontal bars are the mean and error bars represent the standard deviation.
Figure 5 with 2 supplements
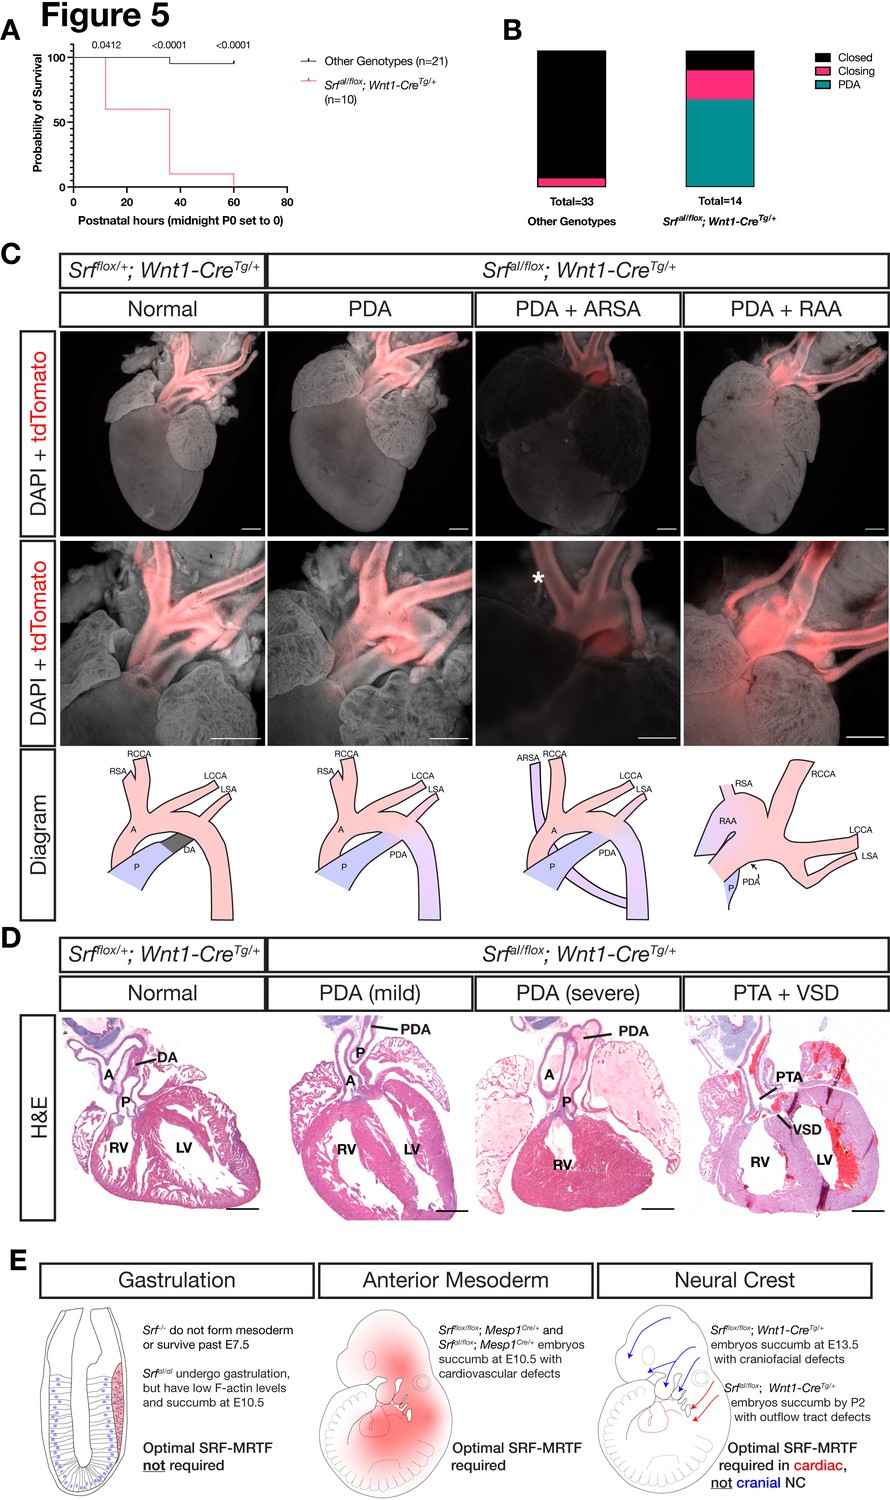
NC SrfaI conditional mutants succumb postnatally with outflow tract defects.
(A) Kaplan-Meyer survival curve for neonatal SrfaI/flox; Wnt1-CreTg/+ (Mutant) compared to littermates of all other genotypes (Control). Significance was computed at each timepoint using a Mantel-Cox log-rank test. P0 p = 0.0142, P1 p < 0.0001, P2 p < 0.0001. (B) Stacked columns showing the distribution of PDA-related phenotypes in SrfaI/flox; Wnt1-CreTg/+ neonates compared to littermates of all other genotypes. (C) DAPI-stained postnatal day 0 (P0) hearts carrying a ROSA26TdT/+ Cre lineage reporter showing the entire heart (top row) and the outflow tract region (bottom row). Examples of mutant phenotypes such as PDA, ARSA, and RAA. An asterisk indicates where the missing right subclavian artery should be. Note the ARSA mouse had succumbed prior to dissection and the image is dimmer due to the presence of clotted blood. The outflow tract defects are schematized below. Scale bar represents 500 μm. (D) Hematoxylin and eosin-stained frontal sections through P0 hearts showing mild to severe PDA and an example of VSD and PTA in mutants. Scale bar represents 500 μm. (E) Summary of our results, showing the requirements for SRF versus SRFaI in different tissues and timepoints. A, aorta; ARSA, aberrant right subclavian artery; DA, ductus arteriosus; LCA, left common carotid artery; LSA, left subclavian artery; LV, left ventricle; P, pulmonary artery; PDA, patent ductus arteriosus; PTA, persistent truncus arteriosus; RAA, right aortic arch with mirror image branching; RCA, right common carotid artery; RSA, right subclavian artery.
Figure 5—figure supplement 1
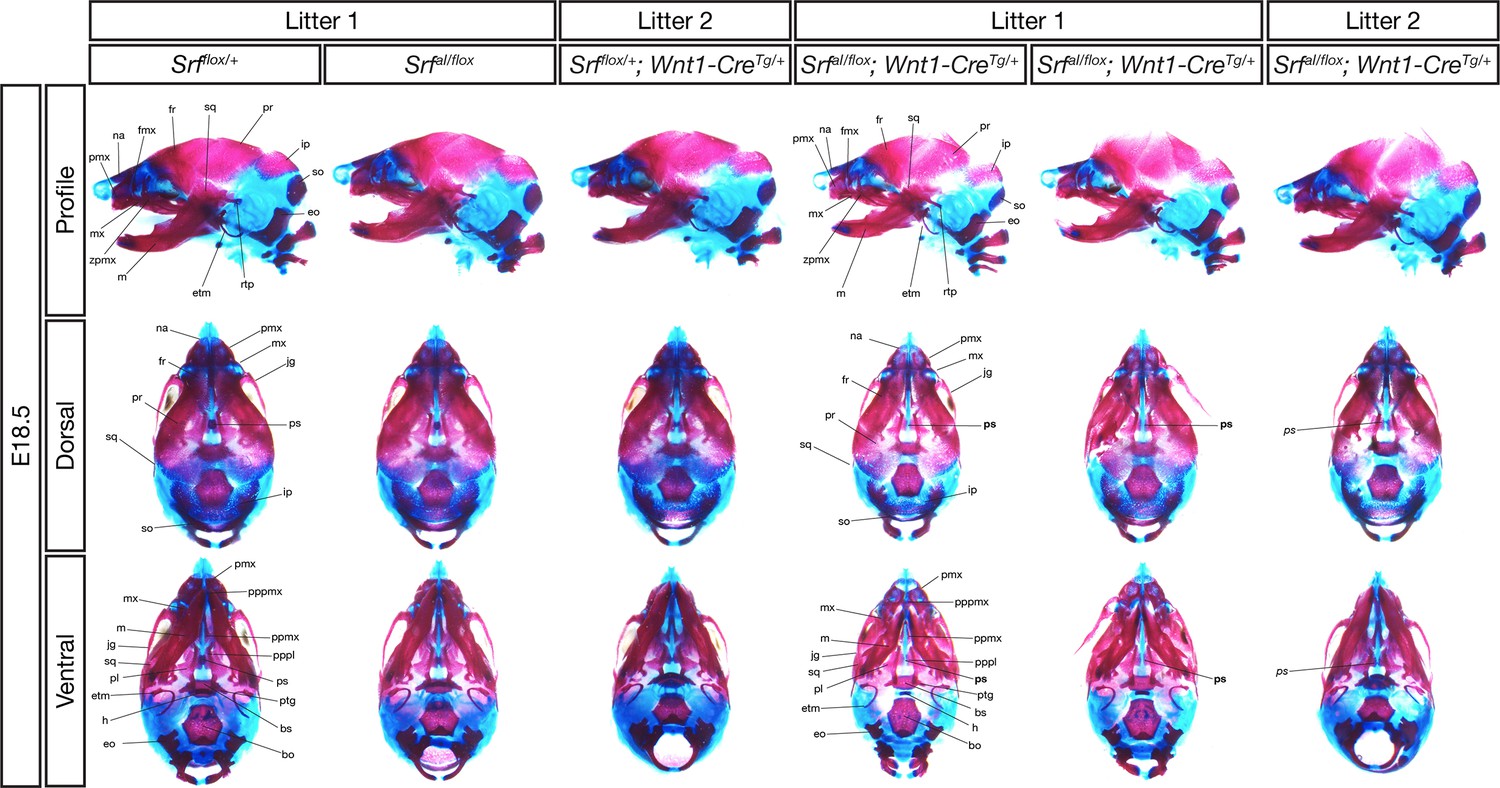
E18.5 conditional mutant skulls are delayed but correctly patterned.
Alizarin red (bone) and alcian blue (cartilage) stained E18.5 skulls of the indicated genotypes from two litters are shown. All three conditional mutant embryos were smaller than their control littermates and had less extensive ossification. However, all the indicated bones were present in each genotype, except for the presphenoid bone, which was missing in 2/3 mutants (location of missing bone indicated in bold) and rudimentary in one (italics). Bo, basioccipital; bs, basisphenoid; eo, exoccipital; etm, ectotympanic; fmx, frontal process of maxilla; fr, frontal; h, hyoid; ip, interparietal; jg, jugal; m, mandible; mx, maxilla; na, nasal; pl, palatine; pmx, premaxilla; ppmx, palatal process of maxilla; pppl, palatal process of palatine; pppmx, palatal process of premaxilla; pr, parietal; ps, presphenoid; ptg, pterygoid; rtp, retrotympanic process; so, supraoccipital; sq, squamosal; zpmx, zygomatic process of maxilla.
Figure 5—figure supplement 2
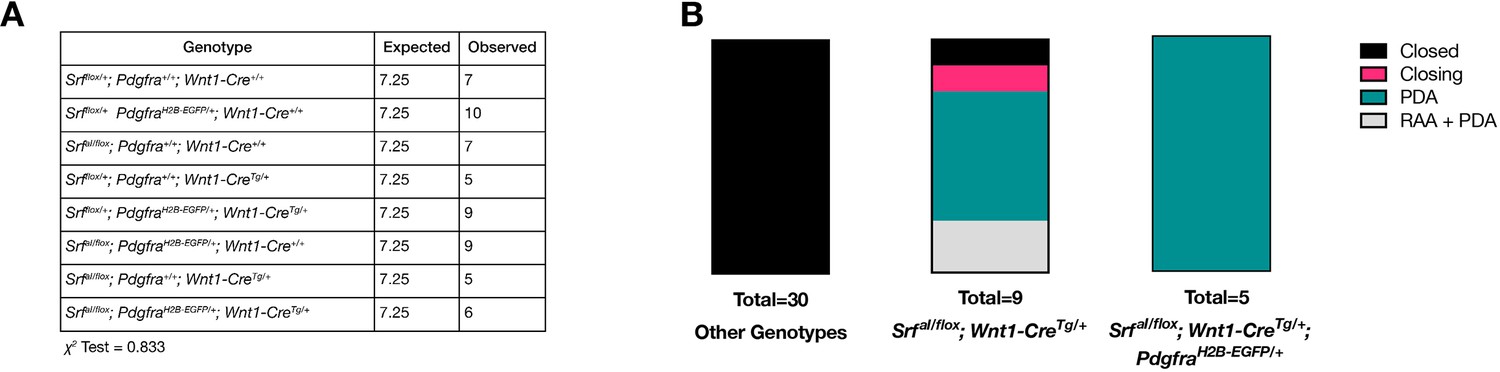
Pdgfra and SrfaI do not interact genetically in NC.
(A) Expected and recovered numbers of embryos of each genotype at birth (P0). No significant deviation from Mendelian ratios was observed. (B) PDA-related phenotypes in SrfaI/flox; Wnt1-CreTg/+ neonates are not exacerbated by the loss of one copy of Pdgfra.
Tables
Table 1
SrfaI/aI embryos are not recovered at weaning.
Expected and recovered numbers of embryos of each genotype at weaning (P21). No homozygous mutant embryos were recovered.
| Genotype | Expected | Observed |
|---|---|---|
| Srf+/+ | 7.75 | 12 |
| SrfαI/+ | 15.5 | 19 |
| SrfaI/aI | 7.75 | 0 |
-
X2 Test = 0.0044.
Key resources table
| Reagent type (species) or resource | Designation | Source or reference | Identifiers | Additional information |
|---|---|---|---|---|
| Gene (Mus musculus) | Srf | MGI, Ensembl, UniProt | Srf, ENSMUSG 00000015605, Q9JM73 | |
| Strain, strain background (Mus musculus) | 129S4/SvJaeJ | IMSR, Jackson Labs | 009104 | All the subsequent genetic reagents were made on or backcrossed to this strain |
| Genetic reagent (Mus musculus) | SrfFLAG | This paper | To be submitted to Jackson Labs | 3x-FLAG tag knocked in to SRF’s N-terminus |
| Genetic reagent (Mus musculus) | SrfaI | This paper | To be submitted to Jackson Labs | Alpha-I helix mutations knocked into SRF and identical 3x- FLAG to above |
| Genetic reagent (Mus musculus) | Wnt1-Cre | IMSR, Jackson Labs | H2az2Tg(wnt1-cre)11RthRRID:IMSR_JAX:003829 | |
| Genetic reagent (Mus musculus) | Mesp1Cre | IMSR, Jackson Labs | Mesp1tm2(cre)YsaRRID:IMSR_HAR:3358 | |
| Genetic reagent (Mus musculus) | Srfflox | IMSR, Jackson Labs | Srftm1RmnRRID:IMSR_JAX:006658 | |
| Genetic reagent (Mus musculus) | MORE-Cre | IMSR, Jackson Labs | Meox2tm1(cre)SorRRID:IMSR_JAX:003755 | |
| Genetic reagent (Mus musculus) | R26RTdT | IMSR, Jackson Labs | Gt(ROSA) 26Sortm14(CAG-tdTomato)HzeRRID:IMSR_JAX:007914 | |
| Genetic reagent (Mus musculus) | R26RmTmG | IMSR, Jackson Labs | Gt(ROSA) 26Sortm4(ACTB-tdTomato,-EGFP)LuoRRID:IMSR_JAX:007676 | |
| Cell line (Mus musculus) | MEPM | This paper | Primary cell line derived in lab. Used and extinguished by passage 2. | |
| Other | DMEM High Glucose | Invitrogen | 11965118 | |
| Other | Penicillin-Streptomycin (10,000 U/mL) | Gibco | 15140122 | 100 x stock used at 0.5 x |
| Other | L-Glutamine (200 mM) | Gibco | 2 5030081 | 100 x stock used at 1 x |
| Other | Characterized Fetal Bovine Serum, CA Origin | HyClone | SH30396.03 | Lot AC10235406 |
| Antibody | Rat anti-CD31 (rat monoclonal) | BD Biosciences | BD Biosciences Cat# 553370, RRID:AB_394816 | IF(1:50) |
| Antibody | anti-Cleaved Caspase 3 (rabbit monoclonal) | Cell Signaling | Cell Signaling Technology Cat# 9665, RRID:AB_2069872 | IF(1:400) |
| Antibody | anti phospho-Histone H3 (Ser10) (rabbit polyclonal) | Millipore | Millipore Cat# 06–570, RRID:AB_310177 | IF(1:500) |
| Antibody | anti-MKL1 (rabbit polyclonal) | Proteintech | Proteintech Cat# 21166–1-AP, RRID:AB_2878822 | IF(1:100) |
| Antibody | anti-SMA (rabbit monoclonal) | Cell Signaling | Cell Signaling Technology Cat# 19245, RRID:AB_2734735 | IF(1:200) |
| Antibody | Goat anti-Mouse IgG (H + L) Highly Cross-Adsorbed Secondary Antibody, Alexa Fluor Plus 488 | Thermo Fisher | Thermo Fisher Scientific Cat# A32723, RRID:AB_2633275 | IF(1:500) |
| Antibody | Goat anti-Rabbit IgG (H + L) Highly Cross-Adsorbed Secondary Antibody, Alexa Fluor Plus 555 | Thermo Fisher | Thermo Fisher Scientific Cat# A32732, RRID:AB_2633281 | IF(1:500) |
| Other | Phalloidin-Alexa Fluor 647 | Invitrogen | Cat A22287 | IF(1:400) |
| Recombinant DNA reagent | Alx3 (plasmid, in situ probe) | This paper | doi.10.5061/dryad.mgqnk9916 | |
| Recombinant DNA reagent | Fgf8 (plasmid, in situ probe) | Crossley and Martin, 1995 | pBS-SK-Fgf8 | doi.10.5061/dryad.mgqnk9916 |
| Recombinant DNA reagent | Msx1 (plasmid, in situ probe) | Hong and Krauss, 2012 | doi.10.5061/dryad.mgqnk9916 | |
| Recombinant DNA reagent | Shh (plasmid, in situ probe) | This paper | doi.10.5061/dryad.mgqnk9916 | |
| Recombinant DNA reagent | Six3 (plasmid, in situ probe) | This paper | doi.10.5061/dryad.mgqnk9916 | |
| Sequence- based reagent | Srf_flox_F | Holtz and Misra, 2008 | genotyping primers | TGCTTACTGG AAAGCTCATGG |
| Sequence-based reagent | Srf_flox_R | Holtz and Misra, 2008 | genotyping primers | TGCTGGTTTG GCATCAACT |
| Sequence-based reagent | Srf_null_R | This paper | genotyping primers | CTAACCCTGC CTGTCCTTCAUse with Srf_flox_F |
| Sequence- based reagent | Srf_flag_F | This paper | genotyping primers | GATGAACGA TGTGACCTCGC |
| Sequence- based reagent | Srf_flag_R | This paper | genotyping primers | AGGGAGGA GCCAACTCCTTA |
| Sequence- based reagent | aR4 | Hamilton et al., 2003 | genotyping primers | CCCTTGTGG TCATGCCAAACFor PdgfraEGFP |
| Sequence- based reagent | aR5 | Hamilton et al., 2003 | genotyping primers | GCTTTTGCC TCCATTA CACTGGFor PdgfraEGFP |
| Sequence- based reagent | lox | Hamilton et al., 2003 | genotyping primers | ACGAAGTTAT TAGGTCC CTCGACFor PdgfraEGFP |
| Sequence- based reagent | Cre_800 | This paper | genotyping primers | GCTGCCACGAC CAAGTGACA GCAATG |
| Sequence- based reagent | Cre_1200 | This paper | genotyping primers | GTAGTTATTC GGATCATCAG CTACAC |
| Sequence- based reagent | morefor | Tallquist and Soriano, 2000 | genotyping primers | GGGACCACC TTCTTTTGGCTTC |
| Sequence- based reagent | morerev | Tallquist and Soriano, 2000 | genotyping primers | AAGATGTGGAG AGTTCGGGGTAG |
| Sequence- based reagent | morecre | Tallquist and Soriano, 2000 | genotyping primers | CCAGATCCTC CTCAGAA ATCAGC |
| Sequence- based reagent | R26mTmG_F | Muzumdar et al., 2007 | genotyping primers | CTCTGCTGC CTCCTGGCTTCT |
| Sequence- based reagent | R26mTmG_wt_R | Muzumdar et al., 2007 | genotyping primers | CGAGGCGG ATCACAA GCAATA |
| Sequence- based reagent | R26mTmG_mut_R | Muzumdar et al., 2007 | genotyping primers | TCAATGGGCG GGGGTCGTT |
| Sequence- based reagent | R26Tdt_wt_F | Madisen et al., 2010 | genotyping primers | AAGGGAGCT GCAGTGGAGTA |
| Sequence- based reagent | R26Tdt_wt_R | Madisen et al., 2010 | genotyping primers | CCGAAAATC TGTGGGAAGTC |
| Sequence- based reagent | R26Tdt_mut_F | Madisen et al., 2010 | genotyping primers | GGCATTAAAGC AGCGTATCC |
| Sequence- based reagent | R26Tdt_mut_R | Madisen et al., 2010 | genotyping primers | CTGTTCCTGT ACGGCATGG |
| Sequence- based reagent | Acta2_qPCR_F | This paper | qPCR primers | GGCACCACT GAACCCTAAGG |
| Sequence- based reagent | Acta2_qPCR_R | This paper | qPCR primers | ACAATACCAG TTGTAC GTCCAGA |
| Sequence- based reagent | Actg1_qPCR_F | This paper | qPCR primers | ATTGTCAATG ACGAGTGCGG |
| Sequence- based reagent | Actg1_qPCR_R | This paper | qPCR primers | CTTACACTGC GCTTCTTGCC |
| Sequence- based reagent | Egr1_qPCR_F | This paper | qPCR primers | TGGGATAACTC GTCTCCACC |
| Sequence- based reagent | Egr1_qPCR_R | This paper | qPCR primers | GAGCGAACAA CCCTATGAGC |
| Sequence- based reagent | Fos_qPCR_F | This paper | qPCR primers | TCCTACTACCAT TCCCCAGC |
| Sequence- based reagent | Fos_qPCR_R | This paper | qPCR primers | TGGCACTAGAG ACGGACAGA |
| Sequence- based reagent | Hprt_qPCR_F | This paper | qPCR primers | TCCTCCTCAG ACCGCTTTT |
| Sequence- based reagent | Hprt_qPCR_R | This paper | qPCR primers | CATAACCTGG TTCATCATCGC |
| Sequence- based reagent | Srf_qPCR_F | This paper | qPCR primers | GTGCCACTGG CTTTGAAGA |
| Sequence- based reagent | Srf_qPCR_R | This paper | qPCR primers | GCAGGTTGGT GACTGTGAAT |
| Sequence- based reagent | Tagln_qPCR_F | This paper | qPCR primers | GACTGCACTTC TCGGCTCAT |
| Sequence- based reagent | Tagln_qPCR_R | This paper | qPCR primers | CCGAAGCTAC TCTCCTTCCA |
| Sequence- based reagent | Vcl_qPCR_F | This paper | qPCR primers | TCTGATCCT CAGTGG TCTGAAC |
| Sequence- based reagent | Vcl_qPCR_R | This paper | qPCR primers | AAAGCCATTC CTGACCTCAC |
| Other | BM-Purple | Roche | Cat. #11442074001 | |
| Commercial assay or kit | Luna Universal qPCR Master Mix | New England Biolabs | Cat. #M3003L | |
| Commercial assay or kit | NEBuilder HiFi DNA Assembly Master Mix | New England Biolabs | Cat. #E2621S | |
| Commercial assay or kit | RNeasy Plus Mini Kit | Qiagen | Cat. #74,134 | |
| Chemical compound, drug | Gibco Geneticin (G-418) | Thermo FIsher | Cat. #11811031 | |
| Software, algorithm | Salmon | Salmon | Salmon, RRID:SCR_017036 | |
| Software, algorithm | Wasabi | Wasabi | https://github.com/COMBINE-lab/wasabi; Patro, 2019 | |
| Software, algorithm | Sleuth | Sleuth | sleuth, RRID:SCR_016883 | |
| Software, algorithm | GraphPad Prism | GraphPad Prism | GraphPad Prism, RRID:SCR_002798 | |
| Other | DAPI stain | Sigma | Cat. #D9542-10mg | (1–5 µg/mL) |
Additional files
-
Supplementary file 1
RNA-Seq gene lists.
A Microsoft Excel file containing gene expression analysis for the mandible, FNP, and joint mandible+ FNP datasets, FNP vs mandible dataset, gene lists used to generate Figure 1G–H, raw counts and TPM values for each sample, the variables used for each sample to classify it for analysis in Sleuth (genotype, tissue, and litter) and the Enrichr results used for Figure 1F and Figure 1—figure supplement 2G-H.
- https://cdn.elifesciences.org/articles/75106/elife-75106-supp1-v2.xlsx
-
Supplementary file 2
Knockout Phenotypes.
Summary of the mouse knockout phenotypes for Srf and its cofactors, as well as a selection of relevant conditional knockouts discussed in the Introduction and Discussion sections.
- https://cdn.elifesciences.org/articles/75106/elife-75106-supp2-v2.docx
-
Supplementary file 3
Genotyping Primers.
A list of genotyping primers and product sizes. All reactions were run for 35 cycles with an annealing temperature of 60 ° C.
- https://cdn.elifesciences.org/articles/75106/elife-75106-supp3-v2.docx
-
Supplementary file 4
qPCR Primers.
Forward and reverse primer sequences used for qPCR experiments in Figure 4. All primers are listed 5’ to 3’.
- https://cdn.elifesciences.org/articles/75106/elife-75106-supp4-v2.docx
-
Transparent reporting form
- https://cdn.elifesciences.org/articles/75106/elife-75106-transrepform1-v2.docx
Download links
A two-part list of links to download the article, or parts of the article, in various formats.
Downloads (link to download the article as PDF)
Open citations (links to open the citations from this article in various online reference manager services)
Cite this article (links to download the citations from this article in formats compatible with various reference manager tools)
Differential regulation of cranial and cardiac neural crest by serum response factor and its cofactors
eLife 11:e75106.
https://doi.org/10.7554/eLife.75106


