Differential ion dehydration energetics explains selectivity in the non-canonical lysosomal K+ channel TMEM175
- Structural Biology Program, Memorial Sloan Kettering Cancer Center, United States
- Theoretical Molecular Biophysics Section, National Heart, Lung and Blood Institute, National Institutes of Health, United States
- Department of Chemistry, Chungbuk National University, Republic of Korea
Figures
Figure 1 with 2 supplements
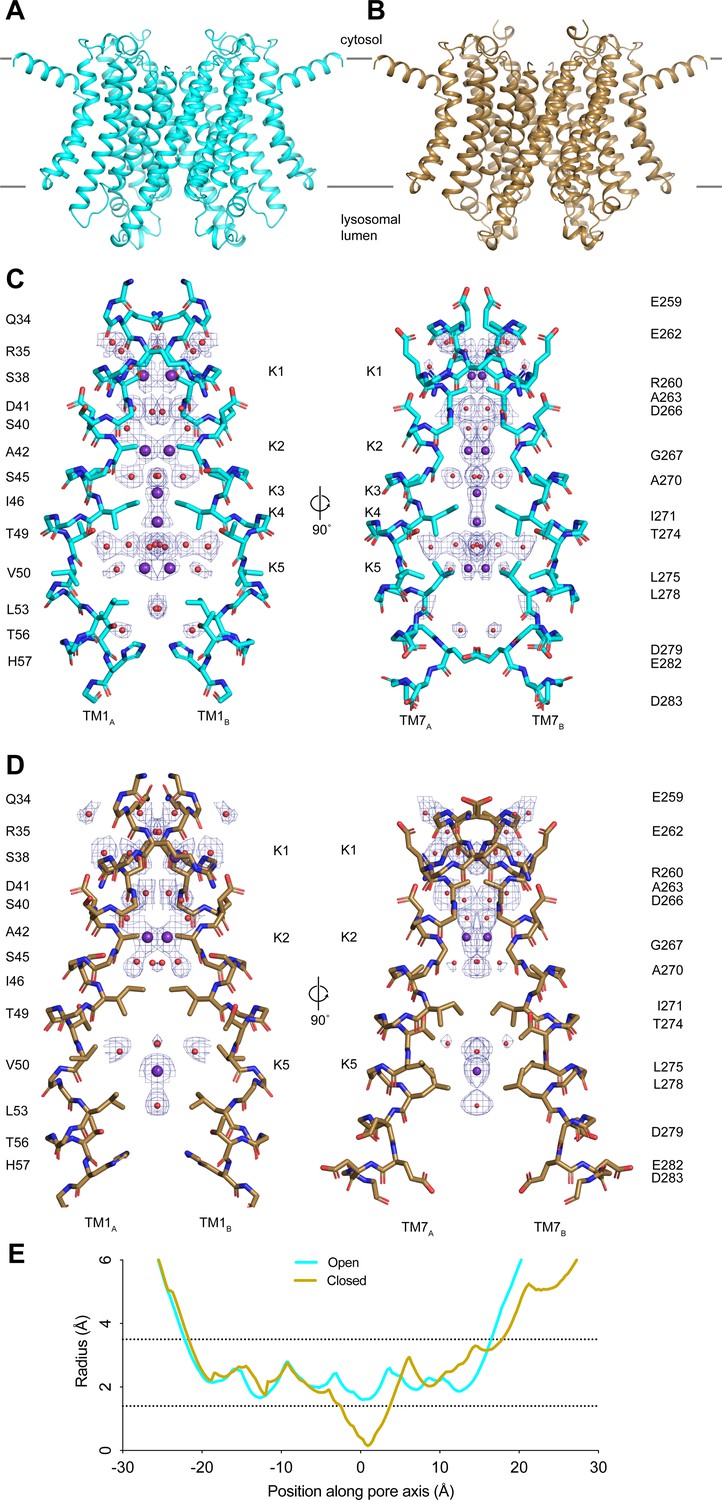
Structures of transmembrane protein 175 (TMEM175) in open and closed states.
(A–B) Structures of the human TMEM175 in open (A) and closed (B) states. The channel is orientated with the cytosolic side facing up and the luminal side down. Gray bars represent approximate width of the membrane. (C–D) Ion conduction pathways in open (C) and closed (D) states. Pore-lining residues are shown as sticks. Bound K+ ions and water molecules are shown as purple and red spheres, respectively. Density peaks corresponding to K+ and water molecules are shown as blue mesh and contoured at 12σ. Front and rear domains are removed for clarity. (E) Plot of pore radius as a function of position along the pore axis. The 0 position corresponds to the isoleucine constriction, positive values correspond to the luminal side of the pore, and negative values correspond to the cytosolic side of the pore.
Figure 1—figure supplement 1
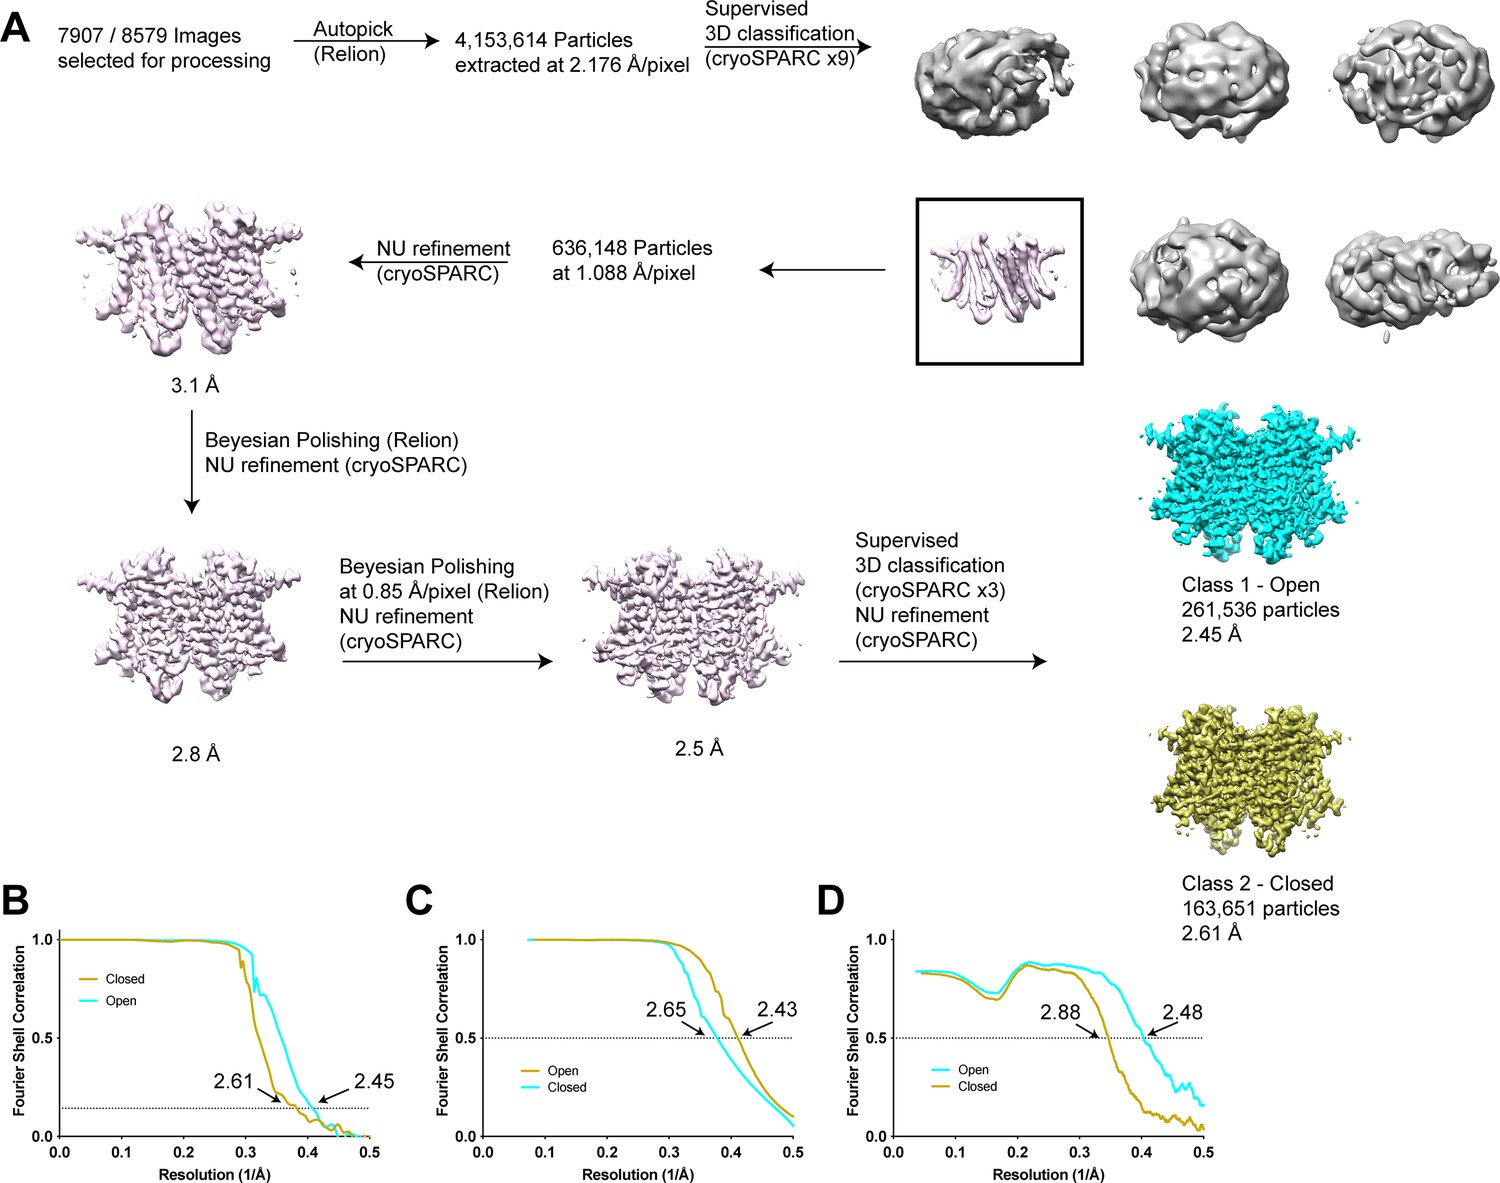
Structure determination of human transmembrane protein 175 (TMEM175) in open and closed states.
(A) Simplified image processing workflow for classification and reconstruction of open (cyan) and closed (yellow) states from images of human TMEM175 vitrified in 150 mM KCl. (B) Plot of Fourier shell correlations between two independent half-maps calculated from particles classified as open (cyan) and closed (yellow). (C) Plot of Fourier shell correlations between two density-modified half-maps calculated from particles classified as open (cyan) and closed (yellow). (D) Plot of Fourier shell correlations between the refined open state model and density modified map of the open state (cyan) and between the refined closed state model and density modified map of the closed state (yellow).
Figure 1—figure supplement 2
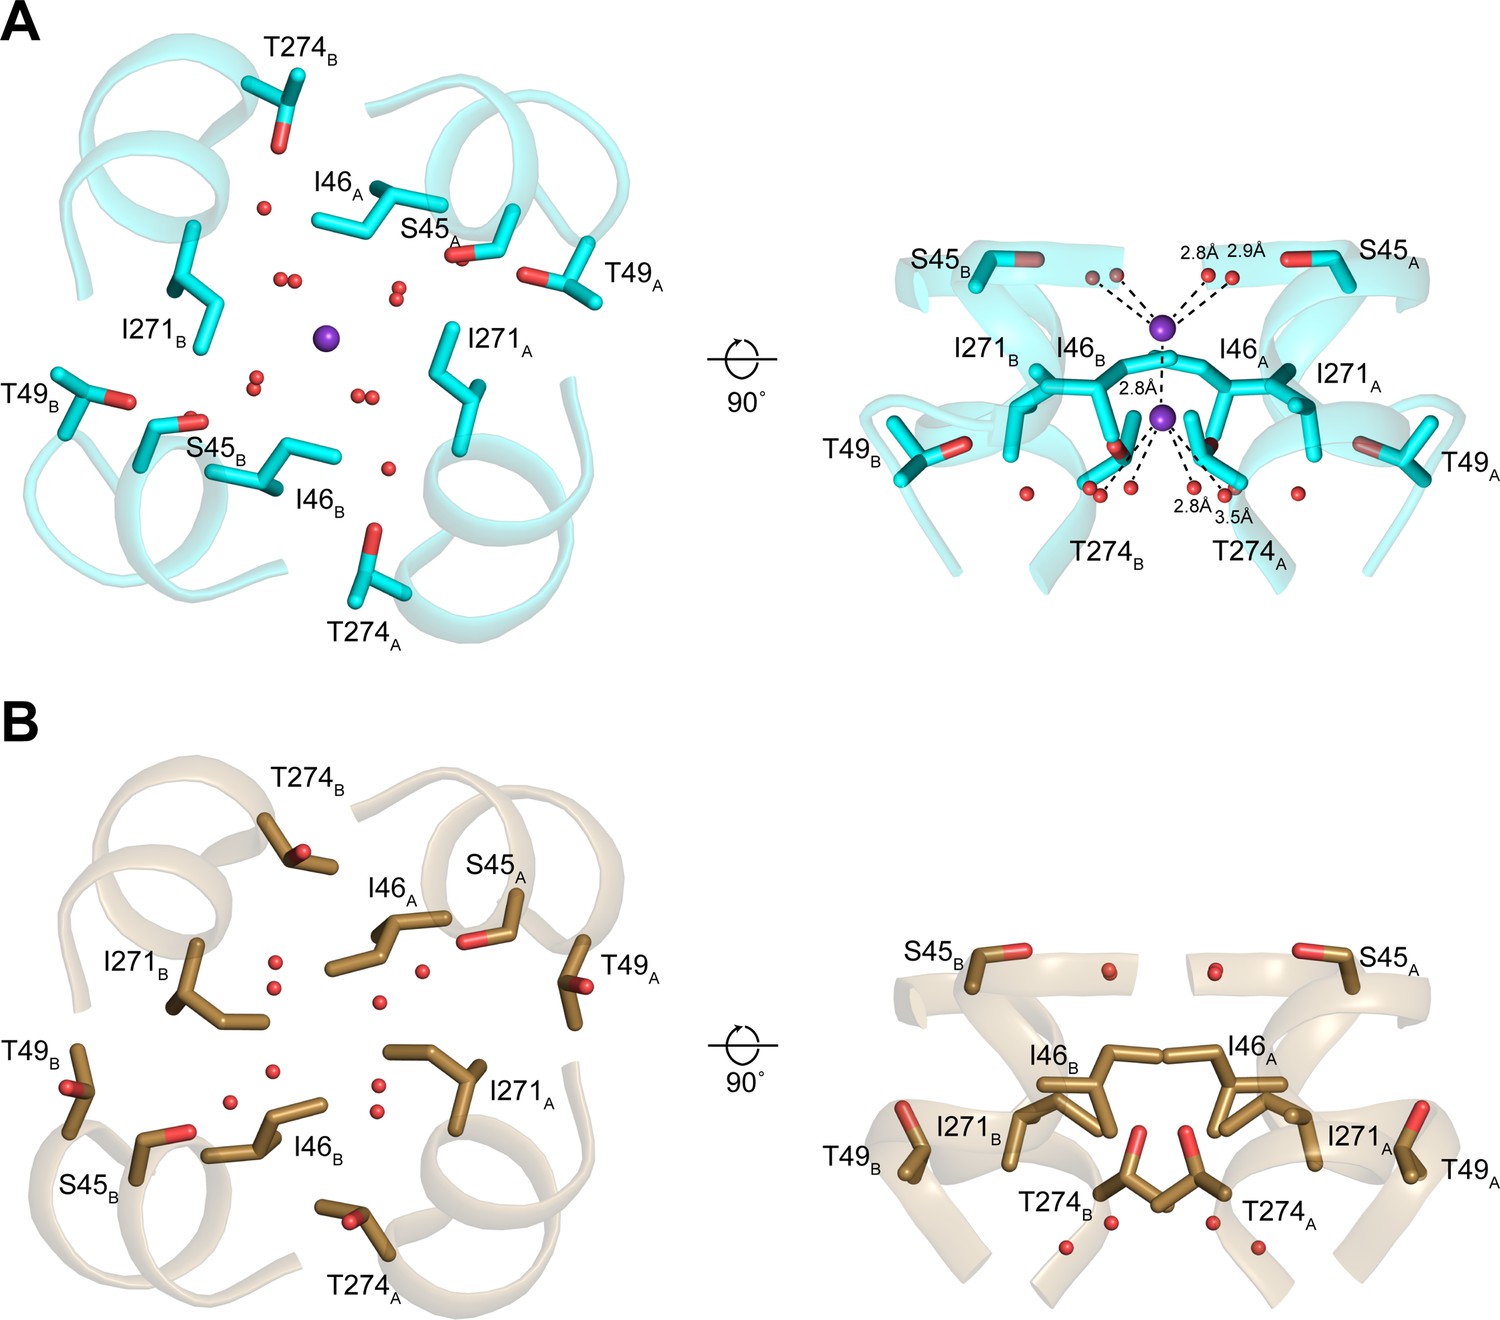
Structures of the isoleucine constriction sites in open and closed transmembrane protein 175 (TMEM175).
(A–B) Two views of the isoleucine constriction in open (A) and closed (B) TMEM175. Ile46, Ile271, and residues that coordinate water molecules are shown as sticks. Bound K+ and waters are shown as purple and red spheres, respectively.
Figure 2 with 3 supplements
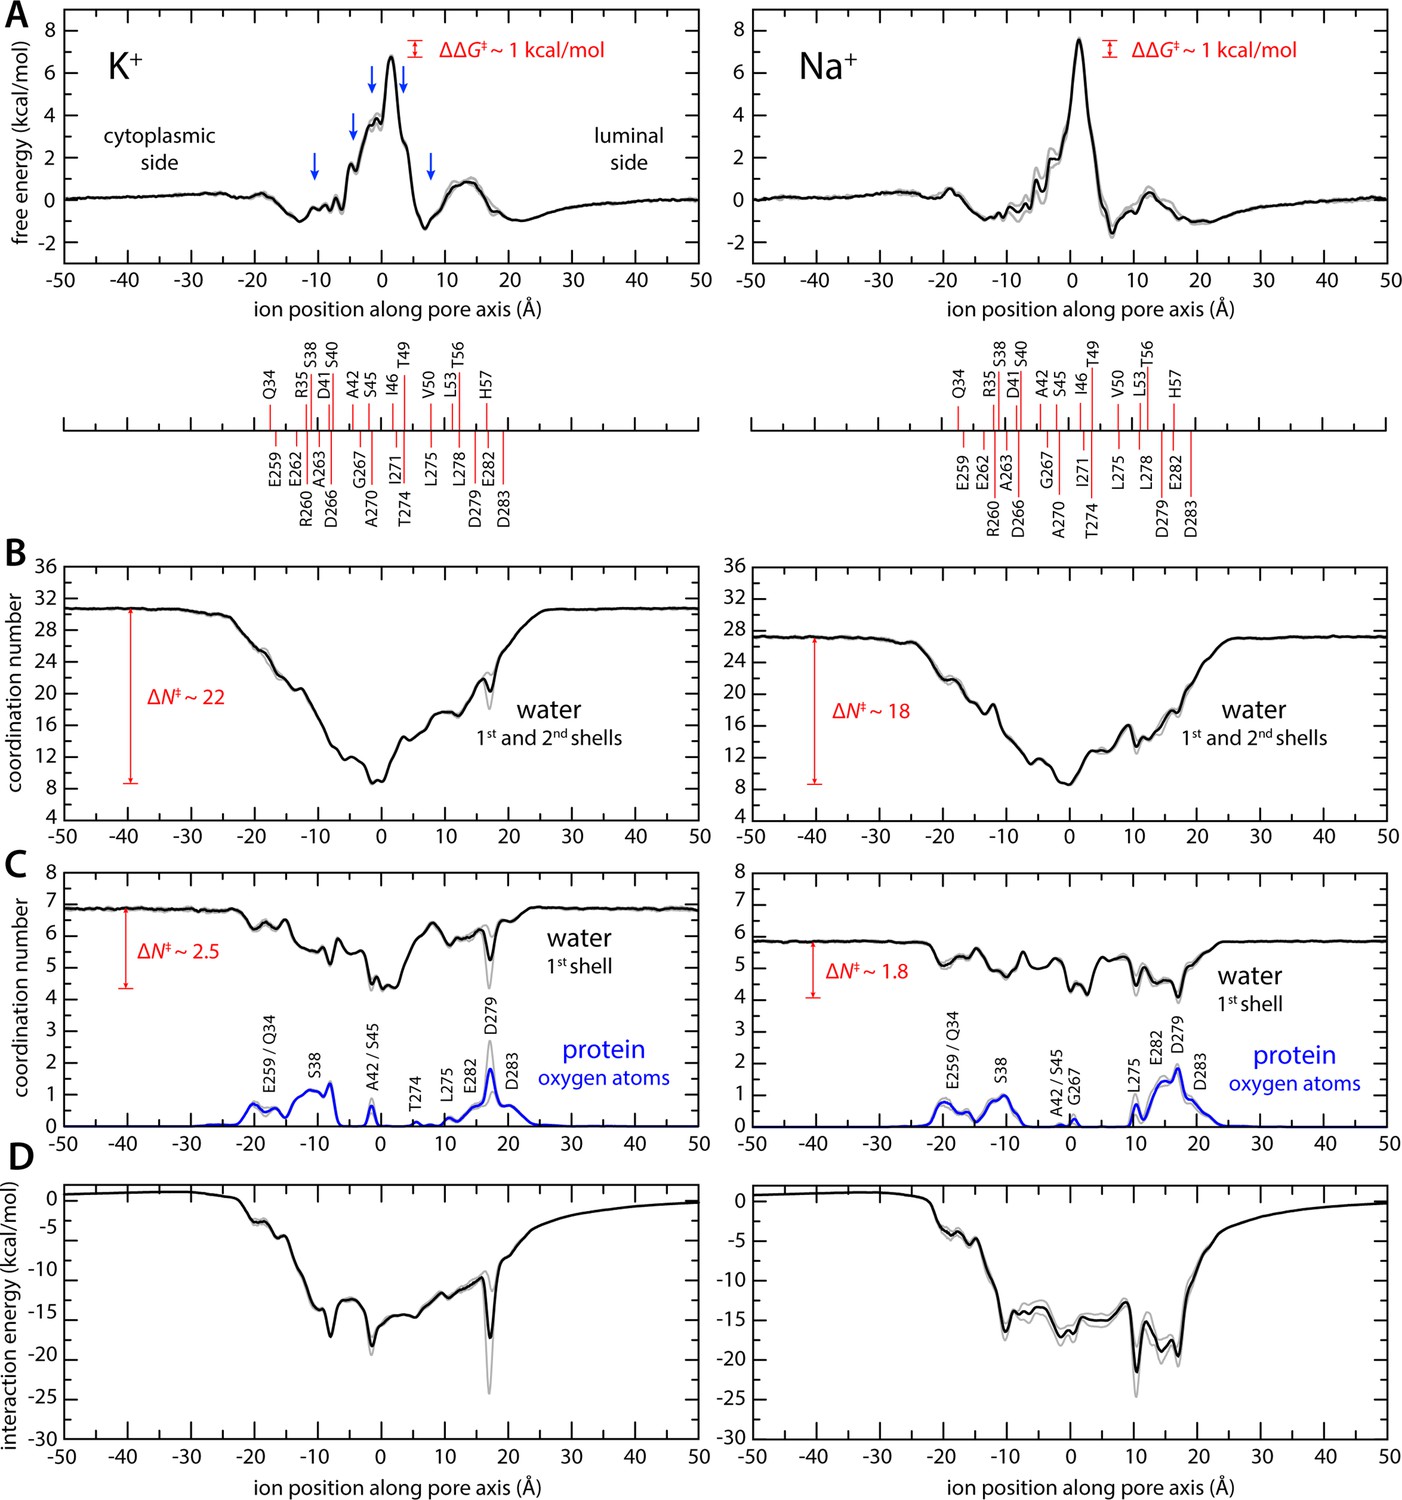
Enhanced-sampling molecular dynamics (MD) simulations of K+ and Na+ permeation through transmembrane protein 175 (TMEM175).
(A) Potential of mean force (or free energy) as a function of the ion position along the pore axis (black), for either K+ (left) or Na+ (right). See also Figure 2—figure supplement 1. The difference between the free-energy peak for Na+ and that for K+ (ΔΔG) is indicated. Blue arrows indicate the approximate position of the density peaks assigned to K+ ions in Figure 1. For reference, the position of selected residues in helices TM1 and TM7 is also indicated under the free-energy curves. These positions are defined as the time average of the center-of-mass of side chain and Cα atoms, including equivalent protein subunits, projected along the pore axis. (B) Average number of water molecules in the first and second ion hydration shells, as a function of the ion position along the pore axis (black). The degree of depletion at the isoleucine constriction (ΔN), relative to bulk hydration, is indicated for each ion. (C) Same as (B), only for the first ion hydration shell (black). The average number of protein-oxygen atoms observed to coordinate an ion, as a function the ion position, is also shown alongside (blue), indicating the principal contributing residues. See also Figure 2—figure supplement 3. (D) Ion-protein electrostatic interaction energy as a function of the ion position along the pore axis. In all panels, gray profiles represent the same quantity shown in black/blue calculated using only the first or second half of the simulation data. Comparison of these two profiles provides a metric of the statistical error in these calculations. The mean difference between the free-energy profiles for K+ is 0.14 kcal/mol; for Na+, it is 0.22 kcal/mol. See Materials and methods for further details and definitions.
Figure 2—figure supplement 1
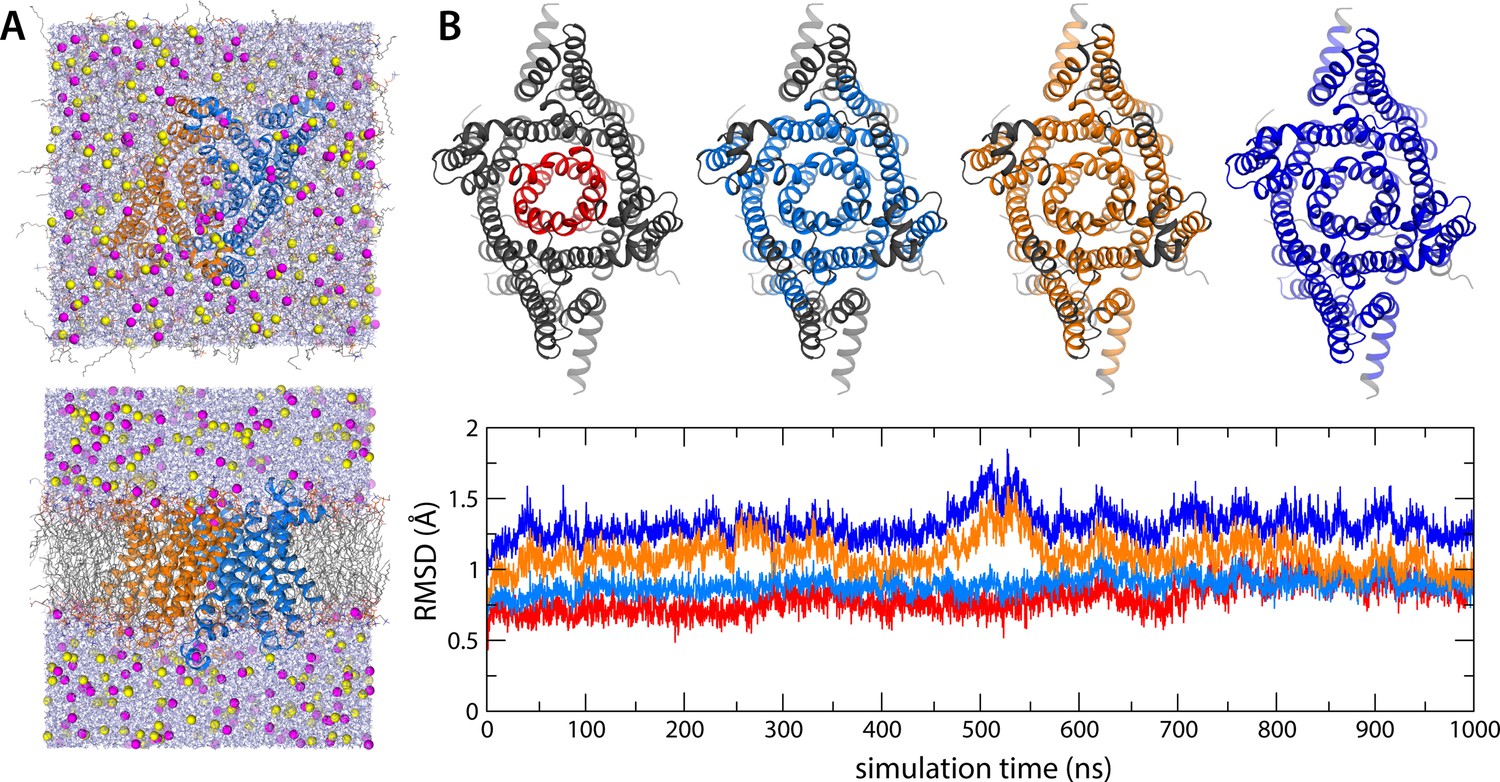
All-atom molecular dynamics (MD) simulations of human transmembrane protein 175 (hTMEM175).
(A) Two views of the periodic box enclosing the simulation system, at the end of a 1 µs trajectory at 500 mV. The channel (marine/orange cartoons) is immersed in a palmitoyl-oleoyl-phosphatidyl-choline (POPC) lipid bilayer (colored lines) and a 400 mM KCl buffer (K+ in magenta, Cl- in yellow, water in purple). (B) Evaluation of the deviation of the protein structure from the cryo-EM model as a function of simulation time, for the same 1 µs trajectory at 500 mV. The plot quantifies the RMSD of the channel backbone for different portions of the structure, represented graphically above the plot, after least-squares self-fitting. The color code of the time series corresponds to that used in the graphical representations.
Figure 2—figure supplement 2

Enhanced-sampling molecular dynamics (MD) simulations of K+ and Na+ permeation through human transmembrane protein 175 (hTMEM175).
(A) For each of the Metadynamics trajectories calculated to examine the permeation of K+ (at 0 mV and 100 mM KCl), time series of the position along the channel axis of the subset of the ions in the simulation found within 10 Å of that axis. The zero value approximately corresponds to the position of Ile46 and Ile271, which defined the central constriction. The entrances to the pore on the cytoplasmic and the luminal sides are approximately 20 Å away from this point (negative and positive values, respectively). Most of the trajectories depicted show ions approaching these entrances and returning to the bulk. See also Figure 2. (B) Same as (A), for the Metadynamics trajectories calculated to study Na+ permeation.
Figure 2—figure supplement 3
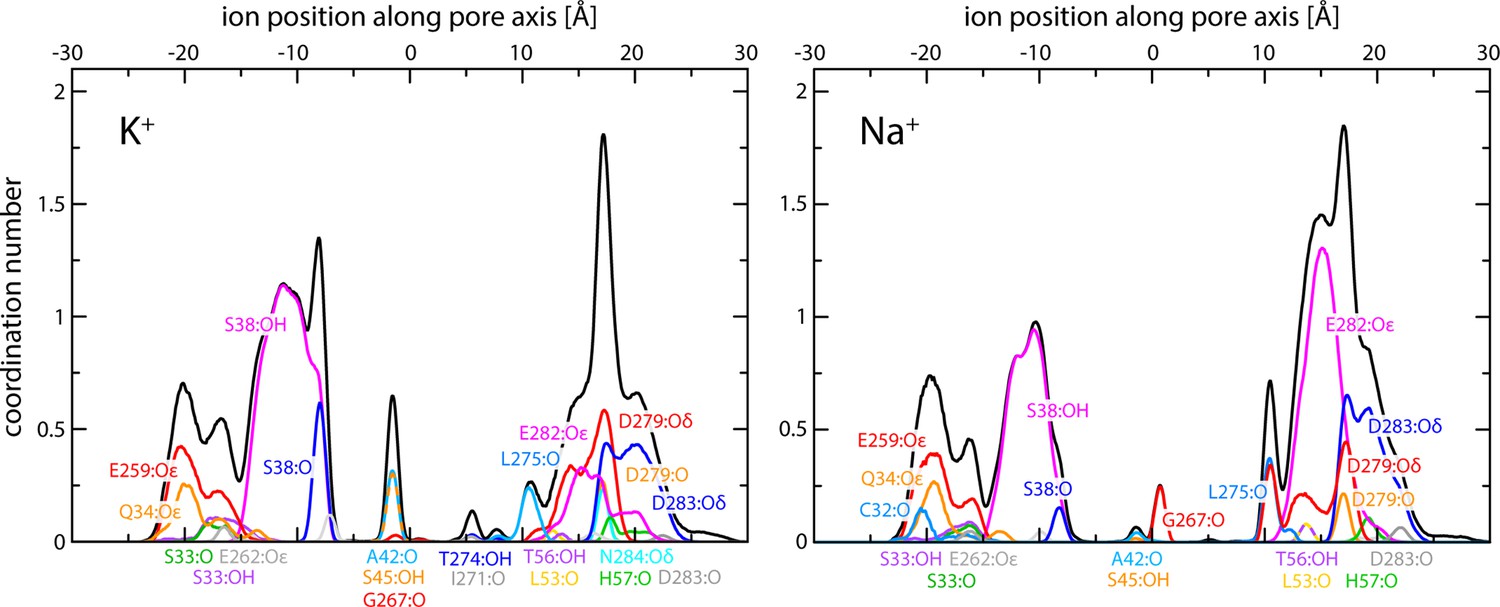
Enhanced-sampling molecular dynamics (MD) simulations of K+ and Na+ permeation through human transmembrane protein 175 (hTMEM175).
The plots report on the occurrence and persistence of direct contacts between ions and protein oxygen atoms along the central pore, as a function of the ion position along the pore axis (colors). The data reflect time averages over the simulated trajectories. The most significant contacts are identified. The cumulative coordination number at any given position is shown alongside (black; same as in Figure 2C).
Figure 3 with 2 supplements
Molecular dynamics (MD) simulations of K+ and Na+ permeation through human transmembrane protein 175 (hTMEM175).
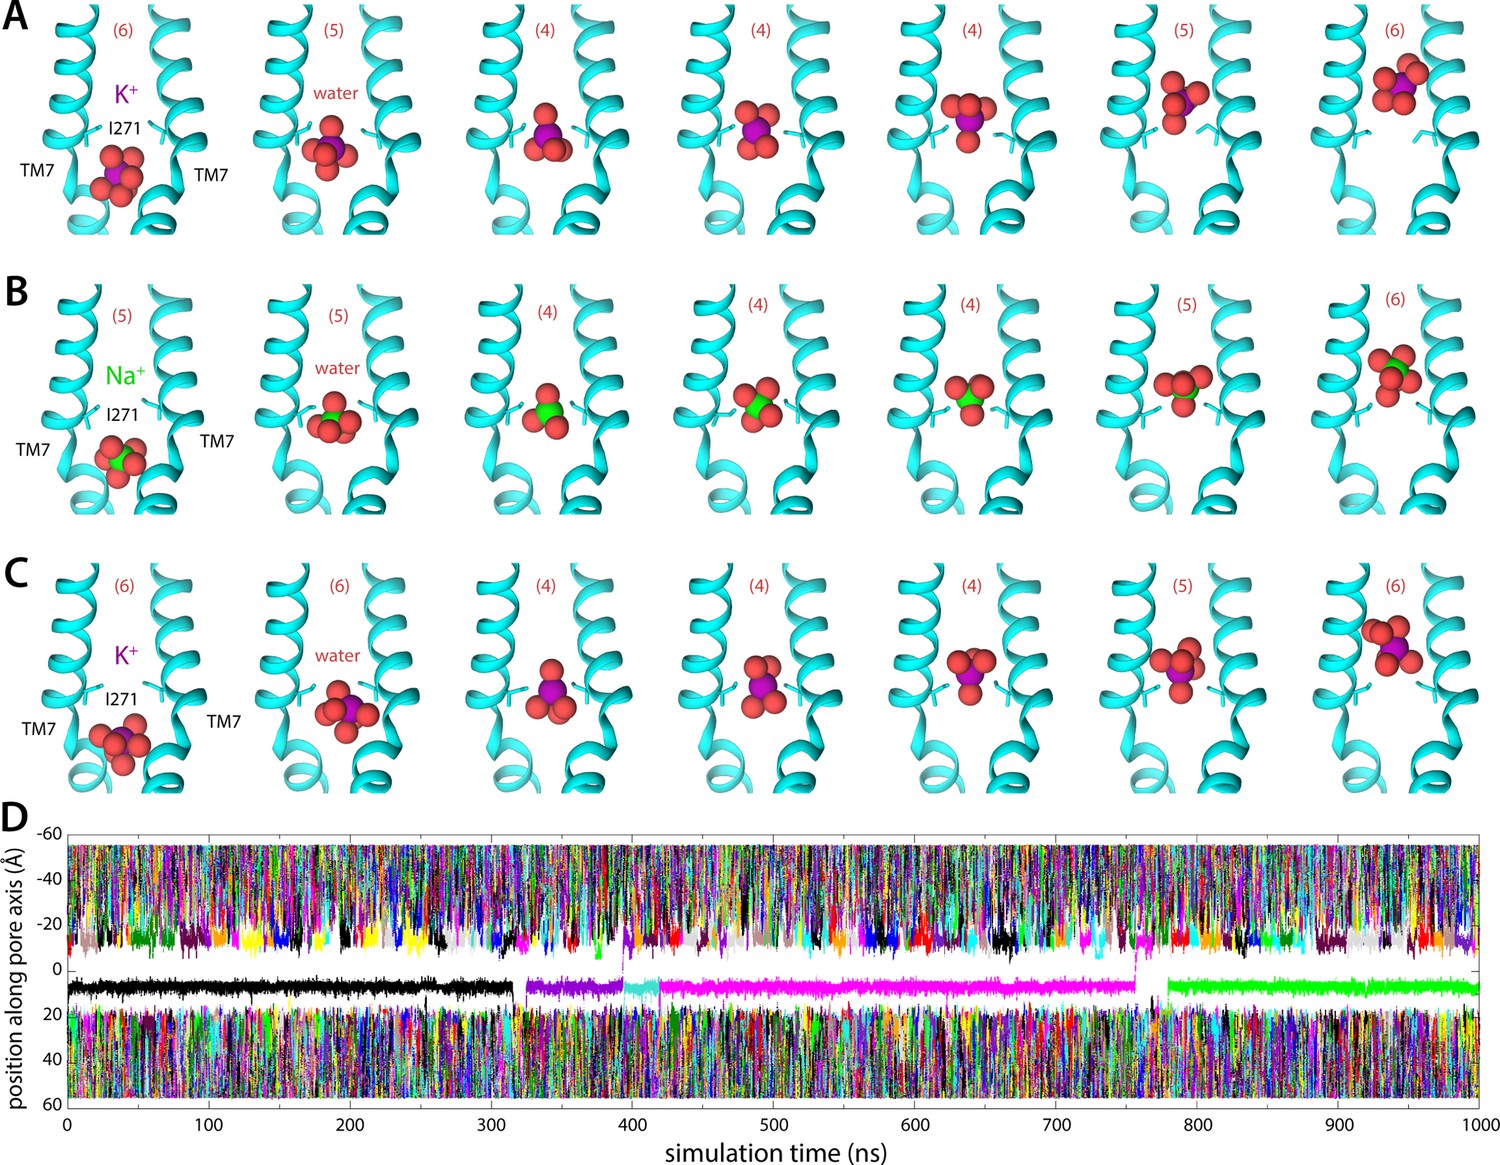
(A) Snapshots of one of the trajectories calculated with enhanced-sampling MD, at 0 mV and 100 mM KCl, showing a K+ permeation event across the isoleucine constriction. For clarity only TM7 is shown, in cartoon representation, alongside the side chain of I271. Red spheres represent the oxygen atoms of the water molecules in the first ion hydration shell, defined as in Figure 2. The number of water molecules in the first ion hydration shell is shown in parentheses. (B) Same as (A), for a Na+ permeation event. (C) Same as (A), from a trajectory calculated with conventional MD sampling, but at 500 mV and 400 mM KCl. (D) For the latter trajectory, time series of the position along the channel axis of the subset of the K+ ions in the simulation found within 10 Å of that axis. The trajectory revealed two permeation events in 1 µs.
Figure 3—video 1
Molecular dynamics (MD) simulation of K+ permeation through human transmembrane protein 175 (hTMEM175) under an applied voltage.
The movie depicts a 250 ns fragment of the time trace shown in Figure 3D, starting at 250 ns. The movie shows a close-up of the pore, highlighting the isoleucine constriction. For clarity, one of the TM1 helices has been omitted, as have all side chains except for I46 and I271. Hydrogen atoms are also omitted for clarity.
Water molecules within the pore are shown as small spheres (red); K+ ions as large spheres (colors). Note a permeation event occurs approximately halfway through the movie (yellow sphere).
Figure 3—video 2
Molecular dynamics (MD) simulation of K+ permeation through human transmembrane protein 175 (hTMEM175) under an applied voltage.
The permeation event depicted in Figure 3—video 1 (approximately at the 380 ns timepoint in the trace shown in Figure 3) is examined with greater time resolution. The movie spans a 2 ns time window.
Figure 4

Ion selectivity of the isoleucine constriction.
(A) Left, free-energy difference between hydrated K+ and Na+, in bulk water, calculated with molecular dynamics (MD) simulations using the free-energy perturbation (FEP) method. The free energy is plotted as a function of a varying parameter λ that determines the size of ion (λ=0 for K+ and λ=1 for Na+). Results are shown for a calculation wherein K+ is transformed into Na+ (forward, black line) and for another carried out in the opposite direction (backward, red circles). Middle, analogous free-energy differences, calculated for an ion that is confined within the isoleucine constriction of wild-type TMEM175. Right, same as above, for the I46V mutant. Comparison of forward and backward curves provides a metric of the statistical error in these calculations, which is at most 0.1 kcal/mol. (B) Snapshots of the MD/FEP simulations at the end of the forward and backward transformations, for wild-type TMEM175 and I46V mutant. For clarity, only TM1 is shown, in cartoon representation, alongside the side chain of I46/V46. Red spheres represent the oxygen atoms of the water molecules in the first ion hydration shell, defined as in Figure 2.
Figure 5 with 4 supplements

Electrophysiological analysis of human transmembrane protein 175 (hTMEM175)-transfected HEK293T cells.
Representative whole-cell electrical recordings and current-voltage relationships of hTMEM175-transfected (A), I46V-transfected (B), and I271V-transfected (C) HEK293T cells in the absence and presence of inhibitor AP-6, in bi-ionic conditions of 150 mM Cs+ (intracellular) and 150 mM Na+ (extracellular). Current amplitudes in the current-voltage relationship plots were gained by averaging current values in the shaded time window. (D) A schematic of whole-cell patch clamp performed in (A–C and E). (E) Current-voltage relationships of six independent whole-cell patch clamp recordings of hTMEM175 WT-, I46V-, and I271V-transfected cells in bi-ionic conditions of 150 mM Cs+ (intracellular) and 150 mM Na+ (extracellular).
-
Figure 5—source data 1
Source data for Figure 5.
- https://cdn.elifesciences.org/articles/75122/elife-75122-fig5-data1-v1.zip
-
Figure 5—source data 2
Source data for Figure 5.
- https://cdn.elifesciences.org/articles/75122/elife-75122-fig5-data2-v1.zip
Figure 5—figure supplement 1
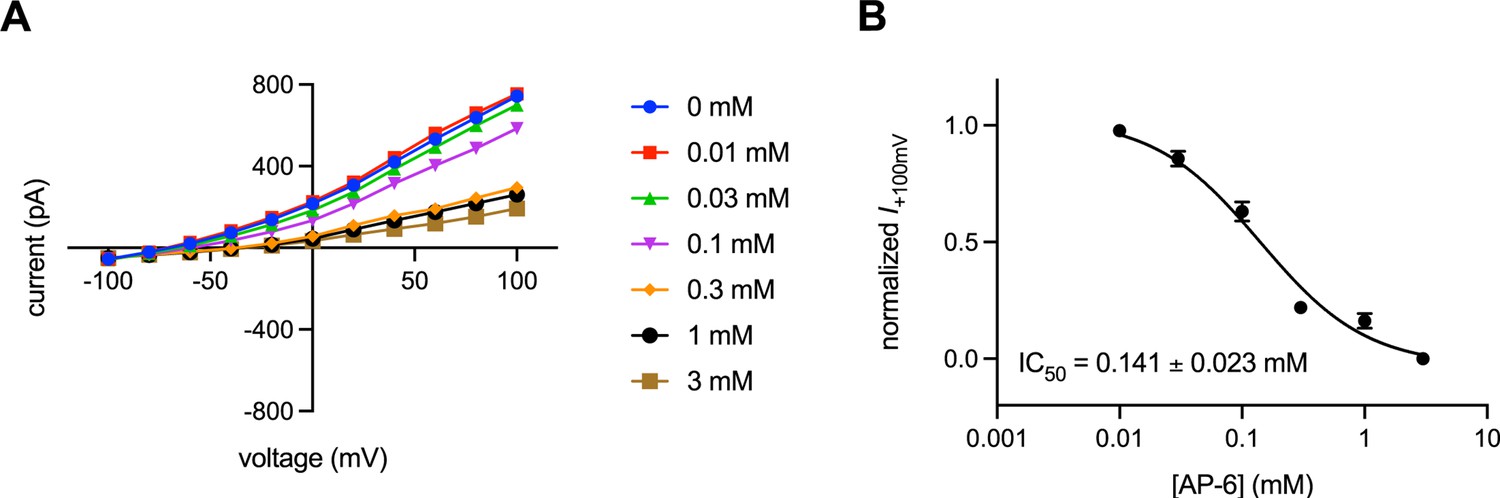
Characterization of transmembrane protein 175 (TMEM175) inhibition by AP-6.
(A) Current-voltage relationships of whole-cell patch clamp recordings of human TMEM175 (hTMEM175)-transfected cells under various concentrations of AP-6. (B) Dose-response curve of Cs+ current at +100 mV from three independent titrations. Means and SEM are shown.
Figure 5—figure supplement 2
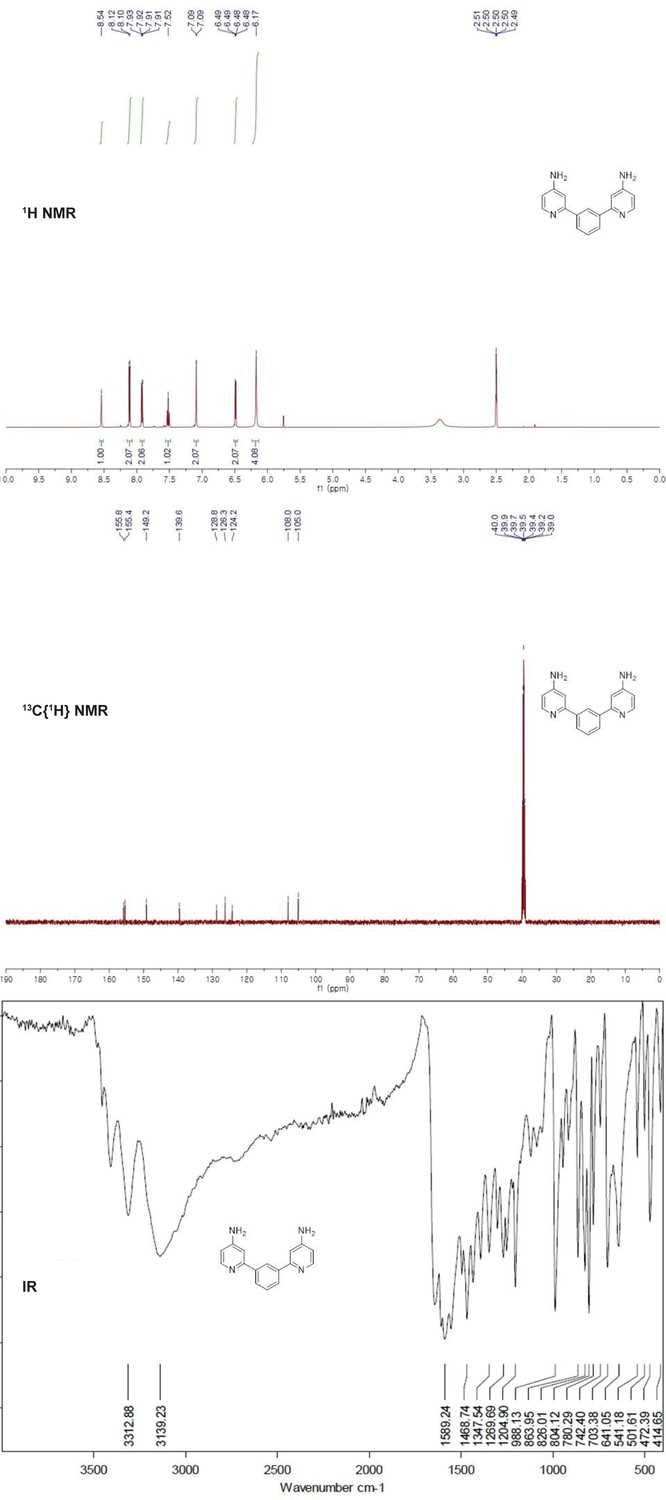
Spectroscopy of AP-6.
1H-NMR, 13C{1H}-NMR, and IR spectrum of AP-6.
Figure 5—figure supplement 3
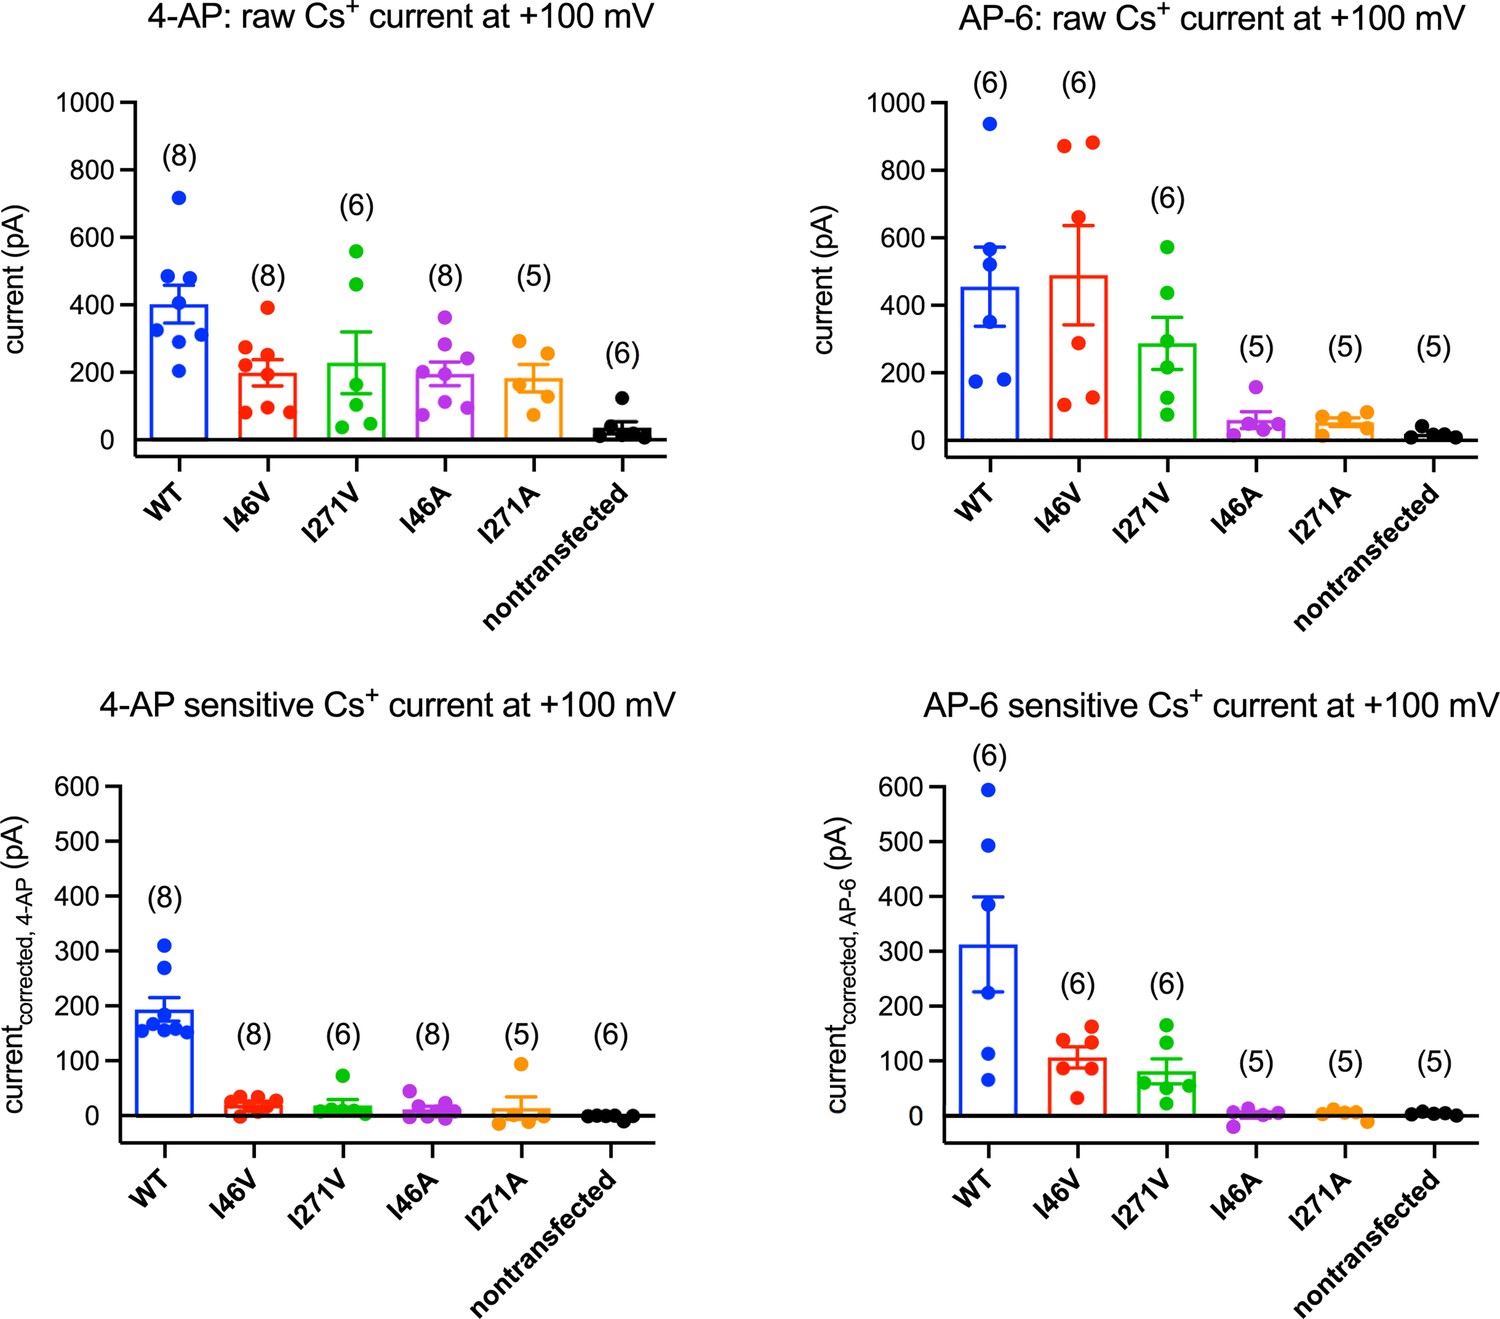
4-Aminopyridine (4-AP) and AP-6 sensitivity of transmembrane protein 175 (TMEM175) mutants.
Mean currents recorded from HEK293T cells transfected with human TMEM175 (hTMEM175) (blue), I46V (red), I271V (green), I46A (purple), I271A (orange), and non-transfected (black) at +100 mV: raw currents before applying 1 mM 4-AP (upper left), 4-AP-sensitive current (bottom left), raw currents before applying 2 mM AP-6 (upper right), and AP-6-sensitive current (bottom right). Number of experiments for each mutant are presented in parentheses.
Figure 5—figure supplement 4

4-Aminopyridine (4-AP) insensitivity of I271V mutant.
4-AP insensitivity of I271V mutant. Representative whole-cell electrical recordings and current-voltage relationships of I271V-transfected HEK293T cells in the absence or presence of 4-AP in bi-ionic conditions of 150 mM Cs+ (intracellular) and 150 mM Na+ (extracellular). Current amplitudes in the current-voltage relationship plots were gained by averaging current values in the shaded time window.
Tables
Appendix 1—table 1
Cryo-EM data acquisition, reconstruction, and model refinement statistics.
| TMEM175Open | TMEM175Closed | |
|---|---|---|
| Cryo-EM acquisition and processing | ||
| EMDB accession # | EMD-26626 | EMD-26627 |
| Magnification | 22,500× | 22,500× |
| Voltage (kV) | 300 | 300 |
| Total electron exposure (e-/ Å2) | 61 | 61 |
| Exposure time (s) | 8 | 8 |
| Defocus range (µM) | −1.0 to −2.5 | −1.0 to −2.5 |
| Pixel size (Å) | 1.088 | 1.088 |
| Final pixel size (Å) | 0.85 | 0.85 |
| Symmetry imposed | C2 | C2 |
| Initial particles | 4,153,614 | 4,153,614 |
| Final particles | 261,536 | 163,651 |
| Resolution (masked, Å) | 2.45 | 2.61 |
| Density modified CC (0.5, Å) | 2.43 | 2.65 |
| Model refinement | ||
| PDB ID | 7UNL | 7UNM |
| Model resolution (Å) | 2.48/1.96 | 2.88/2.49 |
| FSC threshold | 0.50/0.143 | 0.50/0.143 |
| Model refinement resolution | 300–2.4 | 300–2.6 |
| RMS deviations | ||
| Bond length (Å) | 0.003 | 0.002 |
| Bond angle (°) | 0.559 | 0.433 |
| Ramachandran plot | ||
| Favored (%) | 98.9 | 99.45 |
| Allowed (%) | 1.1 | 0.55 |
| Disallowed (%) | 0 | 0 |
| Rotamer outliers (%) | 1.94 | 0 |
| Validation | ||
| MolProbity score | 1.22 | 1.13 |
| Clashscore | 2.24 | 3.44 |
Additional files
Download links
A two-part list of links to download the article, or parts of the article, in various formats.
Downloads (link to download the article as PDF)
Open citations (links to open the citations from this article in various online reference manager services)
Cite this article (links to download the citations from this article in formats compatible with various reference manager tools)
Differential ion dehydration energetics explains selectivity in the non-canonical lysosomal K+ channel TMEM175
eLife 11:e75122.
https://doi.org/10.7554/eLife.75122


