Early life infection and proinflammatory, atherogenic metabolomic and lipidomic profiles in infancy: a population-based cohort study
- Murdoch Children's Research Institute, Australia
- Department of Paediatrics, University of Melbourne, Australia
- Metabolomics Laboratory, Baker Heart and Diabetes Institute, Australia
- The Florey Institute of Neuroscience and Mental Health, Australia
- Royal Children’s Hospital, Australia
- Deakin University, Australia
- Department of Internal Medicine, Radboud Institute for Molecular Life Sciences, Radboud University Medical Centre, Netherlands
- Child Health Research Centre, University of Queensland, Australia
- Child Health Research Unit, Barwon Health, Australia
- Department of Paediatrics, Monash University, Australia
Figures
Figure 1
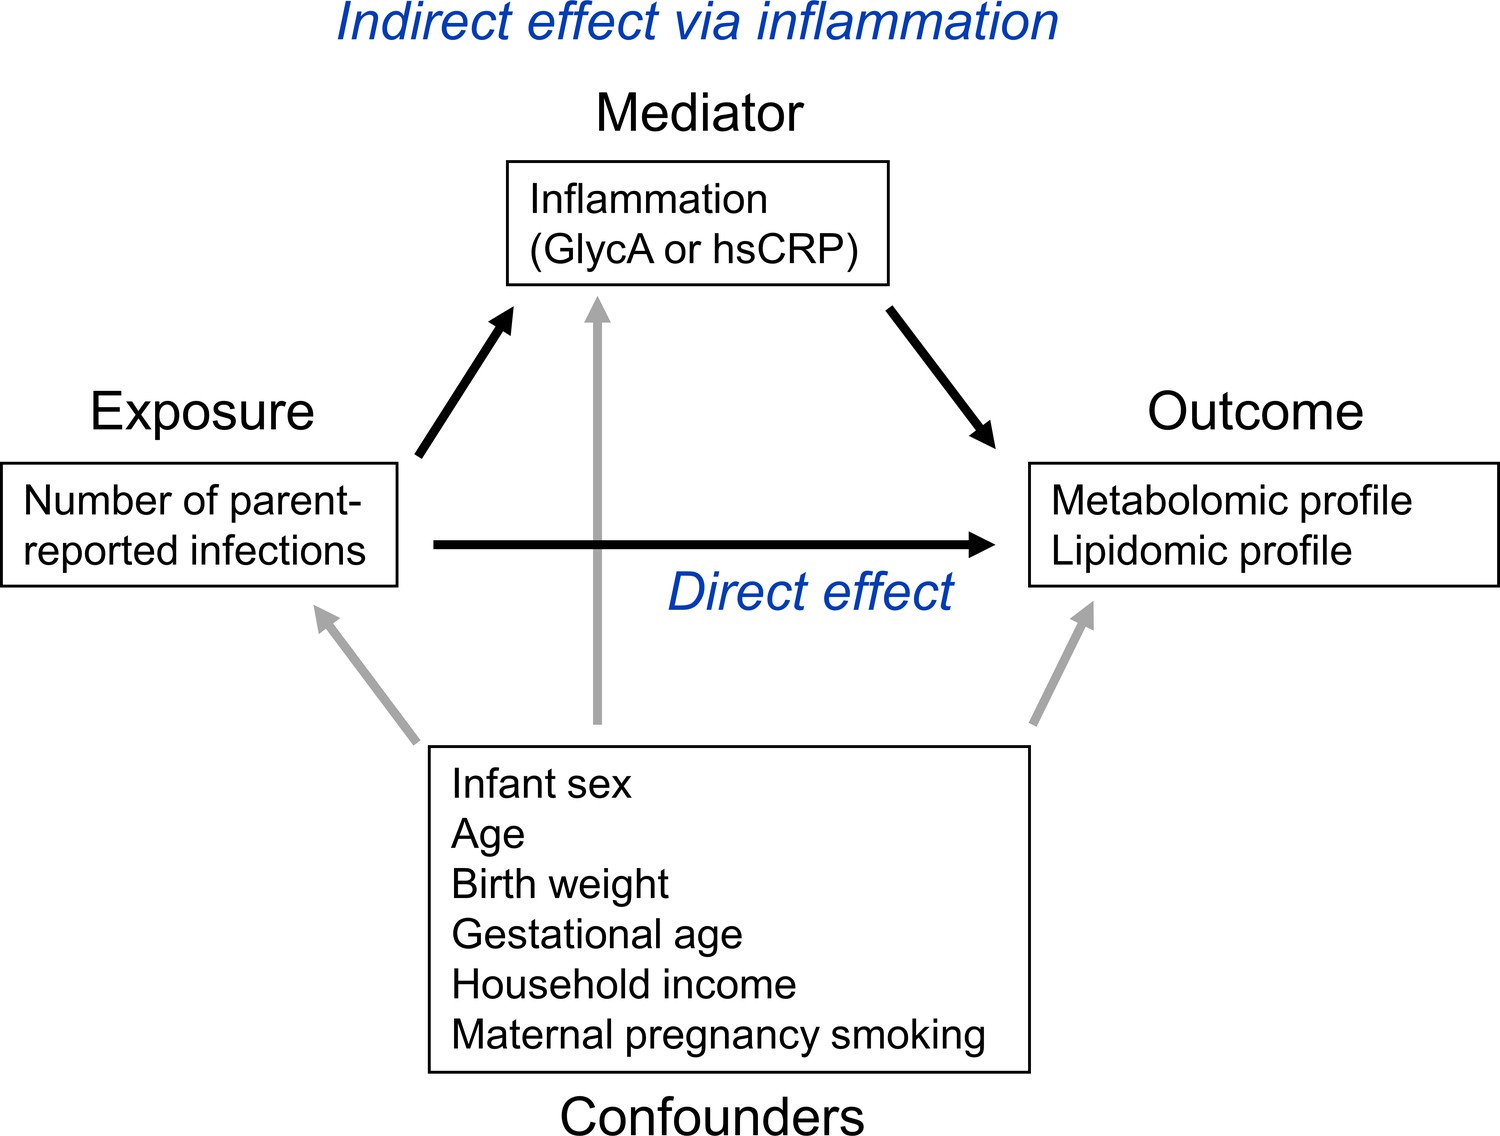
Representative directed acyclic graph (DAG) for causal model investigated in this study.
The natural indirect effect (mediated by glycoprotein acetyls [GlycA] or high-sensitivity C-reactive protein [hsCRP]) and natural direct effect (not mediated by GlycA/hsCRP) of parent-reported infections on metabolomic and lipidomic measures were calculated, with adjustment for confounders. Confounders were considered to be confounders for all associations (exposure to outcome, exposure to mediator, and mediator to outcome).
Figure 2
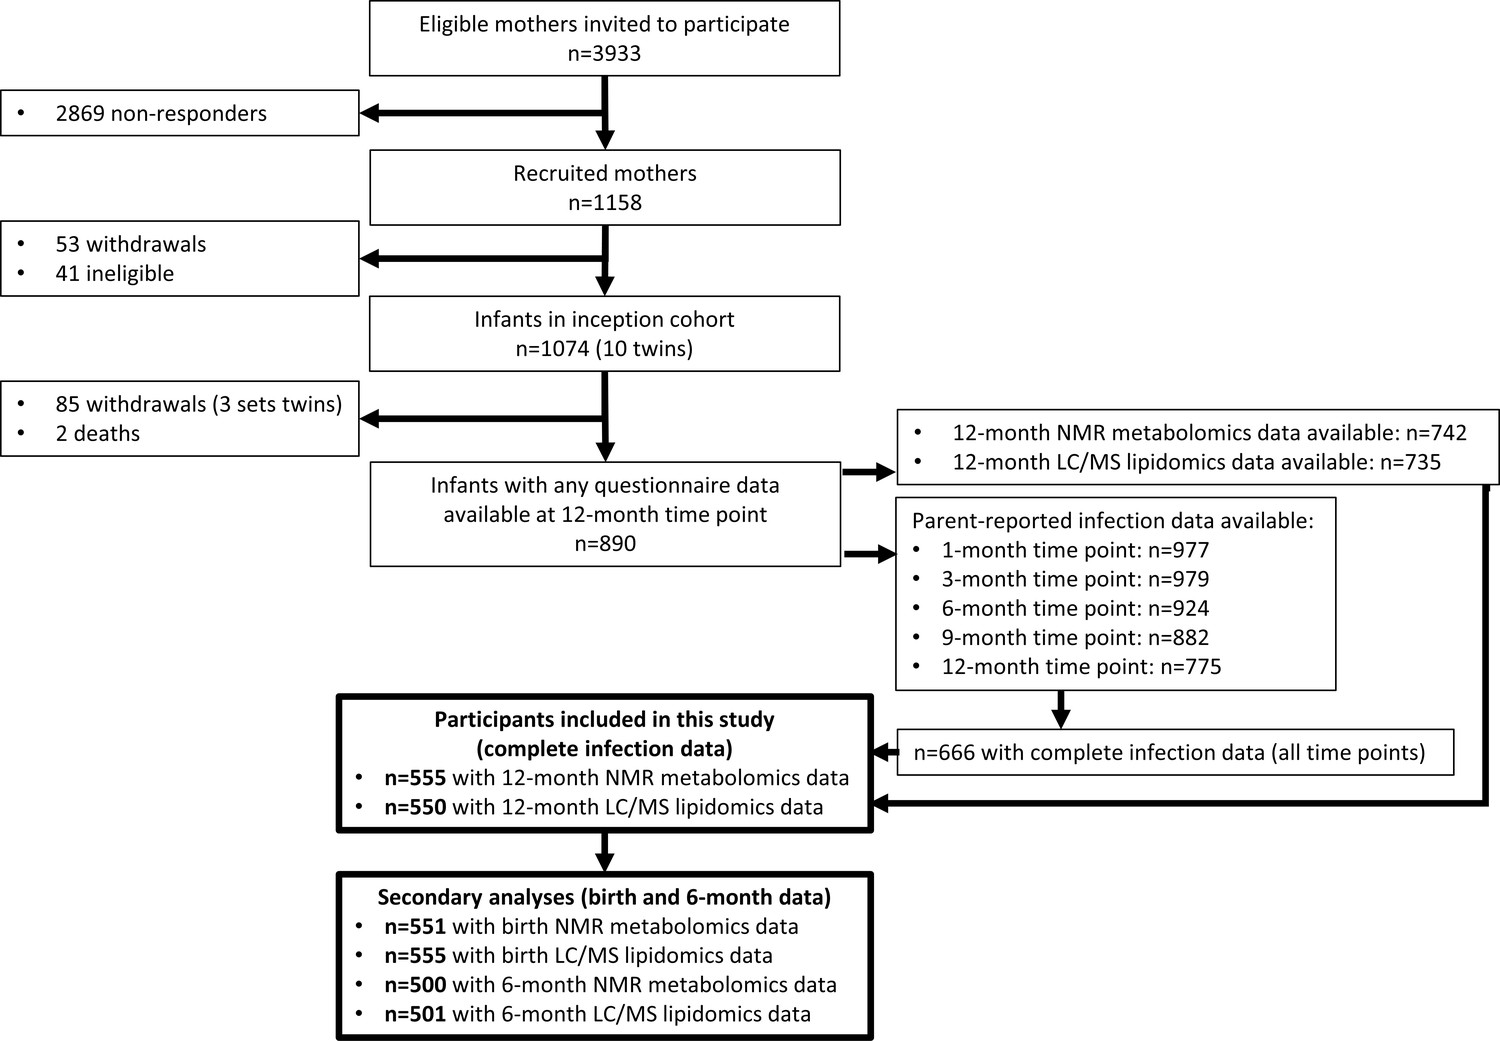
Flowchart of Barwon Infant Study participants included this study (bolded boxes).
Included participants had complete infection data from all five time points between birth and 12 months of age, and 12-month plasma nuclear magnetic resonance (NMR) metabolomics data. Almost all included participants (n = 550 out of 555) had 12-month plasma liquid chromatography/mass spectrometry (LC/MS) lipidomics data.
Figure 3 with 2 supplements

Difference in 12-month plasma nuclear magnetic resonance (NMR) metabolomic measures for each increase in parent-reported infection (birth to 12 months) and for each SD increase in 12-month glycoprotein acetyls (GlycA) (n = 555).
Forest plots of the estimated 12-month metabolomic differences for each additional parent-reported infection from birth to 12 months (a, circle points) or SD log 12-month GlycA (b, square points) from adjusted linear regression models, and the correlation of estimated metabolomic differences for these two exposures (c). Error bars are 95% confidence intervals. Closed points represent adjusted p-value < 0.05. All models were adjusted for infant age, sex, gestational age, birth weight, maternal household income, smoking during pregnancy, breastfeeding status, and sample processing time. Infection and GlycA exposure model estimates and details for all NMR metabolomic measures are shown in Figure 3—source data 1.
-
Figure 3—source data 1
Summary of regression models for difference in 12-month nuclear magnetic resonance (NMR) metabolomic measures per 1 increase in parent-reported infection from birth to 12 months of age or per SD increase in 12-month log glycoprotein acetyls (GlycA).
- https://cdn.elifesciences.org/articles/75170/elife-75170-fig3-data1-v1.xlsx
-
Figure 3—source data 2
Summary of regression models for difference in 6-month nuclear magnetic resonance (NMR) metabolomic measures per 1 increase in parent-reported infection from birth to 6 months of age or per SD increase in 6-month log GlycA.
- https://cdn.elifesciences.org/articles/75170/elife-75170-fig3-data2-v1.xlsx
-
Figure 3—source data 3
Summary of regression models for difference in 12-month nuclear magnetic resonance (NMR) metabolomic measures (adjusted for corresponding 6-month measure) per 1 increase in parent-reported infection from 6 to 12 months of age (adjusted for infections from birth to 6 months) or per SD increase in 12-month log glycoprotein acetyls (GlycA) (adjusted for 6-month GlycA).
- https://cdn.elifesciences.org/articles/75170/elife-75170-fig3-data3-v1.xlsx
Figure 3—figure supplement 1
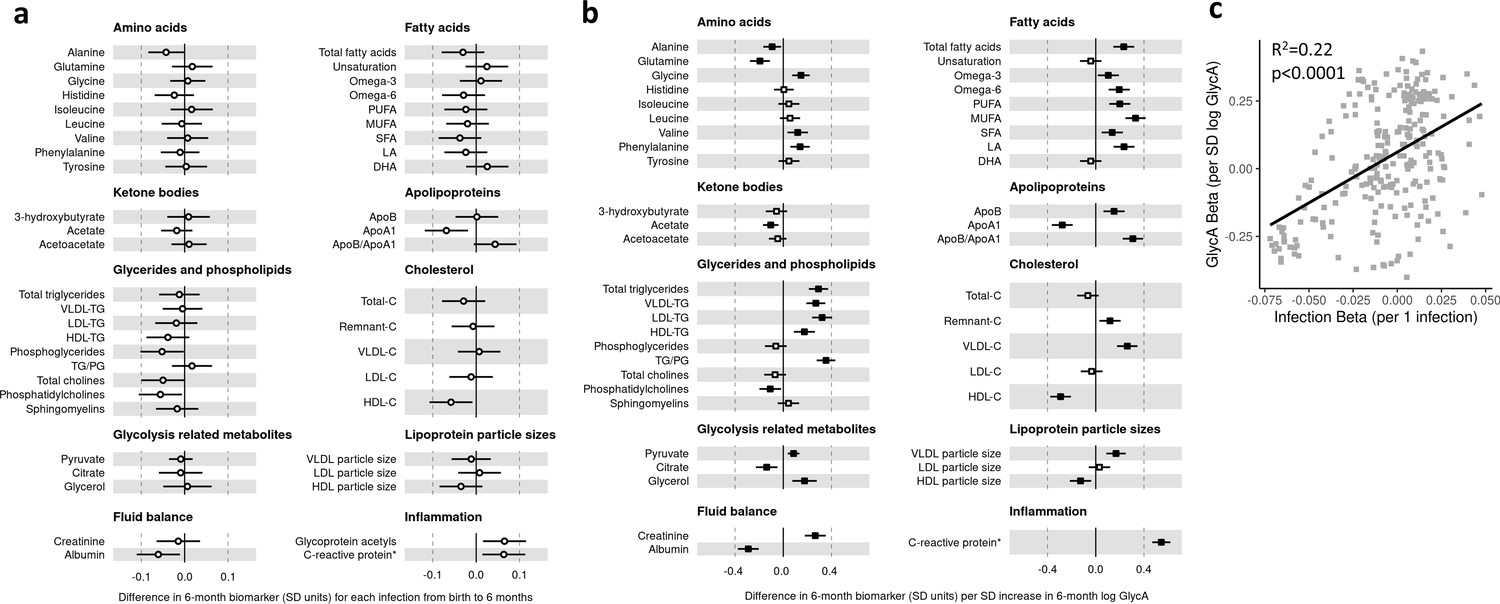
Difference in 6-month plasma nuclear magnetic resonance (NMR) metabolomic measures for each increase in parent-reported infection from birth to 6 months and for each SD increase in 6-month log glycoprotein acetyls (GlycA) (n = 500).
Forest plots of the estimated 6-month metabolomic differences for each additional parent-reported infection from birth to 6 months (a, circle points) or SD log 6 month GlycA (b, square points) from adjusted linear regression models, and the correlation of estimated metabolomic differences for these two exposures (c). Error bars are 95% confidence intervals. Closed points represent adjusted p-value < 0.05. All models were adjusted for infant age, sex, gestational age, birth weight, maternal household income, smoking during pregnancy, breastfeeding status, and sample processing time. Infection and GlycA exposure model estimates and details for all NMR metabolomic measures are shown in Figure 3—source data 2.
Figure 3—figure supplement 2

Difference in 12-month plasma nuclear magnetic resonance (NMR) metabolomic measures (adjusted for corresponding 6-month measure) per 1 increase in parent-reported infection from 6 to 12 months of age (adjusted for infections from birth to 6 months) or per SD increase in 12-month log glycoprotein acetyls (GlycA) (adjusted for 6-month GlycA) (n = 500).
Forest plots of the estimated 12-month metabolomic differences for each additional parent-reported infection from 6 to 12 months (a, circle points) or SD log 12-month GlycA (b, square points) from adjusted linear regression models, adjusted for corresponding 6-month metabolomic measures. Infection models were adjusted for number of infections from birth to 6 months of age, and GlycA models were adjusted for 6-month GlycA. The correlation of estimated metabolomic differences for these two exposures (c). Error bars are 95% confidence intervals. Closed points represent adjusted p-value < 0.05. All models were adjusted for infant age, sex, gestational age, birth weight, maternal household income, smoking during pregnancy, breastfeeding status, and sample processing time. Infection and GlycA exposure model estimates and details for all NMR metabolomic measures are shown in Figure 3—source data 3.
Figure 4 with 2 supplements
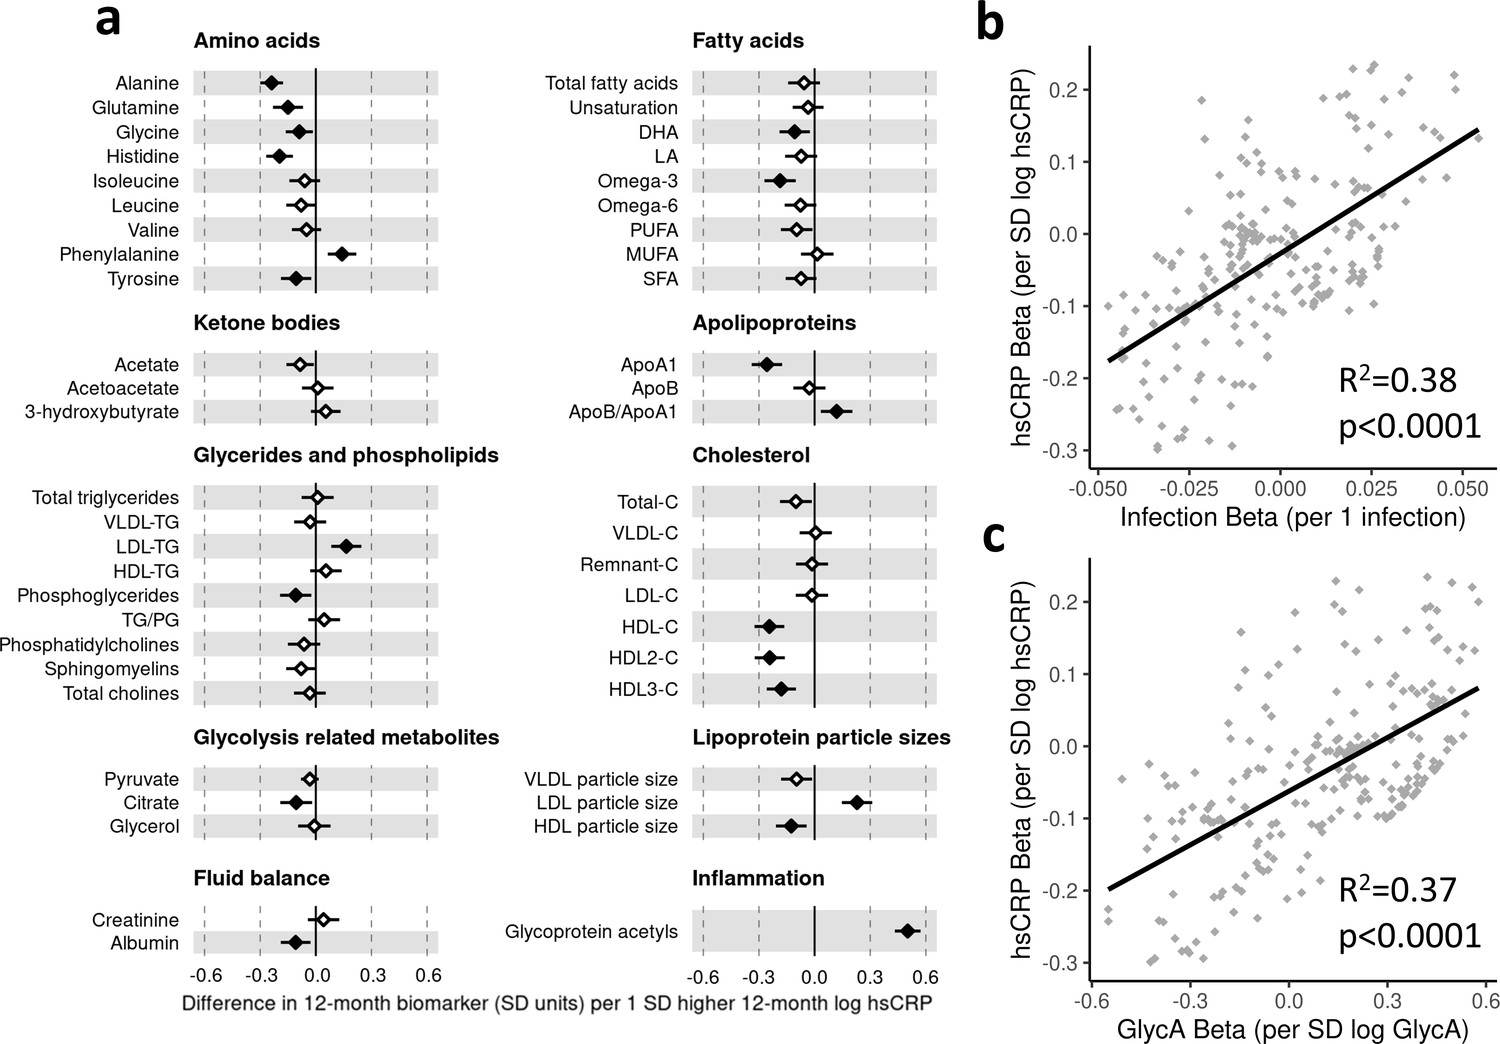
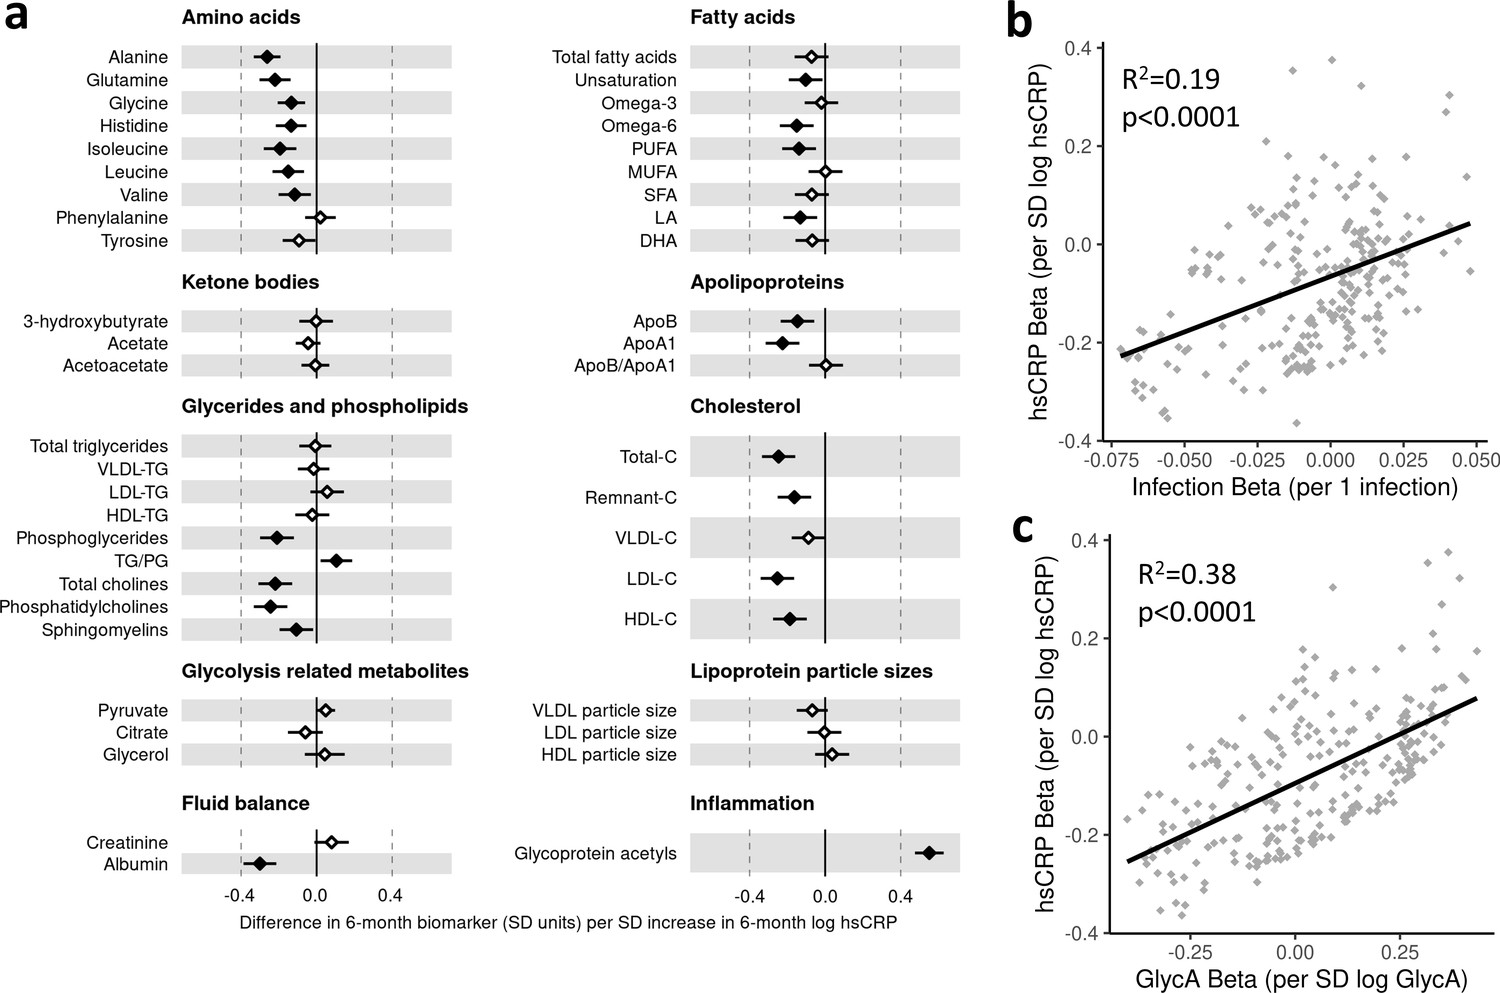
Difference in 12-month plasma nuclear magnetic resonance (NMR) metabolomic measures for each SD increase in 12-month high-sensitivity C-reactive protein (hsCRP) (n = 555).
Forest plot for the estimated 12-month metabolomic differences for each additional SD log 12-month hsCRP (a, diamond points) from adjusted linear regression models, and the correlation of estimated metabolomic differences for infection and hsCRP (b) and for glycoprotein acetyls (GlycA) and hsCRP (c). Error bars are 95% confidence intervals. Closed points represent adjusted p-value < 0.05. All models were adjusted for infant age, sex, gestational age, birth weight, maternal household income, smoking during pregnancy, breastfeeding status, and sample processing time. hsCRP exposure model estimates and details for all NMR metabolomic measures are shown in Figure 4—source data 1.
-
Figure 4—source data 1
Summary of regression models for difference in 12-month nuclear magnetic resonance (NMR) metabolomic measures per SD increase in 12-month log high-sensitivity C-reactive protein (hsCRP).
- https://cdn.elifesciences.org/articles/75170/elife-75170-fig4-data1-v1.xlsx
-
Figure 4—source data 2
Summary of regression models for difference in 6-month nuclear magnetic resonance (NMR) metabolomic measures per SD increase in 6-month log high-sensitivity C-reactive protein (hsCRP).
- https://cdn.elifesciences.org/articles/75170/elife-75170-fig4-data2-v1.xlsx
-
Figure 4—source data 3
Summary of regression models for difference in 12-month nuclear magnetic resonance (NMR) metabolomic measures (adjusted for corresponding 6-month measure) per SD increase in 12-month log high-sensitivity C-reactive protein (hsCRP) (adjusted for 6-month hsCRP).
- https://cdn.elifesciences.org/articles/75170/elife-75170-fig4-data3-v1.xlsx
Figure 4—figure supplement 1
Difference in 6-month plasma nuclear magnetic resonance (NMR) metabolomic measures for each SD increase in 6-month log high-sensitivity C-reactive protein (hsCRP) (n = 500).
Forest plot for the estimated 6-month metabolomic differences for each additional SD log 6-month hsCRP (a, diamond points) from adjusted linear regression models, and the correlation of estimated metabolomic differences for infection and hsCRP (b) and for glycoprotein acetyls (GlycA) and hsCRP (c). Error bars are 95% confidence intervals. Closed points represent adjusted p-value < 0.05. All models were adjusted for infant age, sex, gestational age, birth weight, maternal household income, smoking during pregnancy, breastfeeding status, and sample processing time. hsCRP exposure model estimates and details for all NMR metabolomic measures are shown in Figure 4—source data 2.
Figure 4—figure supplement 2
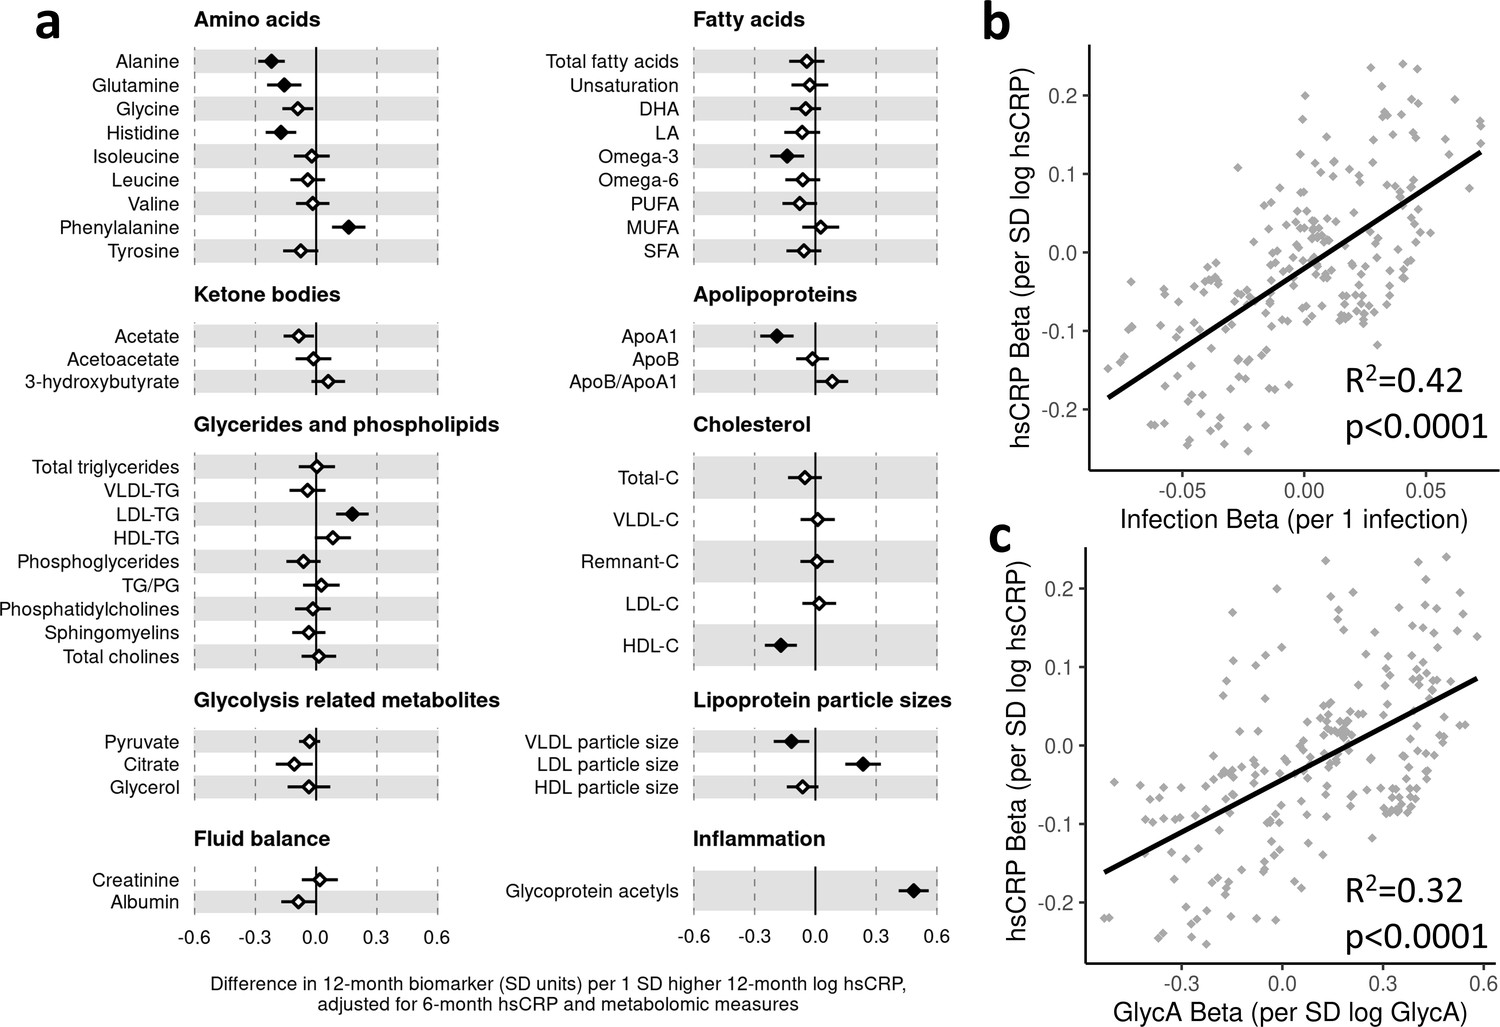
Difference in 12-month plasma nuclear magnetic resonance (NMR) metabolomic measures (adjusted for corresponding 6-month measure) per SD increase in 12-month log high-sensitivity C-reactive protein (hsCRP) (adjusted for 6-month hsCRP) (n = 500).
Forest plot for the estimated 12-month metabolomic differences (adjusted for corresponding 6-month metabolomic measure) for each additional SD log 12-month hsCRP (adjusted for 6-month hsCRP) (a, diamond points) from adjusted linear regression models, and the correlation of estimated metabolomic differences for infection and hsCRP (b) and for glycoprotein acetyls (GlycA) and hsCRP (c). Error bars are 95% confidence intervals. Closed points represent adjusted p-value < 0.05. All models were adjusted for infant age, sex, gestational age, birth weight, maternal household income, smoking during pregnancy, breastfeeding status, and sample processing time. hsCRP exposure model estimates and details for all NMR metabolomic measures are shown in Figure 4—source data 3.
Figure 5 with 3 supplements
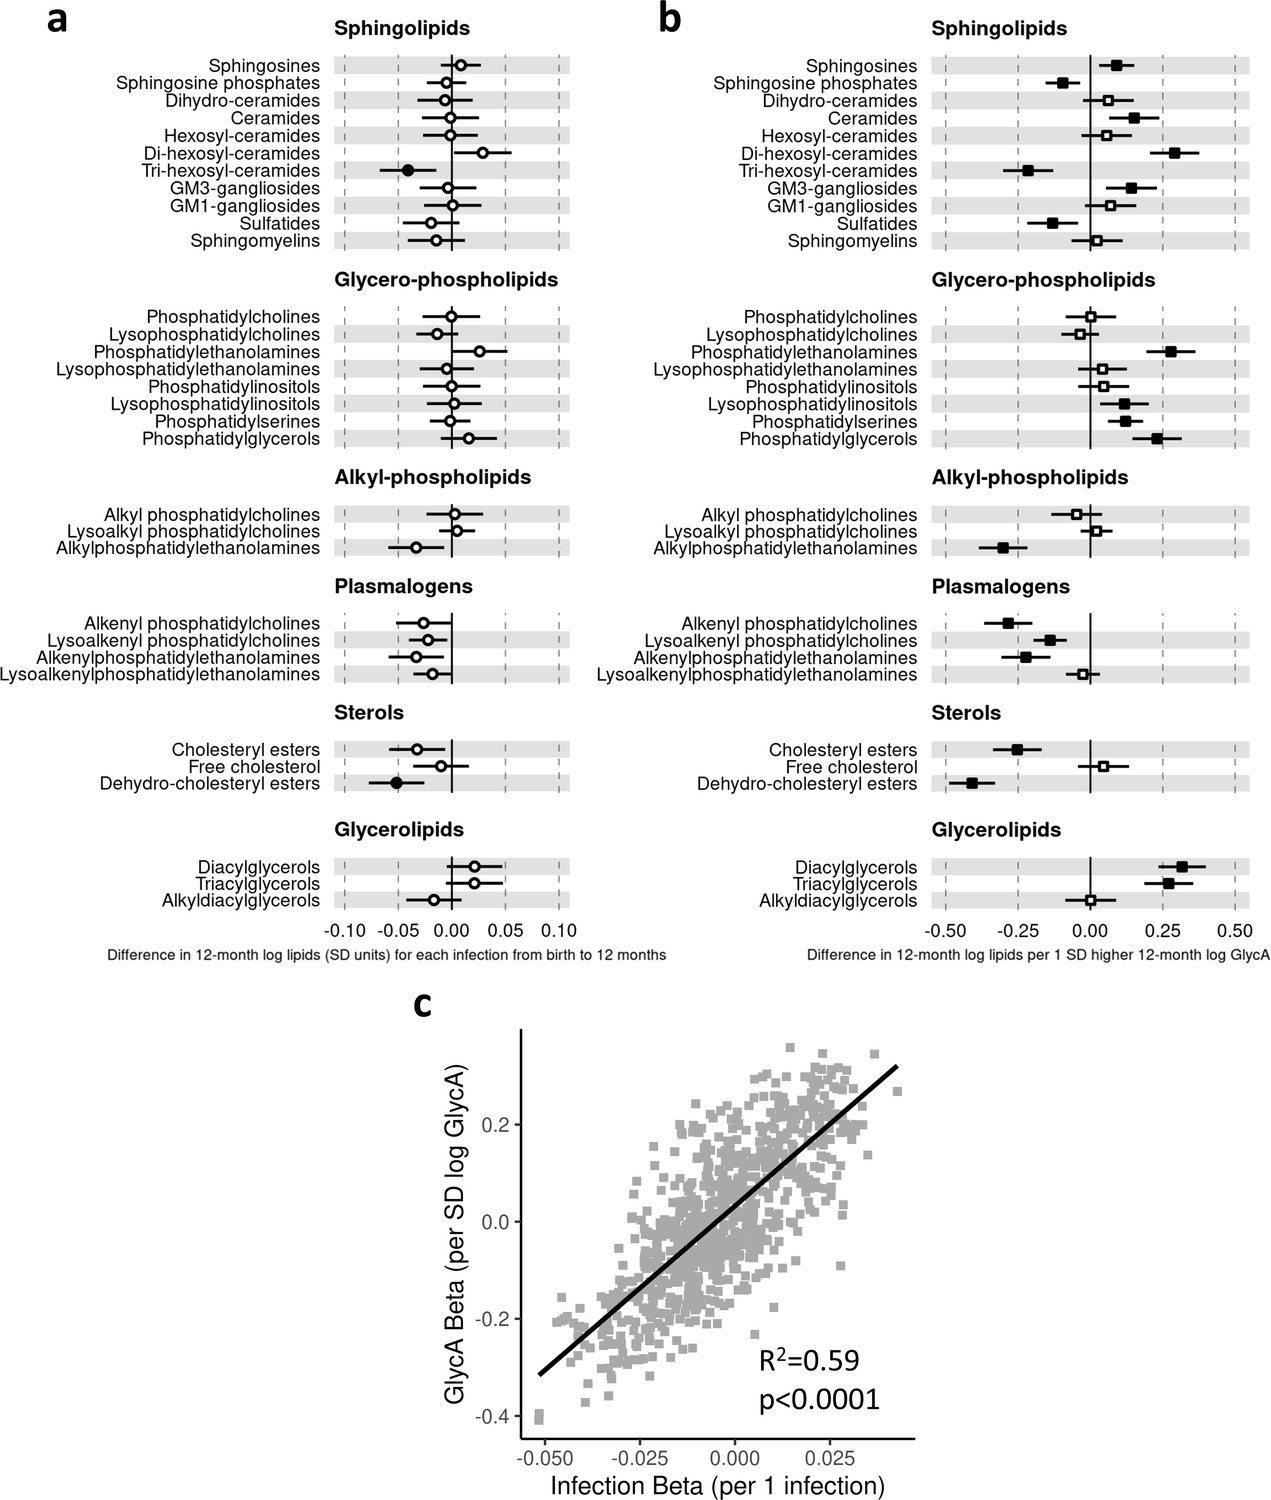
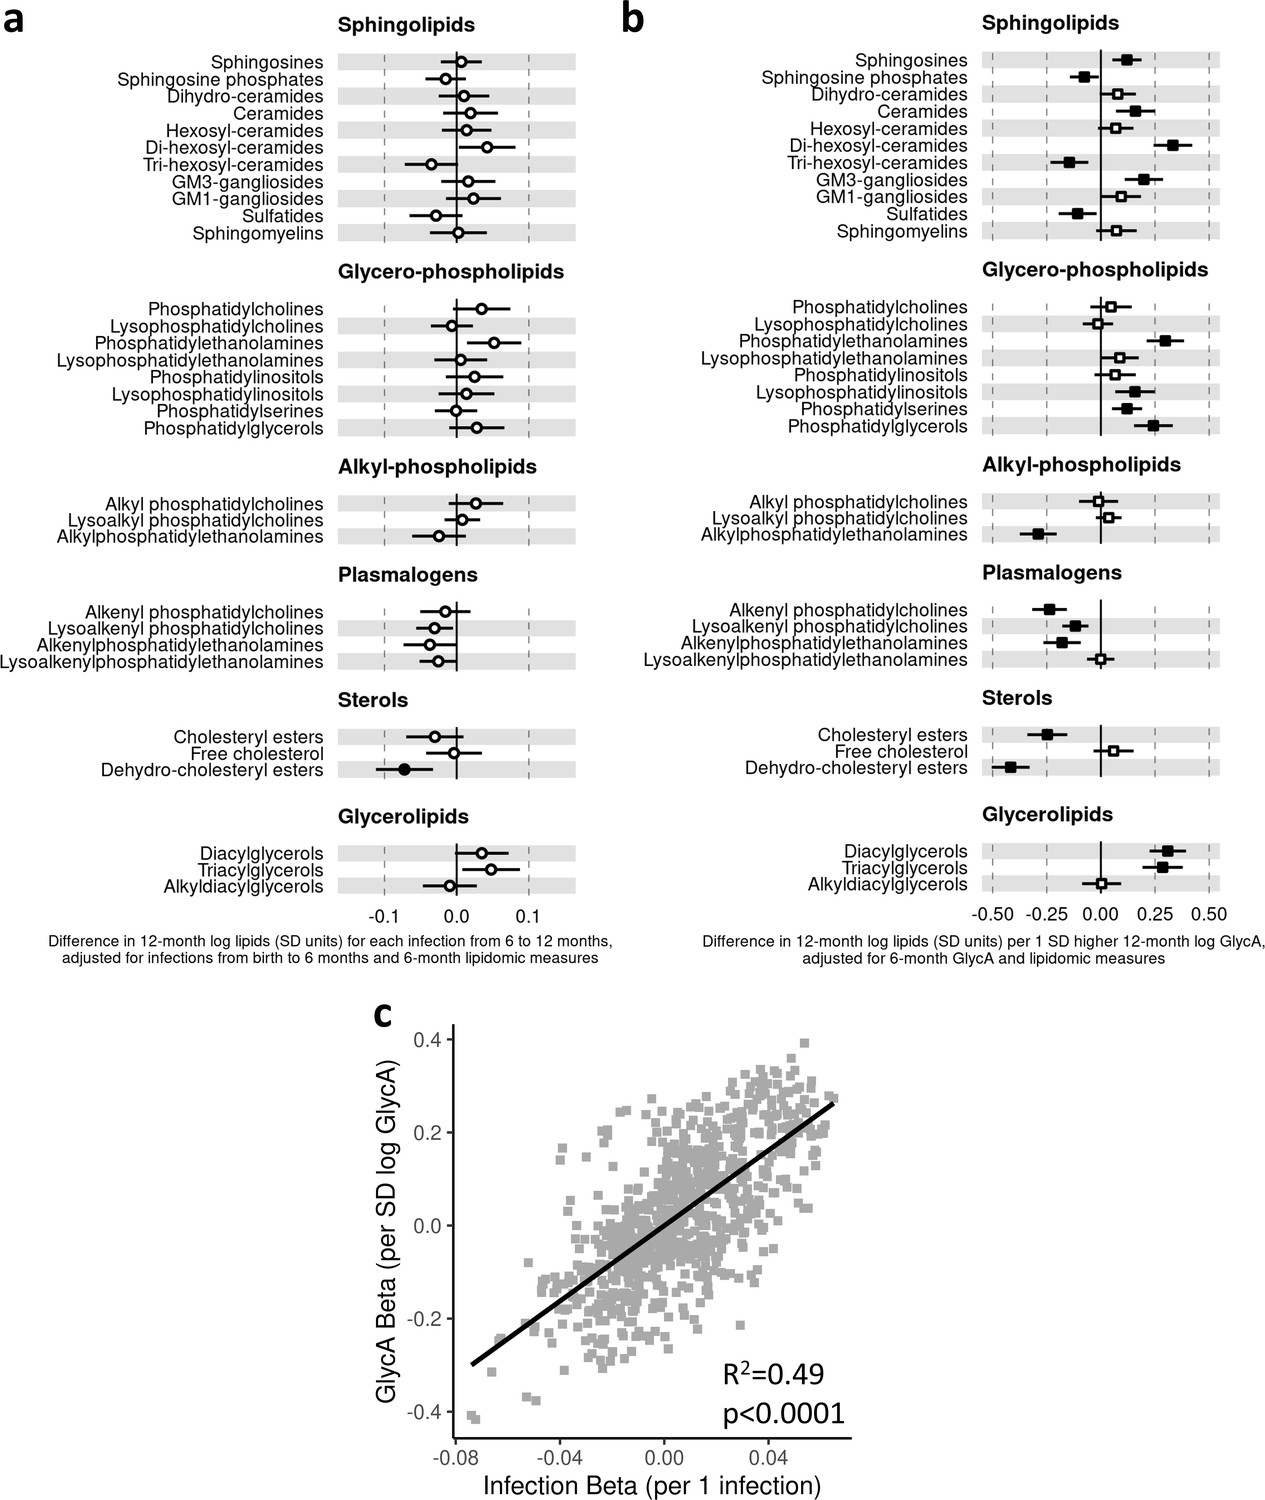
Difference in 12-month plasma liquid chromatography/mass spectrometry (LC/MS) lipidomic class totals for each increase in parent-reported infection (birth to 12 months) and for each SD increase in 12-month glycoprotein acetyls (GlycA) (n = 550).
Forest plots of the estimated 12-month lipidomic differences in class totals for each additional parent-reported infection from birth to 12 months (a, circle points) or SD log 12-month GlycA (b, square points) from adjusted linear regression models, and the correlation of estimated differences for these two exposures across all lipidomic measures (c). In (a) and (b), error bars are 95% confidence intervals. Closed points represent adjusted p-value < 0.05. All models were adjusted for infant age, sex, gestational age, birth weight, maternal household income, smoking during pregnancy, breastfeeding status, and sample processing time. Forest plots depicting individual lipid species within each group are shown in Figure 5—figure supplement 1. Infection and GlycA exposure model estimates and details for all LC/MS lipidomic measures are shown in Figure 5—source data 1.
-
Figure 5—source data 1
Summary of regression models for difference in 12-month liquid chromatography/mass spectrometry (LC/MS) lipidomic measures per 1 increase in parent-reported infection from birth to 12 months of age or per SD increase in 12-month log glycoprotein acetyls (GlycA).
- https://cdn.elifesciences.org/articles/75170/elife-75170-fig5-data1-v1.xlsx
-
Figure 5—source data 2
Summary of regression models for difference in 6-month liquid chromatography/mass spectrometry (LC/MS) lipidomic measures per 1 increase in parent-reported infection from birth to 6 months of age or per SD increase in 6-month log glycoprotein acetyls (GlycA).
- https://cdn.elifesciences.org/articles/75170/elife-75170-fig5-data2-v1.xlsx
-
Figure 5—source data 3
Summary of regression models for difference in 12-month liquid chromatography/mass spectrometry (LC/MS) lipidomic measures (adjusted for corresponding 6-month measure) per 1 increase in parent-reported infection from 6 to 12 months of age (adjusted for infections from birth to 6 months) or per SD increase in 12-month log glycoprotein acetyls (GlycA) (adjusted for 6-month GlycA).
- https://cdn.elifesciences.org/articles/75170/elife-75170-fig5-data3-v1.xlsx
Figure 5—figure supplement 1

Forest plots showing the difference in 12-month liquid chromatography/mass spectrometry (LC/MS) lipidomic classes and lipid species per 1 increase in parent-reported infection from birth to 12 months of age and per SD increase in 12-month log glycoprotein acetyls (GlycA) (n = 550).
Forest plots of the estimated 12-month lipidomic differences in lipid class totals (solid boxes) and individual lipid species (pale boxes) for each additional parent-reported infection from birth to 12 months (a) or SD log 12-month GlycA (b) from adjusted linear regression models. Closed points for class totals and blue points for lipid species represent adjusted p-value < 0.05. Error bars are 95% confidence intervals for class totals. All models were adjusted for infant age, sex, gestational age, birth weight, maternal household income, smoking during pregnancy, breastfeeding status, and sample processing time. Infection and GlycA exposure model estimates and details for all LC/MS lipidomic measures are shown in Figure 5—source data 1.
Figure 5—figure supplement 2
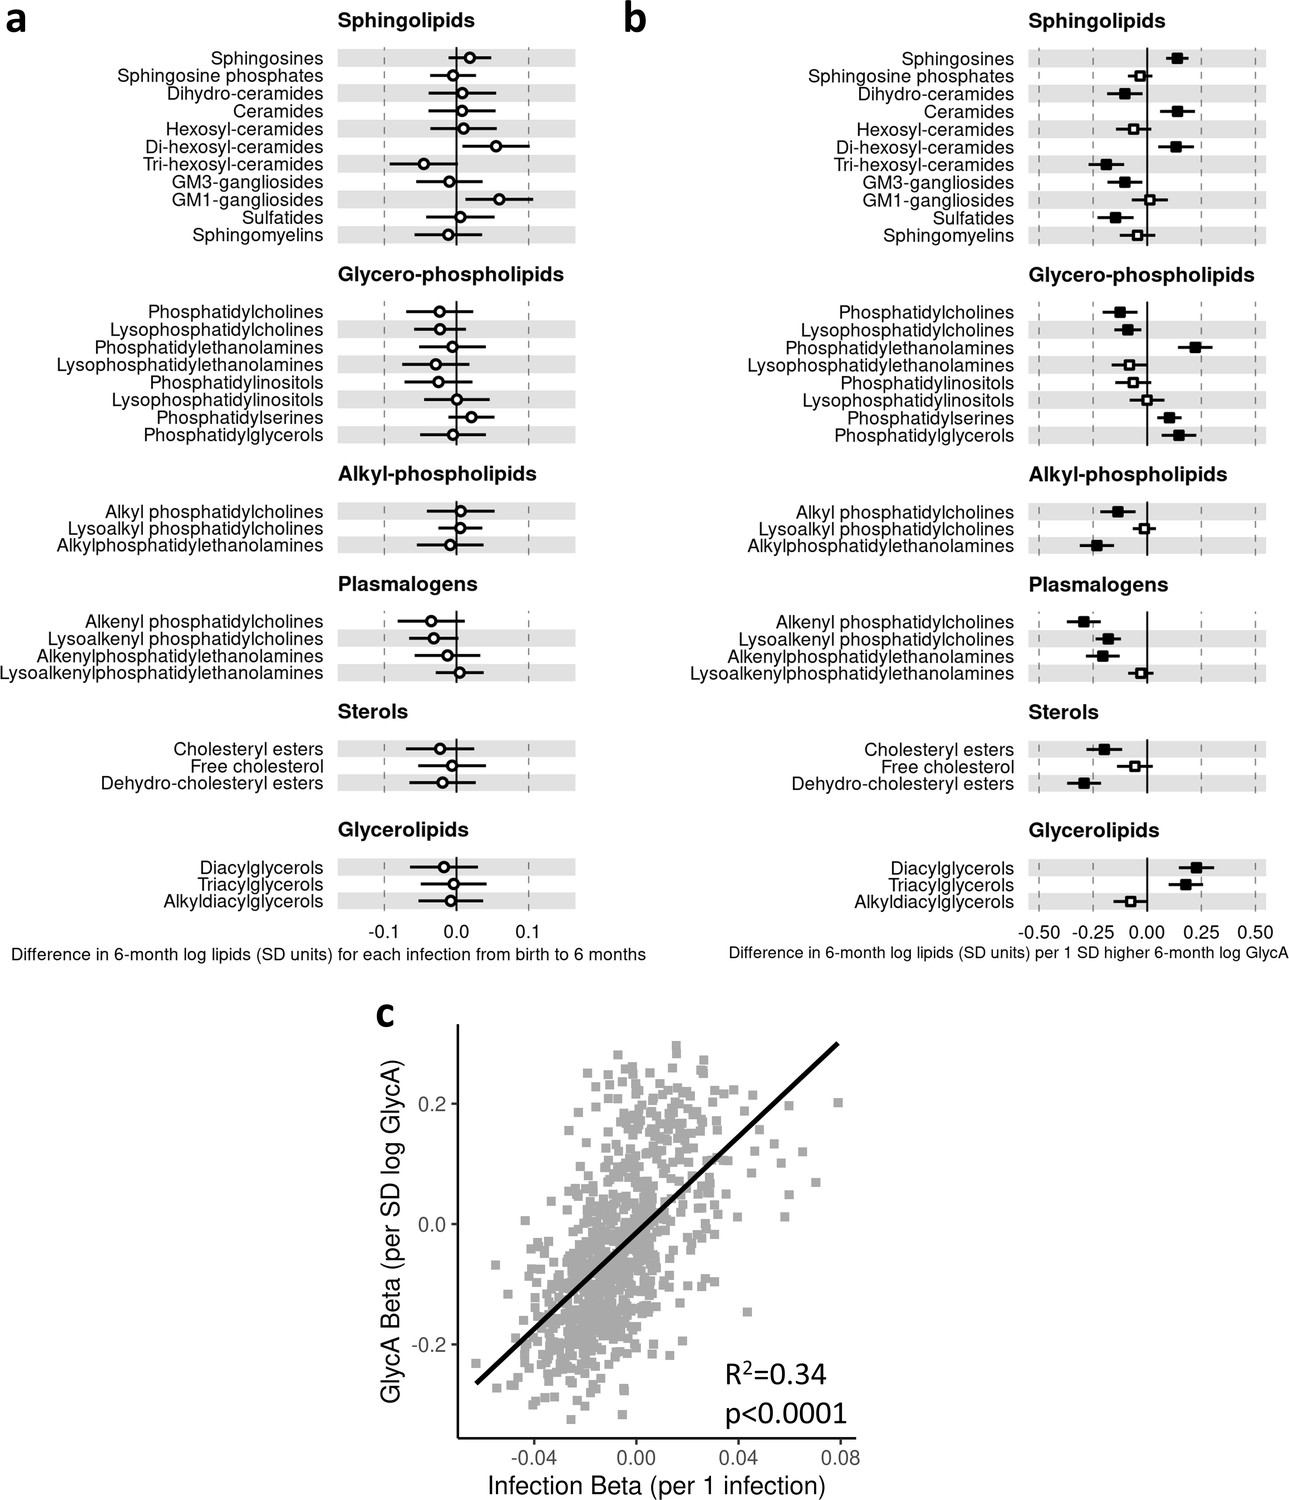
Difference in 6-month plasma liquid chromatography/mass spectrometry (LC/MS) lipidomic measures for each increase in parent-reported infection from birth to 6 months and for each SD increase in 6-month log glycoprotein acetyls (GlycA) (n = 501).
Forest plots of the estimated 6-month lipidomic differences in class totals for each additional parent-reported infection from birth to 6 months (a, circle points) or SD log 6-month GlycA (b, square points) from adjusted linear regression models, and the correlation of estimated differences for these two exposures across all lipidomic measures (c). In (a) and (b), error bars are 95% confidence intervals. Closed points represent adjusted p-value < 0.05. All models were adjusted for infant age, sex, gestational age, birth weight, maternal household income, smoking during pregnancy, breastfeeding status, and sample processing time. Infection and GlycA exposure model estimates and details for all LC/MS lipidomic measures are shown in Figure 5—source data 2.
Figure 5—figure supplement 3
Difference in 12-month plasma liquid chromatography/mass spectrometry (LC/MS) lipidomic measures (adjusted for corresponding 6-month measure) per 1 increase in parent-reported infection from 6 to 12 months of age (adjusted for infections from birth to 6 months) or per SD increase in 12-month log glycoprotein acetyls (GlycA) (adjusted for 6 month GlycA) (n = 496).
Forest plots of the estimated 12-month lipidomic differences in class totals for each additional parent-reported infection from 6 to 12 months (a, circle points) or SD log 12-month GlycA (b, square points) from adjusted linear regression models, adjusted for corresponding 6-month lipidomic measures. Infection models were adjusted for number of infections from birth to 6 months of age, and GlycA models were adjusted for 6-month GlycA. The correlation of estimated differences for these two exposures across all lipidomic measures (c). In (a) and (b), error bars are 95% confidence intervals. Closed points represent adjusted p-value < 0.05. All models were adjusted for infant age, sex, gestational age, birth weight, maternal household income, smoking during pregnancy, breastfeeding status, and sample processing time. Infection and GlycA exposure model estimates and details for all LC/MS lipidomic measures are shown in Figure 5—source data 3.
Figure 6 with 3 supplements
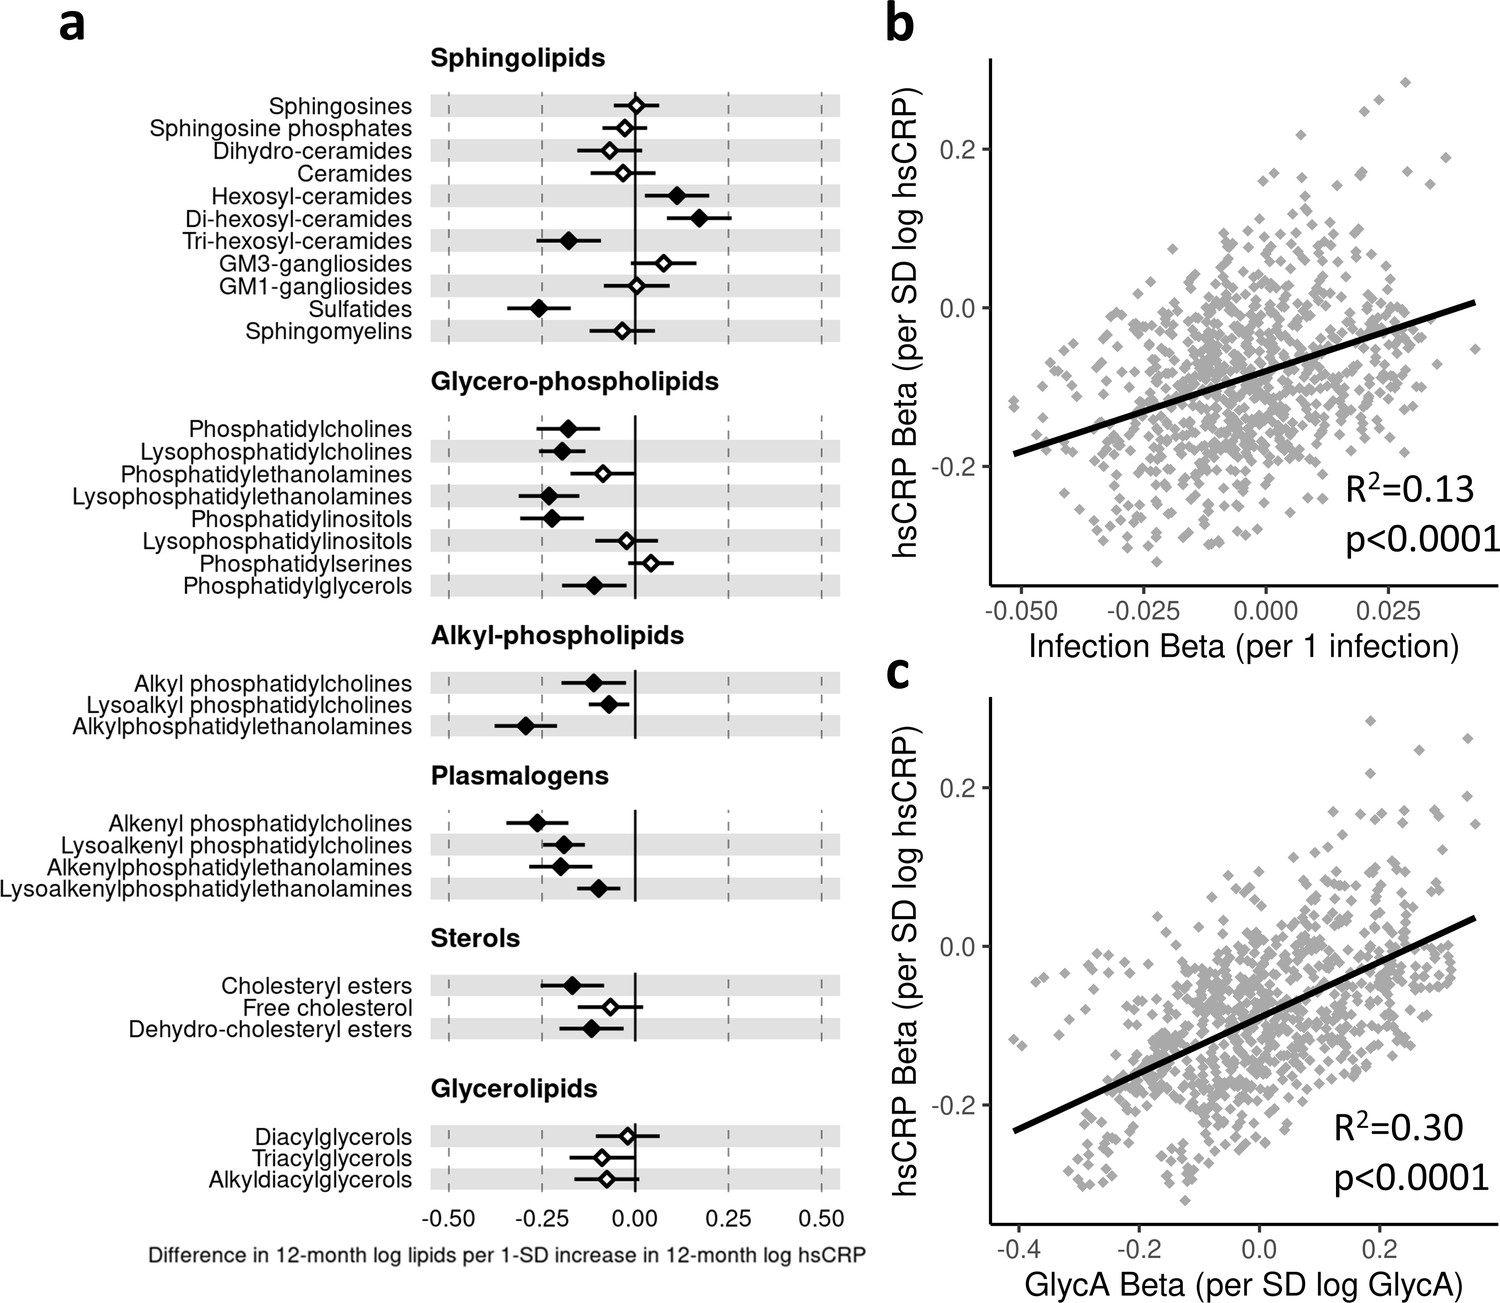
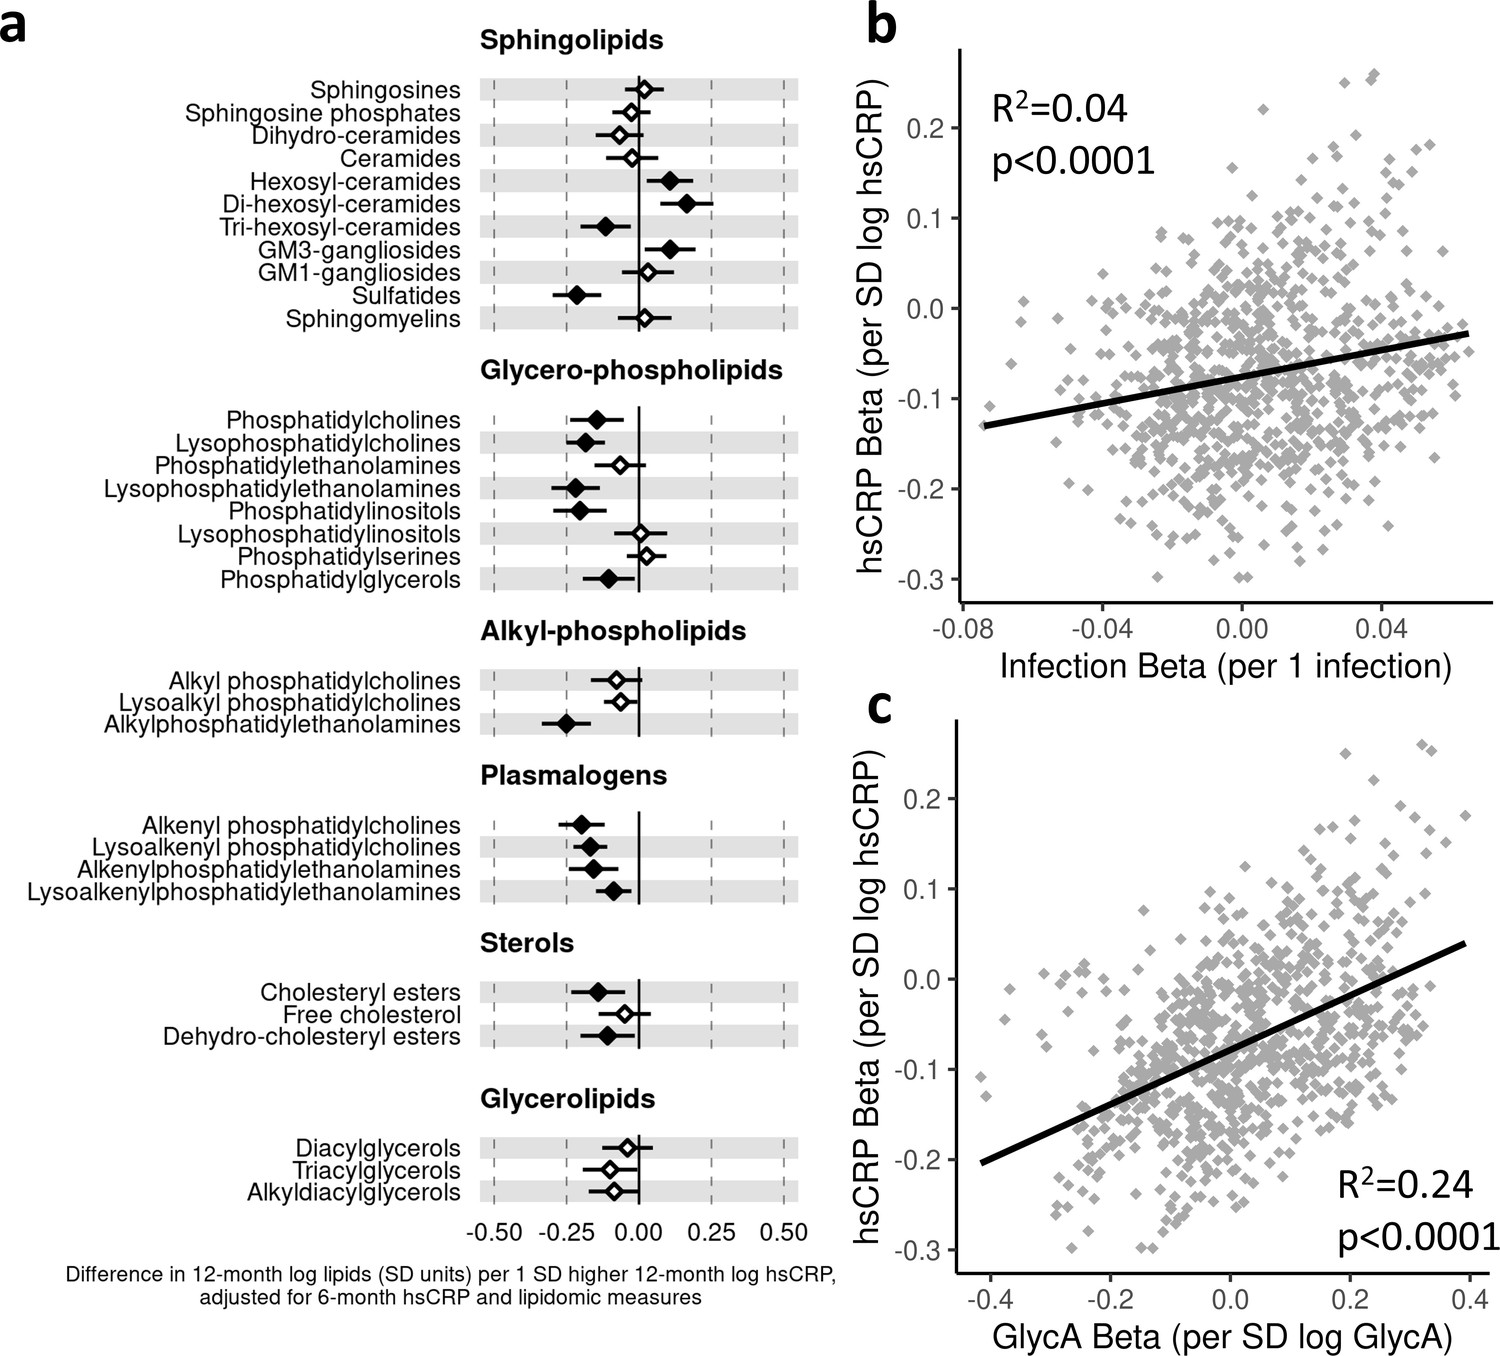
Difference in 12-month plasma liquid chromatography/mass spectrometry (LC/MS) lipidomic class totals for each SD increase in 12-month high-sensitivity C-reactive protein (hsCRP) (n = 550).
Forest plot for the estimated 12-month lipidomic differences for each additional SD log 12-month hsCRP (a, diamond points) from adjusted linear regression models, and the correlation of estimated differences across all lipidomic measures for infection and hsCRP (b) and glycoprotein acetyls (GlycA) and hsCRP (c). In (a), error bars are 95% confidence intervals. Closed points represent adjusted p-value < 0.05. All models were adjusted for infant age, sex, gestational age, birth weight, maternal household income, smoking during pregnancy, breastfeeding status, and sample processing time. Forest plots depicting individual lipid species within each group are shown in Figure 6—figure supplement 1. hsCRP exposure model estimates and details for all LC/MS lipidomic measures are shown in Figure 6—source data 1.
-
Figure 6—source data 1
Summary of regression models for difference in 12-month liquid chromatography/mass spectrometry (LC/MS) lipidomic measures per SD increase in 12-month log high-sensitivity C-reactive protein (hsCRP).
- https://cdn.elifesciences.org/articles/75170/elife-75170-fig6-data1-v1.xlsx
-
Figure 6—source data 2
Summary of regression models for difference in 6-month liquid chromatography/mass spectrometry (LC/MS) lipidomic measures per SD increase in 6-month log high-sensitivity C-reactive protein (hsCRP).
- https://cdn.elifesciences.org/articles/75170/elife-75170-fig6-data2-v1.xlsx
-
Figure 6—source data 3
Summary of regression models for difference in 12-month liquid chromatography/mass spectrometry (LC/MS) lipidomic measures (adjusted for corresponding 6-month measure) per SD increase in 12-month log high-sensitivity C-reactive protein (hsCRP) (adjusted for 6-month hsCRP).
- https://cdn.elifesciences.org/articles/75170/elife-75170-fig6-data3-v1.xlsx
Figure 6—figure supplement 1
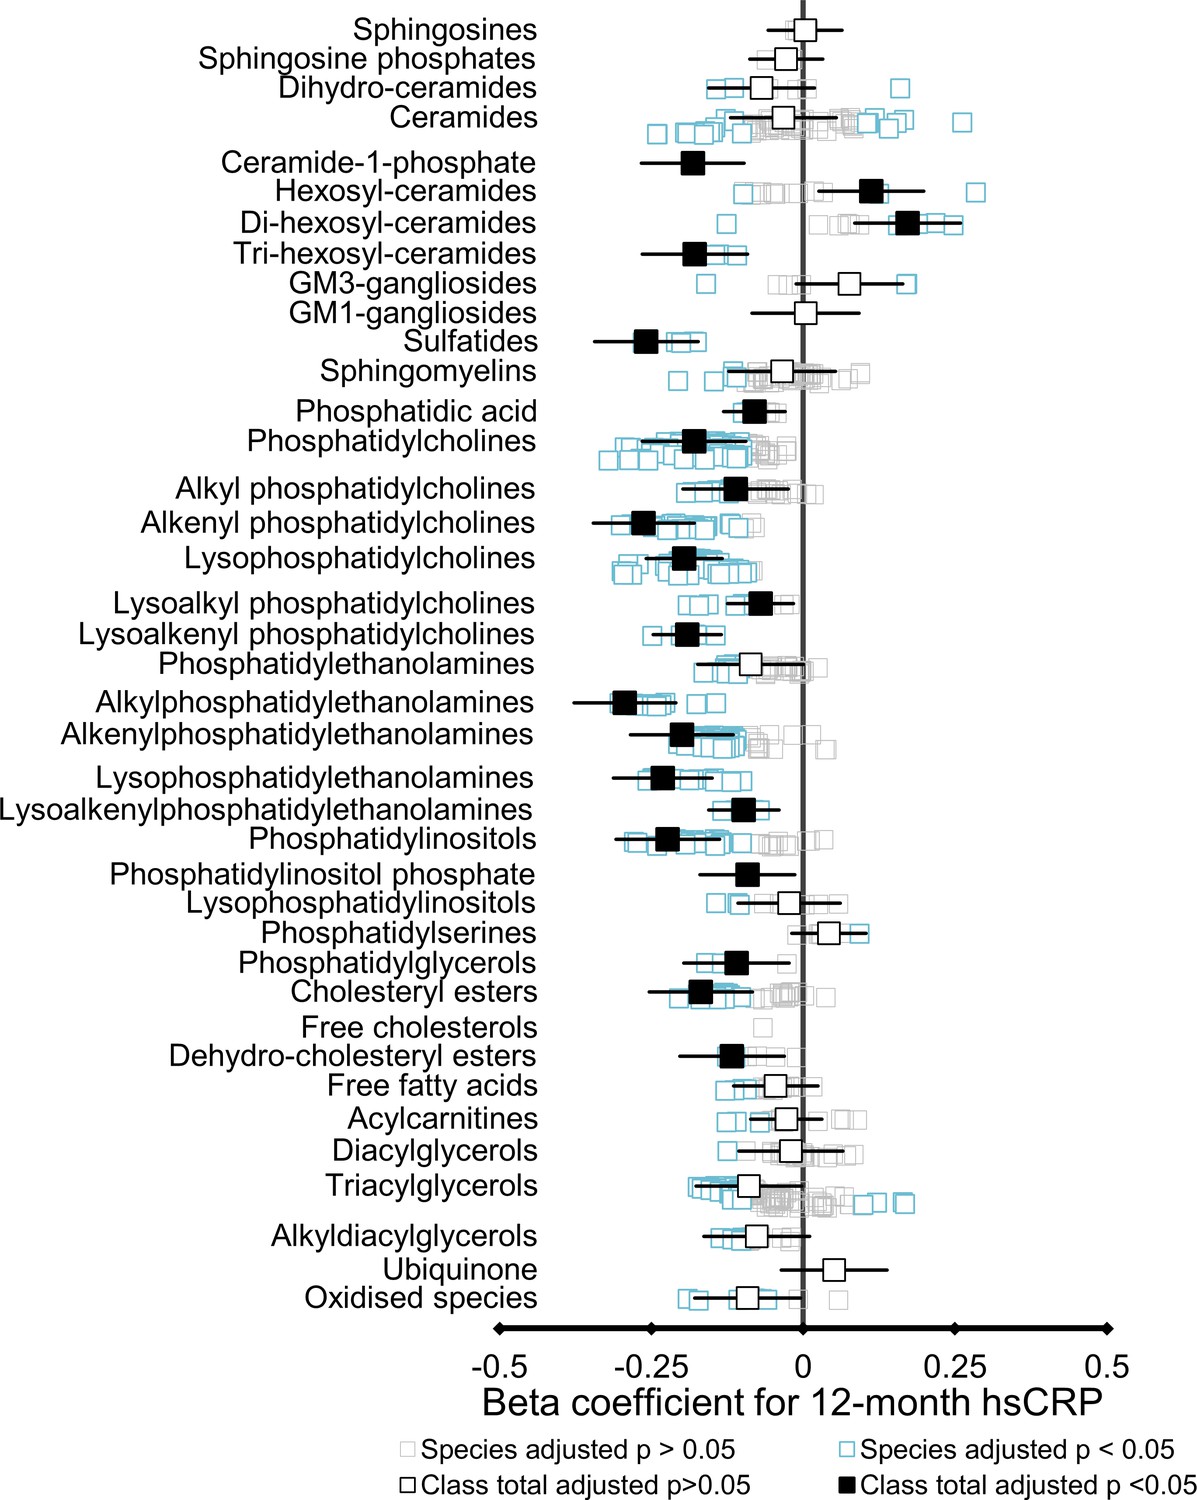
Forest plots showing the difference in 12-month liquid chromatography/mass spectrometry (LC/MS) lipidomic classes and lipid species per SD increase in 12-month log high-sensitivity C-reactive protein (hsCRP) (n = 550).
Forest plots of the estimated 12-month lipidomic differences in lipid class totals (solid boxes) and individual lipid species (pale boxes) for each SD log 12-month hsCRP from adjusted linear regression models. Closed points for class totals and blue points for lipid species represent adjusted p-value < 0.05. Error bars are 95% confidence intervals for class totals. All models were adjusted for infant age, sex, gestational age, birth weight, maternal household income, smoking during pregnancy, breastfeeding status, and sample processing time. hsCRP exposure model estimates and details for all LC/MS lipidomic measures are shown in Figure 6—source data 1.
Figure 6—figure supplement 2
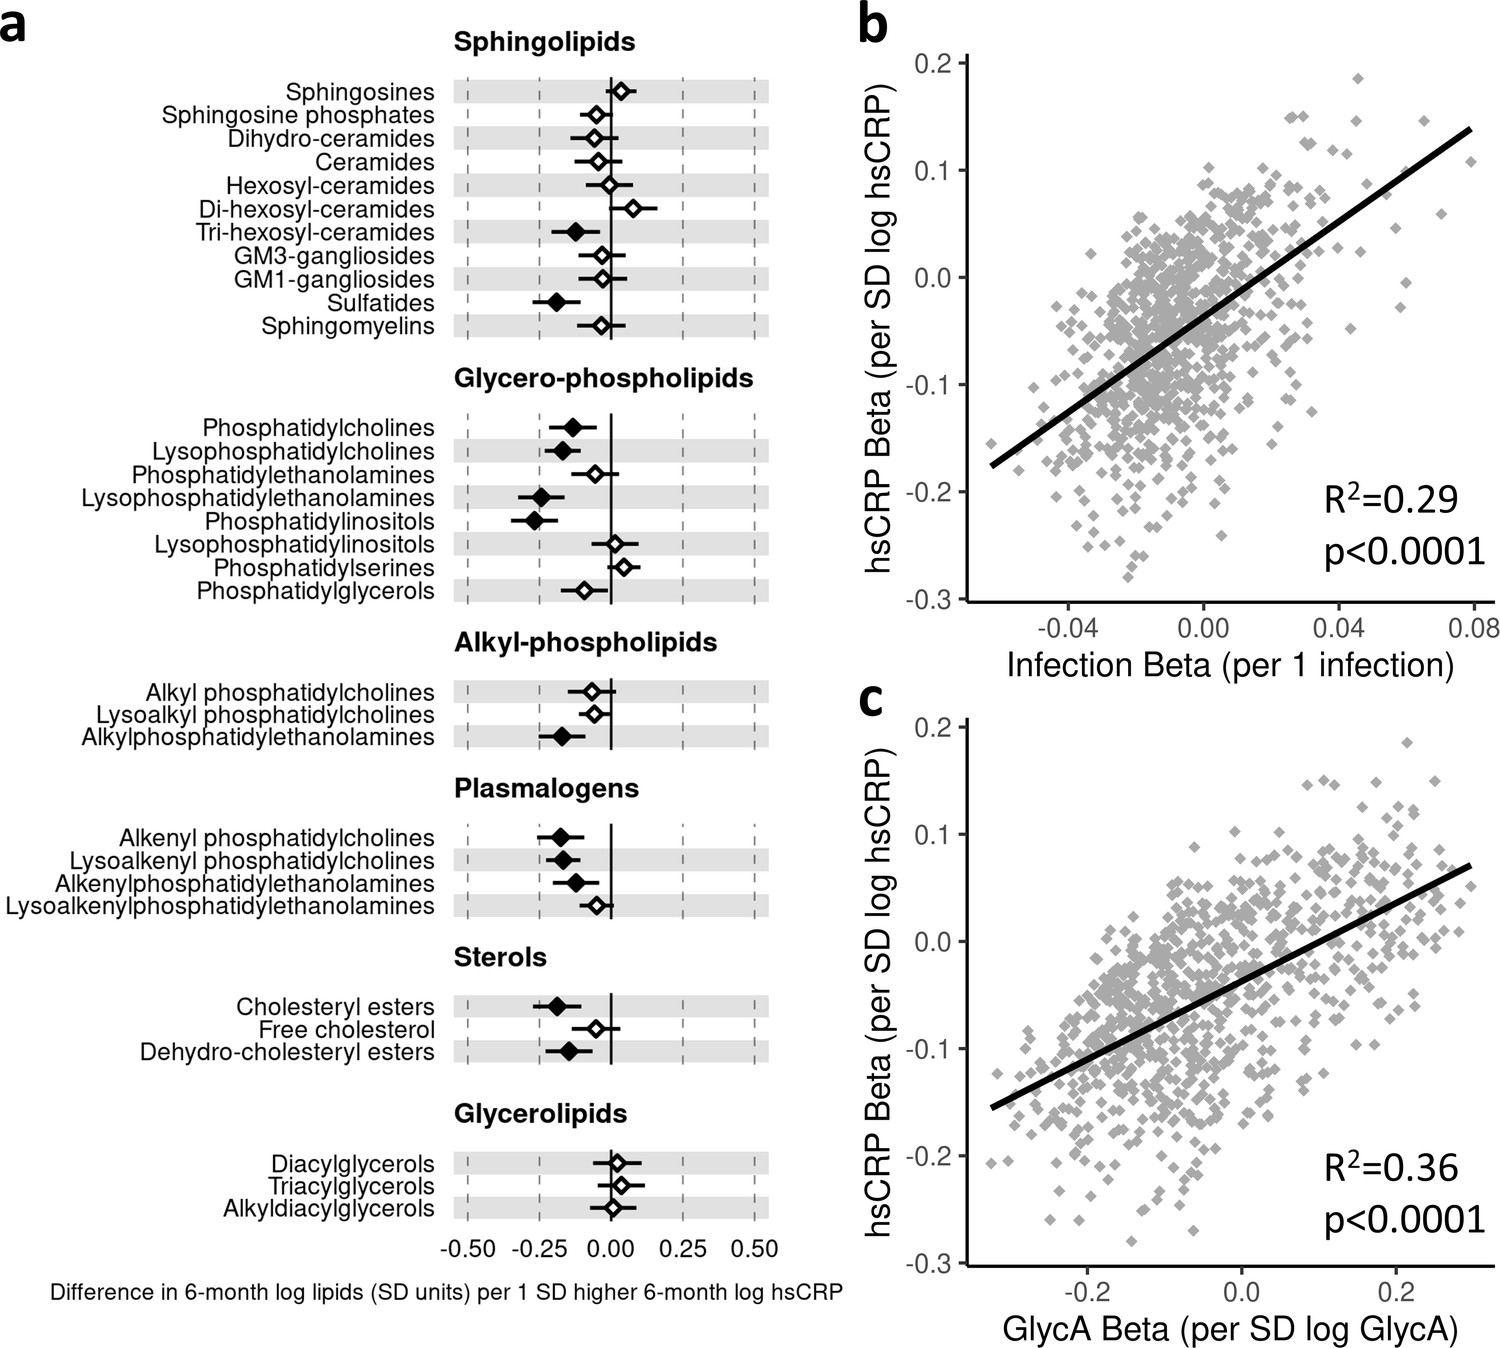
Difference in 6-month plasma liquid chromatography/mass spectrometry (LC/MS) lipidomic measures for each SD increase in 6-month log high-sensitivity C-reactive protein (hsCRP) (n = 501).
Forest plot for the estimated 6-month lipidomic differences for each additional SD log 6-month hsCRP (a, diamond points) from adjusted linear regression models, and the correlation of estimated differences across all lipidomic measures for infection and hsCRP (b) and glycoprotein acetyls (GlycA) and hsCRP (c). In (a), error bars are 95% confidence intervals. Closed points represent adjusted p-value < 0.05. All models were adjusted for infant age, sex, gestational age, birth weight, maternal household income, smoking during pregnancy, breastfeeding status, and sample processing time. hsCRP exposure model estimates and details for all LC/MS lipidomic measures are shown in Figure 6—source data 2.
Figure 6—figure supplement 3
Difference in 12-month plasma liquid chromatography/mass spectrometry (LC/MS) lipidomic measures (adjusted for corresponding 6-month measure) per SD increase in 12-month log high-sensitivity C-reactive protein (hsCRP) (adjusted for 6-month hsCRP) (n = 496).
Forest plot for the estimated 12-month lipidomic differences (adjusted for corresponding 6-month lipidomic measure) for each additional SD log 12-month hsCRP (adjusted for 6-month hsCRP) (a, diamond points) from adjusted linear regression models, and the correlation of estimated lipidomic differences for infection and hsCRP (b) and for glycoprotein acetyls (GlycA) and hsCRP (c). In (a), error bars are 95% confidence intervals. Closed points represent adjusted p-value < 0.05. All models were adjusted for infant age, sex, gestational age, birth weight, maternal household income, smoking during pregnancy, breastfeeding status, and sample processing time. hsCRP exposure model estimates and details for all LC/MS lipidomic measures are shown in Figure 6—source data 3.
Figure 7 with 1 supplement
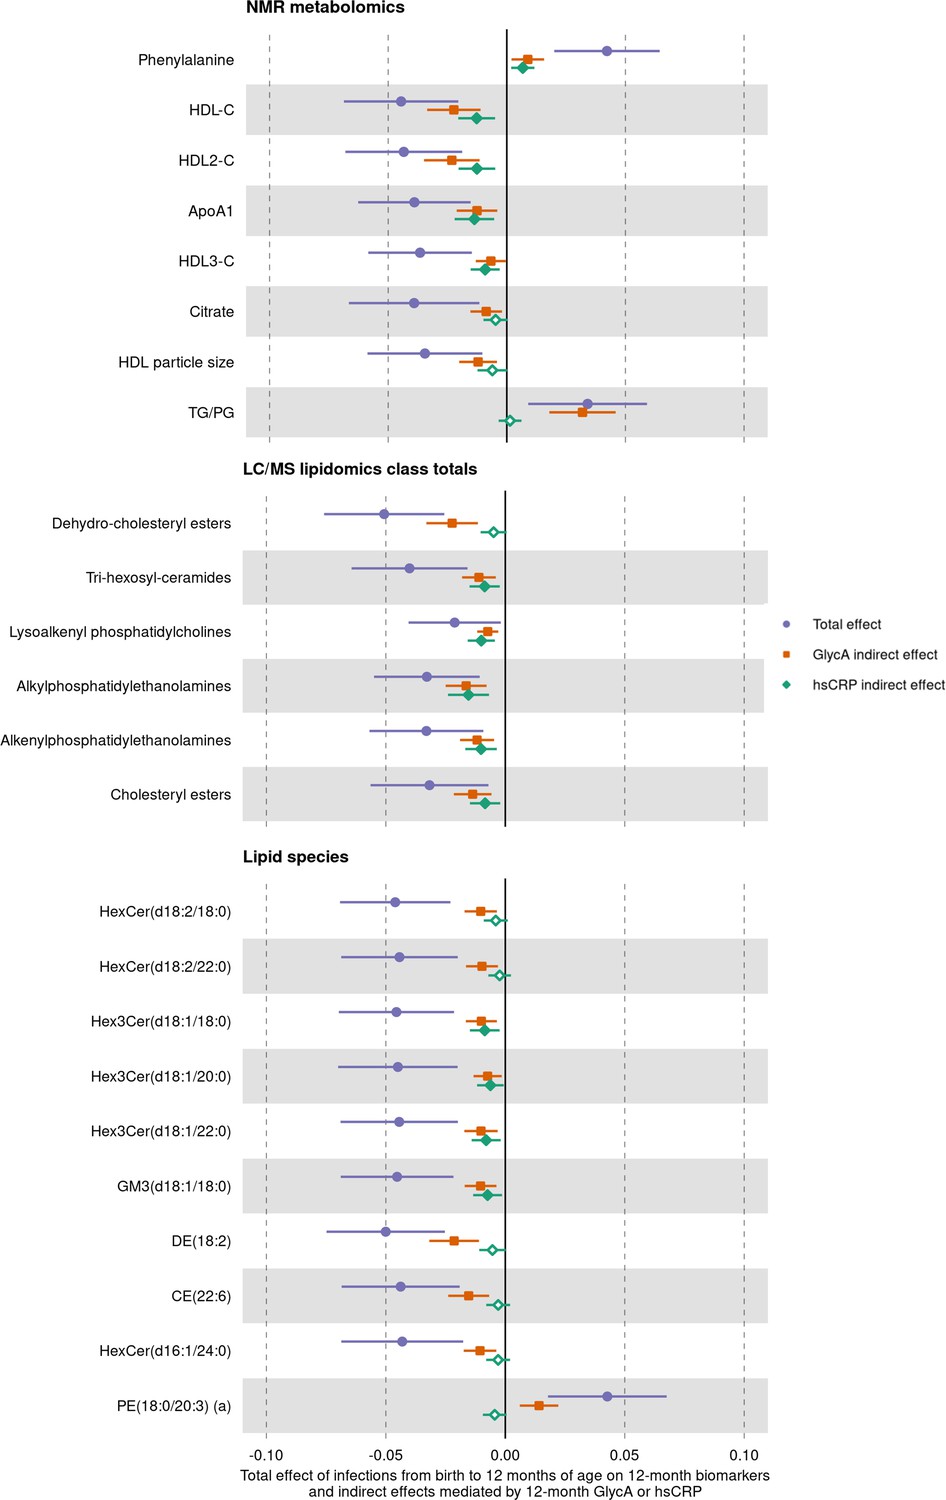
Total effect of infection on 12-month metabolomic and lipidomic measures (purple, circle points) and the estimated natural indirect effect component of these mediated by glycoprotein acetyls (GlycA) (orange, square points) or high-sensitivity C-reactive protein (hsCRP) (green, diamond points).
Units of change are 1 infection for parent-reported infections, and 1 SD change for GlycA, hsCRP, and metabolomic/lipidomic measures on log scale. Error bars are 95% confidence intervals. Closed points represent p-value < 0.05. All models were adjusted for infant age, sex, gestational age, birth weight, maternal household income, smoking during pregnancy, breastfeeding status, and sample processing time. Model details are in Figure 7—source data 1.
-
Figure 7—source data 1
Summary of mediation models for total, natural direct, and natural indirect effects (mediated by glycoprotein acetyls [GlycA] or high-sensitivity C-reactive protein [hsCRP]) of infection from birth to 12 months on 12-month metabolomic and lipidomic measures.
- https://cdn.elifesciences.org/articles/75170/elife-75170-fig7-data1-v1.xlsx
-
Figure 7—source data 2
Summary of mediation models for total, natural direct, and natural indirect effects (mediated by glycoprotein acetyls [GlycA] or high-sensitivity C-reactive protein [hsCRP]) of infection from 6 to 12 months on 12-month metabolomic and lipidomic measures, with adjustment for infections from birth to 6 months of age, 6-month inflammation, and the corresponding 6-month metabolomic/lipidomic measure.
- https://cdn.elifesciences.org/articles/75170/elife-75170-fig7-data2-v1.xlsx
Figure 7—figure supplement 1
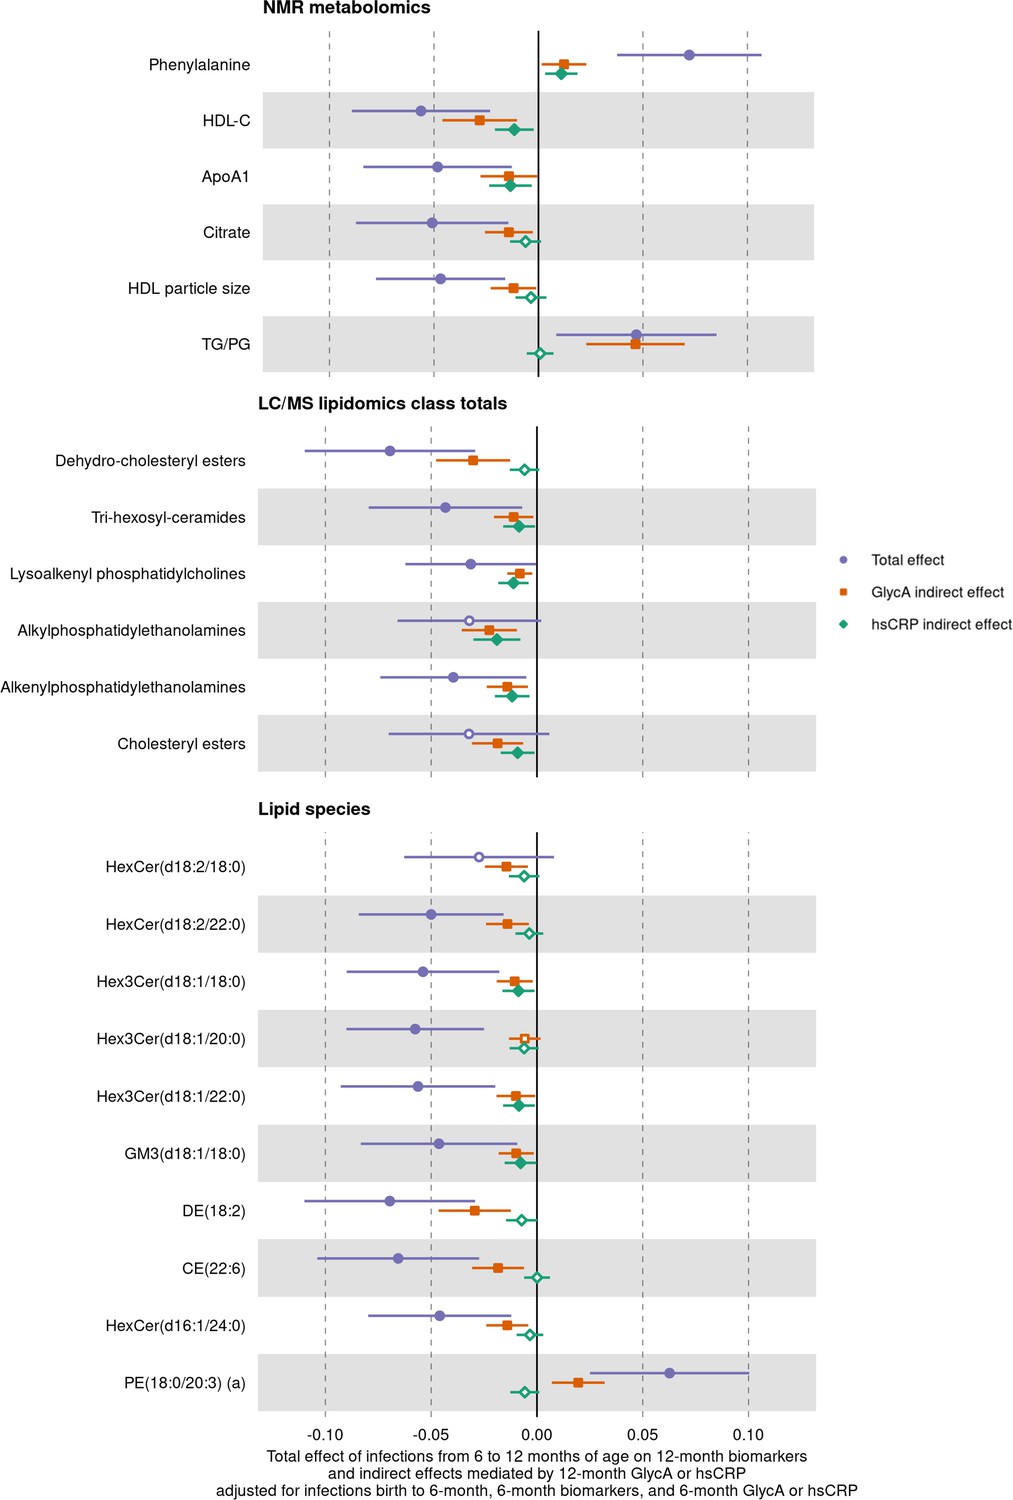
Total effect of infection from 6 to 12 months on 12-month metabolomic and lipidomic measures (purple, circle points) and the estimated natural indirect effect component of these mediated by 12-month glycoprotein acetyls (GlycA) (orange, square points) or high-sensitivity C-reactive protein (hsCRP) (green, diamond points), with adjustment for infections from birth to 6 months of age, 6-month inflammation, and the corresponding 6-month metabolomic/lipidomic measure.
Units of change are 1 infection for parent-reported infections, and 1 SD change for GlycA, hsCRP, and metabolomic/lipidomic measures on log scale. Error bars are 95% confidence intervals. Closed points represent p-value < 0.05. All models were adjusted for infant age, sex, gestational age, birth weight, maternal household income, smoking during pregnancy, breastfeeding status, and sample processing time. Model details are in Figure 7—source data 2.
Author response image 1
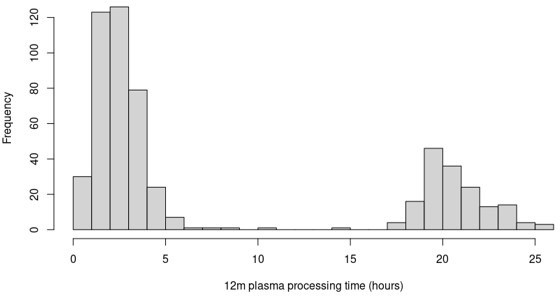
Distribution of 12-month plasma processing times for the participants in this study.
Tables
Table 1
Cohort characteristics (n = 555).
| Measure | |
|---|---|
| Sex (female) | 269 (48.4) |
| Mean (SD) | |
| Maternal age at delivery (years) | 31.7 (4.5) |
| n (%) | |
| Maternal smoking during pregnancy (any) | 69 (12.5) |
| Gestational diabetes (cases) (n = 84 missing data) | 26 (5.5) |
| Pre-eclampsia (cases) (n = 1 missing data) | 21 (3.8) |
| Maternal annual household income (AUD) | |
| <$25,000 | 11 (2.0) |
| $25,000 to $49,999 | 41 (7.5) |
| $50,000 to $74,999 | 94 (17.2) |
| $75,000 to $99,999 | 145 (26.5) |
| $100,000 to $149,999 | 191 (34.9) |
| ≥$150,000 | 65 (11.9) |
| Maternal education (highest level completed) (n = 8 missing data) | |
| Less than year 10 of high school | 2 (0.4) |
| Year 10 of high school or equivalent | 20 (3.7) |
| Year 12 of high school or equivalent | 86 (15.7) |
| Trade/certificate/diploma | 135 (24.9) |
| Bachelor’s degree | 199 (36.4) |
| Postgraduate degree | 105 (19.2) |
| Mode of birth | |
| Vaginal | 374 (67.4) |
| Planned caesarean section | 103 (18.6) |
| Unplanned caesarean section | 78 (14.1) |
| Breastfed (any breastfeeding) | 545 (98.2) |
| Infant postnatal smoke exposure to 12 months (any) (n = 47 missing data) | 14 (2.8) |
| Median [IQR] | |
| SEIFA index of disadvantage* | 1031 [996–1066] |
| Breastfeeding duration to 52 weeks (weeks) | 40 [16–52] |
| Mean (SD) | |
| Gestational age (weeks) | 39.5 (1.5) |
| Birth weight (g) | 3,538 (521) |
| Birth weight z-score | 0.32 (0.95) |
| Age at 6-month time point (months) | 6.5 (0.4) |
| Weight at 6 months (kg) | 7.9 (1.0) |
| Weight z-score at 6 months | 0.1 (1.0) |
| Age at 12-month time point (months) | 13.0 (0.8) |
| Weight at 12 months (kg) | 10.1 (1.3) |
| Weight z-score at 12 months | 0.4 (1.0) |
| Median [IQR] | |
| Number of parent-reported infections from birth to 12 months | 5 [3–8] |
| Infections from birth to 6 months | 2 [1–3] |
| Infection from 6 to 12 months | 3 [2–5] |
| GlycA at 6 months (mmol/L) | 0.76 [0.68–0.85] |
| hsCRP at 6 months (mg/L) | 0.14 [0.05–0.94] |
| GlycA at 12 months (mmol/L) | 1.30 [1.16–1.48] |
| hsCRP at 12 months (mg/L) | 0.25 [0.08–0.96] |
-
All n = 555 infants had complete covariate data for primary models, missing data of secondary exposures is indicated next to the relevant measure.
-
*
A lower SEIFA value indicates greater socioeconomic disadvantage based on postcode.
Additional files
-
Supplementary file 1
Sensitivity analyses.
(A) Forest plots summarising sensitivity analyses for models of parent-reported infections from birth to 12 months of age with 12-month nuclear magnetic resonance (NMR) metabolomic measures as outcome. (B) Forest plots summarising sensitivity analyses for models of 12-month glycoprotein acetyls (GlycA) with 12-month NMR metabolomic measures as outcome. (C) Forest plots summarising sensitivity analyses for models of 12-month high-sensitivity C-reactive protein (hsCRP) with 12-month NMR metabolomic measures as outcome. (D) Forest plots summarising sensitivity analyses for models of parent-reported infections from birth to 12 months of age with 12-month liquid chromatography/mass spectrometry (LC/MS) lipidomic measures as outcome. (E) Forest plots summarising sensitivity analyses for models of 12-month GlycA with 12-month LC/MS lipidomic measures as outcome. (F) Forest plots summarising sensitivity analyses for models of 12-month hsCRP with 12-month LC/MS lipidomic measures as outcome.
- https://cdn.elifesciences.org/articles/75170/elife-75170-supp1-v1.pdf
-
Supplementary file 2
Cohort distribution of nuclear magnetic resonance (NMR) metabolomic and liquid chromatography/mass spectrometry (LC/MS) lipidomic measures at 6 and 12 months.
(A) Distribution of NMR metabolomic measures in cohort. (B) Distribution of LC/MS lipidomic measures in cohort.
- https://cdn.elifesciences.org/articles/75170/elife-75170-supp2-v1.xlsx
-
Supplementary file 3
Forest plots of models investigating reverse causation: models with nuclear magnetic resonance (NMR) metabolomic and liquid chromatography/mass spectrometry (LC/MS) lipidomic measures at birth or 6 months as the exposures and number of parent-reported infections in the following 6 months as the outcome.
(A) Difference in log number of parent-reported infections from birth to 6 months of age for each SD increase in log serum NMR metabolomic measure at birth. (B) Difference in log number of parent-reported infections from 6 to 12 months of age for each SD increase in 6-month log plasma NMR metabolomic measure. (C) Difference in log number of parent-reported infections from birth to 6 months of age for each SD increase in log serum LC/MS lipidomic measure at birth. (D) Difference in log number of parent-reported infections from 6 to 12 months of age for each SD increase in 6-month log serum LC/MS lipidomic measure.
- https://cdn.elifesciences.org/articles/75170/elife-75170-supp3-v1.pdf
-
Transparent reporting form
- https://cdn.elifesciences.org/articles/75170/elife-75170-transrepform1-v1.docx
-
Source code 1
Code (R Script) for all analyses of nuclear magnetic resonance (NMR) metabolomics data in this study.
- https://cdn.elifesciences.org/articles/75170/elife-75170-code1-v1.zip
-
Source code 2
Code (R Script) for all analyses of liquid chromatography/mass spectrometry (LC/MS) lipidomics data in this study.
- https://cdn.elifesciences.org/articles/75170/elife-75170-code2-v1.zip
Download links
A two-part list of links to download the article, or parts of the article, in various formats.
Downloads (link to download the article as PDF)
Open citations (links to open the citations from this article in various online reference manager services)
Cite this article (links to download the citations from this article in formats compatible with various reference manager tools)
Early life infection and proinflammatory, atherogenic metabolomic and lipidomic profiles in infancy: a population-based cohort study
eLife 11:e75170.
https://doi.org/10.7554/eLife.75170


