Biophysical Kv3 channel alterations dampen excitability of cortical PV interneurons and contribute to network hyperexcitability in early Alzheimer’s
- Department of Cell Biology, Emory University, United States
- GDBBS Graduate Program, Laney Graduate School, Emory University, United States
- Department of Neurology, Emory University, United States
- Department of Biochemistry, Emory University, United States
- Stanley Center for Psychiatric Research, Broad Institute, United States
Figures
Figure 1 with 1 supplement
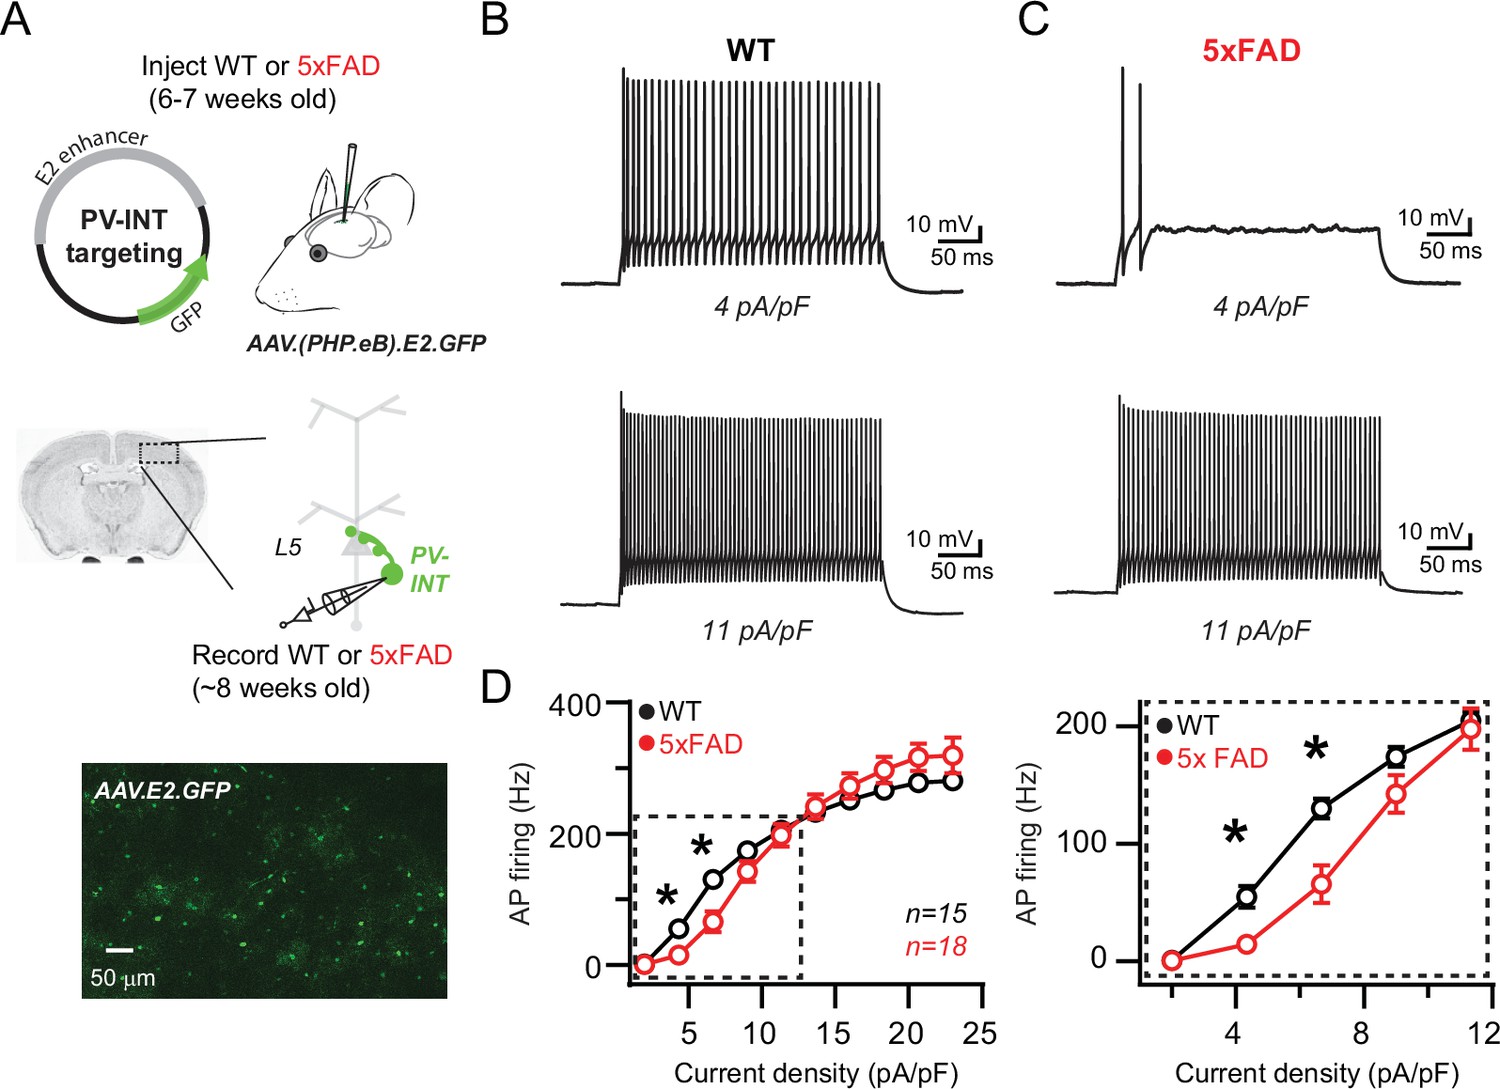
Reduced action potential (AP) firing frequency in parvalbumin (PV) interneurons of young 5xFAD mice.
(A) Graphical summary of AAV.E2.GFP stereotactic injection in somatosensory cortex and subsequent whole-cell current-clamp recordings from GFP+ PV interneurons (PV-INT). (B) AP firing elicited in wild-type (WT) mice by square pulse current injections of varying magnitude normalized to cellular capacitance during recordings. (C) AP firing elicited in 5xFAD mice at current density levels matched to WT mice for comparison. (D) Group data summary of AP firing frequency in WT and 5xFAD mice. Significance was defined by repeated-measures two-way ANOVA (p<0.05) with Sidak’s multiple-comparison test. For all summary graphs, data are expressed as mean (± SEM).
Figure 1—figure supplement 1
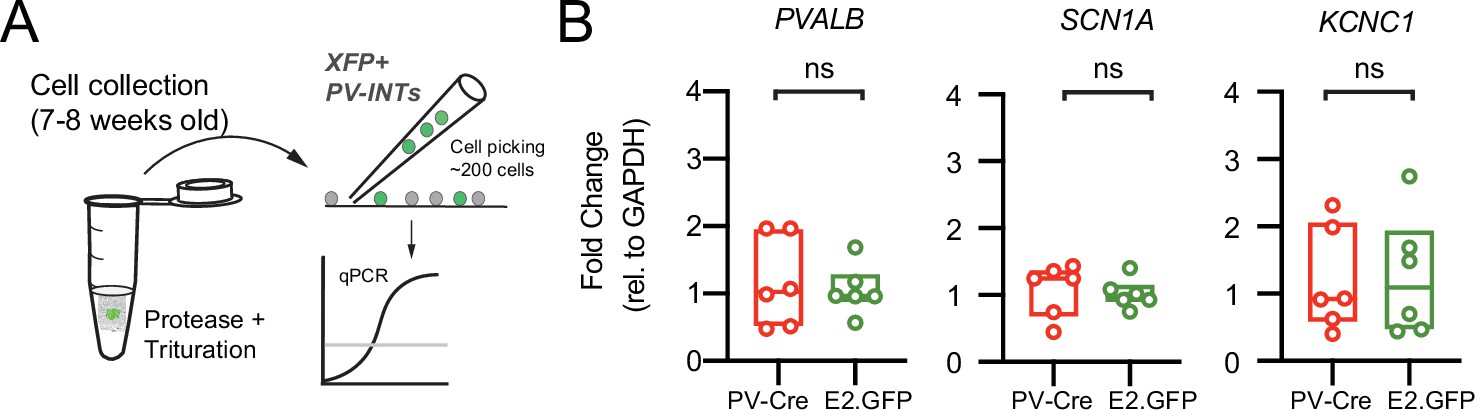
Confirmation of parvalbumin (PV) interneuron gene expression in AAV.E2.GFP+ neurons.
(A) Depiction of cell-type-specific qPCR following stereotactic AAV injection in 5–6-week-old mice. ~200 GFP+ neurons were physically isolated and hand-picked from the somatosensory cortex at 7–8 weeks of age. (B) PV-specific gene expression was compared in two mouse strains. One cohort of PV-Cre mice (n = 6) acting as the control group were injected with an AAV expressing a floxed tdTomato construct. A second test cohort (n = 6) of wild-type (WT) mice were injected with AAV.E2.GFP. Expression of three known cortical PV interneuron-specific genes (Pvalb, Scn1a, Kcnc1) was quantified for each cohort. There were no differences (p>0.05; unpaired t-tests) between the two groups for any of these genes. Individual data points and box plots are displayed.
Figure 2
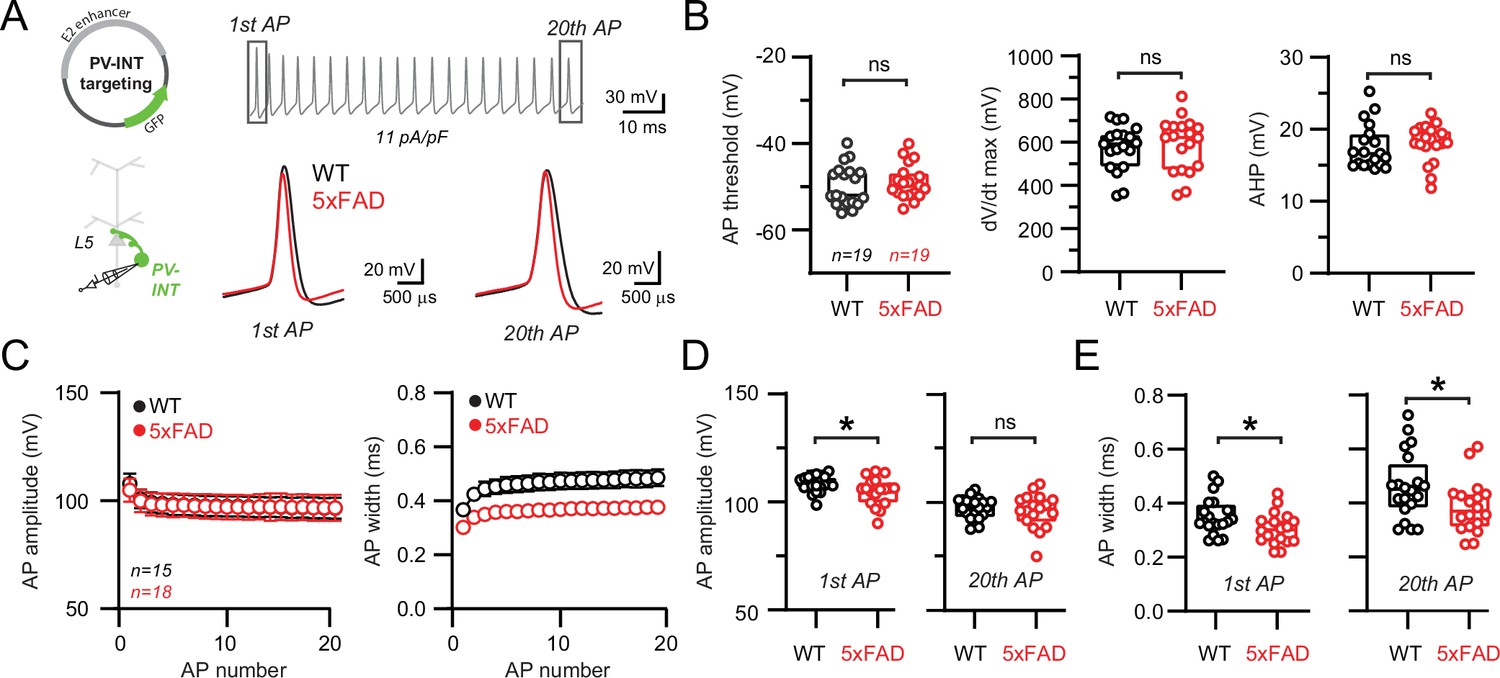
Altered action potential (AP) waveforms in parvalbumin (PV) interneurons of 5xFAD mice.
(A) AP waveforms and properties of GFP+ interneurons were compared at 11 pA/pF square pulse injections in wild-type (WT) and 5xFAD mice. In the enlarged view, APs from the 1st and 20th spike in the train of WT and 5xFAD mice are superimposed for comparison. (B) Summary data of AP properties. No differences in AP threshold, dV/dt maximum, or afterhyperpolarization (AHP) were observed (p>0.05; unpaired t-test). (C) Relationship between AP amplitude or width in WT and 5xFAD mice and AP # during spike trains elicited with 11 pA/pF current injection. Data are expressed as mean (± SEM). (D) Summary data of AP amplitude for the 1st and 20th APs in WT and 5xFAD mice. (E) Summary data of AP width for the 1st and 20th APs in WT and 5xFAD mice. For (B, D, E), individual data points and box plots are displayed. Significance is defined as p<0.05; unpaired t-tests.
Figure 3 with 1 supplement
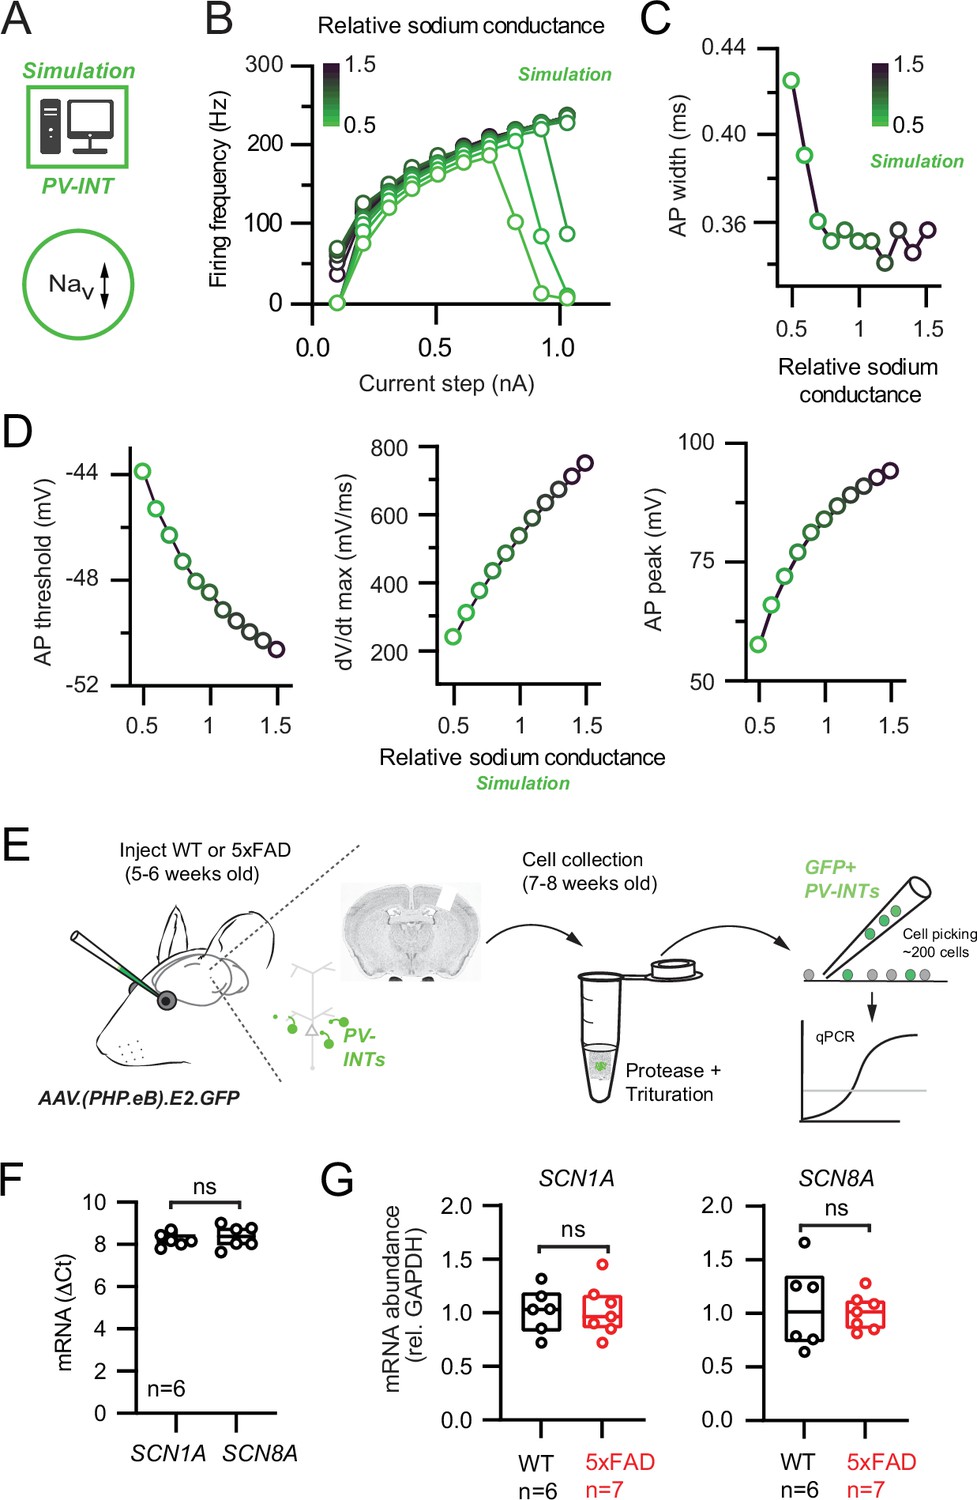
Nav channel changes do not explain changes in parvalbumin (PV) interneuron excitability in 5xFAD mice.
(A) Depiction of PV cell single-compartmental model with modified Nav channel properties. (B) Simulated relationship (S/cm2) between the magnitude of injected current and action potential (AP) firing frequency at variable Nav conductance densities. (C) Summary relationship of AP width and relative Nav conductance density (±50% from control Nav conductance). (D) Summary graphs depicting the effect of changing Nav conductance density on AP threshold, dV/dt maximum, and AP peak (±50% from control Nav conductance). (E) Depiction of cell-type-specific qPCR of Scn1 genes following retro-orbital AAV injection in 4–6-week-old mice. Individual neurons were physically isolated, hand-picked, and pooled after allowing 2–3 weeks for cortical expression. (F) Comparative qPCR expression of Scn1a and ScnN8a in wild-type (WT) mice. (G) Quantification of Scn1a and Scn8a mRNA expression between WT and 5xFAD mice. For (F) and (G), data are expressed as individual data points from each individual mouse with box plots superimposed.
Figure 3—figure supplement 1

Nav channel changes do not explain changes in parvalbumin (PV) interneuron excitability in 5xFAD mice.
(A) Depiction of PV cell single-compartmental model with modified Nav channel properties. The relationship of injected current magnitude and action potential (AP) firing frequency with varying Nav kinetics is summarized. All four kinetic properties (activation, deactivation, inactivation, and recovery from inactivation) were simultaneously scaled together (±50% of control) in the simulation. Near-threshold dampening of AP firing was observed with increased kinetics; however, this was accompanied by an overall reduction in AP firing rate at higher current injections. (B) Summary data showing the relationship of injected current magnitude and AP frequency following shifts in Nav activation voltage (±5 mV from the control). Near-threshold dampening of AP firing was achieved through a hyperpolarizing shift; however, this was accompanied by a reduction in firing across all current injections, which was not observed in recordings from 5xFAD mice. (C) Additional datasets depicting the effect of shifting Nav activation voltage on AP properties. Modifying activation voltage influenced all parameters, including dV/dt maximum and AP threshold, which were not affected in recordings from 5xFAD mice.
Figure 4 with 2 supplements
Modified Kv3 channel biophysics in 5xFAD mice.
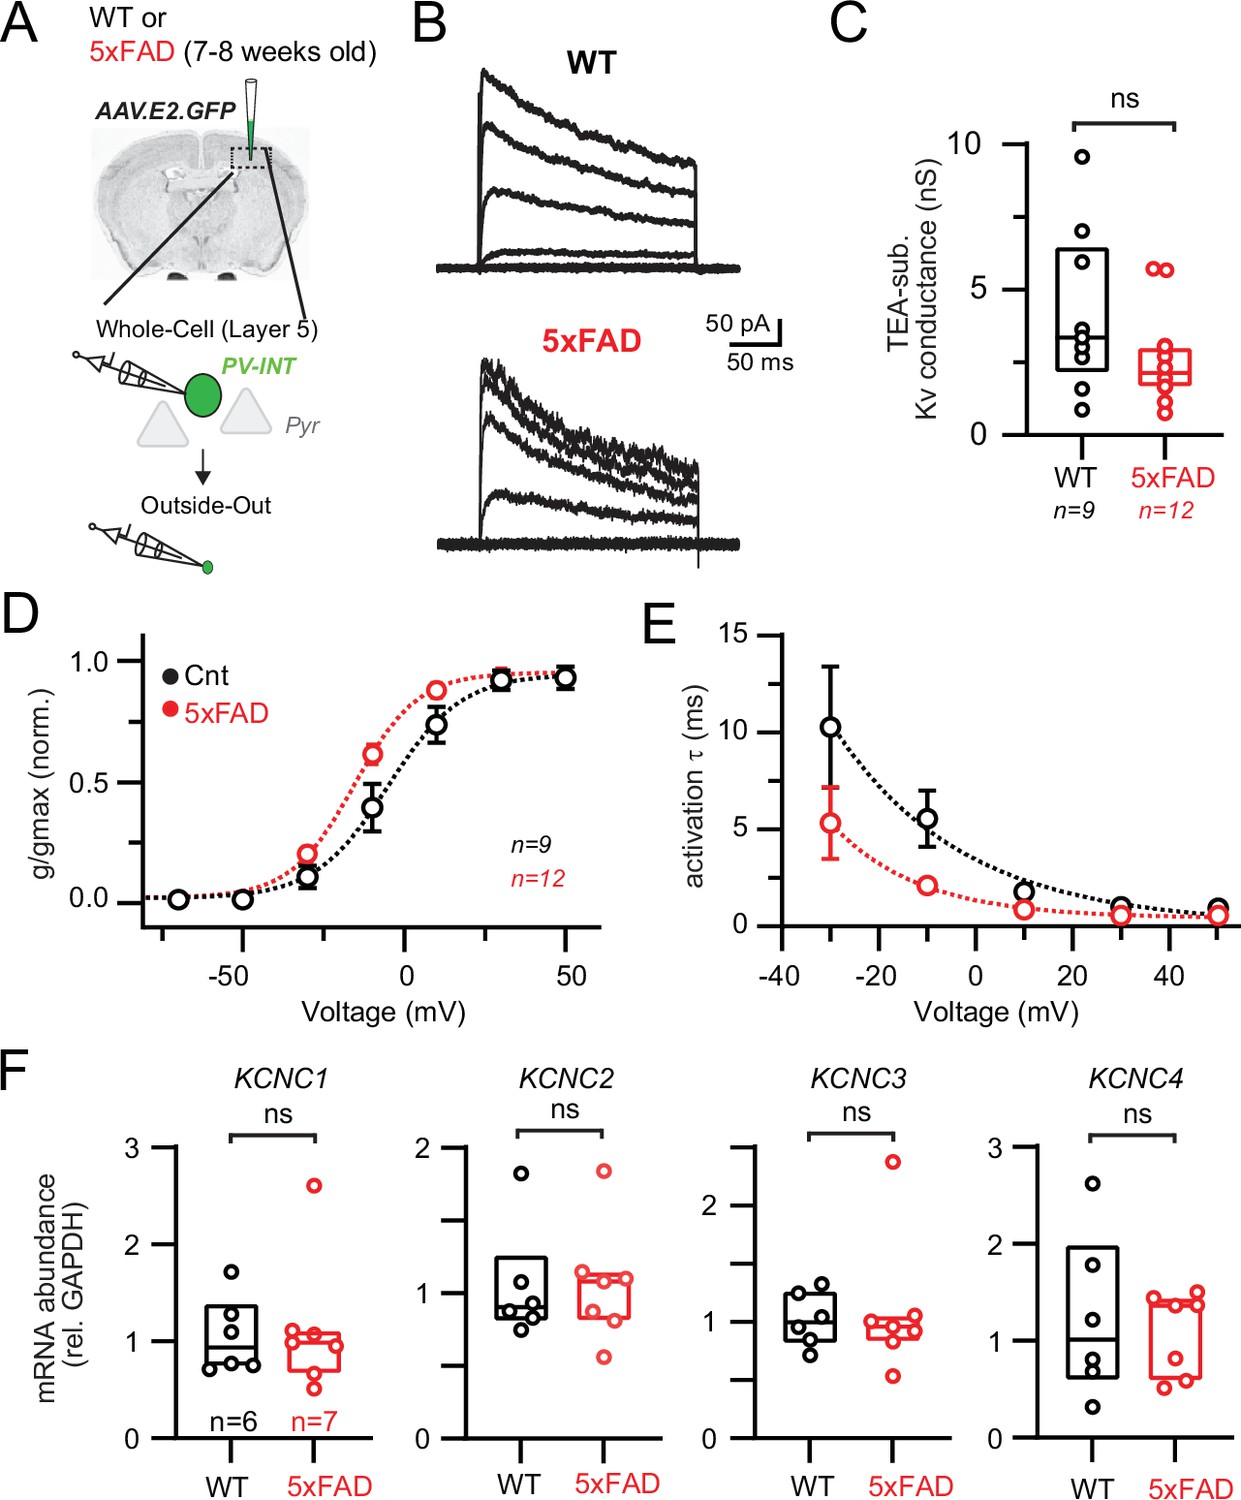
(A) Experimental workflow for obtaining outside-out patches from parvalbumin (PV) interneurons in wild-type (WT) and 5xFAD mice. (B) Representative Kv3 currents isolated from outside-out patches in WT and 5xFAD mice. Patches were held at –110 mV and then stepped from –90 to +50 mV using 300 ms, 20 mV steps. (C) Data summary of maximal Kv3 conductance in WT and 5xFAD mice (p>0.05; unpaired t-test). Individual data points from each patch and box and whisker plot summaries are displayed. (D) Summary of activation voltage of Kv3 conductance isolated from patches in WT and 5xFAD mice. Conductance was normalized to the maximal overall conductance (gmax) for each cell. The average dataset was fit with a Boltzmann function with individual values expressed as mean (± SEM). (E) Summary of activation time constant (τ) of Kv3 currents in isolated from patches in WT and 5xFAD mice. Datasets were fit with single monoexponential decay functions and are expressed as mean (± SEM). (F) Comparison summary of Kcnc1-4 mRNA expression between WT and 5xFAD mice from isolated and pooled PV interneurons. Individual data points from each mouse and box plot summaries are displayed. No differences were found between WT and 5xFAD cohorts for any of the four subunits (p>0.05; unpaired t-tests).
-
Figure 4—source data 1
Mass spectrometry of protein levels in 5xFAD mice.
- https://cdn.elifesciences.org/articles/75316/elife-75316-fig4-data1-v2.xlsx
Figure 4—figure supplement 1
Observed Kv3 inactivation properties and relationship to action potential (AP) firing in parvalbumin (PV) interneurons.
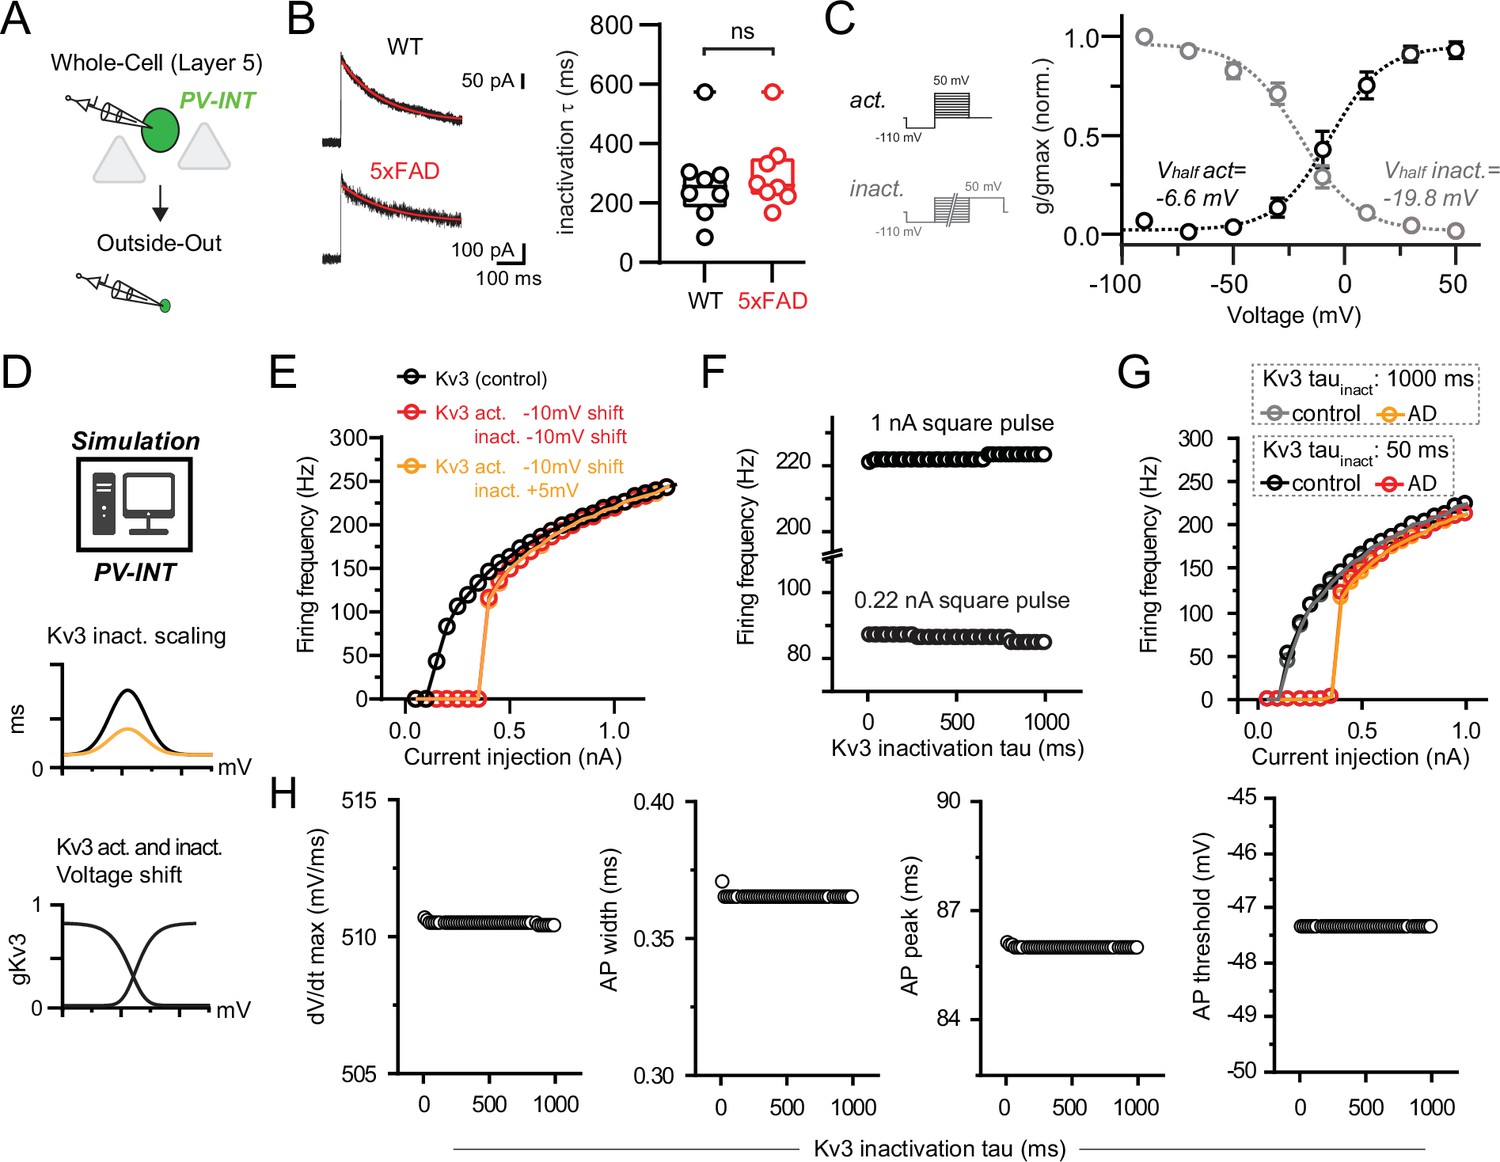
(A) Experimental workflow for obtaining outside-out patches from PV interneurons in wild-type (WT) and 5xFAD. (B) Representative tetraethylammonium (TEA)-sensitive currents (800 ms step; +50 mV holding) from outside-out patches in WT and 5xFAD mice. Steady-state inactivation time constants (τ) were determined by fitting traces with a single-exponential function (overlaid in red). Summary data of inactivation τshowed no difference between WT and 5xFAD (p>0.05; unpaired t-test; n = 8 for WT, n = 8 and 5xFAD). (C) Summary of inactivation voltages isolated from patches in WT mice (n = 8) overlaid with activation voltage data (from Figure 4). Conductances were normalized to the maximal overall conductance (gmax) for each cell. Datasets fit with Boltzmann functions with individual values expressed as mean (± SEM). (D) PV cell compartmental model depiction with WT and modified Kv3 channel voltage dependence and kinetics. (E) Summary data of firing frequency following concurrent shifts in Kv3 activation and inactivation voltage dependence. Near-threshold firing was reduced with hyperpolarized activation voltage (–10 mV relative shift) regardless of negative or positive shifts in inactivation voltage dependence. (F) Effect of modifying Kv3 channel inactivation kinetics alone on near-threshold (0.22 nA pulse) and saturating (1 nA pulse) firing rates. (G) Changes to AP firing frequency after simultaneously shifting Kv3 activation voltage dependence and inactivation kinetics. Hyperpolarizing the activation voltage (–10 mV relative shift) reduced near-threshold firing but not high-frequency firing regardless of inactivation kinetics (tau inactivation, 1000ms [orange trace] or 50 ms [red trace]). (H) Effect on changing Kv3 inactivation kinetics alone on simulated AP waveform parameters.
Figure 4—figure supplement 2
Mass spectrometry (Mass Spec) of protein levels at varying ages in 5xFAD mice.
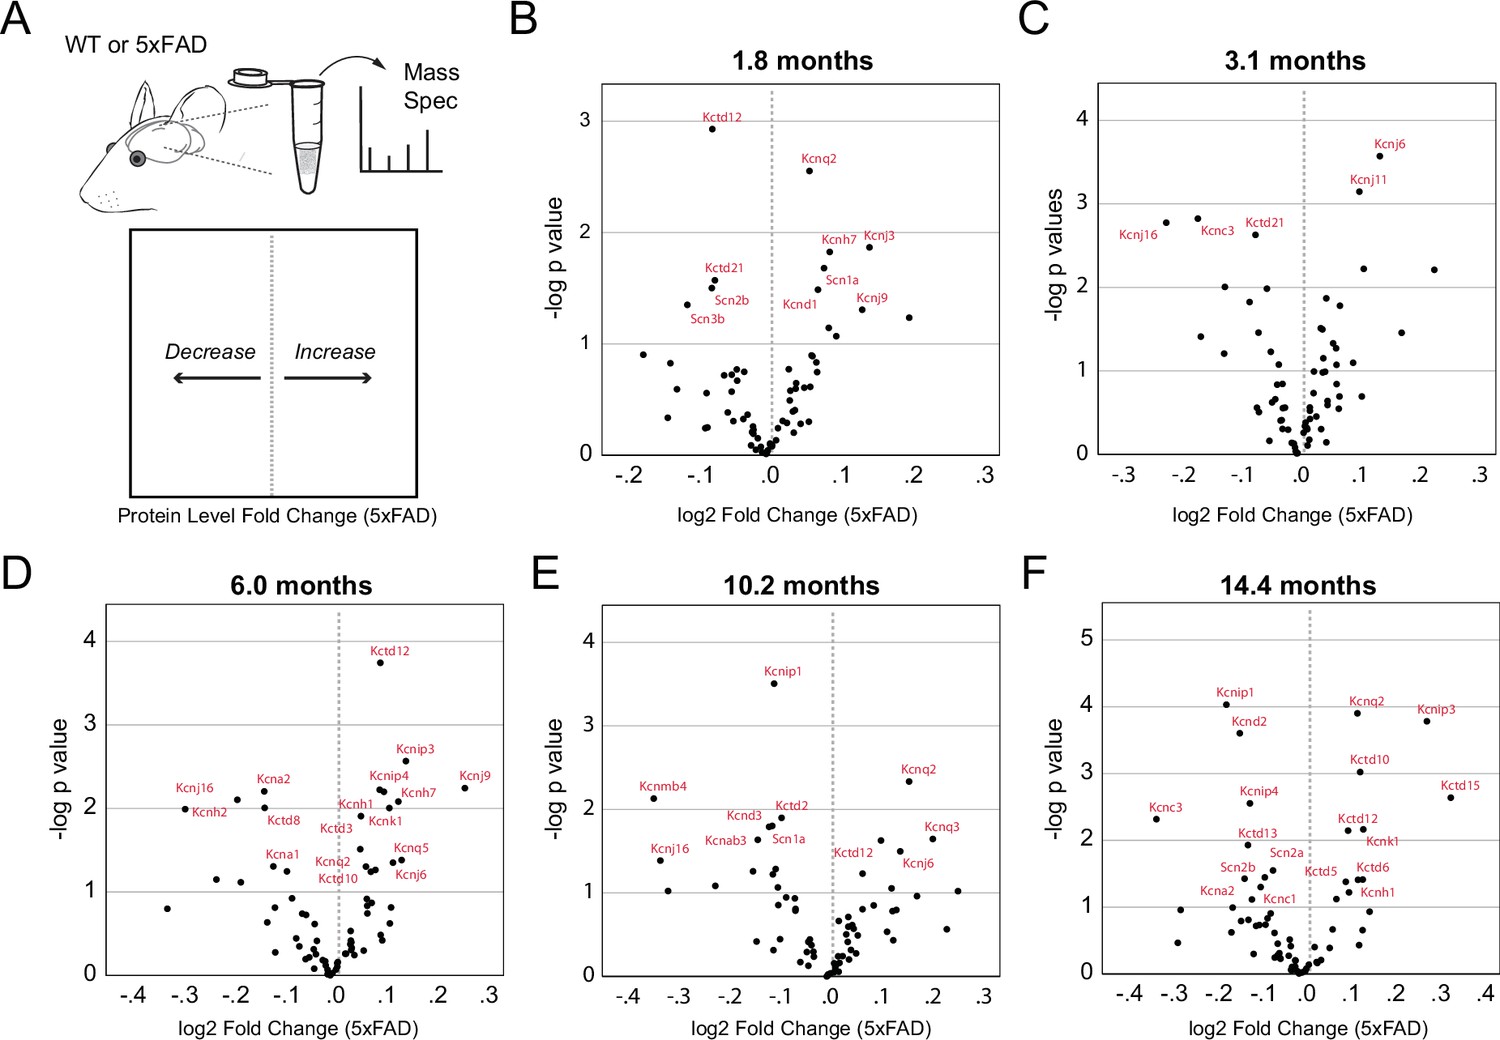
(A) Cartoon depiction of Mass Spec and data visualization. Rightward shifts indicate increases in protein levels while leftward shifts indicate decreases in protein levels in 5xFAD mice. (B–F) Differential expression analysis of K+ and Na+ channel proteins in 5xFAD mice. Volcano plots summarizing results from differential expression analysis of quantitativeMass Spec data from wild-type (WT) and 5xFAD mice (age range 1.8–14.4 months, n=4–6 mice per age group with 50% males/females). Proteins demonstrating statistically significant changes at each age (unadjusted p<0.05) are labeled in red. Y axis: -log 10 unadjusted p-value (T test). X axis: log2 transformed fold change (5xFAD vs. WT).
Figure 5 with 1 supplement
Effect of biophysical Kv3 dysregulation on action potential (AP) firing in a parvalbumin (PV) model.
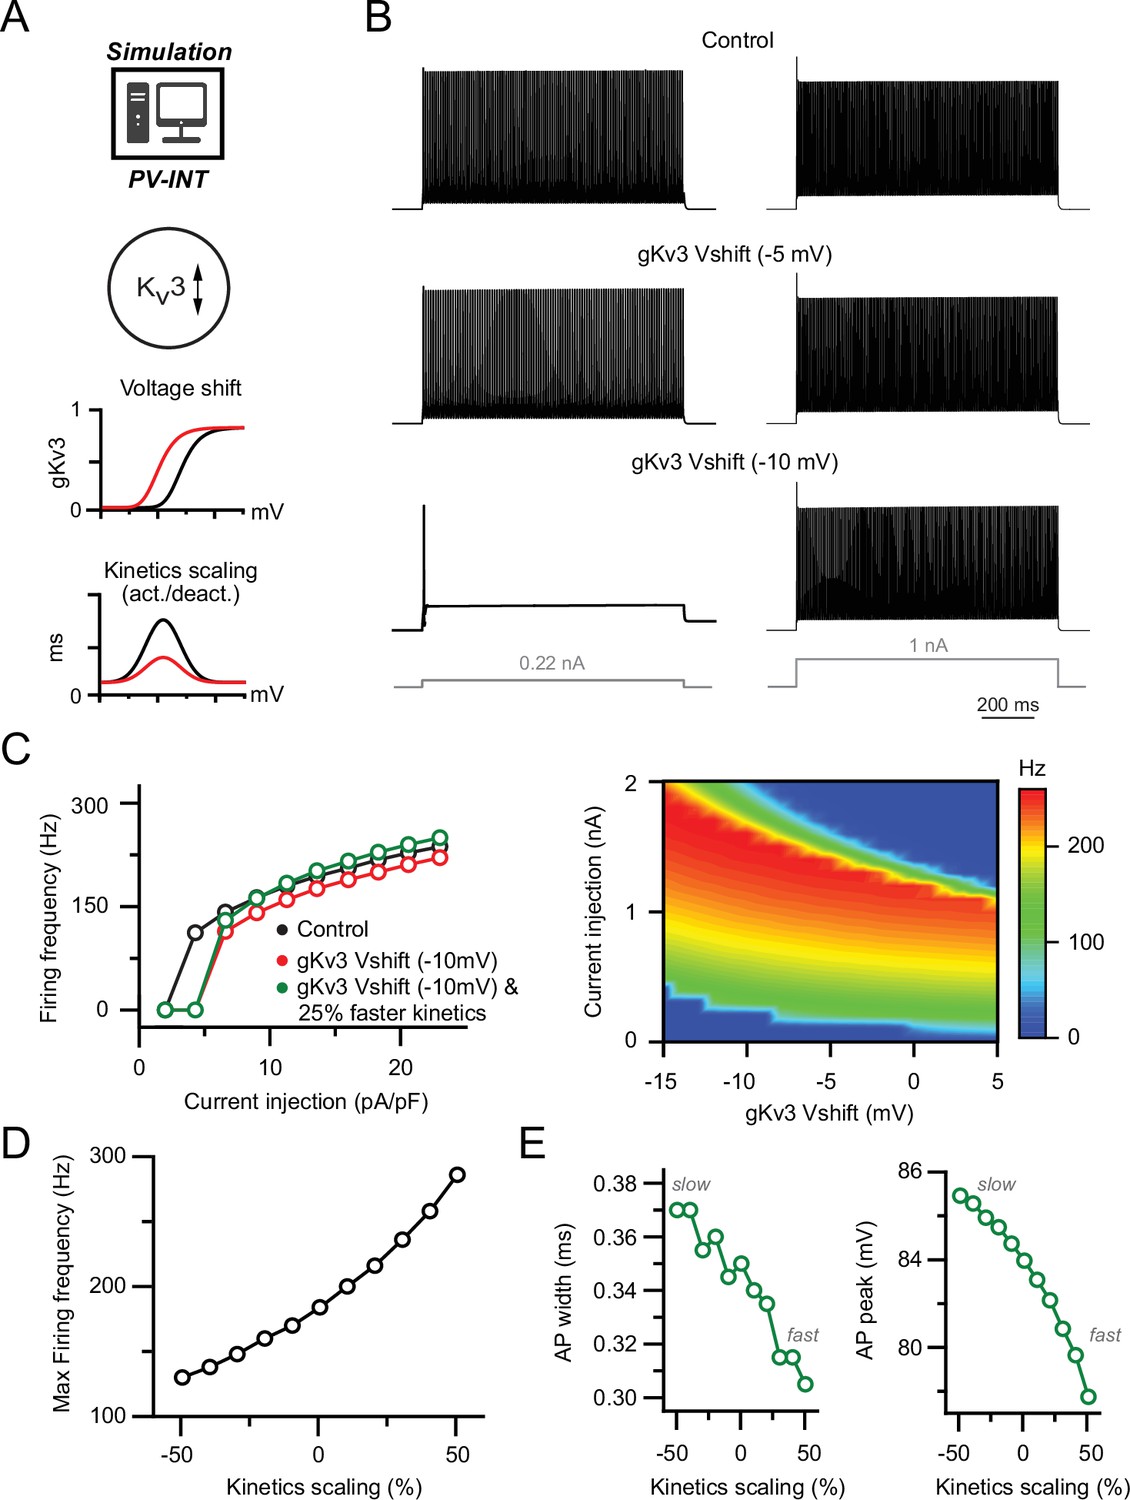
(A) PV cell single-compartmental model with modified Kv3 channel properties. Kv3 activation voltage and kinetics were independently or simultaneously modified in the following simulations. When applied, activation and deactivation kinetics were scaled together (±50% of control). (B) AP firing elicited by square pulse current injections at control and hyperpolarized Kv3 activation voltages. Two example current injection magnitudes are displayed. (C) Summary of firing frequency changes in different simulated Kv3 conditions. Near-threshold AP firing is reduced with hyperpolarized Kv3 activation independent of shifting Kv3 activation kinetics. (D) Effect of modifying Kv3 channel activation kinetics (±50% of control) alone on maximal firing frequency in PV neuron compartmental model. (E) Effect on Kv3 channel activation kinetics changes on simulated AP width and amplitude.
Figure 5—figure supplement 1
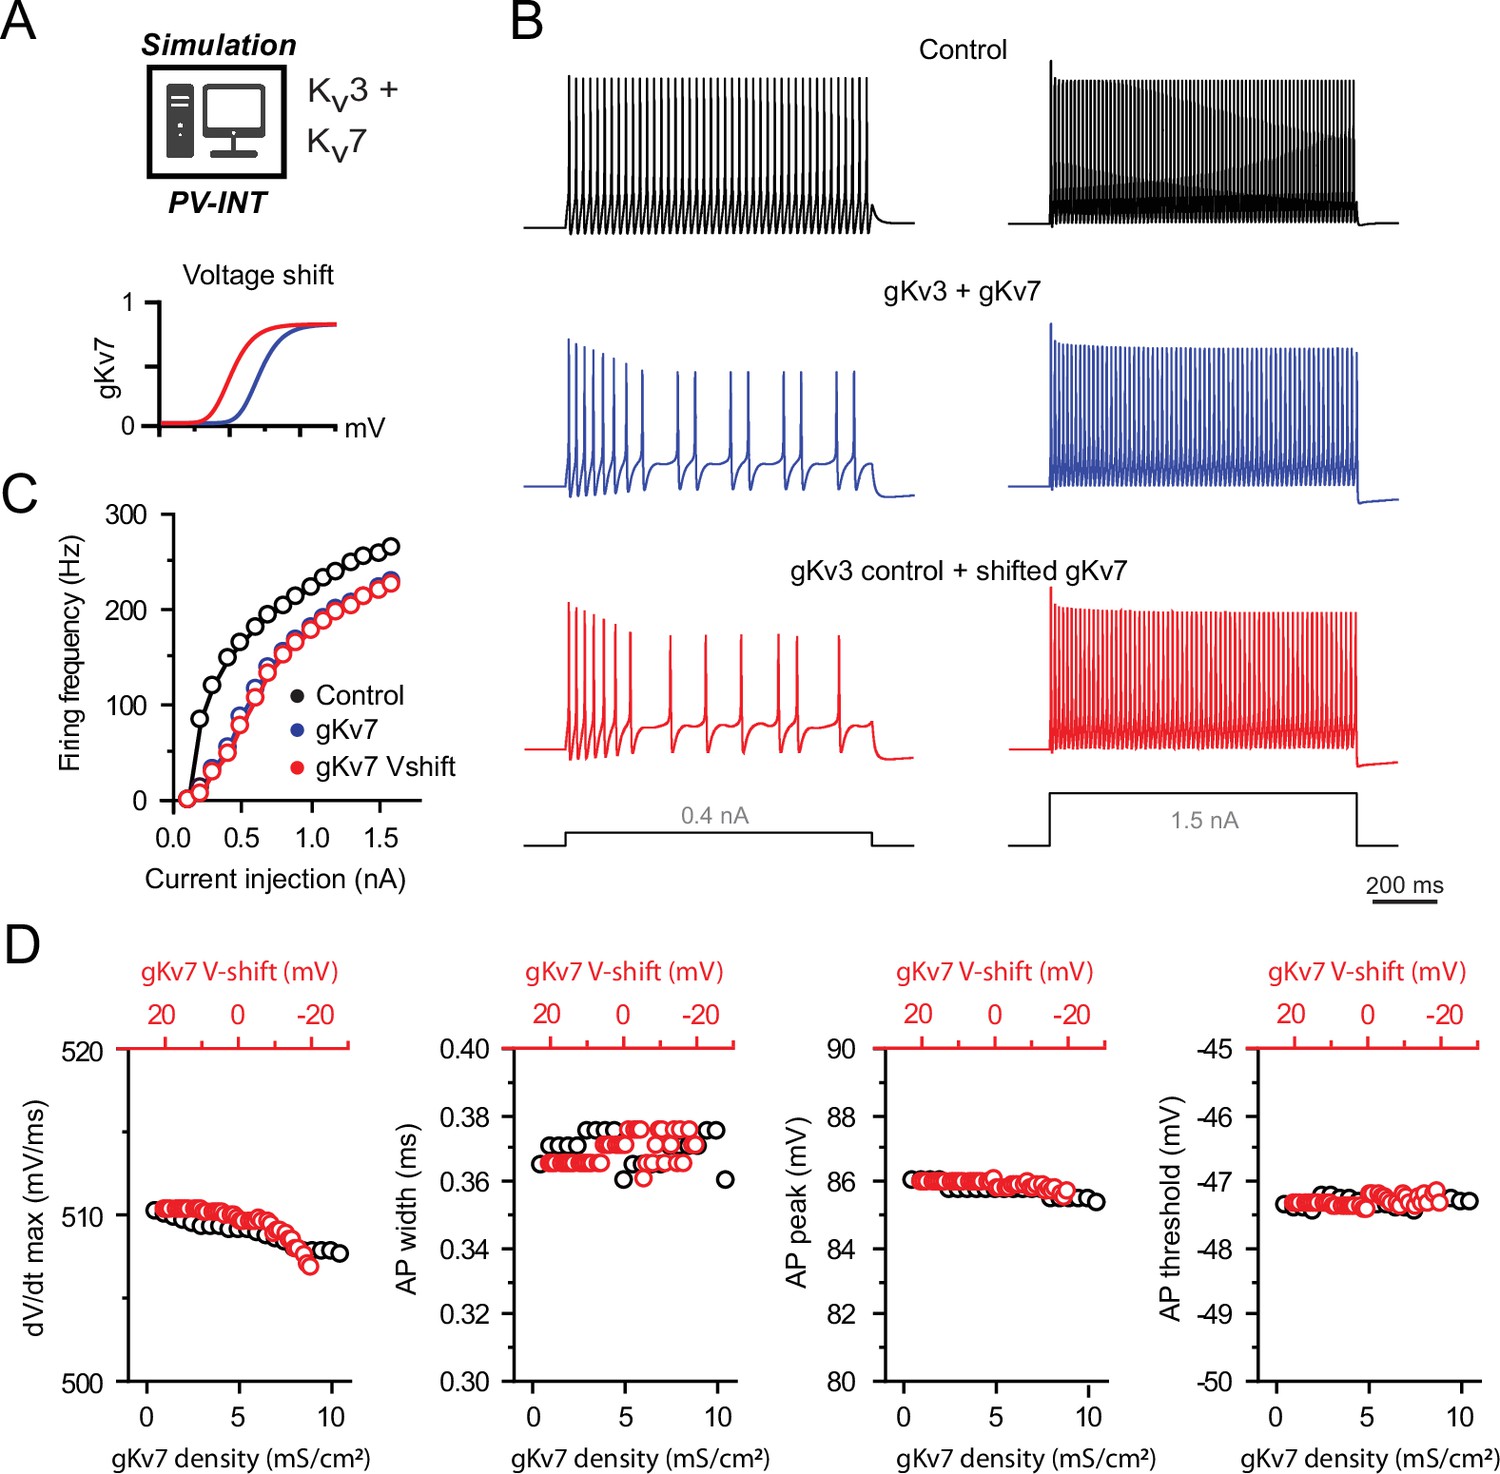
Effects of supplementing different Kv7 conductances on action potential (AP) firing in a parvalbumin (PV) model.
(A) PV cell single-compartmental model with Kv3 and additional Kv7 channels. Kv7 activation voltage and kinetics were independently or simultaneously modified. (B) AP firing elicited by square pulse current injections in control (gKv3), with supplemented Kv7 (gKv3 + gKv7) and following hyperpolarization (–10 mV relative shift) of the supplemented Kv7 activation voltage. (C) Summary data of firing frequency changes in different conditions. AP firing is unaffected following hyperpolarization of Kv7 voltage dependence. (D) Effects of Kv7 activation voltage and conductance density on simulated AP parameters.
Figure 6 with 1 supplement
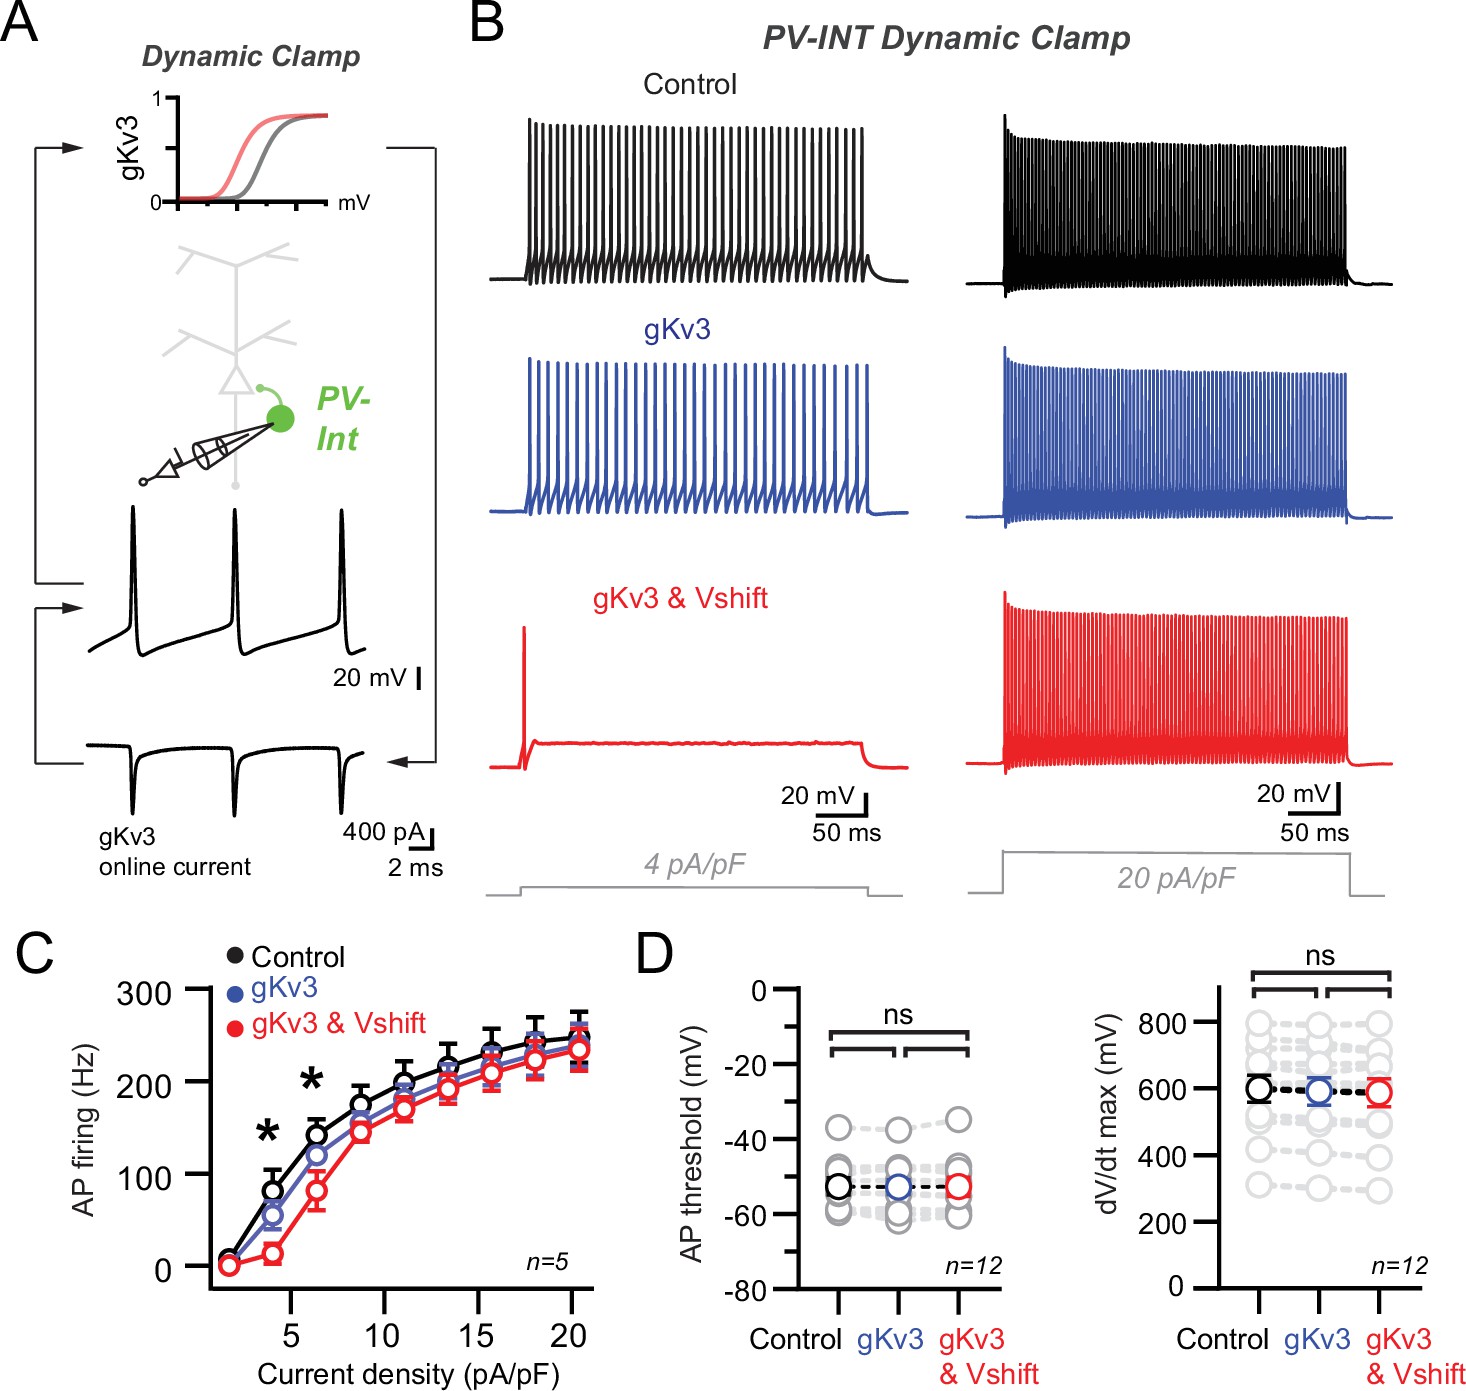
Recapitulation of the 5xFAD phenotype in parvalbumin (PV) cells using dynamic clamp.
(A) Targeted dynamic clamp recordings from an AAV.E2.GFP+ neuron. Online Kv3 response (20 nS online gKv3) shown during action potential (AP) firing in a PV interneuron. (B) AP firing responses to two different square pulse current injection levels in three distinct Kv3 dynamic clamp conditions in the same cell. (C) Summary data plot across a range of current injections from dynamic clamp conditions. Statistical significance was tested between the gKv3 (blue) and gKv3 and Vshift (red) conditions by repeated-measures (RM) two-way ANOVA (p<0.05) with Sidak’s multiple-comparison test. (D) Summary plots for AP threshold and dV/dt maximum in each of the dynamic clamp conditions tested within each cell. No differences were observed in any condition using RM one-way ANOVA (p<0.05) with Tukey’s multiple-comparison test.
Figure 6—figure supplement 1
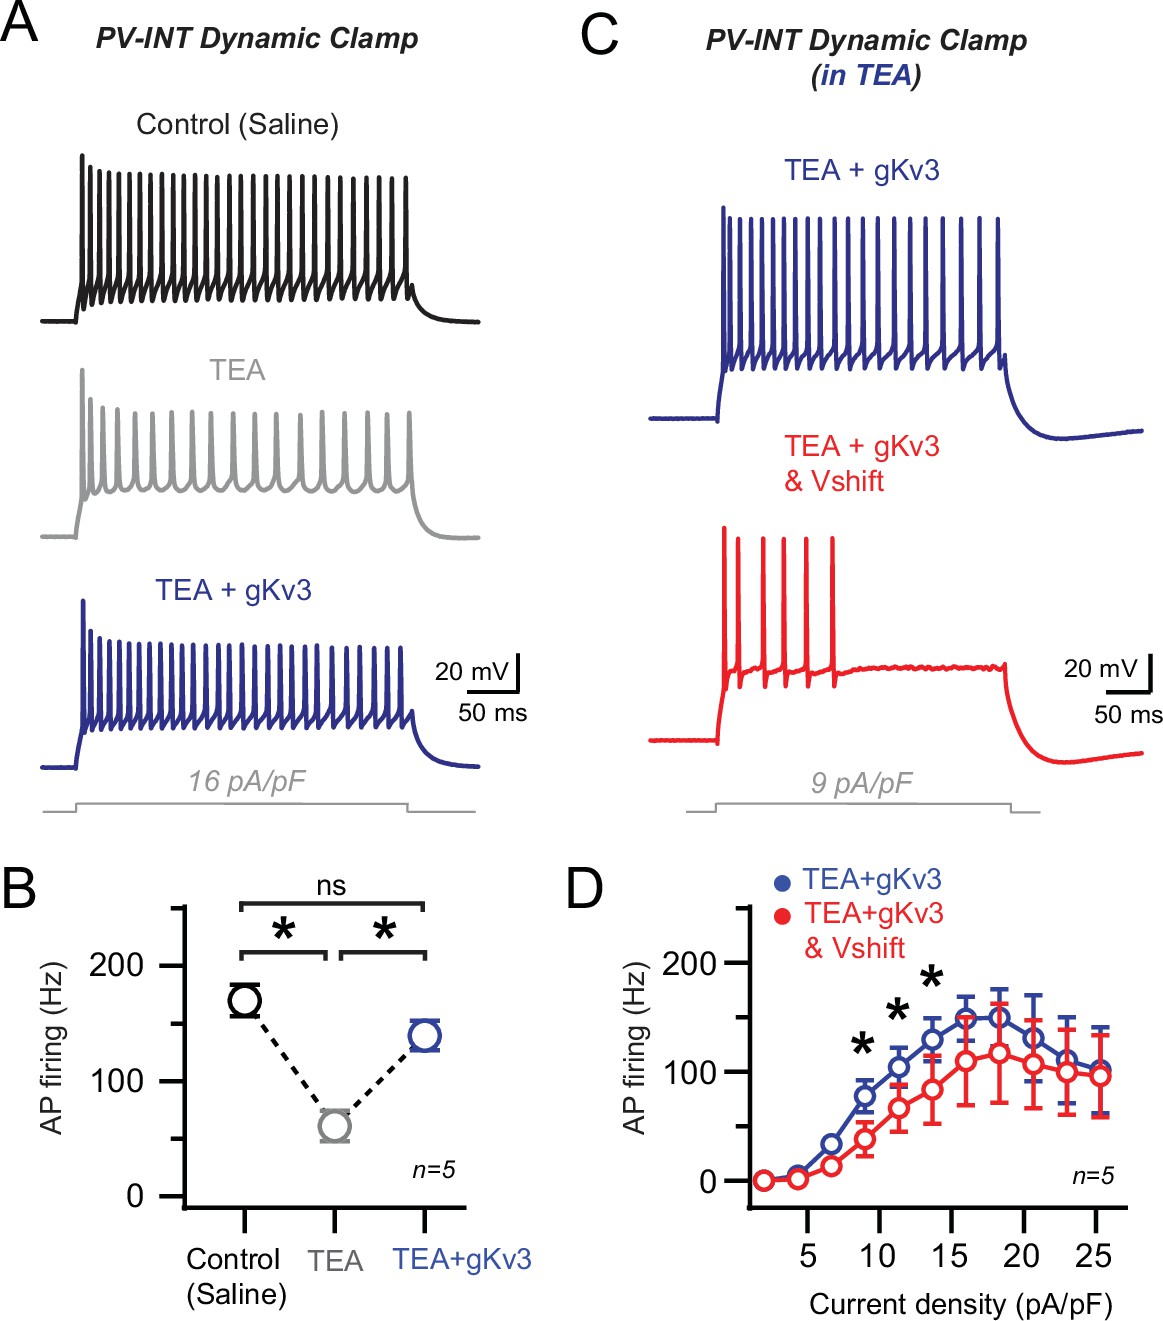
Effects of wild-type (WT) and Alzheimer’s disease (AD) gKv3 dynamic clamp with endogenous Kv3 channels blocked.
(A) Targeted recordings from a representative E2.GFP+ parvalbumin (PV) interneuron. High-frequency action potential (AP) firing (current density 16 pA/pF) was evaluated in the same cell under control conditions, after bath application of tetraethylammonium (TEA) (1 mM) and finally after dynamic clamp introduction of (WT) gKv3 conductance in TEA. (B) Summary data of PV firing (firing rates averaged from 12 to 20 pA/pF) in control, TEA, and TEA + gKv3 conditions. gKv3 (20–50 nS) could partially restore fast firing in TEA. Statistical significance was tested by repeated-measures (RM) one-way ANOVA (p<0.05) with Tukey’s multiple-comparison test. (C) AP firing responses to square pulse current injection with WT- and AD-type Kv3 dynamic clamp conditions in the same cell. Recordings were performed in the presence of 1 mM TEA in the bath. (D) Summary data plot across a range of current injections with WT and AD (–10 mV relative shift in voltage of activation) gKv3 dynamic clamp conditions, all with bath TEA (1 mM). Statistical significance was tested between the WT gKv3 (blue) and AD gKv3-Vshift (red) conditions by RM two-way ANOVA (p<0.05) with Sidak’s multiple-comparison test.
Figure 7 with 1 supplement
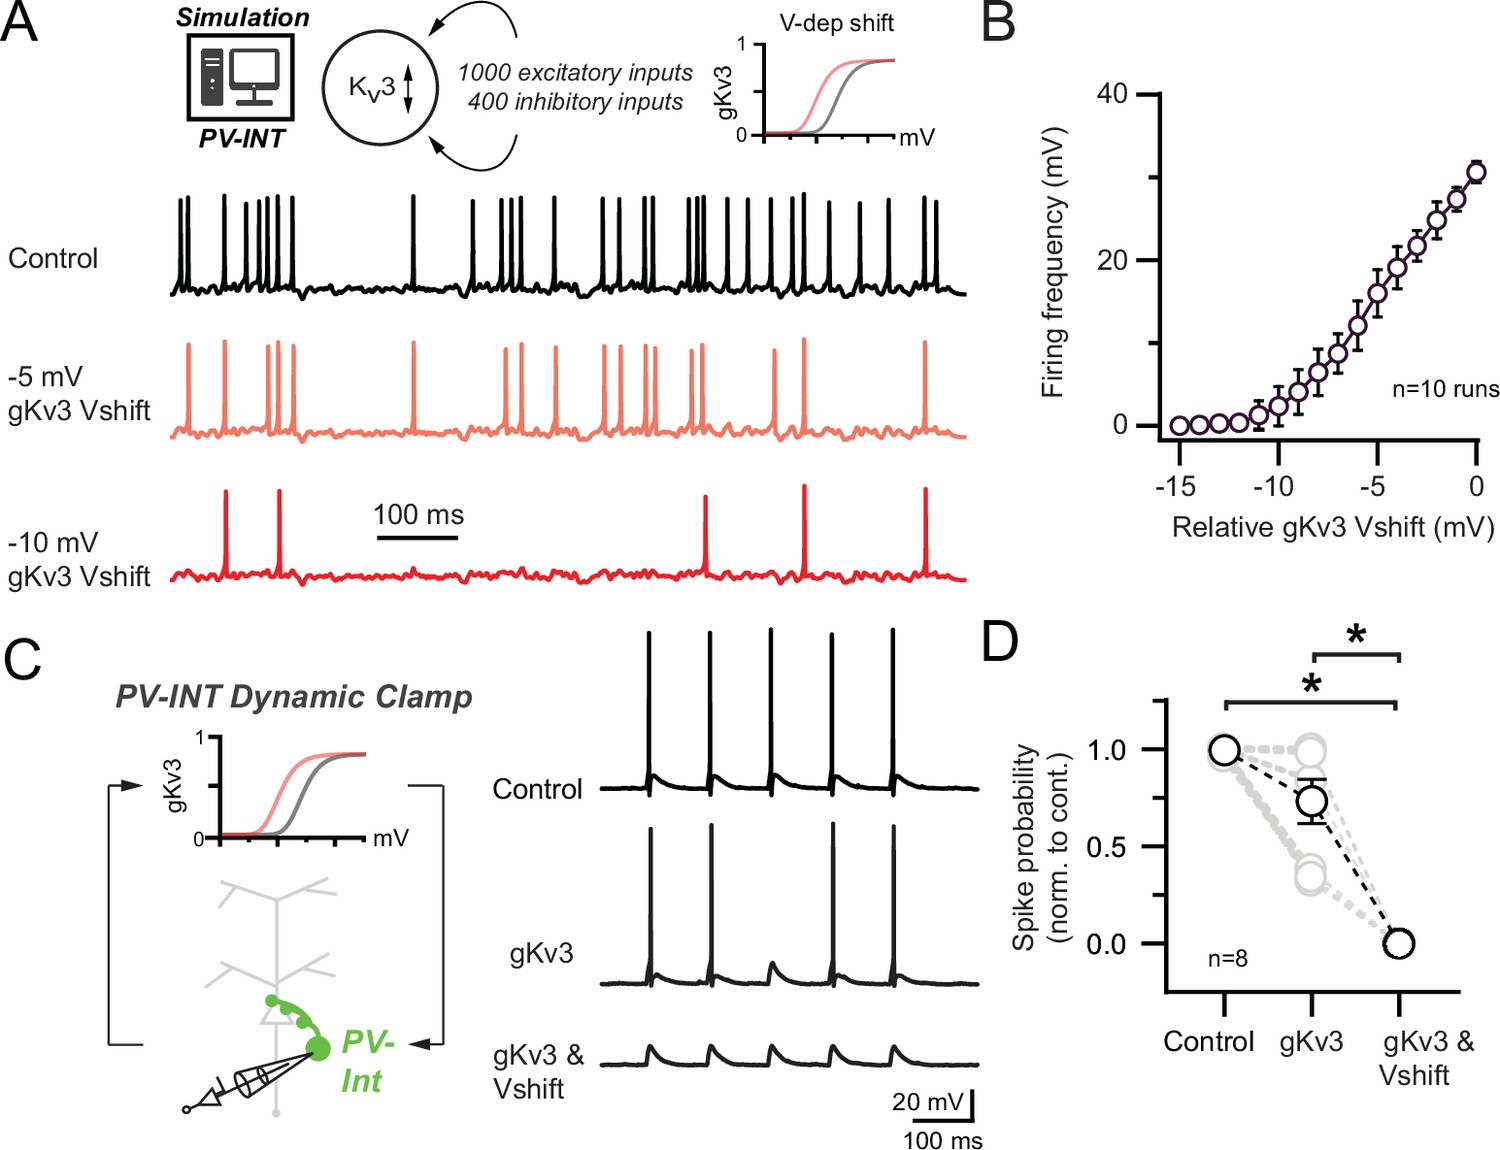
Effect of 5xFAD-related Kv3 channel modulation on synaptically evoked action potential (AP) firing.
(A) Simulated responses of parvalbumin (PV) cell compartmental model with continuous excitatory and inhibitory inputs in control and with hyperpolarized Kv3 activation voltages. (B) Summary graph of PV compartmental model firing frequency in response to continuous synaptic inputs at increasingly hyperpolarized Kv3 activation voltages. 0 mV represents the relative control Kv3 activation voltage. (C) 10 Hz gEPSP-evoked AP firing in dynamic clamp recordings from AAV.E2.GFP+ neurons in acute slice. In control conditions, gEPSP conductance was calibrated such that the majority of stimuli evoked APs. Within recordings, the gEPSP amplitude was constant while the cell was subjected to varying gKv3 dynamic clamp conditions. (D) Spike probability summary in response to gEPSPs in varying gKv3 dynamic clamp. Significance was defined by one-way ANOVA (p<0.05) with Tukey’s multiple-comparison test. For all summary graphs, data are expressed as mean (± SEM).
Figure 7—figure supplement 1
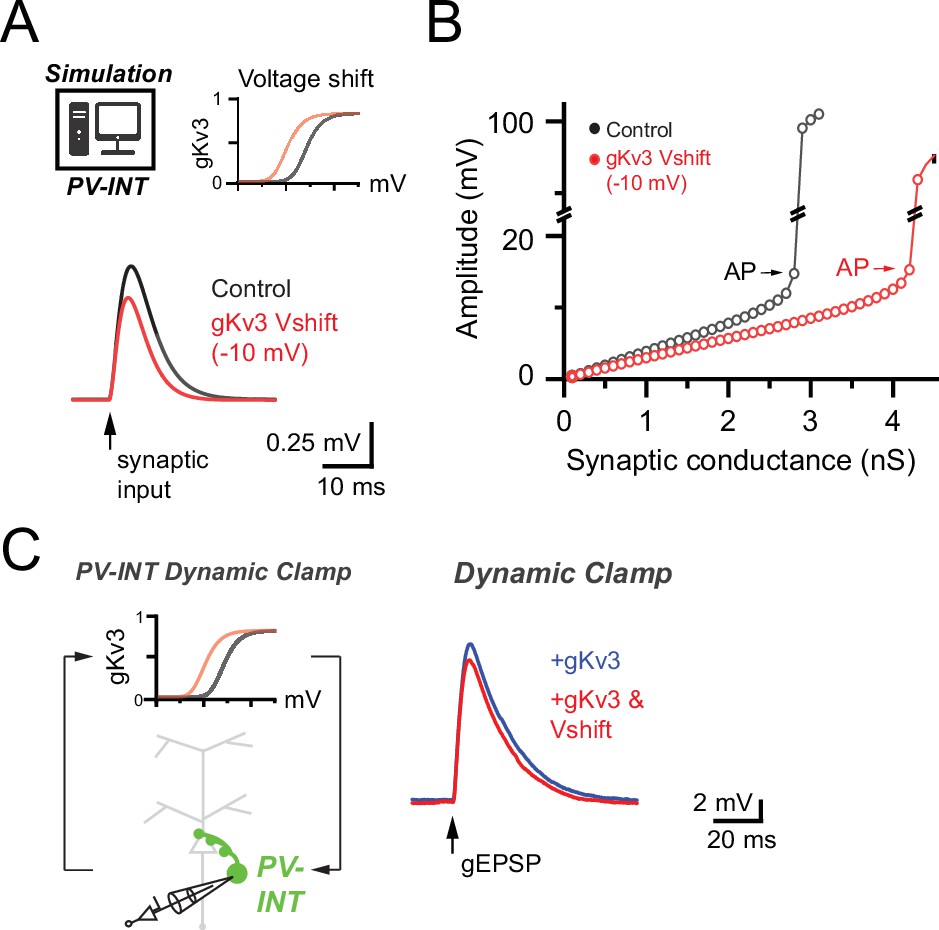
Effect of 5xFAD-related Kv3 channel modulation on synaptically evoked subthreshold events.
(A) Average subthreshold response of parvalbumin (PV) cell compartmental model following excitatory input in control conditions and with a relative –10 mV Vshift in Kv3 activation voltage. (B) Differences in subthreshold excitatory event amplitudes evoked by increasing synaptic conductances. Simulation was run in control conditions and following leftward Kv3 activation voltage shift. (C) Subthreshold gEPSPs evoked in dynamic clamp recordings from AAV.E2.GFP+ neurons. gEPSP conductance was calibrated such that stimuli reliably resulted in subthreshold events. For each condition during recordings, ~10 time-locked gEPSP waveforms were averaged. Comparison of EPSP in +gKv3 (20 nS) and +gKv3 (20 nS) with –10 mV Vshift is shown. –10 mV Kv3 relative Vshift was sufficient to reduce gEPSP charge (+gKv3, 252.2 ± 38.4 pC; +gKv3 and Vshift, 221.9 ± 32.7 pC; p=0.01, paired t-test; n = 5).
Figure 8 with 1 supplement
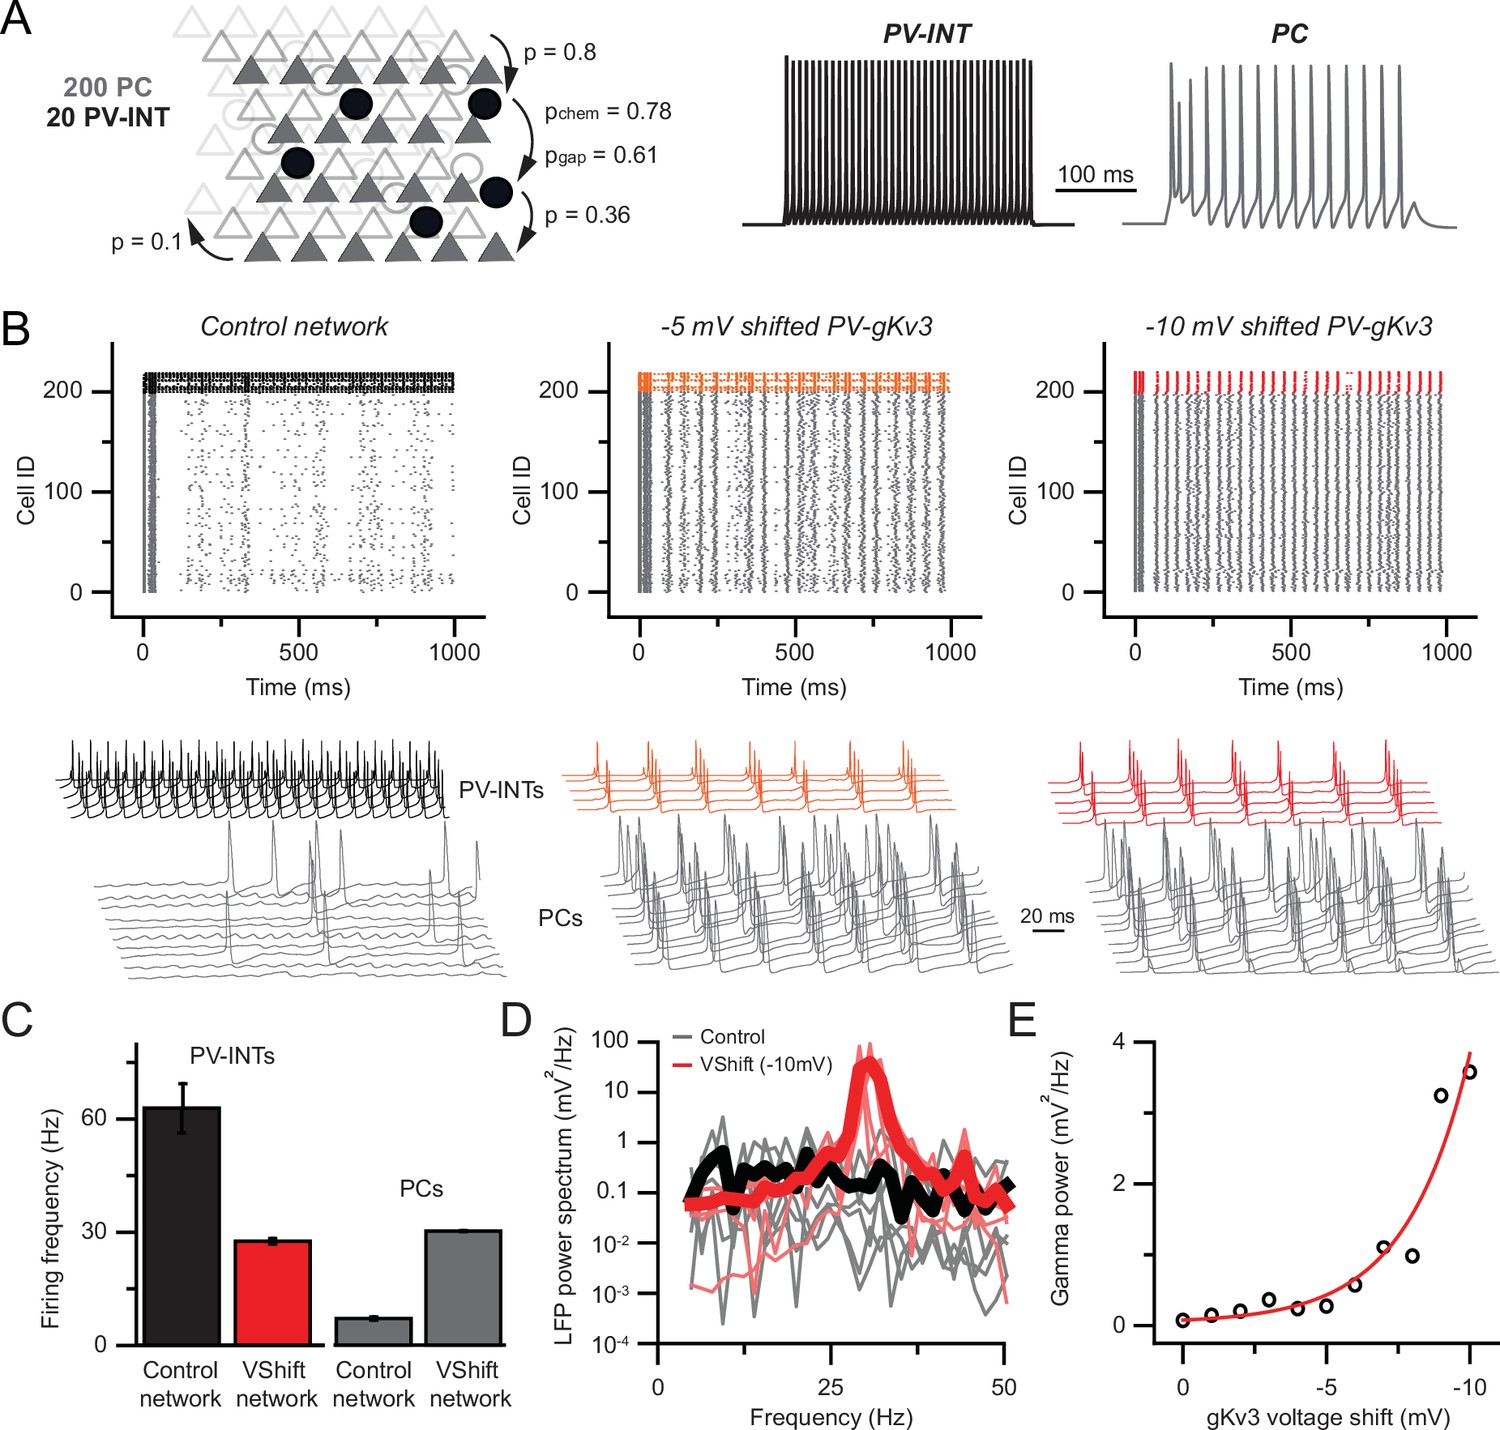
Hyperexcitability and increased gamma following parvalbumin (PV)-specific Kv3 modulation.
(A) Simplified cortical network consisting of 200 pyramidal cells (PC; triangles) and 20 PV (circle) cells. Connection probabilities between and within cell groups are set based on literature. 300-ms-long spiking responses for single PC and PV cells are shown on the right. (B) Raster plots depicting 1-s-long network activity of the 220 cells in the network. The top 20 cells correspond to PV cells (black, orange, red), bottom 200 cells show PC activity (gray). The effect of relative –5.0 and –10.0 mV shifts in gKv3 of PV cells is compared to control. Representative traces are shown from 5 PV cells and 10 PC. (C) Mean firing frequency of PV cells and PCs upon –10 mV relative voltage shift of gKv3 in PV cells. Data are expressed as mean (± SEM). (D) Calculated local field potential (LFP) between 5 and 50 Hz, produced by 220 cells in the network. The activity level of individual cells was randomized and network simulations were repeated five times in control conditions and with a –10 mV relative shift in gKv3 of PV cells. Individual LFP traces are shown in light gray and light red. Mean LFP traces are shown in bold black and red. (E) Gamma power in relation to the voltage shift of gKv3 in PV cells. Gamma power was calculated by averaging LFP signals between 30 and 50 Hz. Continuous red line depicts the exponential relationship between the two variables.
Figure 8—figure supplement 1

Circuit synchronization following parvalbumin (PV)-specific Kv3 modulation.
(A) Membrane potential correlations within cell groups in control and –10 mV shifted gKv3 conditions. Correlations were measured as Pearson correlations coefficient comparing each individual cell. Data are expressed as mean (± SEM). (B) Firing cross-correlation of PV cells and pyramidal cells (PCs) in a 200-ms time window. (C) Same as for panel (B) but in case of a network with –10 mV shifted gKv3 in PV cells.
Tables
Key resources table
| Reagent type (species) or resource | Designation | Source or reference | Identifiers | Additional information |
|---|---|---|---|---|
| Strain, strain background (Mus musculus) | Mouse: C57B6/J | Jackson Labs | Strain# 000664 | Wild-type mouse model |
| Strain, strain background (. musculus) | Mouse: 5xFAD C57B6/J | Jackson Labs | Strain # 032882 | ‘AD’ mouse model |
| Recombinant DNA reagent | AAV.E2.GFP | Original source: Jordane Dimidschstein (MIT) | Addgene 135631 | AAV construct to transfect and express GFP in PV cells |
| Chemical compound, drug | Tetraethylammonium (TEA) | Sigma-Aldrich | Cat# 86614 | Drug used to block Kv3 channels |
| Chemical compound, drug | Iberiotoxin (IBTX) | Alamone Labs | Cat# STI-400 | Drug used to block BK channels |
| Software, algorithm | NEURON simulation environment | https://neuron.yale.edu/neuron/ | Software for neuron and network simulations | |
| Software, algorithm | Dynamic clamp | Desai et al., 2008; Desai, 2022, https://github.com/nsdesai/dynamic_clamp | Software/hardware design for dynamic clamp system |
Additional files
Download links
A two-part list of links to download the article, or parts of the article, in various formats.
Downloads (link to download the article as PDF)
Open citations (links to open the citations from this article in various online reference manager services)
Cite this article (links to download the citations from this article in formats compatible with various reference manager tools)
Biophysical Kv3 channel alterations dampen excitability of cortical PV interneurons and contribute to network hyperexcitability in early Alzheimer’s
eLife 11:e75316.
https://doi.org/10.7554/eLife.75316


