Revised International Staging System (R-ISS) stage-dependent analysis uncovers oncogenes and potential immunotherapeutic targets in multiple myeloma (MM)
- Department of Health Management, Sichuan Provincial People’s Hospital, University of Electronic Science and Technology of China, China
- The Key Laboratory for Human Disease Gene Study of Sichuan Province and Institute of Laboratory Medicine, Sichuan Provincial People’s Hospital, University of Electronic Science and Technology of China, China
- Natural Products Research Center, Institute of Chengdu Biology, Sichuan Translational Medicine Hospital, Chinese Academy of Sciences, China
- Department of Orthopaedics, Sichuan Provincial People’s Hospital, University of Electronic Science and Technology of China, China
- Department of hematology, Sichuan Provincial People’s Hospital, University of Electronic Science and Technology of China, China
- Chengdu University of Traditional Chinese Medicine, China
Figures
Figure 1 with 1 supplement
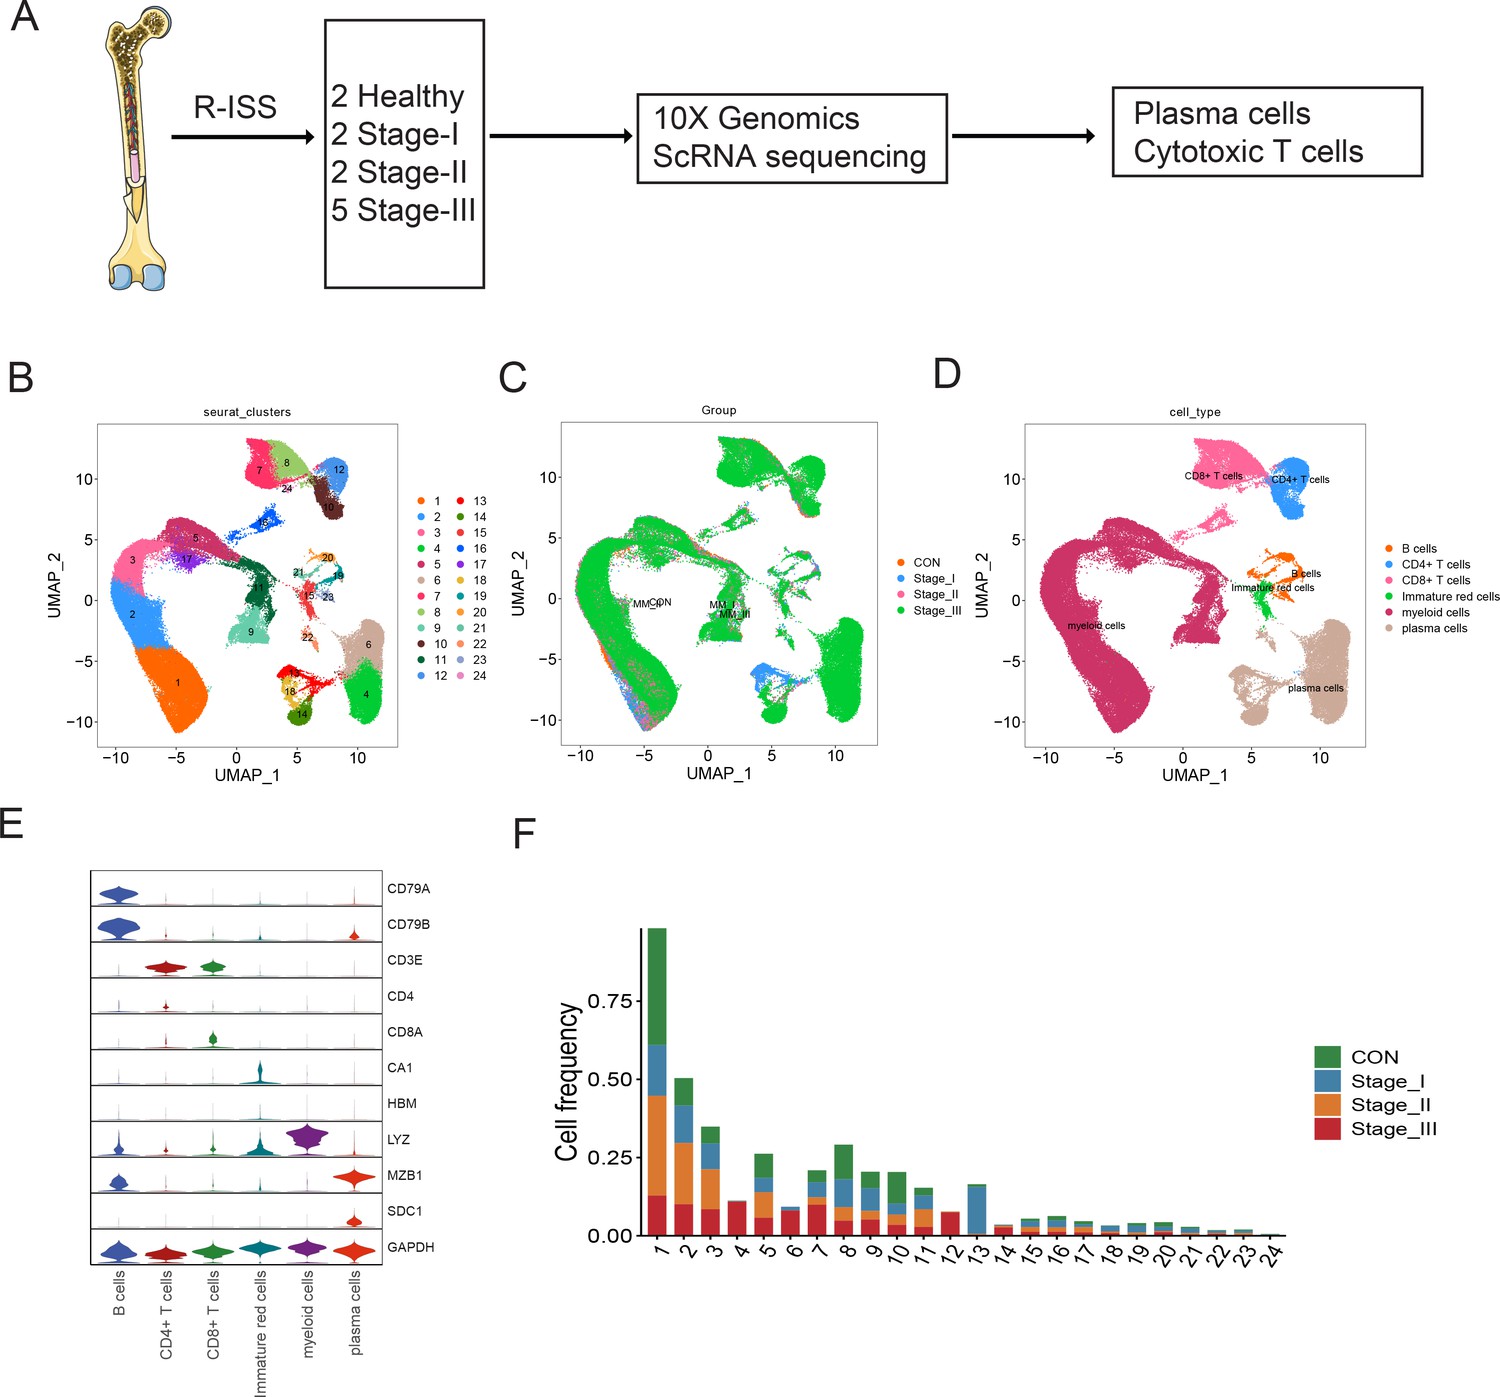
Single-cell transcriptome atlas of multiple myeloma (MM) with Revised International Staging System (R-ISS) staging.
(A) Schematic illustration of workflow in this study. (B) Dimension reduction of cells, and 21 clusters were acquired, shown with UMAP. (C) UMAP showing the distribution of sample groups of normal, R-ISS I–III. Based on expression signature of canonical markers, six general cell types were identified. UMAP of cell type were shown (D), and violin plot of cell type markers in (E). (F) Proportion of cell clusters in normal and MM R-ISS groups.
Figure 1—figure supplement 1
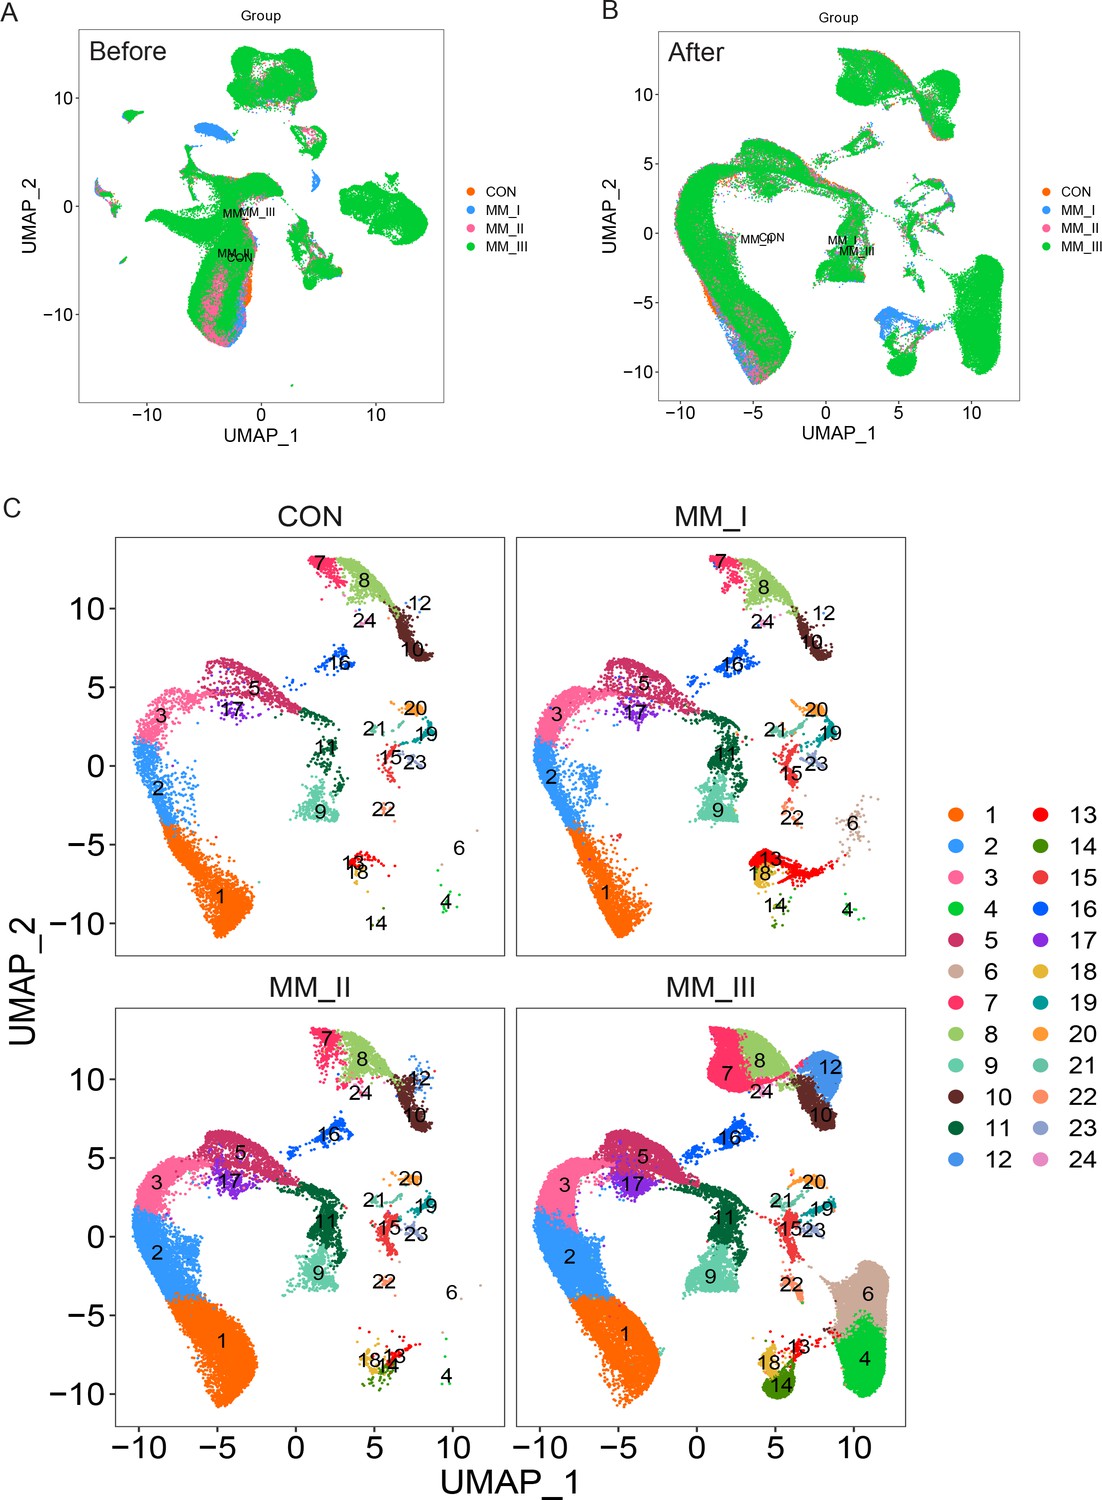
UMAP of before and after batch-effect removing, and stage groups in multiple myeloma (MM).
(A) UMAP of all clusters before batch-effect removing. (B) UMAP of all clusters after batch-effect removing. (C) UMAP of the distributions of all clusters in different stages.
Figure 2 with 2 supplements
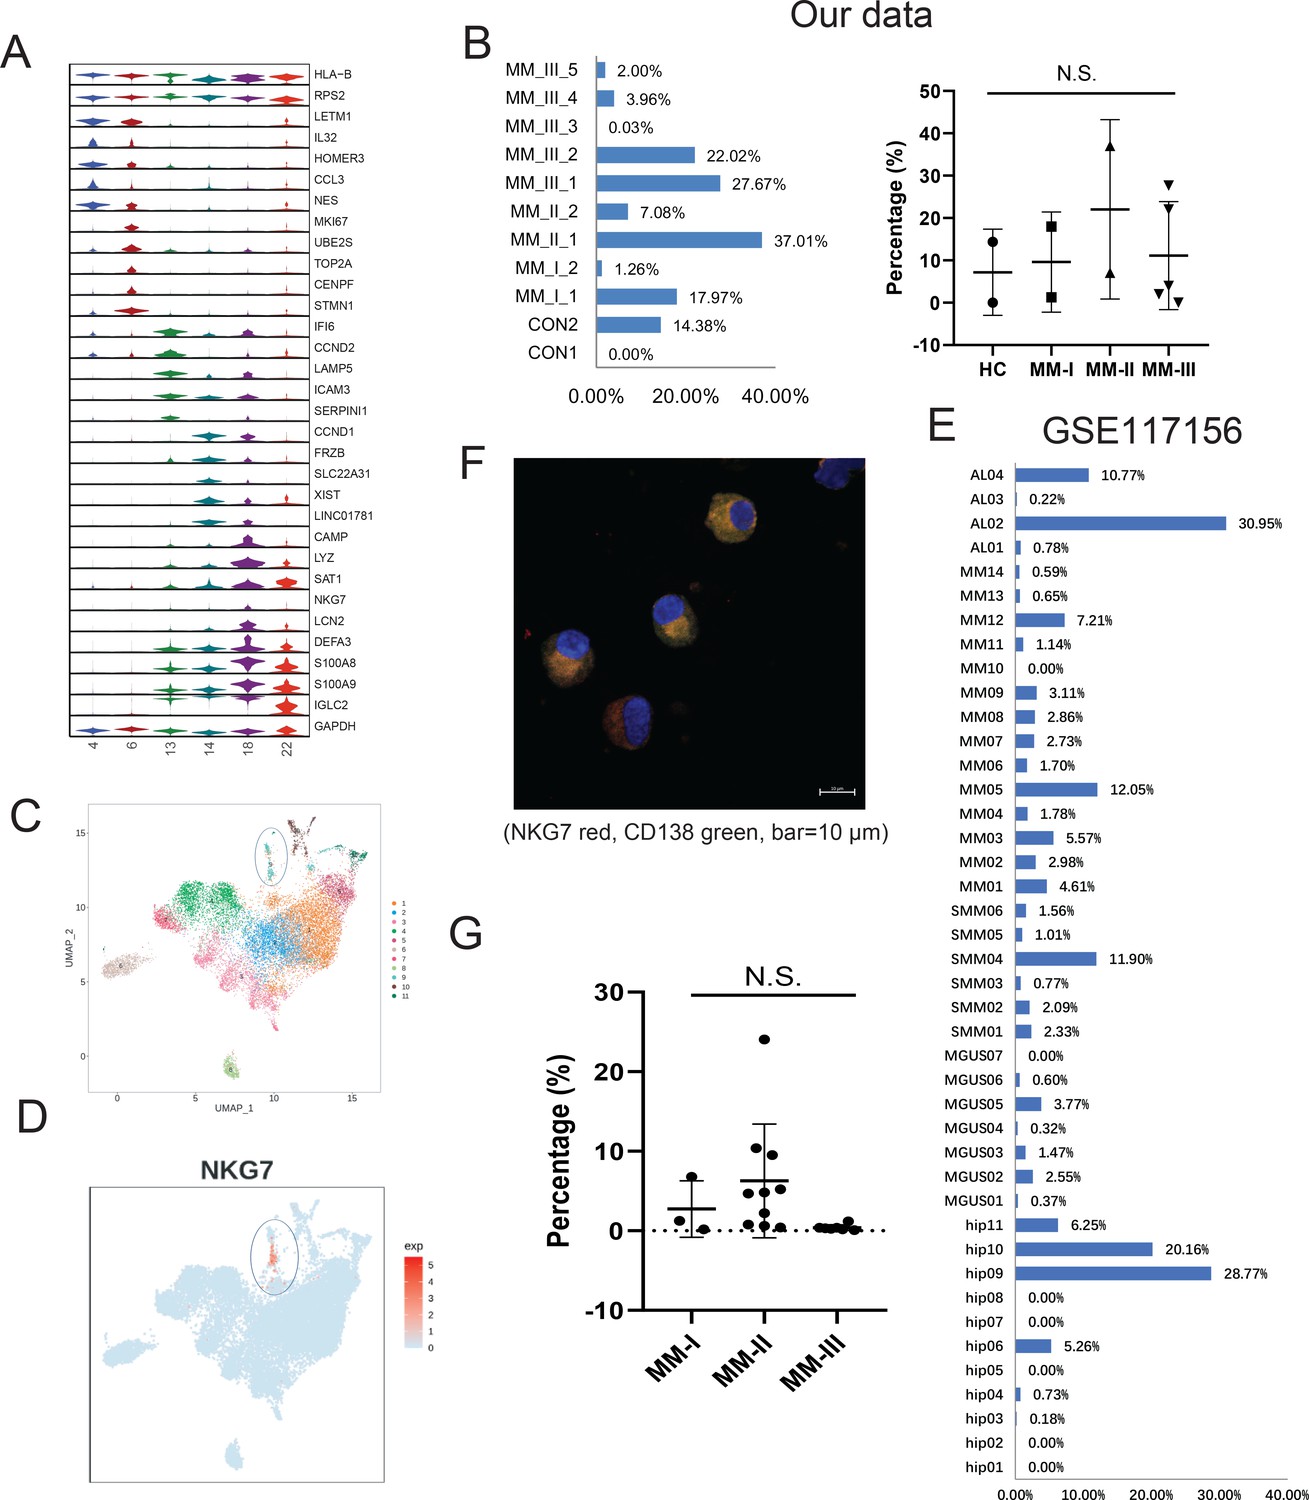
Identification of a rare cytotoxic NKG7+ plasma cell population in multiple myeloma (MM).
(A) The heterogeneity of plasma cells (CD138+) was transcriptionally analysed, and genes specifically expressed in six plasma cell clusters were calculated. (B) In our cohort, the proportion of PC18 in all 11 plasma cells. (C) PC18 corresponds to c11 in another MM plasma dataset of GSE117156. (D) C11 specifically highly expresses cytotoxic markers like NKG7. (E) The cell fraction of c11 in another MM plasma dataset of GSE117156. (F) Immunofluorescence confirmed the expression of NKG7 in cytoplasm of myeloma cells (CD138 positive) from patients with MM; NKG7 red, CD138 green, bar = 10 μm. (G) Twenty MM patients (Revised International Staging System [R-ISS] stage I, three patients; II, 10 patients; III, seven patients) were enrolled in for multiparameter flow cytometry (MFC) analysis.
Figure 2—figure supplement 1
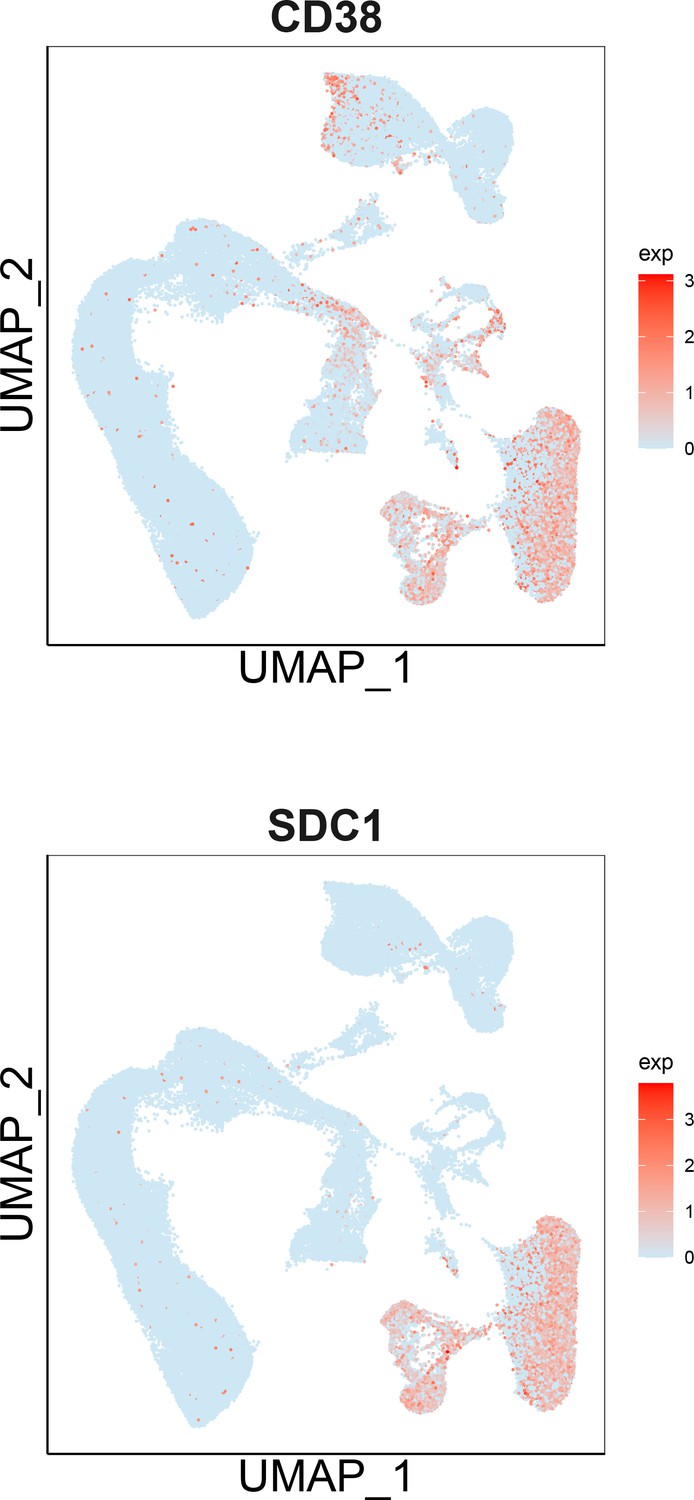
UMAP showing markers expression of CD138 and CD38 in multiple myeloma (MM).
Figure 2—figure supplement 2
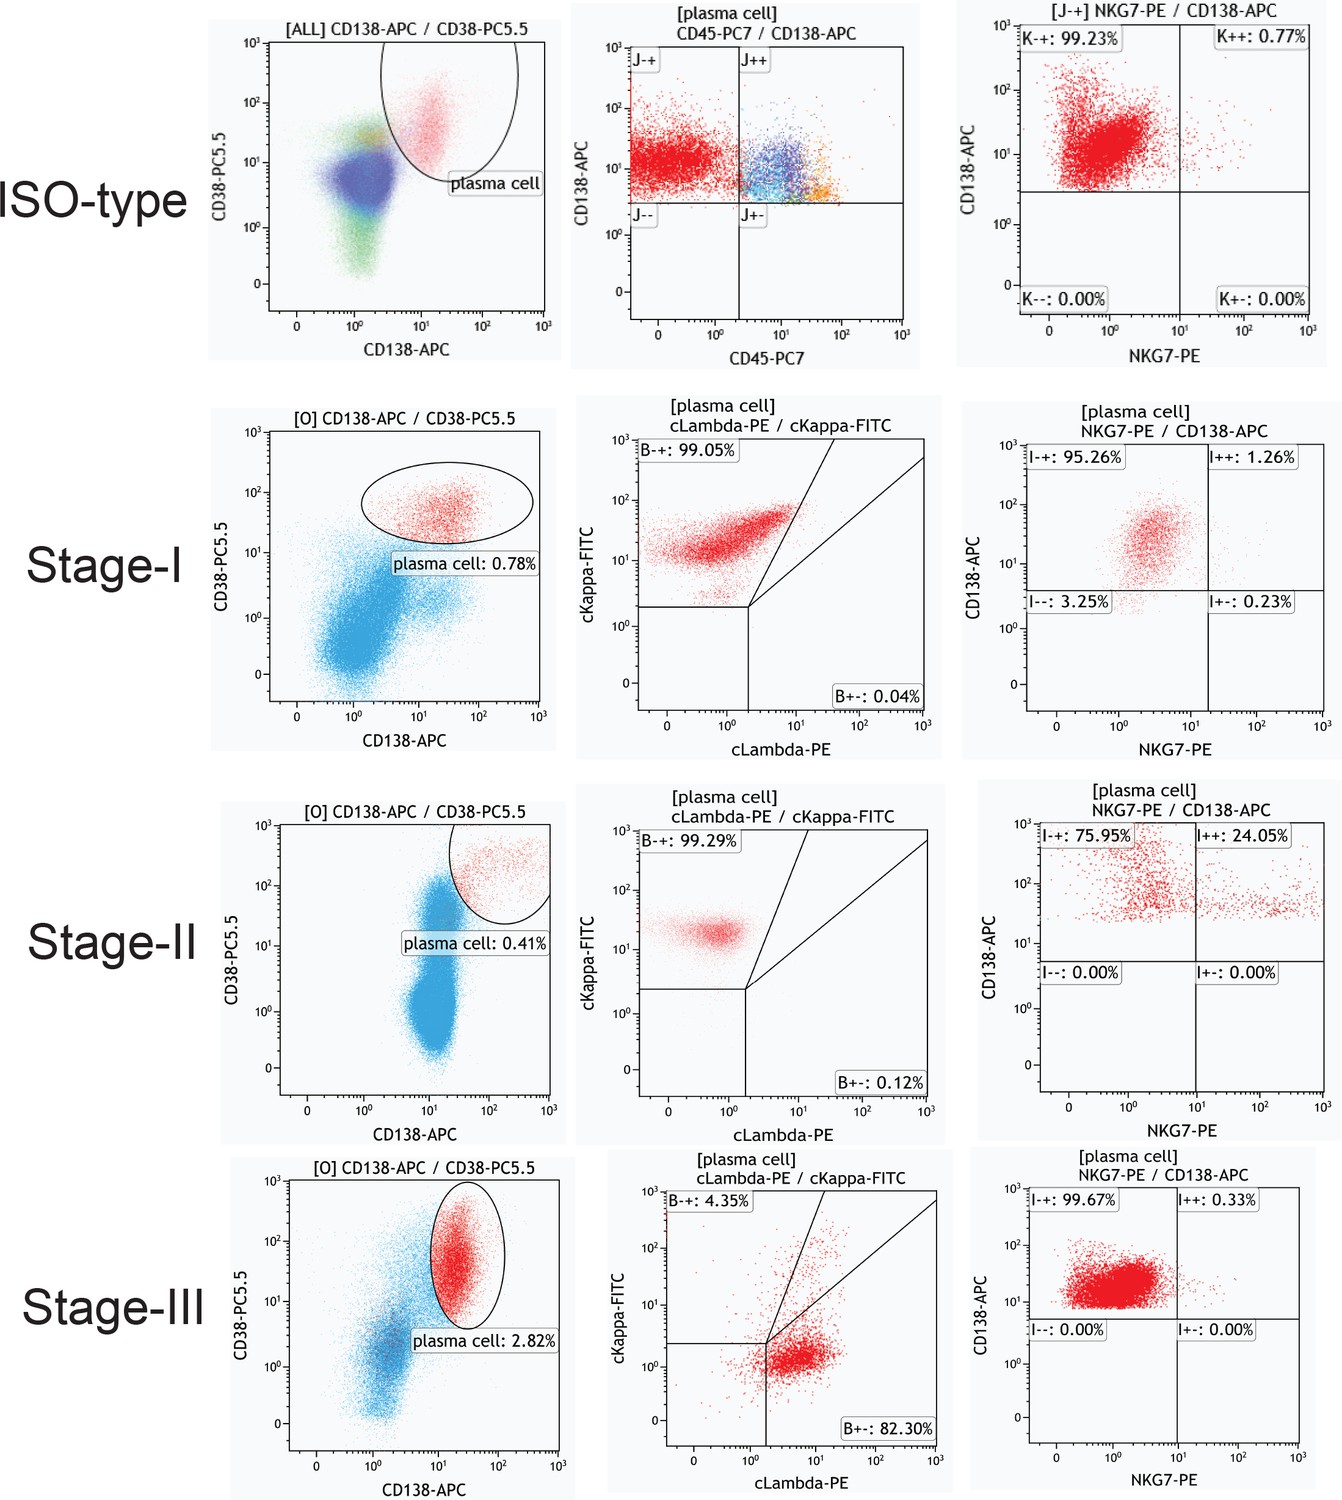
Multiparameter flow cytometry (MFC) analysis of NKG7+ plasma cells in MM-I, -II, and -III patients.
Figure 3 with 2 supplements
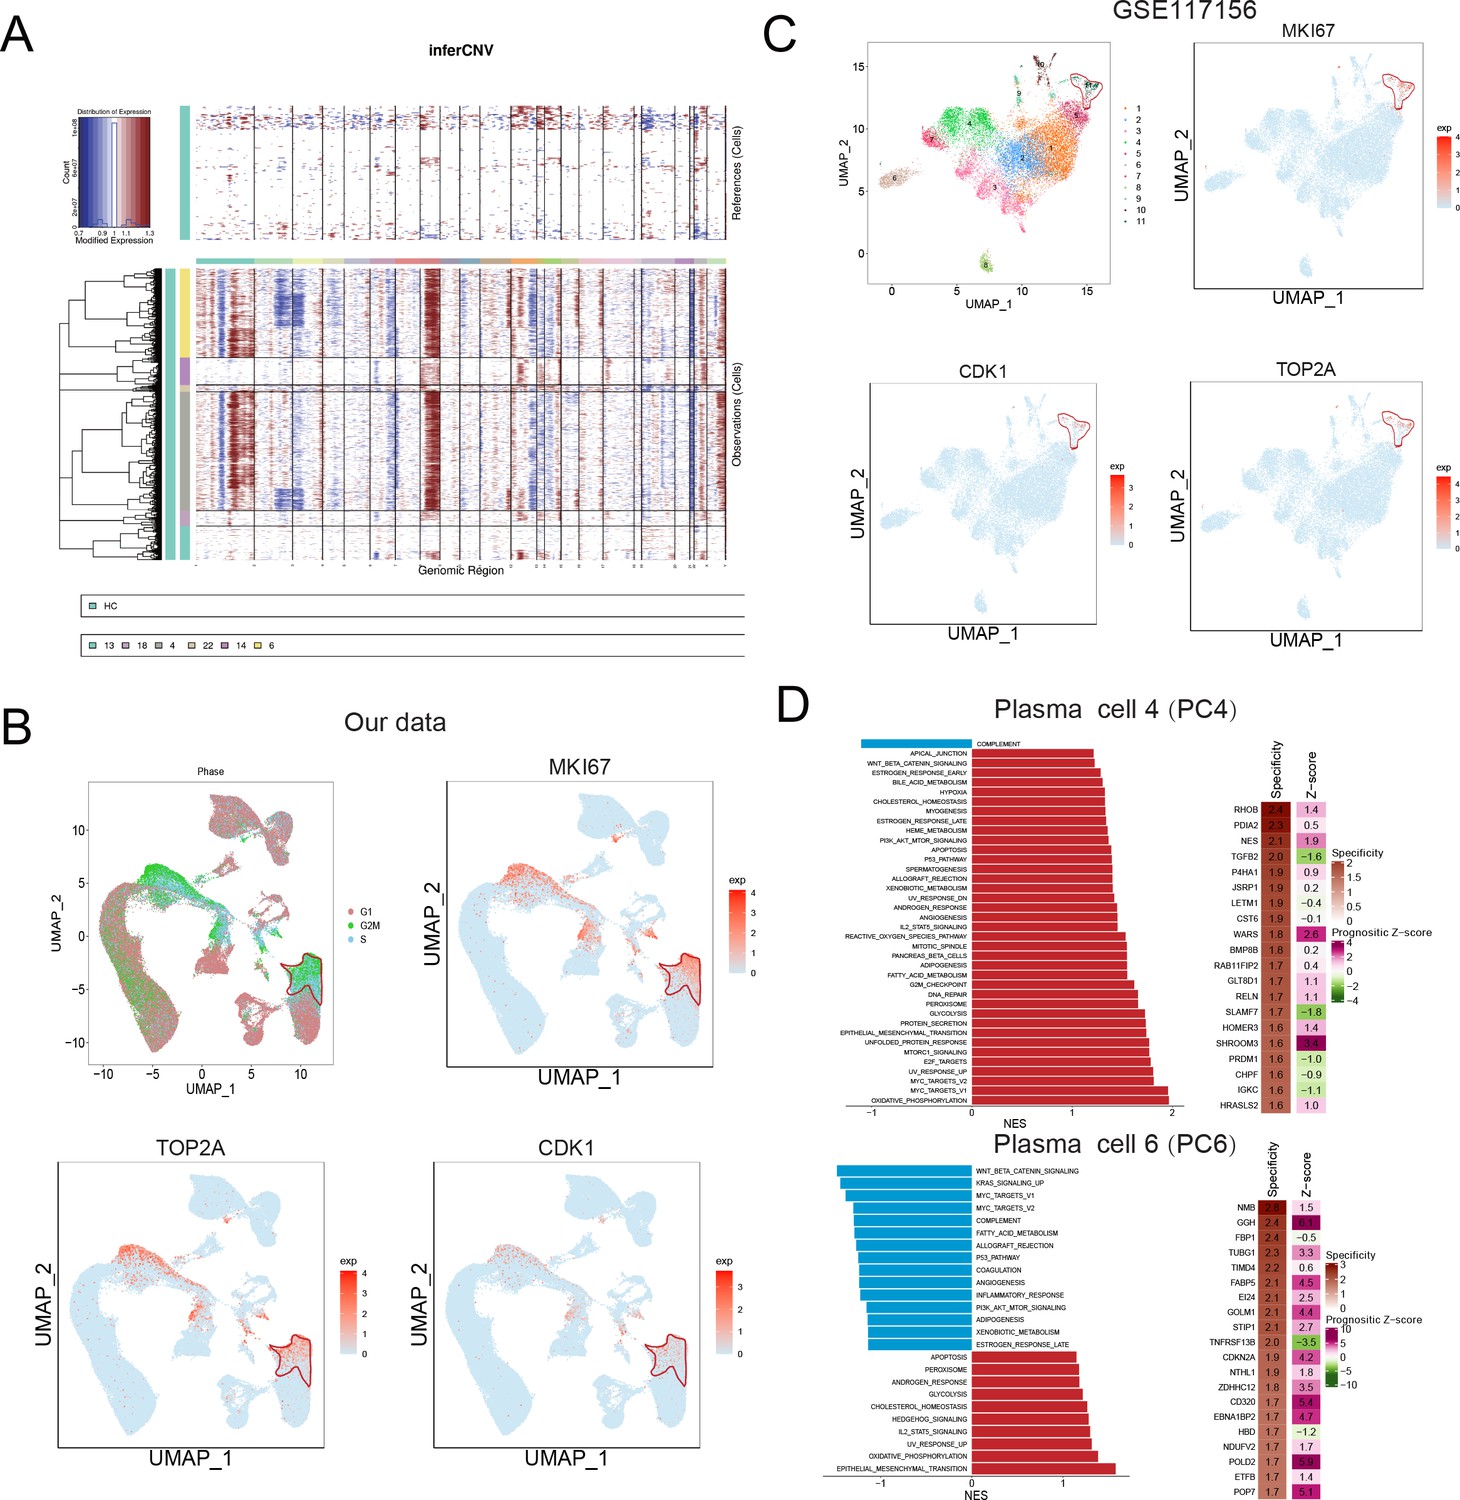
Identification of a malignant and risky plasma cell cluster with proliferation activity.
(A) To identify malignant plasma cells, inferCNV was applied to obtain the copy number variation (CNV) signals in all six plasma cell clusters. (B) Cell cycle distribution was analysed, and three proliferation markers of MKI67, TOP2A, and CDK1 were also shown. (C) UMAP of three proliferation markers of MKI67, TOP2A, and CDK1 in GSE117156. (D) GSEA hallmarks and PRECOG analysis was conducted, and significant enriched pathways of clusters 4 and 6 were shown. PRECOG was applied to infer the genes in clusters 4 and 6 with specificity and prognostic z-score in external multiple myeloma (MM) gene expression data GSE6647.
Figure 3—figure supplement 1
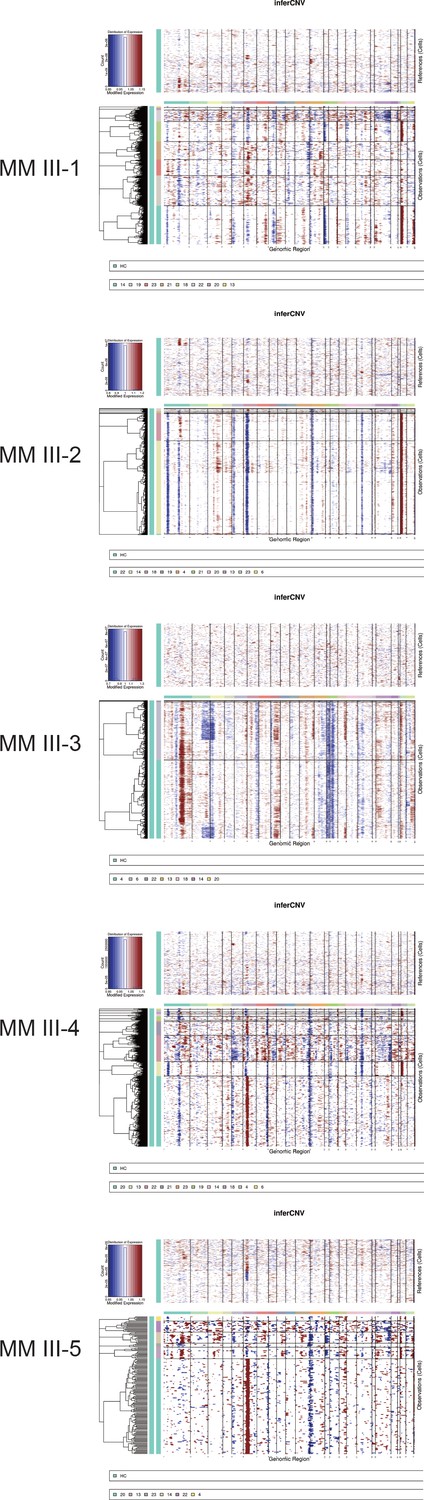
The inferCNV result of B and plasma cell clusters in MM-III stage samples.
Figure 3—figure supplement 2
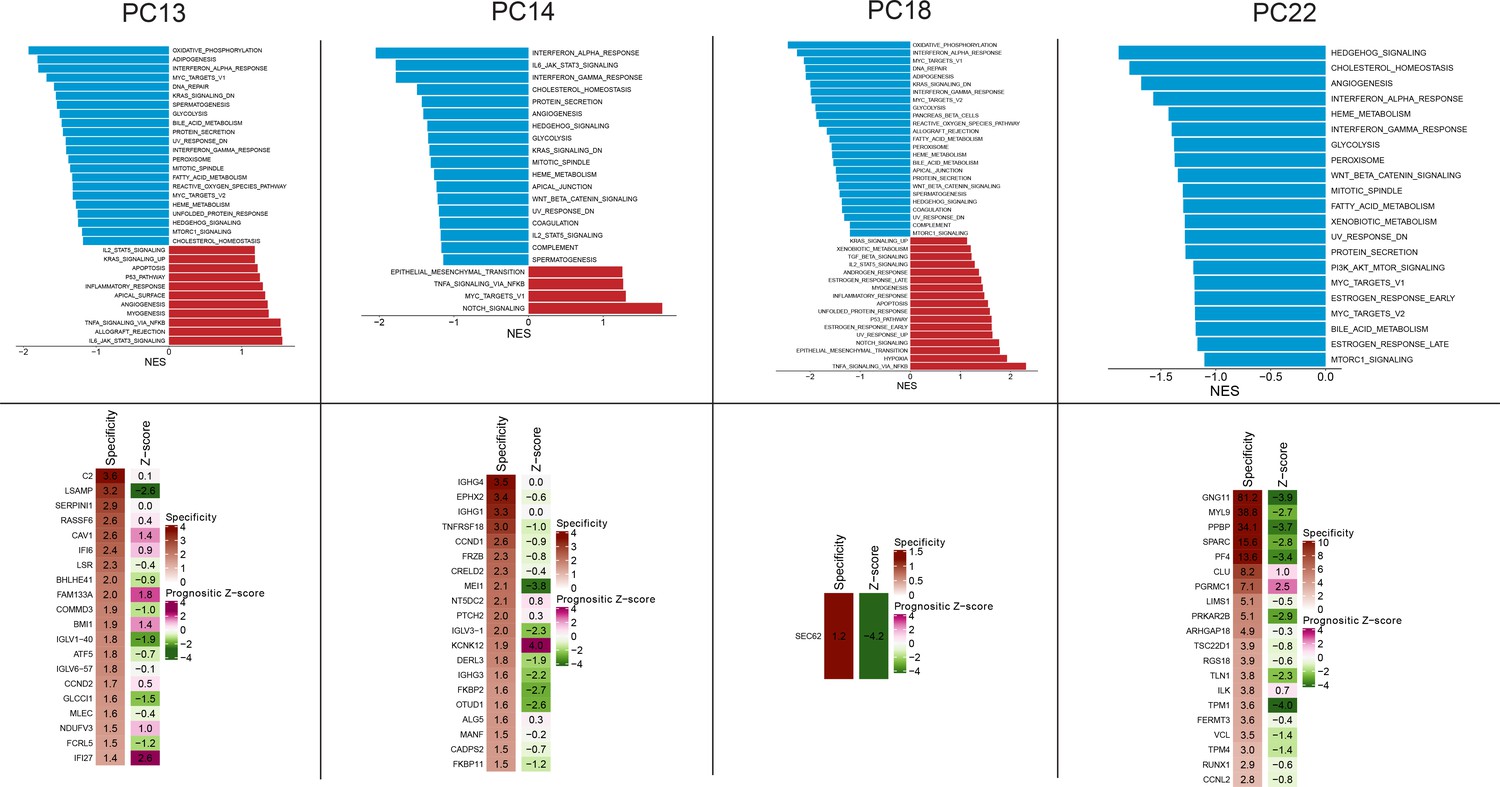
GSEA and PRECOG analysis of plasma clusters 13, 14, 18, and 22.
Upper panel: GSEA enriched pathways of plasma clusters 13, 14, 18, and 22. Lower panel: PRECOG analysis of plasma clusters 13, 14, 18, and 22.
Figure 4 with 1 supplement

Bulk sequencing validation highlights PCC6-specific genes ribonucleotide reductase regulatory subunit M2 (RRM2) as novel prognostic markers in multiple myeloma (MM).
All 75 significant deregulated genes in GSE6647 dataset MM group was acquired, and shown with (A) volcano plot and (B) heat map. (C) Specific genes with markers potential was compared with 75 differentially expressed genes (DEGs) in MM dataset of GSE6647, and 20 genes were acquired and named as deregulated proliferating marker genes in MM (DPMGs). (D) The expression of 20 DPMGs in normal and R-ISS I–III stages were shown, and all seven DPMGs were up-regulated in MM, especially in R-ISS III stage. (E) Clinical parameters of MM samples with 20-gene signature score. The T9/11/15 in E referred to the trisomies of chromosomes 9, 11, and 15. (F) Four DPMGs, SIGMAR1, TIMM13, RRM2, and HINT1, exhibited performance as unfavourable prognostic markers in MM patients. (G) Relative quantification of RRM2 by qRT-PCR in normal plasma cells and MM1S and U266 cell lines. (H) Relative quantification of RRM2 by qRT-PCR in healthy and R-ISS stratified MM patient BM samples. (I) Proliferation phenotype of RRM2 silencing in MM cell line U266. (J) RRM2 silencing caused MM cells arrest in G1 phase. Values represent the means of three experiments ± SD; *p<0.05, **p<0.01, versus untreated control.
Figure 4—figure supplement 1
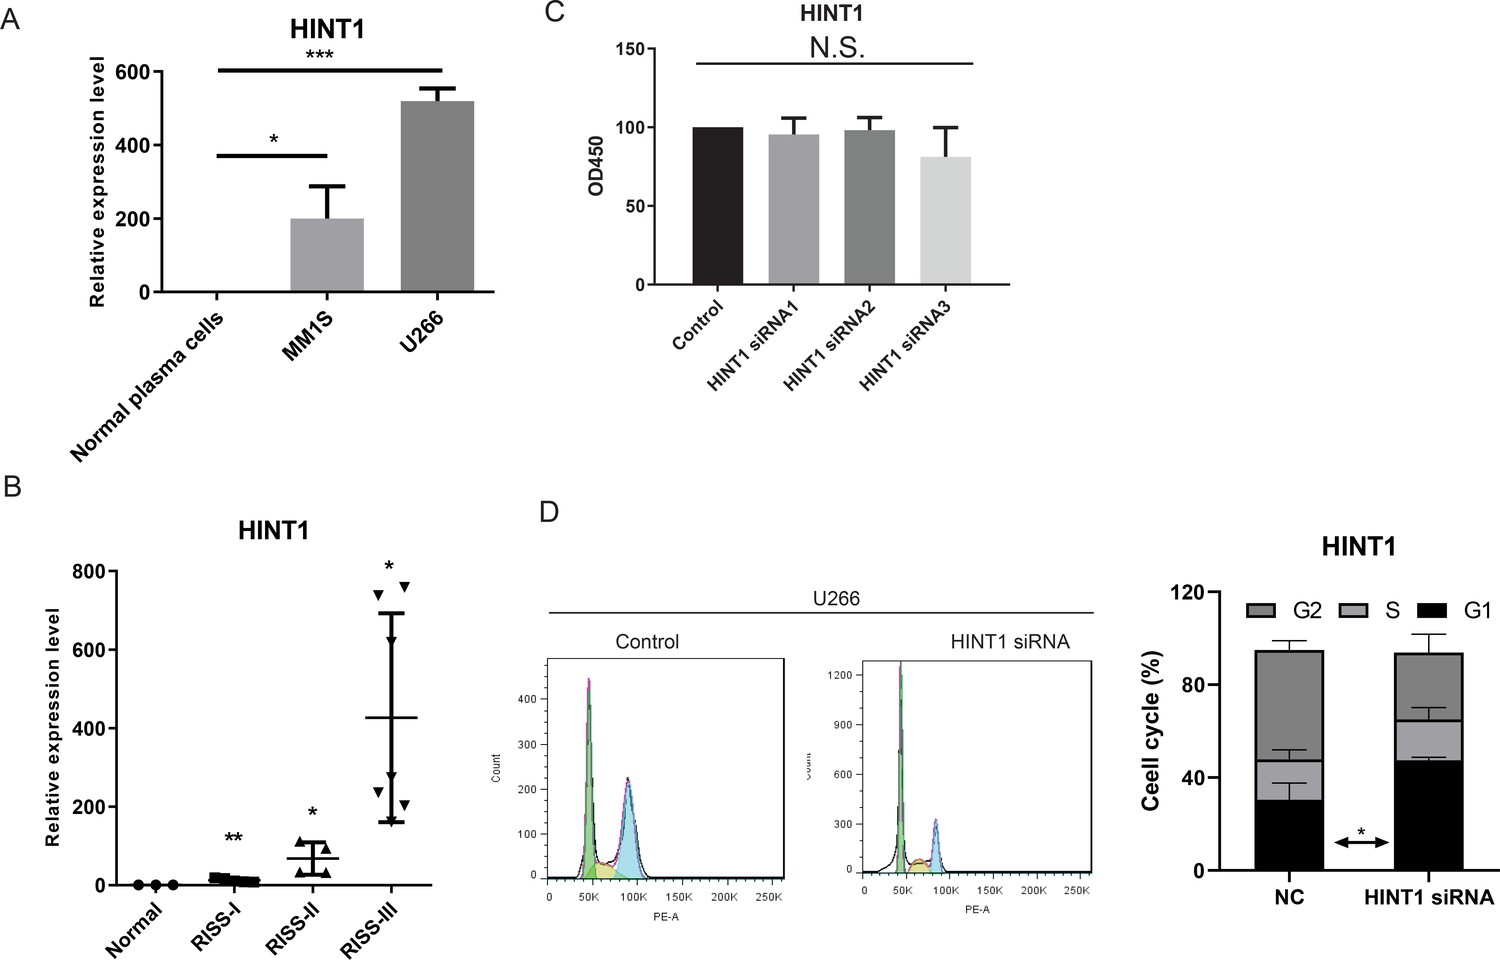
Expression and in vitro cellular functions of histidine triad nucleotide binding protein 1 (HINT1) silencing in myeloma U266 cell lines.
(A) qRT-PCR examination of HINT1 in normal plasma cells, myeloma cell lines MM1S, and U266. (B) qRT-PCR examination of HINT1 in normal, R-ISS I, II, and III stage samples. (C) Proliferation phenotype of HINT1 silencing in MM cell line U266. (D) Cell cycle distribution of HINT1 silencing in MM cell line U266. Values represent the means of three experiments ± SD; *p<0.05, **p<0.01, versus untreated control.
Figure 5
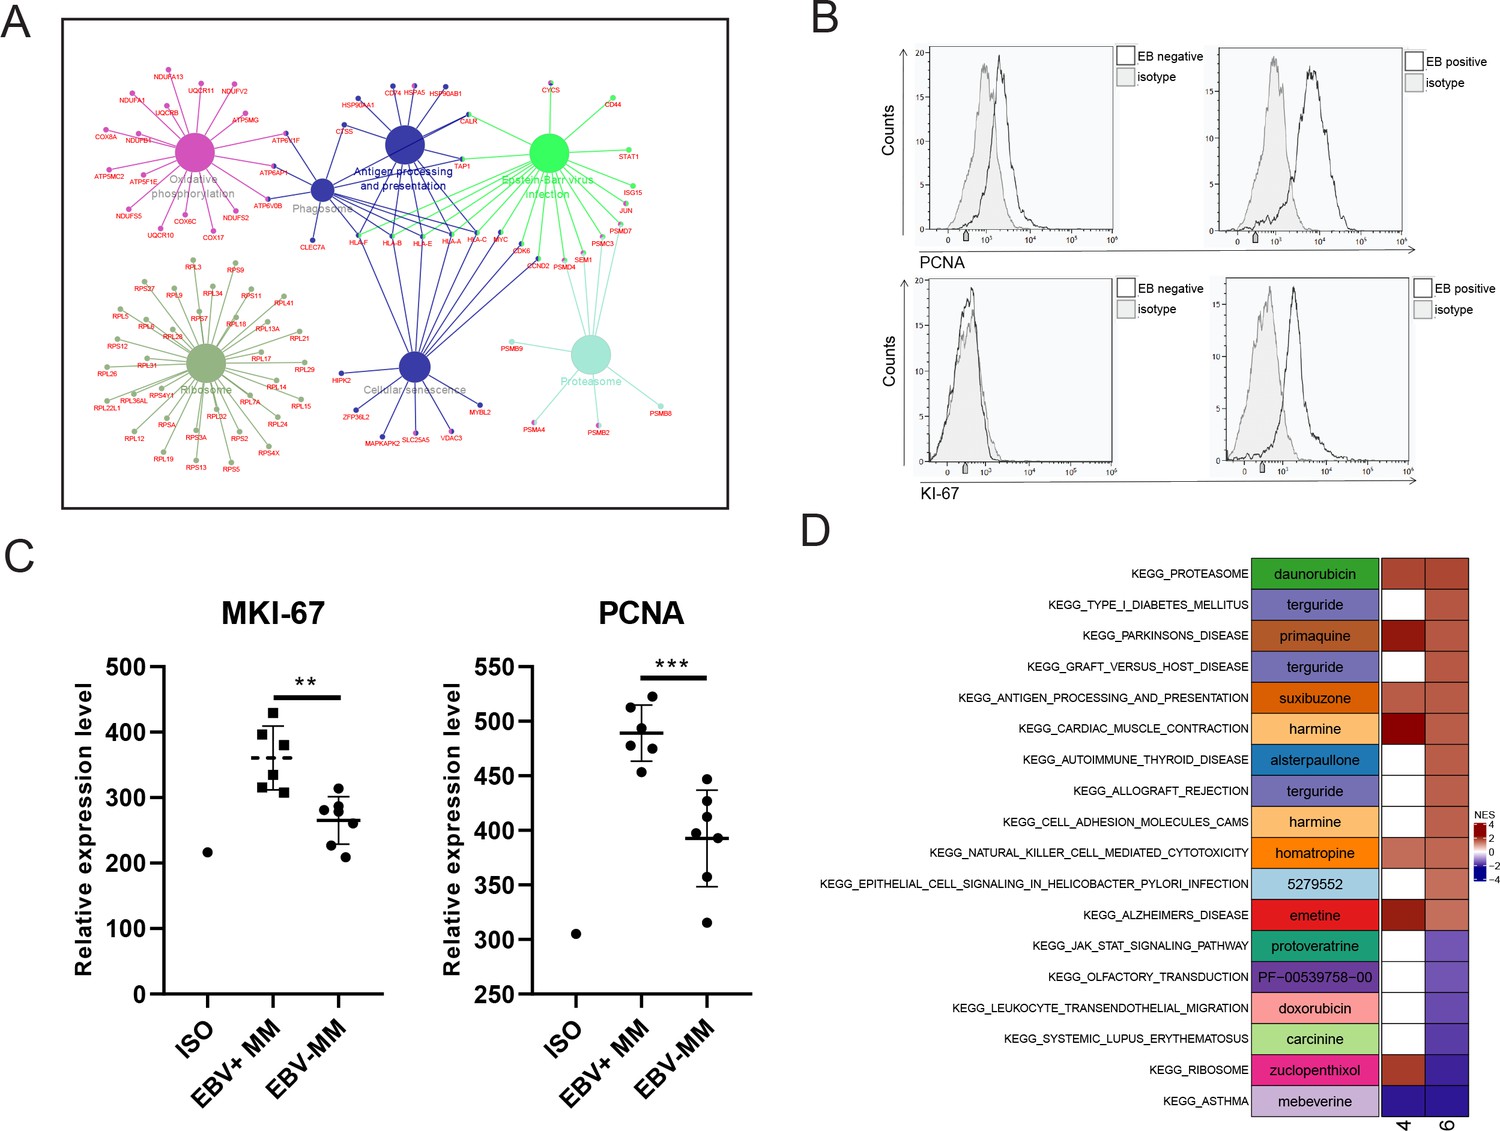
Proliferating plasma cells were increased in Epstein-Barr virus (EBV)-positive multiple myeloma (MM) patients.
(A) Differentially expressed genes (DEGs) in MM R-ISS III stage with I stage were obtained and conferred to functional analysis. (B) Relative expression of MKI-67 and PCNA in EBV-positive and EBV-negative MM patients BM samples. (C) Representative FACS peaks of MKI-67 and PCNA in EBV-positive and EBV-negative MM patients. (D) Based on pathways enriched in plasma clusters 4 and 6, potential drug candidates were acquired, and shown with heat map.
Figure 6 with 1 supplement

T cell population analysis suggested stage-dependent CD8+ T and NKT cell clusters depletion in multiple myeloma (MM).
(A) T cells and NK cells were reclustered, and 21 clusters were acquired. (B) Based on markers expression, CD4+ T, CD8+ T, NK, and NKT cells were shown with UMAP. (C) UMAP of samples distribution of T cells and NK cells. (D) Markers of T cells and NK cells, shown with UMAP. (E) Cluster proportions in healthy control and MM groups. (F) Cluster proportions in healthy control, R-ISS I, II, and III MM groups.
Figure 6—figure supplement 1
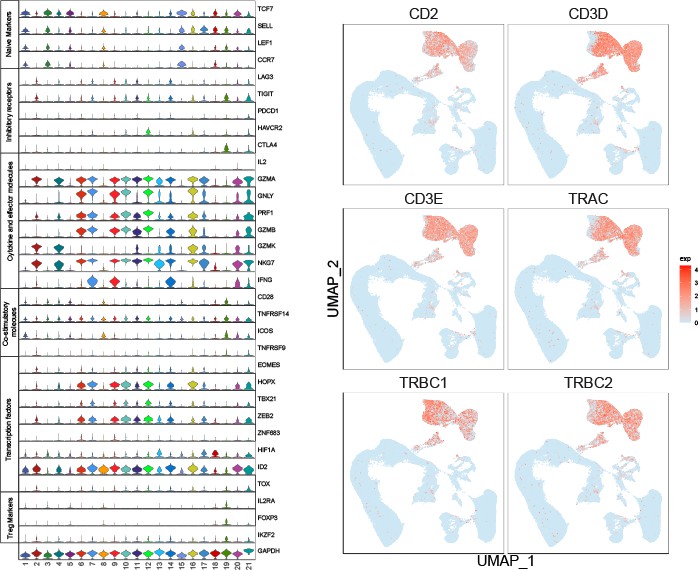
Violin plot showing expression of T cell markers.
Figure 7 with 1 supplement

Stage-dependent expression analysis reveals gene modules in CD8+ T and NKT cell clusters.
To acquire Revised International Staging System (R-ISS) stage-dependent gene expression modules in cluster 4 and 6 populations, MFUZZ was acquired. (A) (Upper) Genes in Cluster 4T cells-Module 7 (T4–M7) were generally characterized as stable expression in healthy controls I-II and dramatic increases in III stage. (Lower) Genes in Cluster 4T cells-Module 11 (T4–M11) were generally marked with gradually decreased expression with R-ISS stage. (B) (Upper) Genes in Cluster 6T cells-Module 3 (T6–M3) were generally characterized as stable expression in healthy controls I-II and dramatic increases in III stage. (Lower) Genes in Cluster 6T cells-Module 7 (T6–M7) were generally characterized as stable in healthy controls, R-ISS I-II and dramatic increases in III stage. (C) (Upper) Functional network of genes in T4-M7 highlights haemopoiesis and (lower) functional network of genes in T4-M11 suggested T-helper 1 cell lineage commitment. (D) (Upper) Functional network of genes in T6-M3 indicates genes in megakaryocyte differentiation and regulation of myeloid cell differentiation. (Lower) Functional network of genes in T6-M7 indicates genes in leukocyte activation.
Figure 7—figure supplement 1
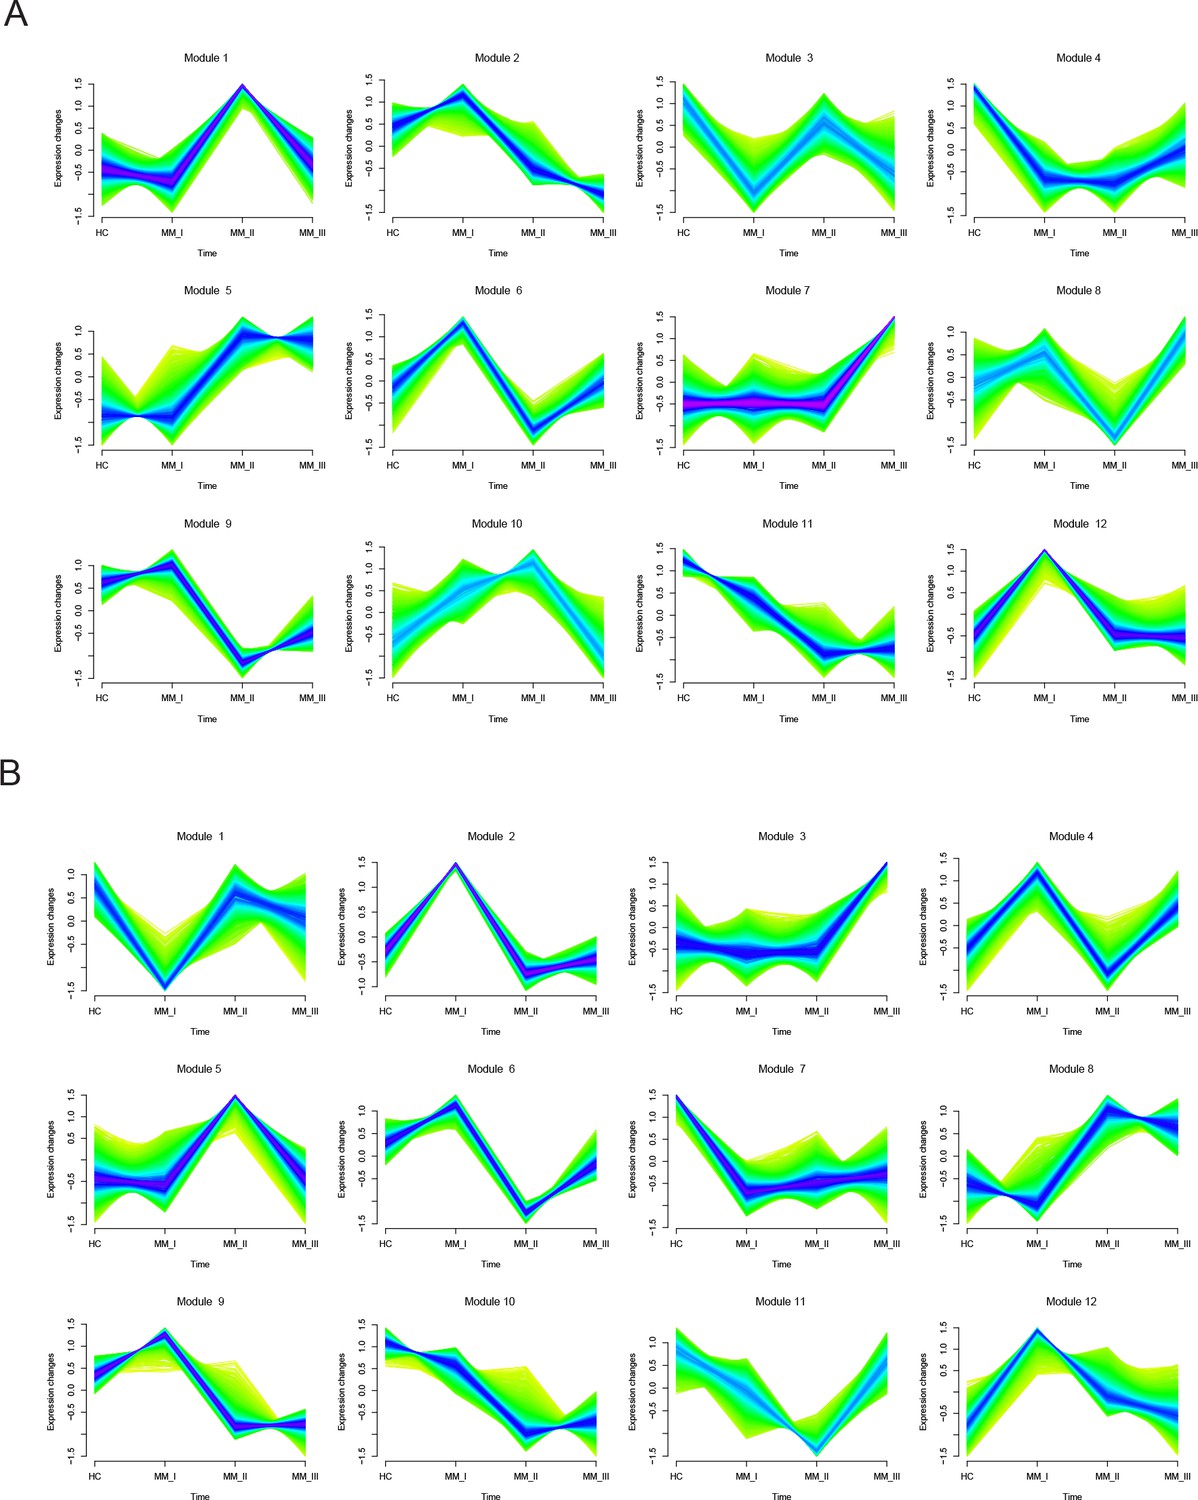
MFUZZ analysis identifies 12 modules in each of T4 and T6 T cells.
(A) MFUZZ analysis identifies 12 modules in each of T4. (B) MFUZZ analysis identifies 12 modules in each of T6.
Figure 8 with 2 supplements
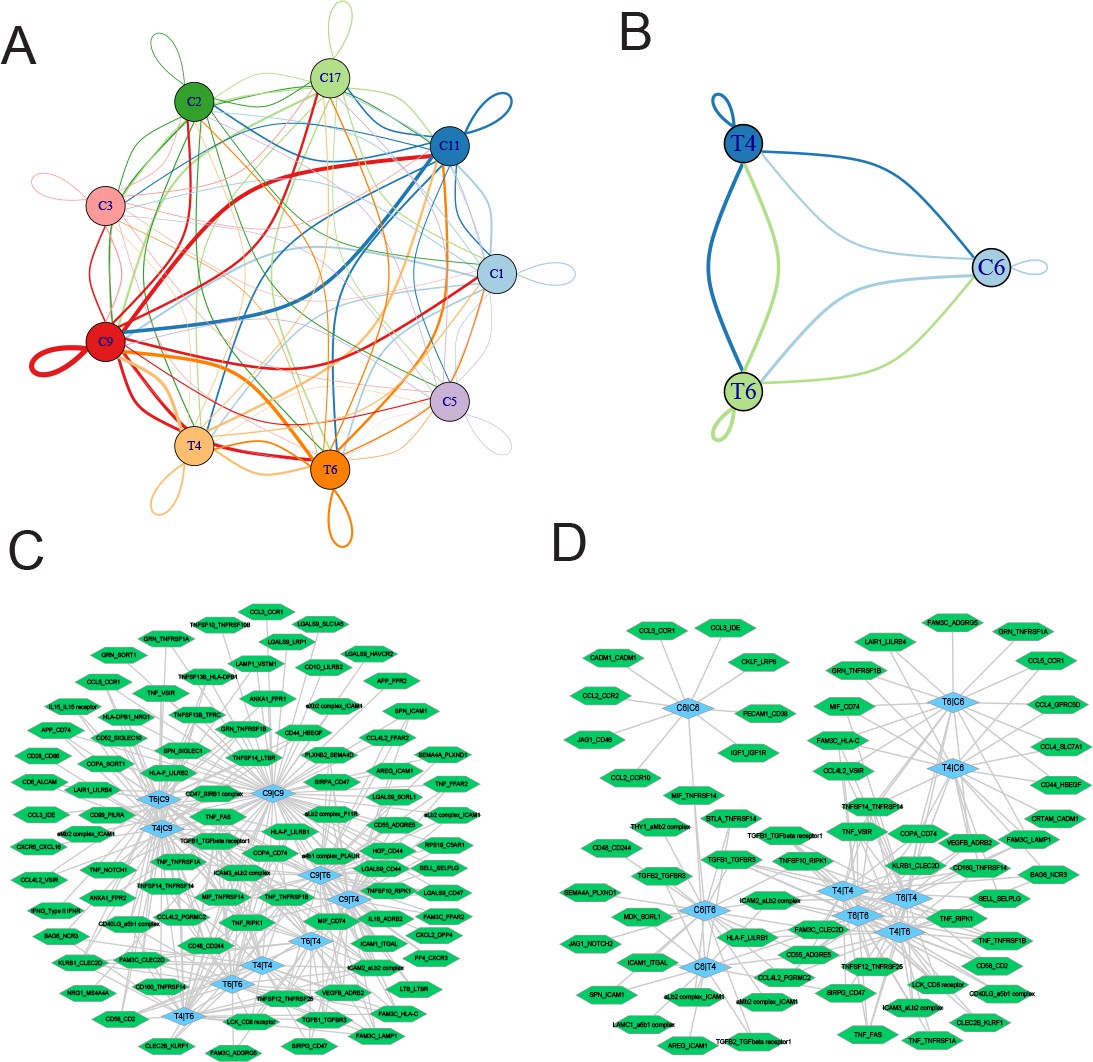
Ligand-receptor pairs and potential immunotherapeutic targets in CD8+ T-myeloid and CD8+ T/NKT-plasma cells communication.
(A) Cell-cell communications showing the interaction numbers between myeloid cells and T4 CD8+ T and T6 NKT cells. (B) Paracrine ligand-receptor interaction pairs between myeloid cells and T4 CD8+ T and T6 NKT cells. (C) Cell-cell communications showing the interaction numbers between PC6 plasma cells and T4 CD8+ T, T6 NKT cells. (D) Paracrine ligand-receptor interaction pairs between PC6 plasma cells and T4 CD8+ T, T6 NKT cells.
Figure 8—figure supplement 1
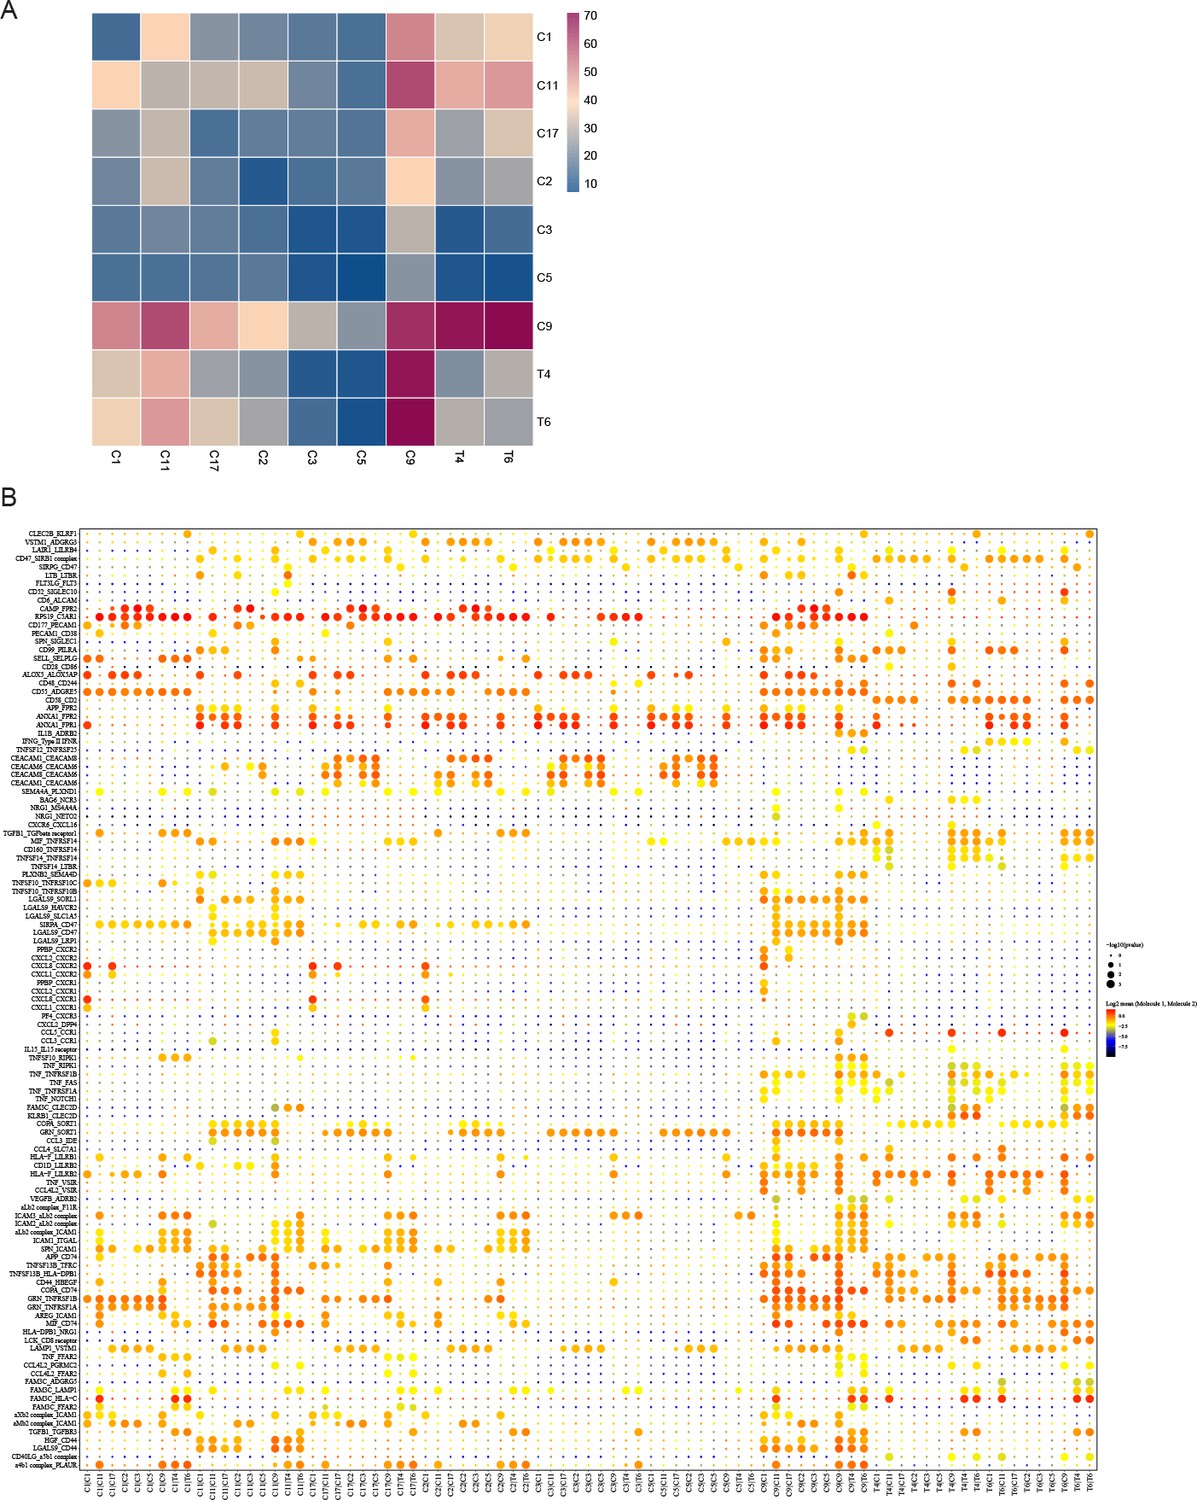
Ligand-receptors interaction pairs between T cells with myeloid cells.
(A) Ligand-receptors interaction number heat map between T cells with myeloid cells. (B) Ligand-receptors interaction heat map between T cells with myeloid cells.
Figure 8—figure supplement 2
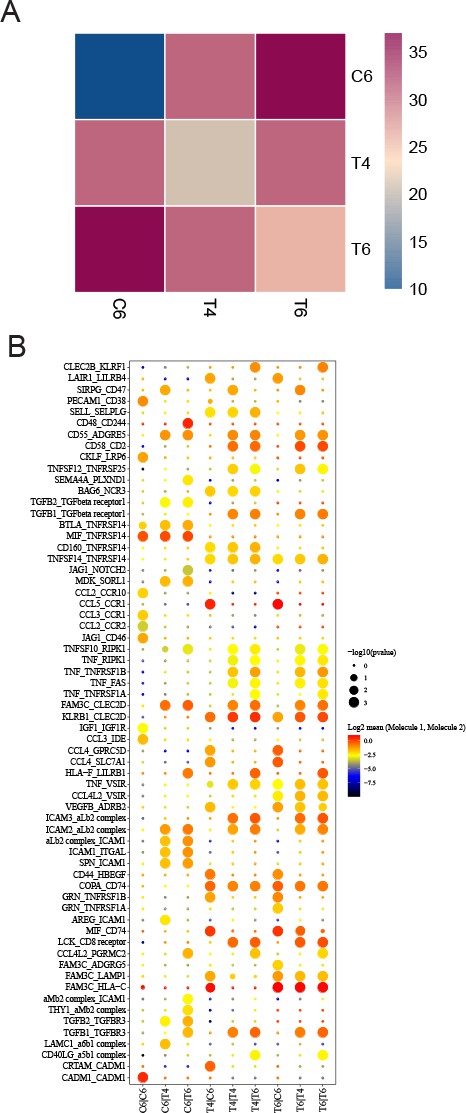
Ligand-receptor interaction pairs between T cells with proliferating plasma cells.
(A) Ligand-receptors interaction number heat map between T cells with proliferating plasma cells. (B) Ligand-receptors interaction heat map between T cells with proliferating plasma cells.
Author response image 1
Tables
Table 1
Cell markers used for cell type identification.
| Cell type | Clusters | Cell markers |
|---|---|---|
| Plasma cells | 4,6,13,14,18,22 | MZB1,SDC1 |
| B cells | 19,20,21,23 | CD79A,CD79B |
| CD4+T cells | 10,12 | CD3D,CD3E,CD4 |
| CD8+T cells | 7,8,16,24 | CD3D,CD3E,CD8A |
| Myeloid cells | 1,2,3,5,9,11,17 | LYZ, S100A8 |
| Immature red cells | 15 | CA1, HBM |
Additional files
-
MDAR checklist
- https://cdn.elifesciences.org/articles/75340/elife-75340-mdarchecklist1-v2.docx
-
Supplementary file 1
Differential expressed genes in Plasma cell cluster 6 (PC6).
- https://cdn.elifesciences.org/articles/75340/elife-75340-supp1-v2.zip
Download links
A two-part list of links to download the article, or parts of the article, in various formats.
Downloads (link to download the article as PDF)
Open citations (links to open the citations from this article in various online reference manager services)
Cite this article (links to download the citations from this article in formats compatible with various reference manager tools)
Revised International Staging System (R-ISS) stage-dependent analysis uncovers oncogenes and potential immunotherapeutic targets in multiple myeloma (MM)
eLife 11:e75340.
https://doi.org/10.7554/eLife.75340


