Oversized cells activate global proteasome-mediated protein degradation to maintain cell size homeostasis
- Department of Molecular Genetics, University of Toronto, Canada
- Cell Biology, The Hospital for Sick Children, Toronto, Canada
- Department of Chemical and Systems Biology, Stanford University, United States
- Department of Molecular Cell Biology, University of California at Berkeley, United States
- Department of Cell Biology, UT Southwestern Medical Center, United States
Figures
Figure 1 with 1 supplement
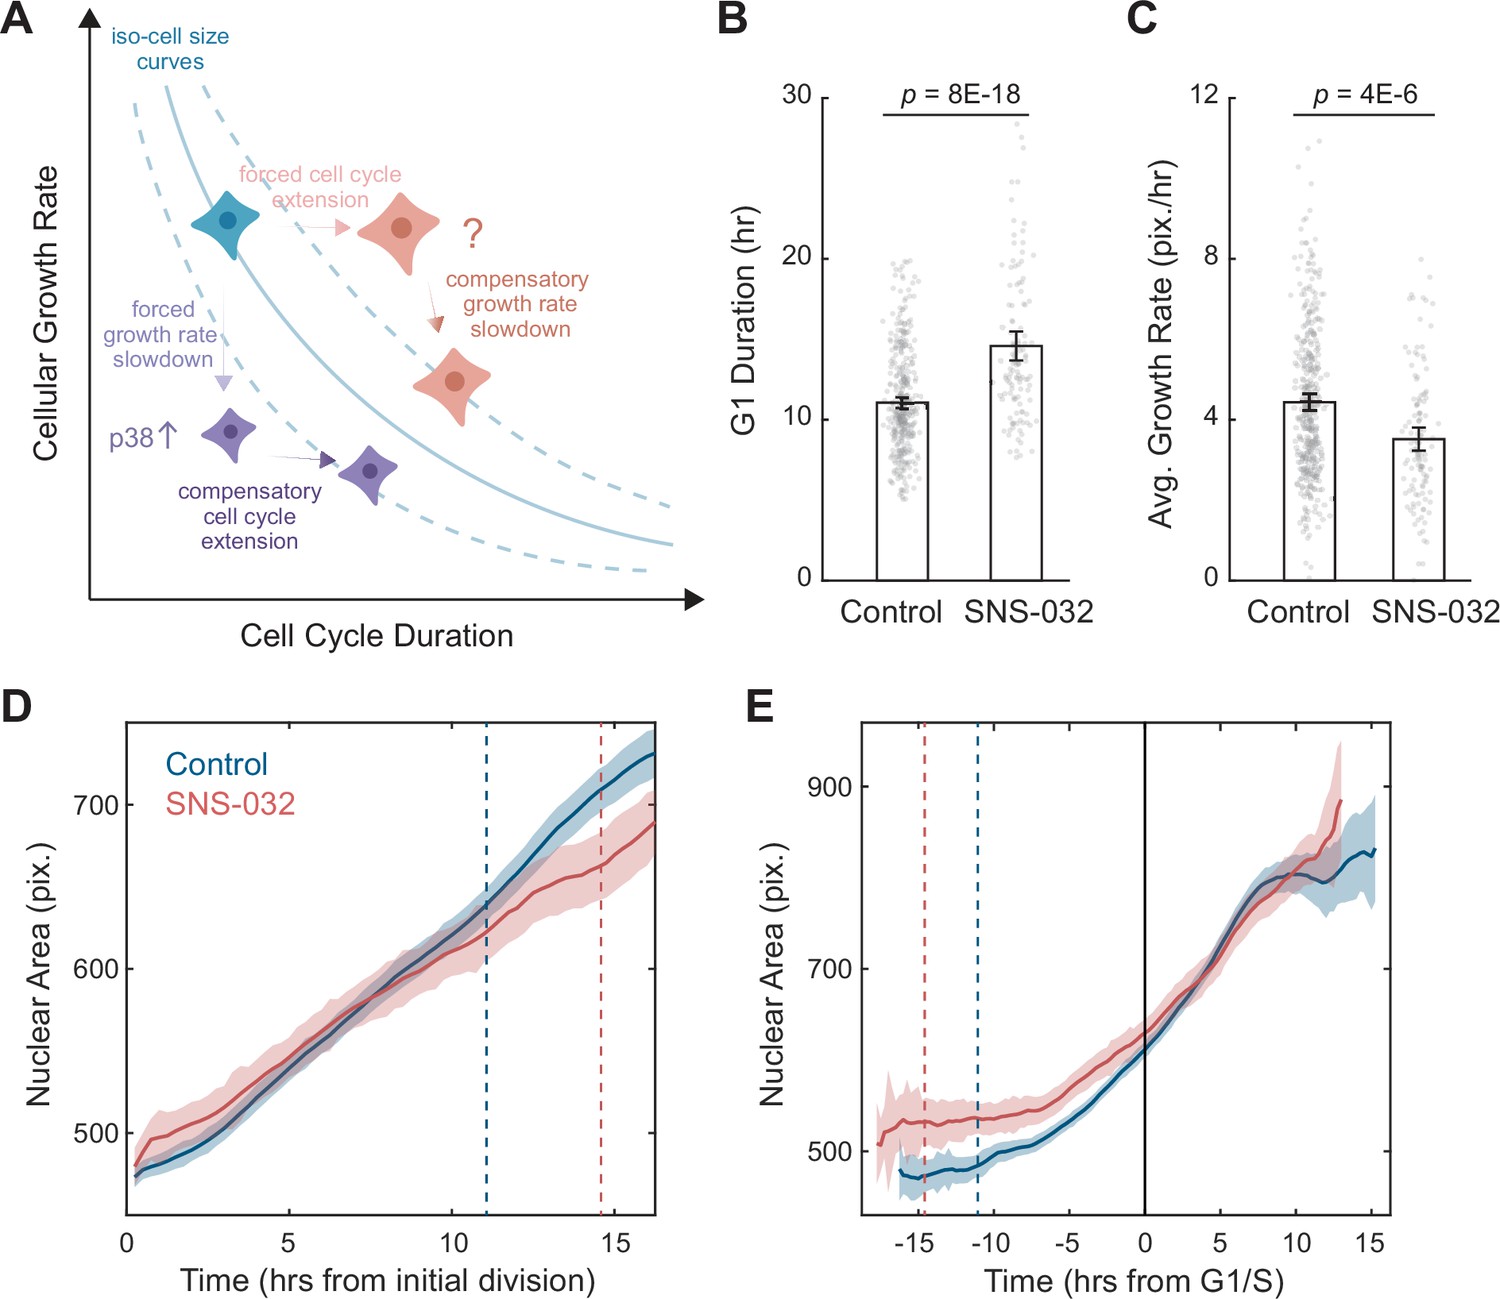
A quantitative assay for the size-dependent regulation of cellular growth rate.
(A) Schematic showing the model of cell size control as described by Ginzberg et al., 2018. The solid blue line represents an iso-cell size curve: combinations of cellular growth rates (mass accumulation rates) and cell cycle length that result in the same cell size. The dashed blue lines represent iso-size curves at larger (upper curve) or smaller (lower curve) cell sizes. Perturbations that decrease cellular growth rate (e.g., mTOR inhibition) result in an initial decrease in cell size, followed by an adaptation involving the activation of p38 MAPK pathway (Liu et al., 2018) to prolong the cell cycle, preventing further decrease in size (purple cells). Perturbations that lengthen the cell cycle (e.g., CDK2 inhibition) result in an initial increase in cell size, followed by a compensatory slowdown of growth rate that prevents further increase in cell size (red cells). (B, C) Bar plots comparing the G1 duration (B) and average growth rate (C) for control (0.1% v/v DMSO, N = 365 single-cell tracks) and CDK2-inhibited RPE1 cells (20 nM SNS-032, N = 125), measured by time-lapse live-cell imaging. Nuclear area is measured as a proxy of cell size. Error bars represent mean ± 95% CIs. p-values are calculated using two-sample t-test. (D, E) Average nuclear area as a function of time for control and CDK2-inhibited cells, with growth trajectories either synchronized to the first division/birth (D) or the time of G1/S transition (E). Shaded areas mark 95% CIs. In (D), dashed lines mark the average time of G1/S transition. In (E), the solid black line marks the time of G1/S transition, and dashed lines mark the average time of first birth/division. Note that CDK2-inhibited cells had larger initial sizes, progressed through G1/S later, and showed slower growth in size (i.e., shallower slope), compared to the control. Also see Figure 1—figure supplement 1.
-
Figure 1—source data 1
File contains the source code and source data necessary to generate Figure 1 using Matlab.
Figure1_Script.m generates Figure 1B-E.
- https://cdn.elifesciences.org/articles/75393/elife-75393-fig1-data1-v2.zip
Figure 1—figure supplement 1
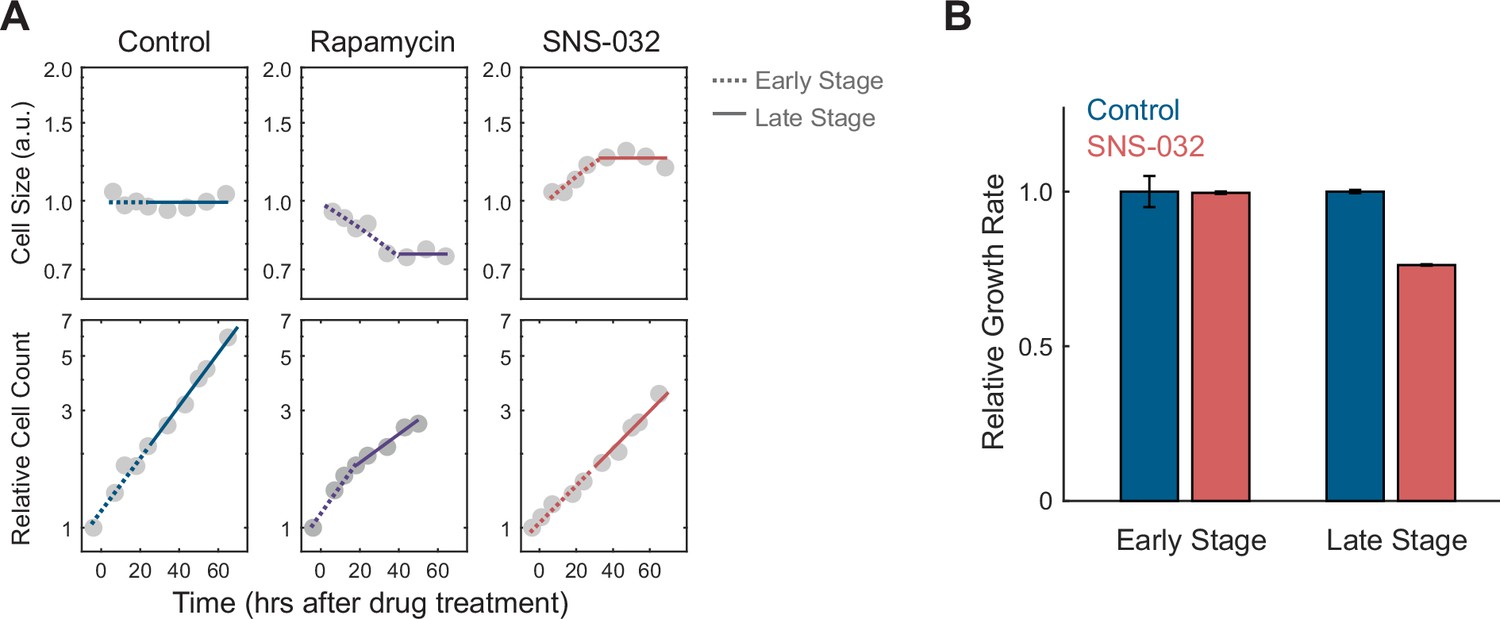
RPE1 cells under CDK2 inhibition compensate for prolonged growth with slower rates of mass accumulation.
(A) Measurements of average cell size (top) measured by a total protein dye (SE) and relative cell count (bottom) at different time points after treatment with the mTORC1 inhibitor rapamycin (70 nM) or CDK2 inhibitor SNS-032 (19 nM), compared to the control (0.1% v/v DMSO). Note the initial cell size changes following mTORC1 or CDK2 inhibition (0 to ~24 hr, period defined as the early stage), and consequent plateauing in cell size (period defined as the late stage). Y-axes are in log scale. Each cell size datapoint is an average from a population of >2000 cells. Values of cell size are normalized to control, such that the average cell size of control populations has the value of 1. Values of cell count are normalized to the cell number at the first time point. Dashed and solid lines represent linear fitting of the early and late stages, respectively. (B) Cellular growth rate for control and CDK2-inhibited cells at early and late stages, relative to control, estimated from the same data presented in (A). Error bars represent 95% CIs of the fitting. Figure is reproduced from Figure 6A–B from Ginzberg et al., 2018 to demonstrate the assay.
-
Figure 1—figure supplement 1—source data 1
File contains the source code and source data necessary to generate Figure 1—figure supplement 1 using Matlab.
Figure1S1A_Script.m generates Figure 1—figure supplement 1A. Figure1S1B_Script.m generates Figure 1—figure supplement 1B.
- https://cdn.elifesciences.org/articles/75393/elife-75393-fig1-figsupp1-data1-v2.zip
Figure 2
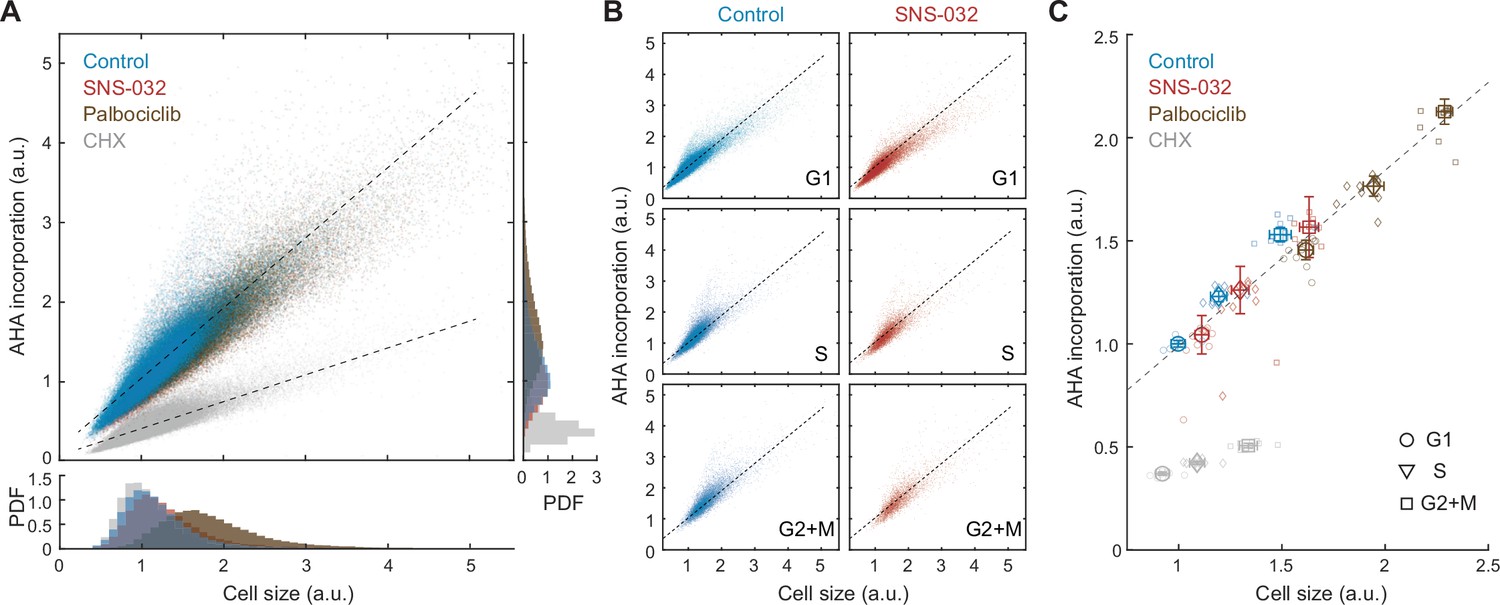
Global rates of protein synthesis scale with cell size.
(A) Scatterplot showing single-cell measurements of global protein synthesis rates (AHA incorporation) as a function of cell size (SE) for control (0.1% v/v DMSO) and cells under 48 hr treatment of the protein synthesis inhibitor cycloheximide (CHX, 3 µM), the CDK2 inhibitor SNS-032 (25 nM), and the CDK4/6 inhibitor palbociclib (50 nM). Lines show linear fit. Bottom and right panels show histograms of cell size and AHA incorporation, respectively. (B) Scatterplots as in panel (A) plotted separately for G1, S, and G2+M phase cells under control or CDK2 inhibition. (C) Median rates of protein synthesis for G1, S, and G2+M cells under each of the experimental conditions. Data presented as fold-change over the average of control cells in G1, with error bars indicating ±95% CI, N = 10 replicate wells.
-
Figure 2—source data 1
File contains the source code and source data necessary to generate Figure 2 using Matlab.
Figure2_Script.m generates Figure 2A-C.
- https://cdn.elifesciences.org/articles/75393/elife-75393-fig2-data1-v2.zip
Figure 3 with 6 supplements
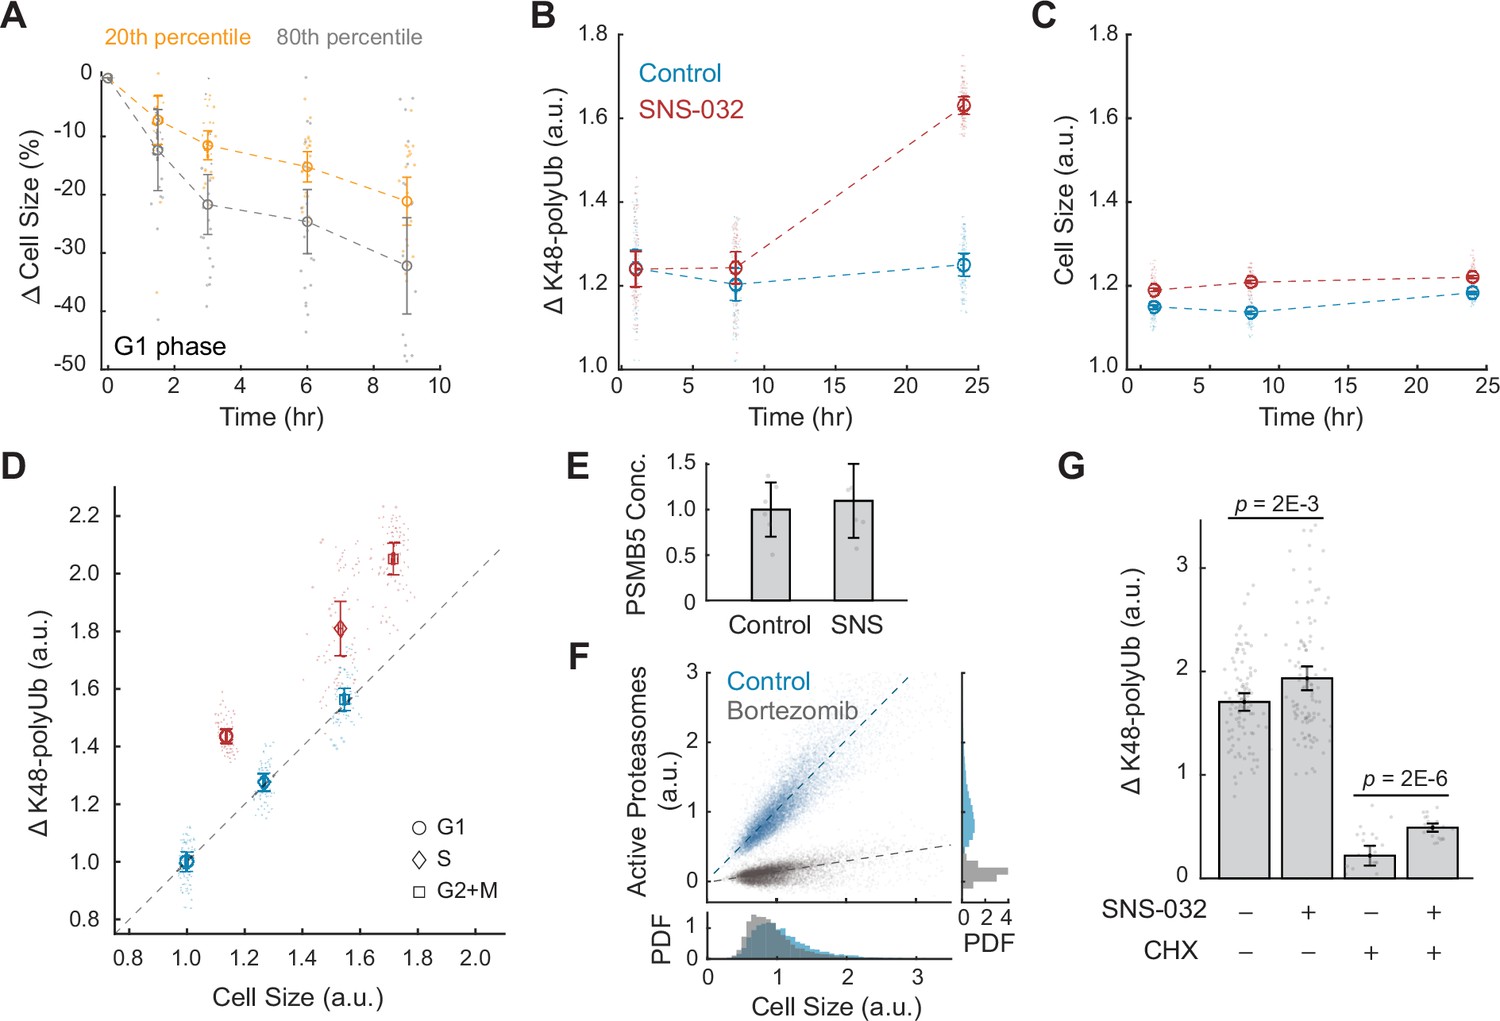
Large cells have higher rates and efficiency of global protein degradation.
(A) Change in cell size measured by SE for small (20th percentile) and large (80th percentile) G1 cells following treatment with the protein synthesis inhibitor cycloheximide (CHX, 10 µM) compared to time point 0 (0.1% v/v DMSO). Cell size changes are expressed as the fraction of the median size at time point 0. Error bars represent mean ± 95% CI (N = 22 replicate wells). (B, C) Proteasome-mediated global protein degradation rate (ΔK48-polyUb, B) and cell size (SE, C) over time in control (0.1% v/v DMSO) and in cells treated with the CDK2 inhibitor SNS-032 (25 nM) for 1, 8, and 24 hr. To measure ΔK48-polyUb, cells were immunostained with a K48 linkage-specific polyubiquitin antibody that quantifies the total K48-linked polyubiquitinated proteins (K48-polyUB). ΔK48-polyUb is defined as the clearance rate of K48-polyUb, calculated as the difference between K48-polyUB measured with or without a short-term (30 min) treatment of the proteasome inhibitor Carfilzomib (CFZ, 8 µM) before fixation. Data presented as mean ± 95% CI, N = 9 replicate wells. (D) ΔK48-polyUb as a function of cell size (SE) for control and CDK2-inhibited cells (25 nM SNS-032, 24 hr), separated by cell cycle stage. Values are normalized to the average of control cells in G1. Data presented as mean ± 95% CI, N = 9 replicate wells. Right-tailed two-sample t-tests indicate significant increase in ΔK48-polyUb of the SNS-032-treated cells compared to the control across the cell cycle: p-values = 7E-95 (G1), 3E-62 (S), and 3E-72 (G2+M). Dashed line represents 1:1 proportional changes in ΔK48-polyUb and cell size (y = x). Note the proportional changes in ΔK48-polyUb and size for control and disproportionately higher increases in ΔK48-polyUb compared to size for SNS-032 treated cells. (E) Quantification of PSMB5 concentrations from six replicates of western blots (see Figure 3—figure supplement 5), presented as fold-change of control. Error bars present mean ± 95% CI. Western blots were loaded with the same amount of cell lysates, thus data shown here reflect PSMB5 levels normalized by cell size. (F) Scatterplot of single-cell measurements of total proteasome activity (MV151) as a function of cell size (SE) for control (0.1% v/v DMSO) and bortezomib-treated (1 µM) cells, along with histograms showing distribution of cell size (bottom) and proteasome activity (right). Both measurements are shown as relative values to the average of the control. Note the level of active proteasomes may be negative as the quantification was performed after subtraction of background. Lines show linear fit. (G) ΔK48-polyUb for control (0.1% v/v DMSO) and SNS-032 (25 nM, 24 hr) treated cells with or without a short-period (3 hr) treatment of the protein synthesis inhibition CHX (3 µM) before fixation, shown for cells at the G1/S transition. Data presented as mean ± 95% CI. N = 5 and 10 replicate wells, respectively, for conditions with and without CHX. See Figure 3—figure supplement 6 for cells at other cell cycle stages.
-
Figure 3—source data 1
File contains the source code and source data necessary to generate Figure 3A, Figure 3—figure supplement 1 using MATLAB.
Figure3A_Script.m generates Figure 3. Figure3S1_Script.m generates Figure 3—figure supplement 1A-B.
- https://cdn.elifesciences.org/articles/75393/elife-75393-fig3-data1-v2.zip
-
Figure 3—source data 2
File contains the source code and source data necessary to generate Figure 3B–D, Figure 3—figure supplement 2; Figure 3—figure supplements 3 and 4 using MATLAB.
Figure3BCD_S3_Script.m generates Figure 3B–D, Figure 3—figure supplement 3. Figure3S2_Script.m generates Figure 3—figure supplement 2A-B. Figure3S4_part1_Script.m and Figure3S4_part2_Script.m generate Figure 3—figure supplement 4A-I.
- https://cdn.elifesciences.org/articles/75393/elife-75393-fig3-data2-v2.zip
-
Figure 3—source data 3
File contains the source code and source data necessary to generate Figure 3E–F, Figure 3—figure supplement 5B using MATLAB.
Figure3E_3S5B_Script.m generates Figure 3E, Figure 3—figure supplement 5B. Figure3F_Script.m generates Figure 3F.
- https://cdn.elifesciences.org/articles/75393/elife-75393-fig3-data3-v2.zip
-
Figure 3—source data 4
File contains the source code and source data necessary to generate Figure 3G, Figure 3—figure supplement 6 using MATLAB.
Figure3G_3S6_Script.m generates Figure 3G, Figure 3—figure supplement 6A–D.
- https://cdn.elifesciences.org/articles/75393/elife-75393-fig3-data4-v2.zip
Figure 3—figure supplement 1

Large cells show increased protein degradation throughout the cell cycle.
(A, B) Changes in cell size (SE) for small (20th percentile) and large (80th percentile) cells following treatment with 10 µM cycloheximide, in S (A) or G2+M phase (B), compared to time point 0 (0.1% v/v DMSO). Cell size changes are expressed as the fraction of the median size at time point 0. Error bars present mean ± 95% CI across replicate wells (N = 22). See Figure 3A for cells in G1 phase.
Figure 3—figure supplement 2

Short treatment of the proteasome inhibitor carfilzomib (CFZ) does not affect cell size or fraction of cells in different cell cycle stages.
(A, B) Bar plots showing cell size (A) or fraction of cells in G1, S, and G2 phase (B) of control (0.1% v/v DMSO) or cells treated with 30 min of 8 µM CFZ. Error bars present mean ± 95% CI (N = 27 replicate wells).
Figure 3—figure supplement 3
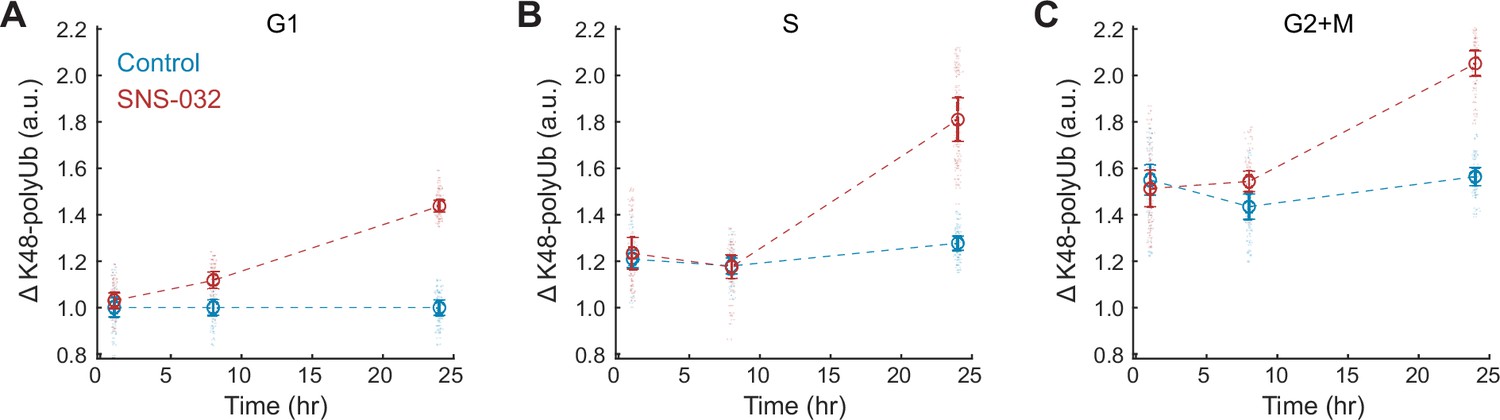
CDK2 inhibition increases K48-polyUb turnover across cell cycle stages.
(A–C) Clearance of K48-polyUb (ΔK48-polyUb) for control (0.1% v/v DMSO) and SNS-032 (25 nM) treated cells in G1 (A), S (B), and G2 (C) phase at 1, 8, and 24 hr of treatment. Data presented as mean ± 95% CI, N = 9 replicate wells.
Figure 3—figure supplement 4
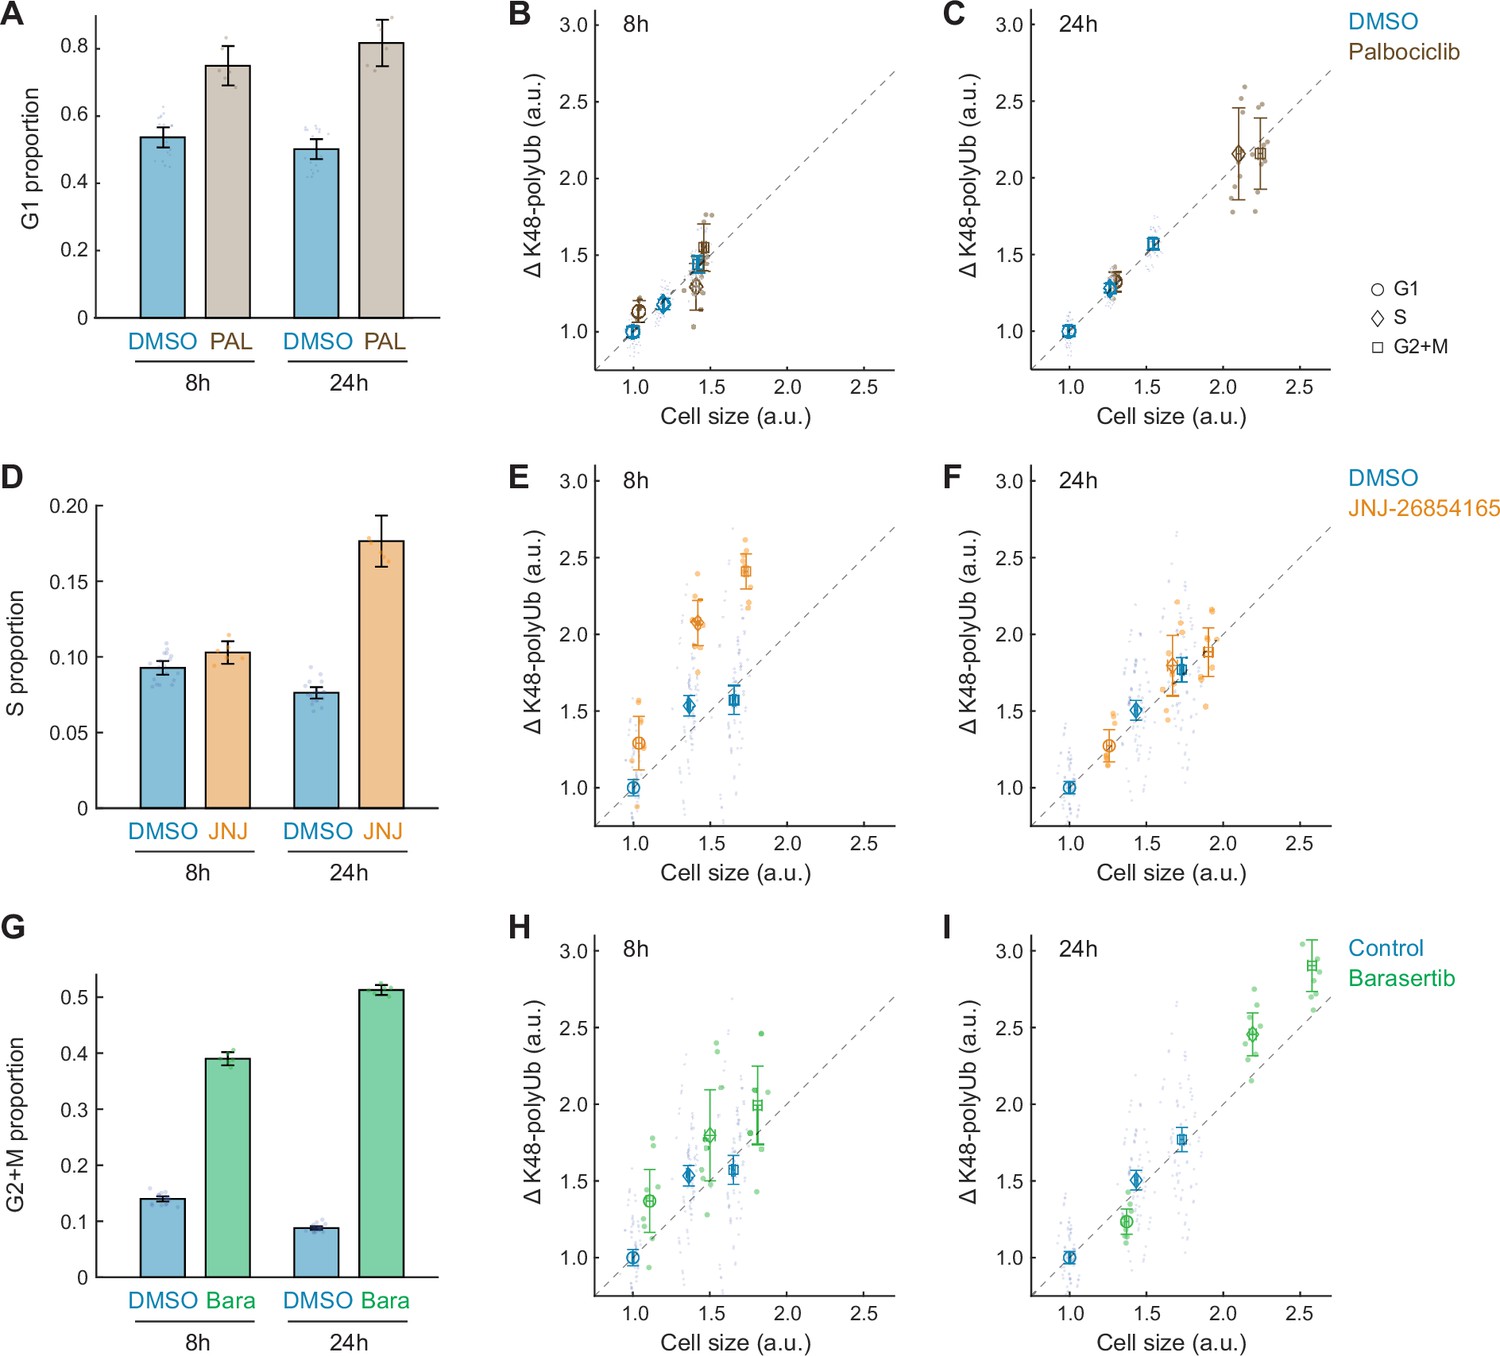
Changes in cell size and protein degradation rates in response to other cell cycle perturbations.
(A) The fraction of G1 phase cells in control (0.1% v/v DMSO) and the CDK4/6 inhibitor, palbociclib (50 nM) at 8 and 24 hr of treatment. (B, C) ΔK48-polyUb for control and palbociclib-treated cells, separately at 8 (B) and 24 (C) hr of treatment. Note that CDK4/6 inhibition results in an increase in ΔK48-polyUb, proportional to the increase in cell size. (D) The fraction of S phase cells in control (0.1% v/v DMSO) and an inhibitor of S phase progression, JNJ-26854165 (300 nM) at 8 and 24 hr of treatment. (E, F) ΔK48-polyUb for control and JNJ-26854165-treated cells, separately at 8 (B) and 24 (C) hr of treatment. (G) The fraction of G2+M phase cells in control (0.1% v/v DMSO) and an inhibitor of mitosis progression, barasertib (25 nM) at 8 and 24 hr of treatment. (H, I) ΔK48-polyUb for control and barasertib treated cells, separately at 8 (B) and 24 (C) hr of treatment. Error bars show mean ± 95% CI. N = 10 and 3 replicate wells, respectively, for the control and drug conditions. Note that JNJ-26854165 (8 hr) and barasertib (24 hr) both result in disproportionately larger increases in ΔK48-polyUb compared to the increases in cell size, suggesting an increased efficiency in protein degradation.
Figure 3—figure supplement 5

CDK2 inhibition does not significantly affect proteasome content per unit mass.
(A) Western blots of CDK2-inhibited cells under 44 hr treatment of either 175 nM PHA848125 (PHA) or 39 nM SNS-032 (SNS). Note that western blot lanes were loaded with lysates of equal protein. Vinculin is shown as a loading control. (B) Quantification of PSMB5 levels from six replicates of Western blots, presented as fold-change of control. Data presented as mean ± 95% CI.
-
Figure 3—figure supplement 5—source data 1
File contains uncropped and labeled gels for Figure 3—figure supplement 5A.
- https://cdn.elifesciences.org/articles/75393/elife-75393-fig3-figsupp5-data1-v2.zip
-
Figure 3—figure supplement 5—source data 2
File contains raw unedited gels for Figure 3—figure supplement 5A.
- https://cdn.elifesciences.org/articles/75393/elife-75393-fig3-figsupp5-data2-v2.zip
Figure 3—figure supplement 6
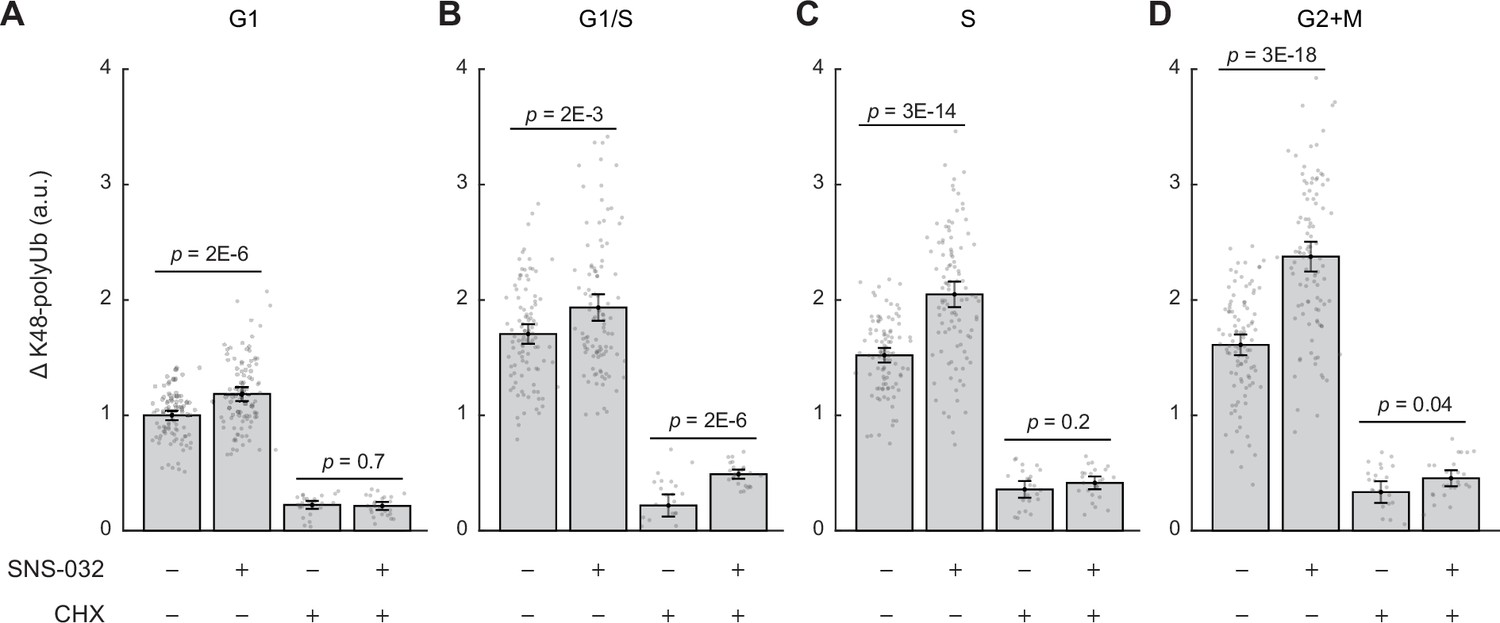
Size-dependent compensatory degradation involves nascently translated and long-lived proteins.
(A–D) ΔK48-polyUb for control (0.1% v/v DMSO) and SNS-032 (25 nM, 24 hr) treated cells with or without a short-period (3 hr) treatment of the protein synthesis inhibition cycloheximide (CHX, 3 µM) before fixation, separately for cells in G1 (A), G1/S transition (B), S (C), and G2+M (D) phase. Data presented as mean ± 95% CI. N = 5 and 10 replicate wells, respectively, for conditions with and without CHX. Note the significant reduction in ΔK48-polyUb after CHX treatment, suggesting that nascent proteins account for a substantial fraction of the proteasomal flux. The difference between SNS-/CHX+vs. SNS+/CHX+conditions reflects the degradation rates of only long-lived proteins.
Figure 4 with 2 supplements
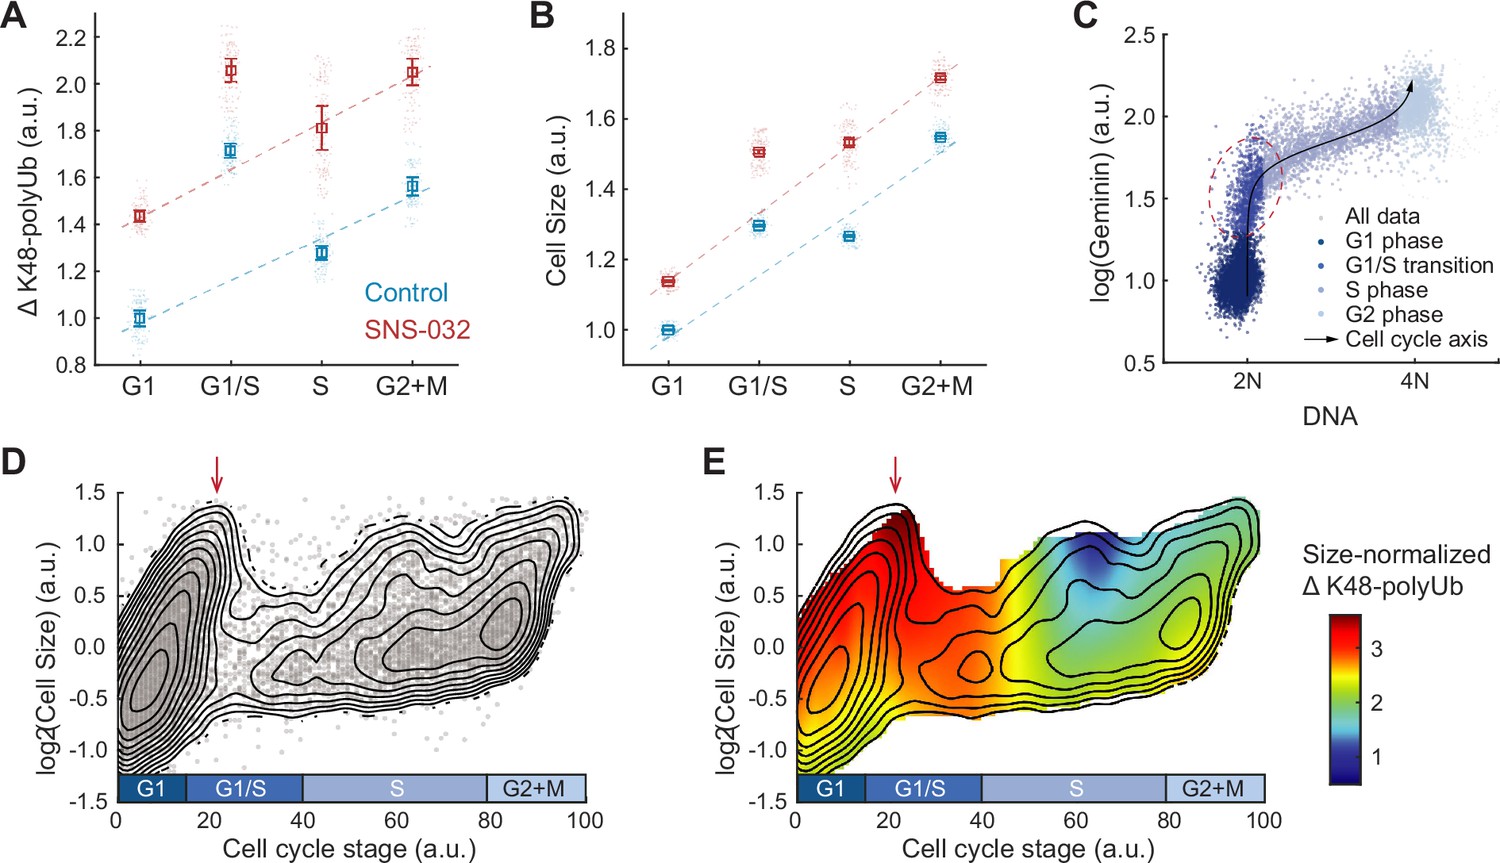
Hyperactivation of global protein degradation in naturally large cells at the G1/S transition.
(A, B) ΔK48-polyUb (A) and cell size (SE, B) for control (0.1% v/v DMSO) and cells treated with SNS-032 (25 nM, 24 hr), separated by cell cycle stage. Data presented as median ± 95% CI, N = 9 replicate wells. Lines show linear fit, excluding G1/S data, which deviates from the trend of G1, S, and G2+M cells. (C) Single-cell measurements of DNA content (DAPI) and the cell cycle reporter Geminin (mAG-hGem) in an unsynchronized population of proliferating RPE1 cells. Black curve represents an average cell cycle trajectory, which is used to parameterize the progression through the cell cycle into a 1D curve used in panels (D, E) (see ‘Materials and methods’). Red circle highlights the G1/S cells, which are large in size and high in ΔK48-polyUb. (D) Single-cell measurements of cell size (shown in log scale) as a function of the cell cycle trajectory (see C and ‘Materials and methods’) demonstrated in a scatterplot, overlayed with contour lines representing the calculated joint probability density function, which describes the frequency of cells for every given paired value of cell size and cell cycle stage. (E) Heatmap of size-normalized ΔK48-polyUb (see ‘Materials and methods’) overlaid on the density contours as in (D). Red arrows point to the large cells at G1/S transition. See Figure 4—figure supplement 1 for heatmap of non-size-normalized ΔK48-polyUb.
-
Figure 4—source data 1
File contains the source code and source data necessary to generate Figure 4, Figure 4—figure supplement 1 using MATLAB.
Figure4AB_Script.m generates Figure 4A and B. Figure 4C_Script.m generates Figure 4C. Figure 4DE_Script.m generates Figure 4D and E. Figure4S1A_Script.m generates Figure 4—figure supplement 1A. Figure4S1B_Script.m generates Figure 4—figure supplement 1B.
- https://cdn.elifesciences.org/articles/75393/elife-75393-fig4-data1-v2.zip
Figure 4—figure supplement 1
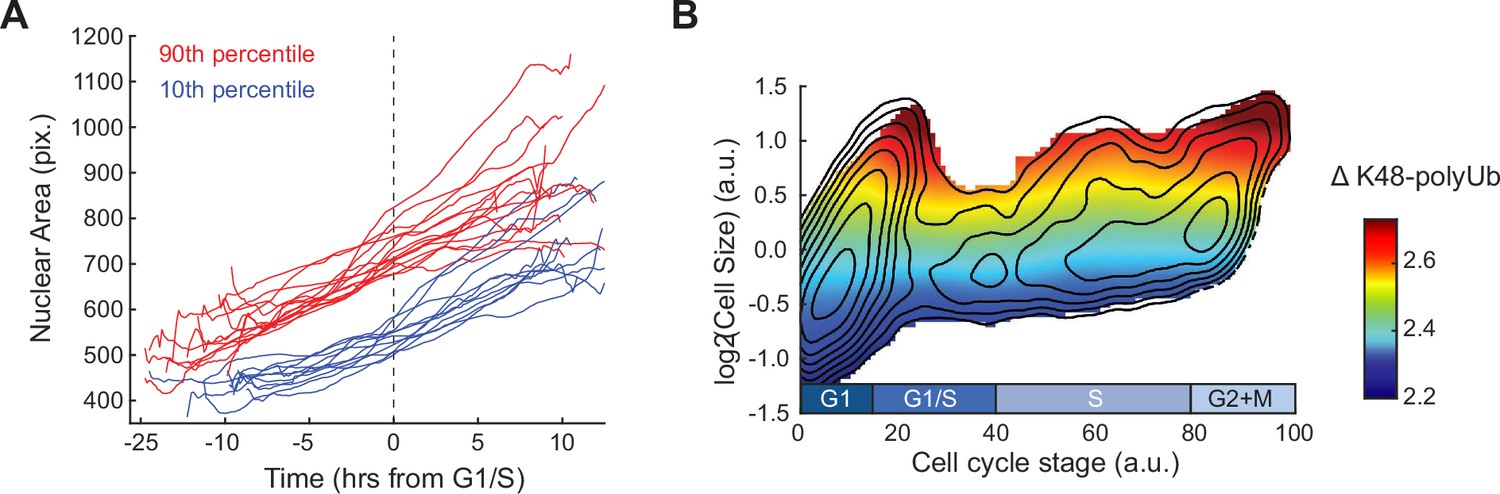
Large cells prior to the G1/S transition continue through the cell cycle and show elevated ΔK48-polyUb.
(A) Example single-cell dynamics of nuclear area for small (10th percentile) and large (90th percentile) cells chosen ~2.5 hr before G1/S. Trajectories are smoothed with a moving average filter. (B) Heatmap of ΔK48-polyUb (not normalized to size, see ‘Materials and methods’) overlaid on the contour lines from Figure 4D. See Figure 4B for ΔK48-polyUb normalized to cell size.
Figure 4—figure supplement 2

Large cells prior to the G1/S transition show hyperactivated global protein degradation as demonstrated by live-cell imaging.
(A, B) Average growth rate of nuclear area measured by live-cell imaging for control (0.1% v/v DMSO, N = 2,724 single-cell tracks) and mTOR-inhibited (5 nM rapamycin) cells (N = 1172), separately shown for the small (the smallest 1/3) and large (the largest 1/3) cells, at 1.25 hr before or 1 hr after the G1/S transition (A) or across the entire cell cycle (B). G1/S transition was assigned for each single-cell track based on the dynamics of the cell cycle reporter Geminin, with baseline Geminin levels indicating early G1 phase and rapid increase in Geminin level as the start of the G1/S transition. (C) Rates of protein synthesis measured as AHA incorporation for control (0.1% v/v DMSO, N = 88,563 cells) and mTOR-inhibited (10 nM torin2, N = 50,293) cells, separately shown for the small (the smallest 1/3) and large cells (the largest 1/3) in the entire population. Error bars present median ± 95% CI.
-
Figure 4—figure supplement 2—source data 1
File contains the source code and source data necessary to generate Figure 4—figure supplement 2 using Matlab.
Figure4S2_Script.m generates Figure 4—figure supplement 2A-C.
- https://cdn.elifesciences.org/articles/75393/elife-75393-fig4-figsupp2-data1-v2.zip
Figure 5
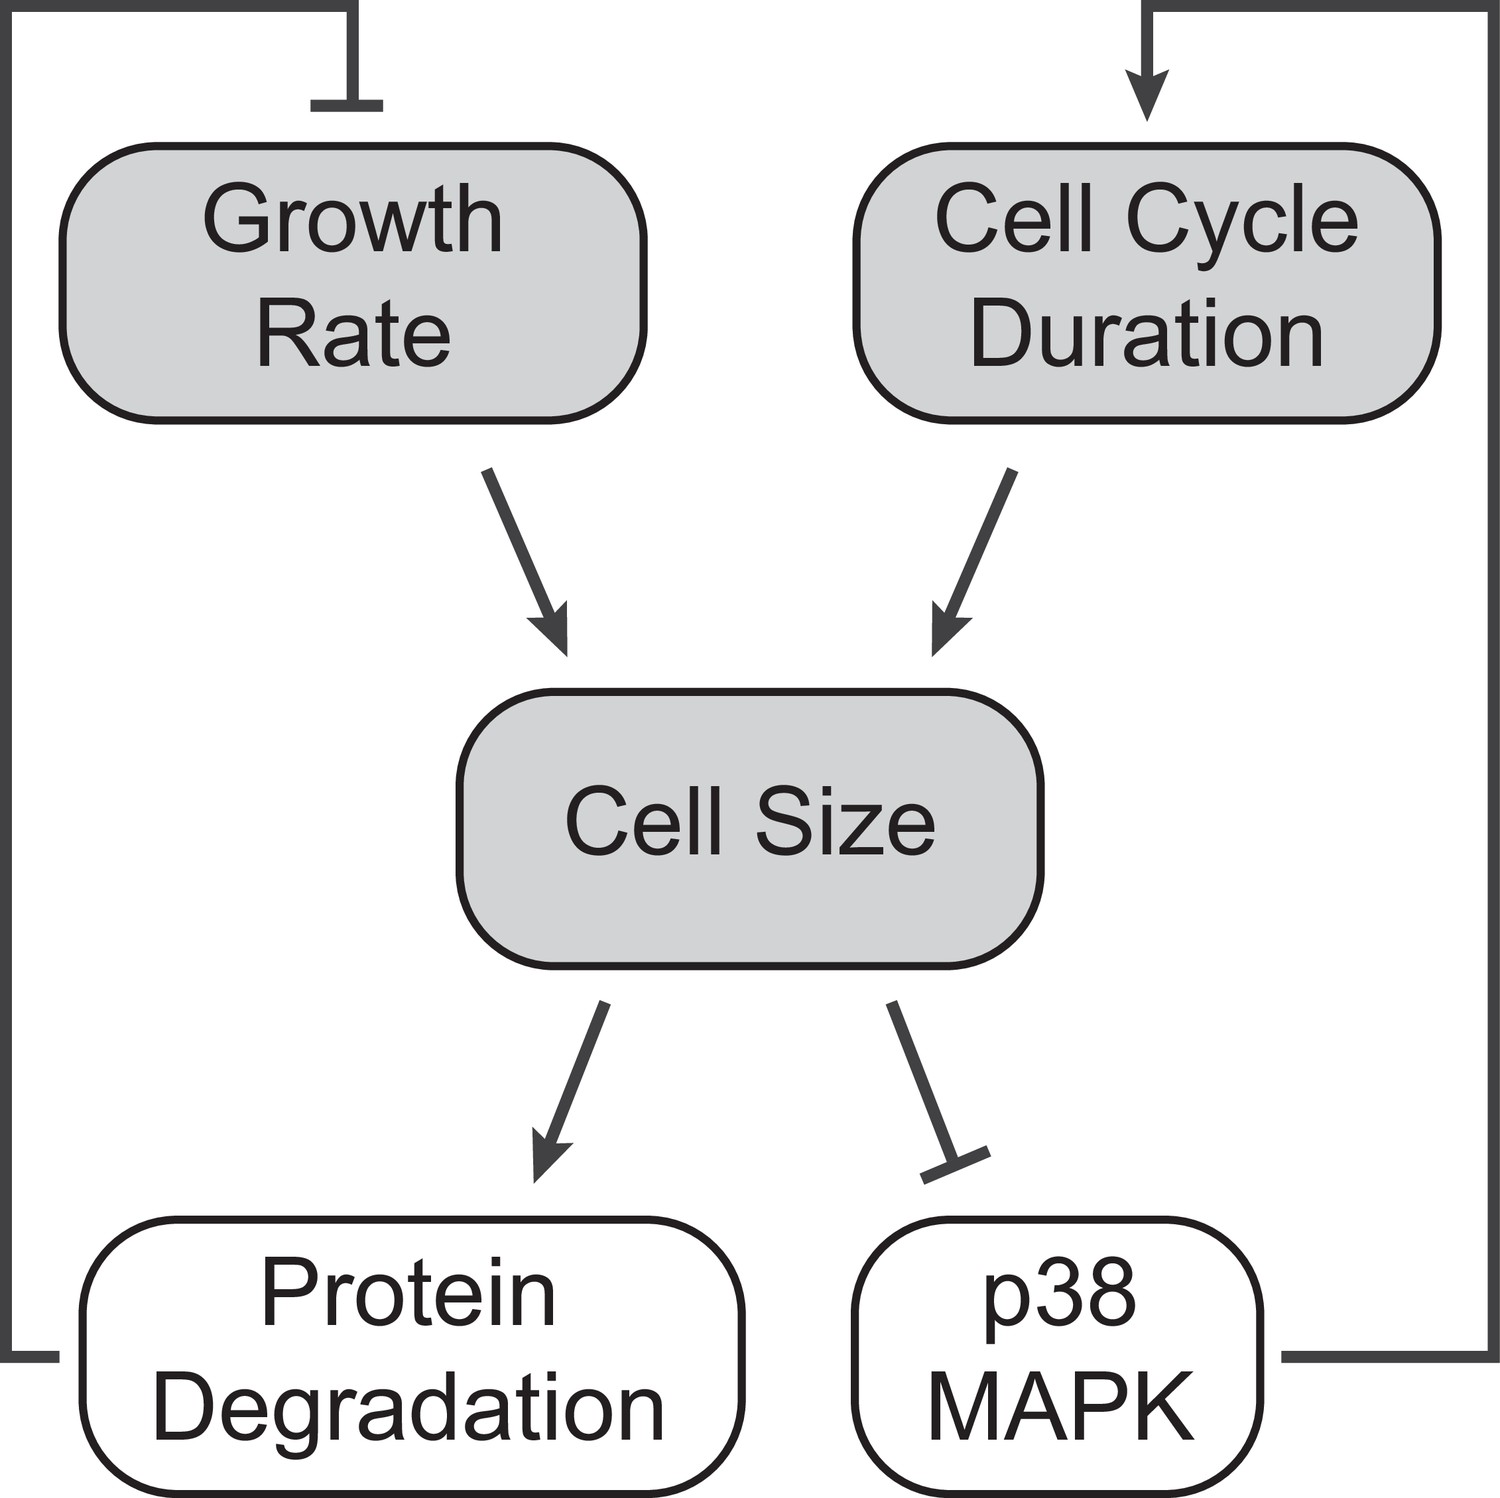
A model of cell size homeostatic control.
Control of cell size homeostasis involves negative feedback on both the cell cycle duration and cellular growth rate. The cell cycle arm of the regulation involves activation of the p38 MAPK pathway in small cells that prolongs the growth duration (Liu et al., 2018). The growth rate arm of the regulation, investigated here, involves upregulated global protein degradation through the proteasomal degradation pathway that reduces growth efficiency in large cells.
Author response image 1

Cell size distribution in DMSO control condition.
A. Cell size histogram with median (solid line) and 1st and 99th percentiles (dashed lines) labeled. B. DNA histogram showing classification of cells to different cell cycle stages. C. Cell size distribution plotted separately for G1, S, and G2+M cells with their median labeled by solid lines of the corresponding color.
Additional files
Download links
A two-part list of links to download the article, or parts of the article, in various formats.
Downloads (link to download the article as PDF)
Open citations (links to open the citations from this article in various online reference manager services)
Cite this article (links to download the citations from this article in formats compatible with various reference manager tools)
Oversized cells activate global proteasome-mediated protein degradation to maintain cell size homeostasis
eLife 14:e75393.
https://doi.org/10.7554/eLife.75393


