Dopamine neuron morphology and output are differentially controlled by mTORC1 and mTORC2
- Department of Molecular and Cell Biology, University of California, Berkeley, United States
- Helen Wills Neuroscience Institute, University of California, Berkeley, United States
- Department of Physiology, Physiology, Anatomy and Genetics, University of Oxford, United Kingdom
- Chan Zuckerberg Biohub, San Francisco, United States
Figures
Figure 1 with 1 supplement

mTORC1 suppression causes somatodendritic hypotrophy of DA neurons.
(a) Simplified mTOR signaling schematic showing mTORC1 and mTORC2 with their respective obligatory components Raptor and Rictor. Ribosomal protein S6 is phosphorylated on Ser240/244 by p70S6K, a direct phosphorylation target of mTORC1. AKT is phosphorylated on Ser473 by mTORC2. AKT is an upstream regulator of the Tsc1/2 complex, which negatively regulates mTORC1 activity via the small GTPase Rheb. (b–e) Representative confocal images of midbrain sections from DA-Raptor WT (b.c) and DA-Raptor KO (d,e) mice labeled with antibodies against tyrosine hydroxylase (TH) and phosphorylated S6 (p-S6, Ser240/244); scale bars = 200 μm. (f–i) Higher magnification merged images of the SNc (f,h) and VTA (g,i) boxed regions from panels b-e; scale bars = 50 μm. (j,k) Cumulative distributions of SNc DA neuron p-S6 levels (j) and soma area (k). DA-Raptor WT in black: n=1024 neurons from three mice, DA-Raptor KO in blue: n=1045 neurons from three mice; ****p<0.0001, Kolmogorov–Smirnov tests. (l,m) Cumulative distributions of VTA DA neuron p-S6 levels (l) and soma area (m). DA-Raptor WT in black: n=1389 neurons from three mice, DA-Raptor KO in blue: n=1526 neurons from three mice; ****p<0.0001, Kolmogorov–Smirnov tests. (n) Representative confocal images of a midbrain section containing a triple-labelled DA neuron (arrowhead; TH, neurobiotin and tdTomato Cre reporter-positive) used for dendritic arbor reconstruction and analysis. (o,p) Reconstructions of the dendrites and cell body of SNc (o) and VTA (p) DA neurons of the indicated genotypes. (q) Sholl analysis of SNc DA neuron dendritic arbors. Dark colored lines are the mean, lighter color shading is the SEM. DA-Raptor WT in black: n=27 neurons from 9 mice, DA-Raptor KO in blue: n=13 neurons from 6 mice. Two-way ANOVA p values are shown. (r) Sholl analysis of VTA DA neuron dendritic arbors. Dark colored lines are the mean, lighter color shading is the SEM. DA-Raptor WT in black: n=16 neurons from 6 mice, DA-Raptor KO in blue: n=15 neurons from 6 mice. Two-way ANOVA p values are shown. (s) Mean ± SEM total dendritic arbor length per SNc neuron. DA-Raptor WT: n=27 neurons from 9 mice, DA-Raptor KO: n=13 neurons from 6 mice; ***p=0.0003, Welch’s two-tailed t-test. (t) Mean ± SEM total dendritic arbor length per VTA neuron. DA-Raptor WT: n=16 neurons from 6 mice, DA-Raptor KO: n=15 neurons from 6 mice; *p=0.0235, Welch’s two-tailed t-test. (u) Box plots of the number of primary dendrites per SNc neuron for each genotype (boxes represent the inter-quartile range (25–75%), lines denote the median, whiskers represent min to max values). DA-Raptor WT: n=27 neurons from 9 mice, DA-Raptor KO: n=13 neurons from 6 mice; p=0.2078, Mann-Whitney test. (v) Box plots of the number of primary dendrites per VTA neuron for each genotype (boxes represent the inter-quartile range (25–75%), lines denote the median, whiskers represent min to max values). DA-Raptor WT: n=16 neurons from 6 mice, DA-Raptor KO: n=15 neurons from 6 mice; p=0.6420, Mann-Whitney test. For panels s-v, dots represent values from individual neurons. See also Figure 1—figure supplement 1.
Figure 1—figure supplement 1
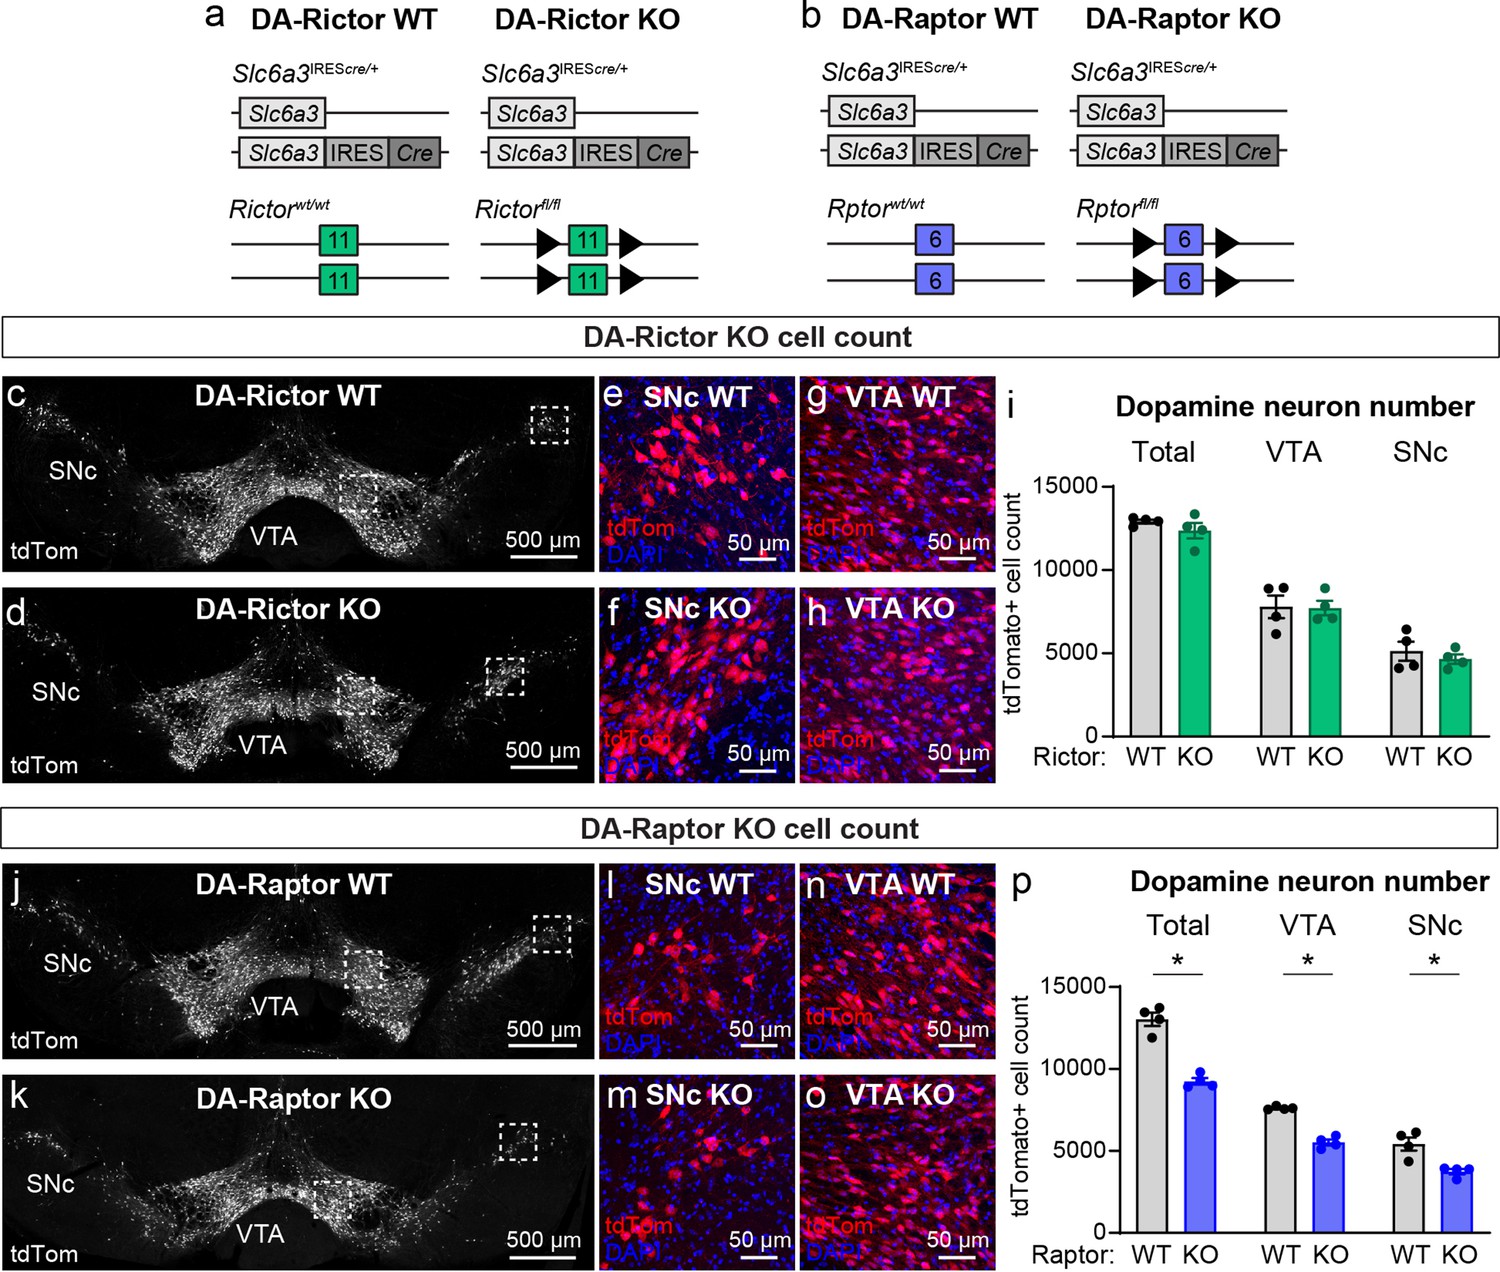
Deletion of Rptor, but not Rictor, reduces DA neuron number (related to Figures 1 and 2).
(a,b) Schematic of the genetic strategies to delete Rptor (a) or Rictor (b) selectively from DA neurons. Numbered boxes represent exons and triangles represent loxP sites. (c,d) Representative confocal images of midbrain sections from DA-Rictor WT (c) and DA-Rictor KO (d) mice with DA neurons visualized by a Cre-dependent tdTomato reporter (tdTom). Scale bars = 500 μm. (e–h) Higher magnification merged images from the boxed regions in panels c and d showing tdTomato (red) and DAPI (blue). Scale bars = 50 μm. (i) Mean ± SEM number of tdTomato-positive DA neurons in the midbrain of DA-Rictor WT and KO mice, as estimated by stereological analysis. Total = SNc and VTA regions combined. n=4 mice per genotype. Total, p=0.4857; VTA, p=0.8857; SNc, p=0.6857; Mann Whitney tests. (j,k) Representative confocal images of midbrain sections from DA-Raptor WT (j) and DA-Raptor KO (k) mice with DA neurons visualized by a Cre-dependent tdTomato reporter (tdTom). Scale bars = 500 μm. (l-o) Higher magnification merged images from the boxed regions in panels j and k showing tdTomato (red) and DAPI (blue). Scale bars = 50 μm. (p) Mean ± SEM number of tdTomato-positive DA neurons in the midbrain of DA-Raptor WT and KO mice, as estimated by stereological analysis. n=4 mice per genotype. Total, *p=0.0286; VTA, *p=0.0286; SNc, *p=0.0286; Mann Whitney tests. For all bar graphs, dots represent values for individual mice.
Figure 2
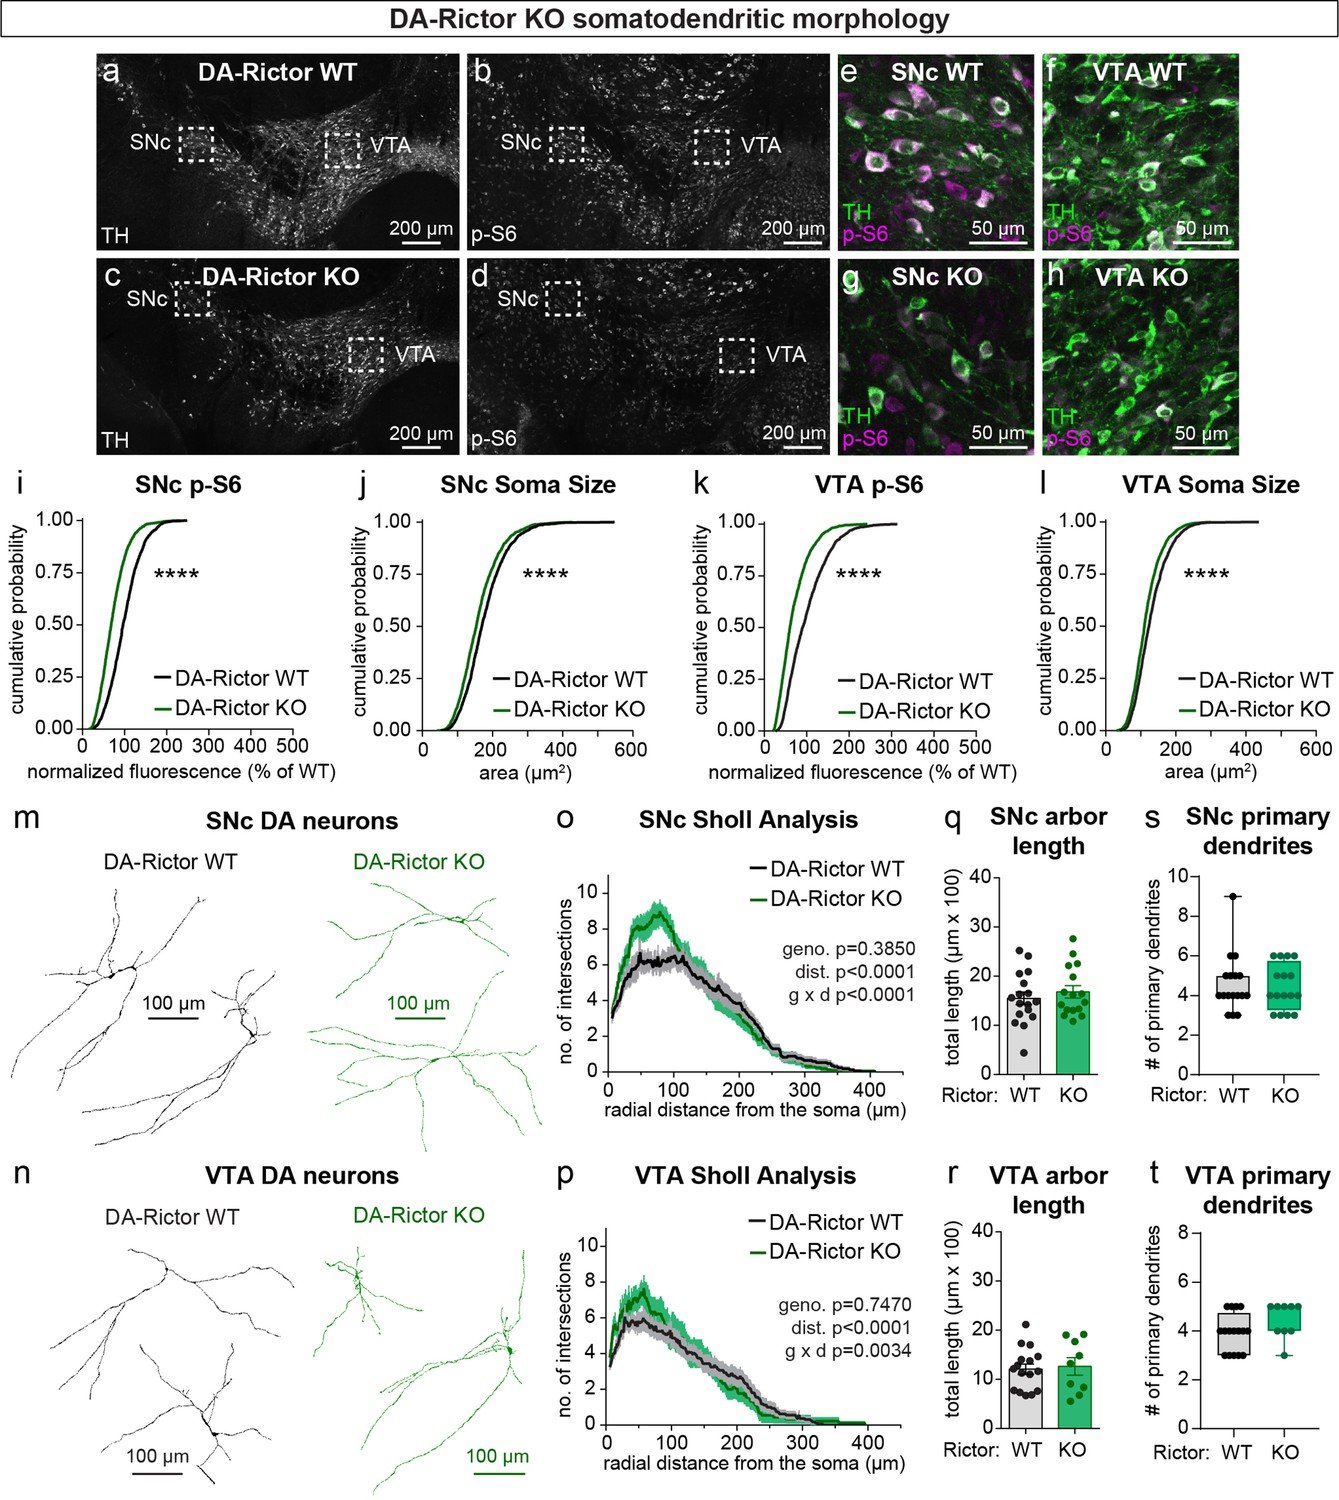
mTORC2 inhibition reduces DA neuron soma size and increases proximal dendrite branching.
(a–d) Representative confocal images of midbrain sections from DA-Rictor WT (a,b) and DA-Rictor KO (c,d) mice labeled with antibodies against tyrosine hydroxylase (TH) and phosphorylated S6 (p-S6, Ser240/244); scale bars = 200 μm. (e–h) Higher magnification merged images of the SNc (e,g) and VTA (h,i) boxed regions from panels b-e; scale bars = 50 μm. (i,j) Cumulative distributions of SNc DA neuron p-S6 levels (i) and soma area (j). DA-Rictor WT in black: n=1280 neurons from three mice, DA-Rictor KO in green: n=1550 neurons from four mice; ****p<0.0001, Kolmogorov–Smirnov tests. (k,l) Cumulative distributions of VTA DA neuron p-S6 levels (k) and soma area (l). DA-Rictor WT in black: n=1968 neurons from three mice, DA-Rictor KO in green: n=2370 neurons from four mice; ****p<0.0001, Kolmogorov–Smirnov tests. (m,n) Reconstructions of the dendrites and cell body of SNc (m) and VTA (n) DA neurons of the indicated genotypes. (o) Sholl analysis of SNc DA neuron dendritic arbors. Dark colored lines are the mean, lighter color shading is the SEM. DA-Rictor WT in black: n=17 neurons from 6 mice, DA-Rictor KO in green: n=16 neurons from 6 mice. Two-way ANOVA p values are shown. (p) Sholl analysis of VTA DA neuron dendritic arbors. Dark colored lines are the mean, lighter color shading is the SEM. DA-Rictor WT in black: n=16 neurons from 7 mice, DA-Rictor KO in green: n=9 neurons from 5 mice. Two-way ANOVA p values are shown. (q) Mean ± SEM total dendritic arbor length per cell. DA-Rictor WT: n=17 neurons from 6 mice, DA-Rictor KO: n=16 neurons from 6 mice; p=0.4633, Welch’s two-tailed t-test. Dots represent values from individual neurons. (r) Mean ± SEM total dendritic arbor length per cell. DA-Rictor WT: n=16 neurons from 7 mice, DA-Rictor KO: n=9 neurons from 5 mice; p=0.7907, Welch’s two-tailed t-test. Dots represent values from individual neurons. (s) Box plots of the number of primary dendrites per SNc neuron for each genotype (boxes represent the inter-quartile range (25–75%), lines denote the median, whiskers represent min to max values). DA-Rictor WT: n=17 neurons from 6 mice, DA-Rictor KO: n=16 neurons from 6 mice; p=0.9938, Mann-Whitney test. (t) Box plots of the number of primary dendrites per VTA neuron for each genotype (boxes represent the inter-quartile range (25–75%), lines denote the median, whiskers represent min to max values). DA-Rictor WT: n=16 neurons from 7 mice, DA-Rictor KO: n=9 neurons from 5 mice; p=0.1634, Mann-Whitney test. For panels q-t, dots represent values from individual neurons.
Figure 3 with 1 supplement
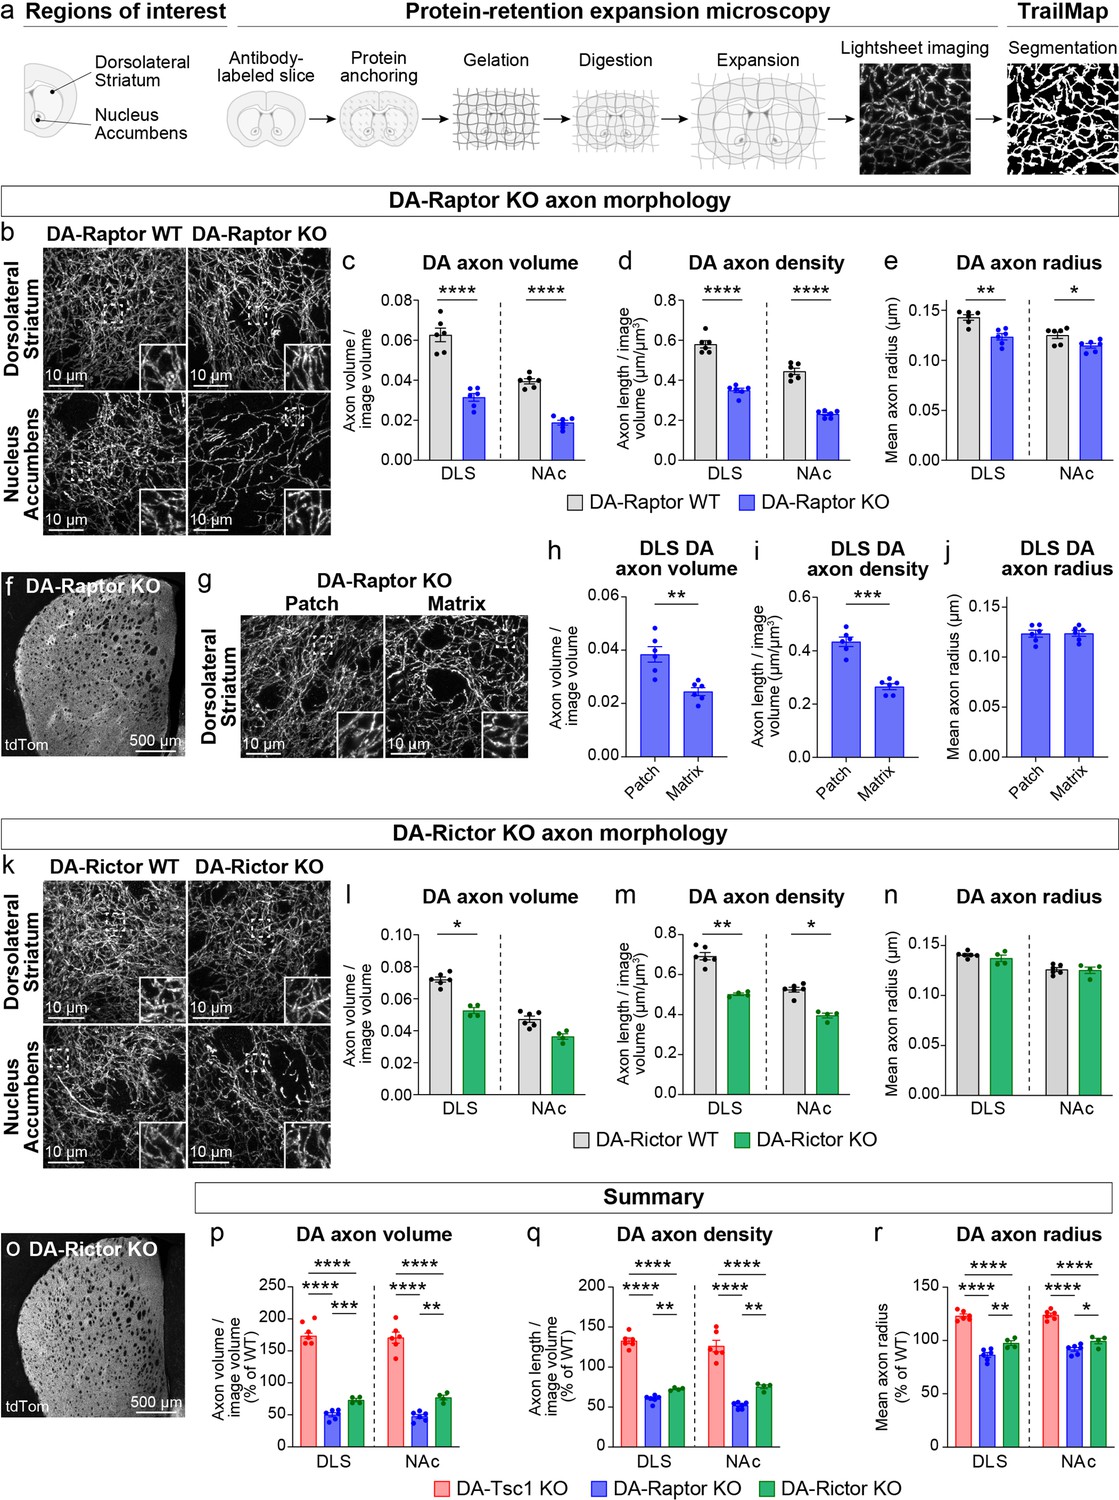
Dopamine axon density is reduced by inhibition of mTORC1 or mTORC2.
(a) Outline of the expansion microscopy and analysis workflow. Striatal slices containing tdTomato-labeled DA axons were labeled with an anti-RFP antibody and processed for protein-retention expansion microscopy (ProExM). Regions of interest containing dorsolateral striatum (DLS) or nucleus accumbens core (NAc) were imaged with a light sheet fluorescence microscope and DA axons were segmented using TrailMap. (b) Representative light sheet images of ProExM-processed striatal DA axons from DA-Raptor WT (left panels) and DA-Raptor KO (right panels) mice. Scale bars are normalized by expansion factor. Insets show high magnification images of boxed regions from the same panels. (c–e) Mean ± SEM DA axon volume (c), density (d), and radius (e) in the DLS and NAc regions from DA-Raptor WT and DA-Raptor KO mice. n=6 slices from 3 mice per genotype (values are the average of 4 images per slice). Axon volume (c), ****p<0.0001 WT vs KO in DLS, ****p<0.0001 WT vs KO in NAc. Axon density (d), ****p<0.0001 WT vs KO in DLS, ****p<0.0001 WT vs KO in NAc. Axon radius (e), **p=0.0011 WT vs KO in DLS, *p=0.0279 WT vs KO in NAc. Welch’s unpaired t-tests. (f) Representative confocal image of an unexpanded DA-Raptor KO striatal section, visualized by Cre-dependent tdTomato (tdTom). (g) Representative light sheet images of ProExM-processed DLS patch and matrix regions from DA-Raptor KO mice showing tdTomato-labeled DA axons, scale bars = 10 μm (normalized by expansion factor). Insets show higher magnification images of boxed regions from the same panels. (h–j) Mean ± SEM DA axon volume (h), density (i), and radius (j) in the DLS patch and matrix compartments from DA-Raptor KO mice. Axon volume (h), **p=0.0019. Axon density (i), ***p=0.0003. Axon radius (j), p=0.7536. Paired t-tests. n=6 slices from 3 mice (values are the average of four images per slice). (k) Representative light sheet images of ProExM-processed striatal DA axons from DA-Rictor WT (left panels) and DA-Rictor KO (right panels) mice. Scale bars are normalized by expansion factor. Insets show high magnification images of boxed regions from the same panels. (l-n) Mean ± SEM DA axon volume (l), density (m), and radius (n) in the DLS and NAc regions from DA-Rictor WT and DA-Rictor KO mice. For DA-Rictor WT, n=6 slices from 3 mice. For DA-Rictor KO, n=4 slices from 2 mice (values are the average of 4 images per slice). Axon volume (l), *p=0.0351 WT vs KO in DLS, p=0.1164 WT vs KO in NAc. Axon density (m), **p=0.0068 WT vs KO in DLS, *p=0.0184 WT vs KO in NAc. Axon radius (n), p=0.8059 WT vs KO in DLS, p=0.6195 WT vs KO in NAc. Welch’s unpaired t-tests. (o) Representative confocal image of an unexpanded DA-Rictor KO striatal section, visualized by Cre-dependent tdTomato. (p–r) Summary data across all genotypes examined by ProExM-TrailMap. Mean ± SEM DA axon volume (p), density (q), and radius (r) in the DLS and NAc regions from DA-Tsc1 KO, DA-Raptor KO, and DA-Rictor KO mice expressed as a percentage of WT values for each genotype. Axon volume (p), DLS: p<0.0001, one-way ANOVA; Holm-Sidak’s multiple comparison tests, ****p<0.0001 DA-Tsc1 KO vs DA-Raptor KO, ****p<0.0001 DA-Tsc1 KO vs DA-Rictor KO, ***p=0.0010 DA-Raptor KO vs DA-Rictor KO. NAc: p<0.0001, one-way ANOVA; Holm-Sidak’s multiple comparison tests, ****p<0.0001 DA-Tsc1 KO vs DA-Raptor KO, ****p<0.0001 DA-Tsc1 KO vs DA-Rictor KO, **p=0.0076 DA-Raptor KO vs DA-Rictor KO. Axon density (q), DLS: p<0.0001, one-way ANOVA; Holm-Sidak’s multiple comparison tests, ****p<0.0001 DA-Tsc1 KO vs DA-Raptor KO, ****p<0.0001 DA-Tsc1 KO vs DA-Rictor KO, **p<0.0087 DA-Raptor KO vs DA-Rictor KO. NAc: p<0.0001, one-way ANOVA; Holm-Sidak’s multiple comparison tests, ****p<0.0001 DA-Tsc1 KO vs DA-Raptor KO, ****p<0.0001 DA-Tsc1 KO vs DA-Rictor KO, **p=0.0070 DA-Raptor KO vs DA-Rictor KO. Axon radius (r), DLS: p<0.0001, one-way ANOVA; Holm-Sidak’s multiple comparison tests, ****p<0.0001 DA-Tsc1 KO vs DA-Raptor KO, ****p<0.0001 DA-Tsc1 KO vs DA-Rictor KO, **p=0.0038 DA-Raptor KO vs DA-Rictor KO. NAc: p<0.0001, one-way ANOVA; Holm-Sidak’s multiple comparison tests, ****p<0.0001 DA-Tsc1 KO vs DA-Raptor KO, ****p<0.0001 DA-Tsc1 KO vs DA-Rictor KO, *p=0.0210 DA-Raptor KO vs DA-Rictor KO. See also Figure 3—figure supplement 1 and Videos 1–7.
Figure 3—figure supplement 1
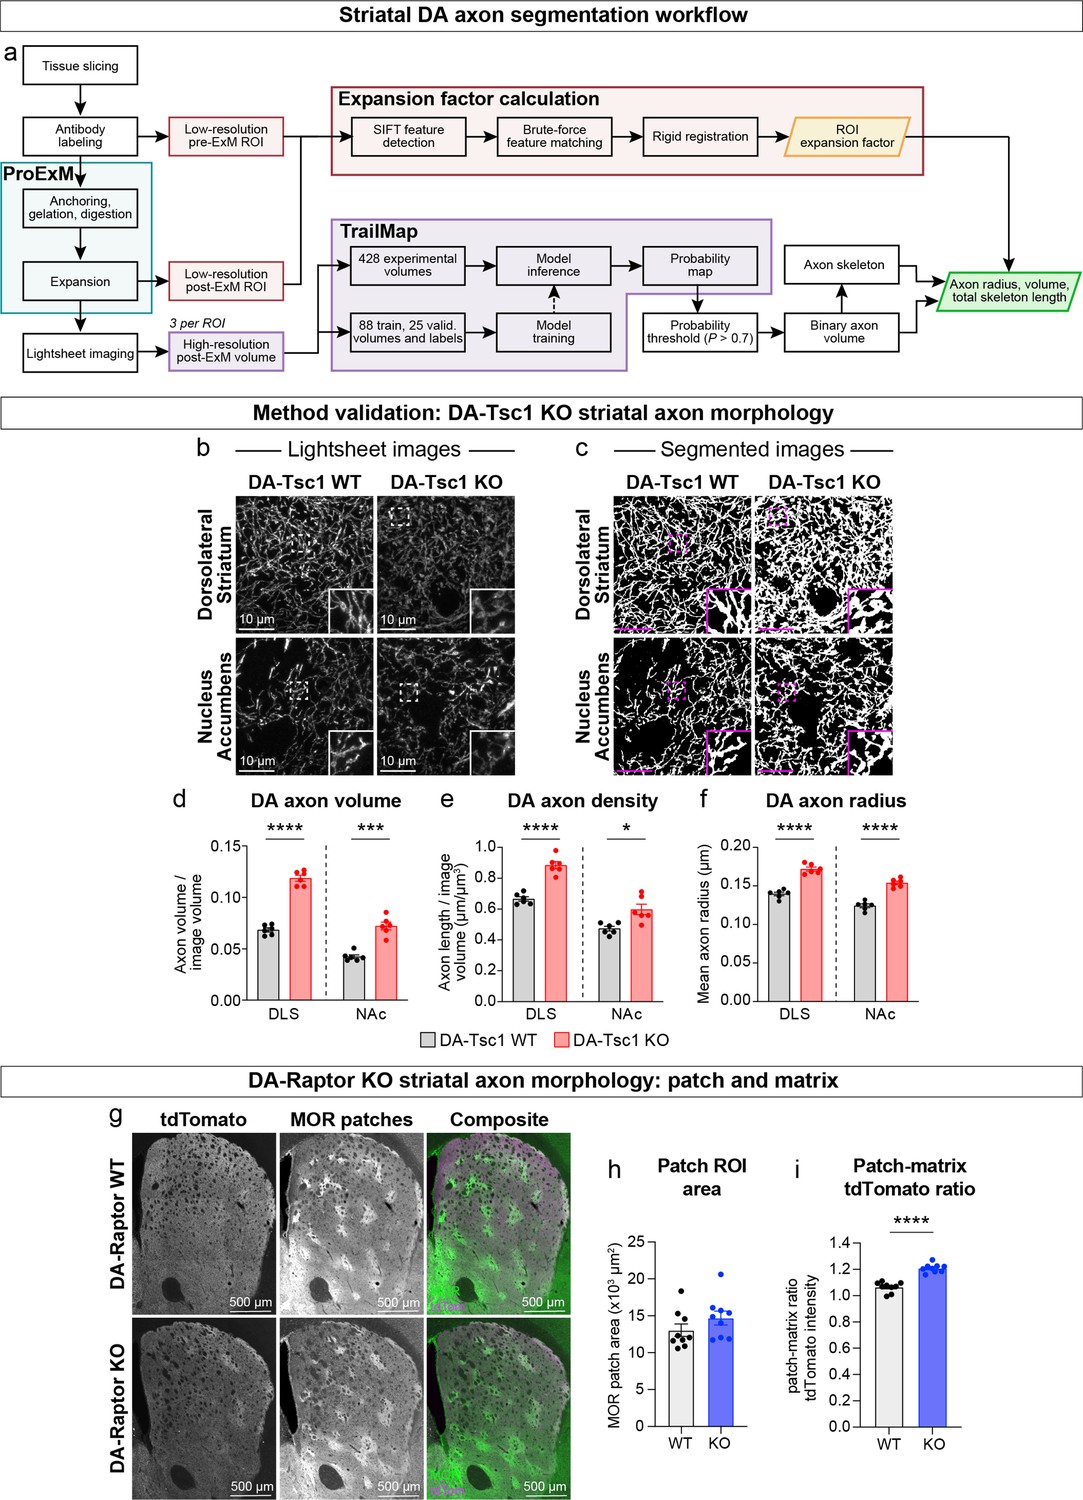
Development of a ProExM-TrailMap pipeline for the analysis of DA axon morphology (related to Figure 3).
(a) Workflow for performing protein-retention expansion microscopy (ProExM), light sheet imaging and TrailMap segmentation and analysis of striatal DA axons. (b) Representative light sheet images of striatal DA axons visualized by Cre-dependent tdTomato fluorescence enhanced with an anti-RFP antibody. Images show ProExM tissue gels expanded by a factor of ~4.5. Scale bars are normalized by expansion factor. Insets are higher magnification images of boxed regions from the same panels. (c) TrailMap-segmented images corresponding to the lightsheet images in panel b. Scale bars represent 10 μm. Insets are higher magnification images of boxed regions from the same panels. (d-f) Mean ± SEM DA axon volume (d), density (e) and radius (f) in the dorsolateral striatum (DLS) and nucleus accumbens core (NAc) regions from DA-Tsc1 WT and DA-Tsc1 KO mice. n=6 slices from 3 mice per genotype (values are the average of 4 images per slice). Axon volume (d), ****p<0.0001 WT vs KO in DLS, ***p=0.0001 WT vs KO in NAc. Axon density (e), ****p<0.0001 WT vs KO in DLS, *p=0.0123 WT vs KO in NAc. Axon radius (f), ****p<0.0001 WT vs KO in DLS, ****p<0.0001 WT vs KO in NAc. Welch’s two-tailed t-tests. (g) Representative confocal images of striatal sections from DA-Raptor WT (top panels) and DA-Raptor KO (bottom panels) mice with striatal DA axons visualized by Cre-dependent tdTomato and striatal patch (striosome) regions labeled with an antibody against μ-opioid receptor (MOR), scale bars = 500 μm. Composite images show MOR immunostaining in green and tdTomato in magenta. (h,i) Mean ± SEM total patch area (h) and patch/matrix ratio of tdTomato fluorescence intensity (i) in the striatum of DA-Raptor WT and DA-Raptor KO mice. n=9 sections from three mice per genotype. Patch area (h), p=0.2054, Welch’s two-tailed t-test. Patch/matrix ratio (i), ****p<0.0001, Welch’s two-tailed t-test. For all bar graphs, dots represent individual striatal sections. See also Videos 1–7.
Figure 4

mTORC1 suppression increases the excitability of SNc and VTA DA neurons.
(a,b) Mean ± SEM membrane capacitance (a) and membrane resistance (b) of SNc DA neurons. DA-Raptor WT in black: n=28 neurons from eight mice, DA-Raptor KO in blue: n=28 neurons from six mice. Capacitance (a), ****p<0.0001, unpaired two-tailed t-test. Resistance (b), ****p<0.0001, Mann–Whitney test. (c) Example current-clamp recordings from SNc DA neurons of the indicated genotypes in response to a −100 pA current step. reb.=rebound. (d,e) Mean ± SEM sag (d) and rebound (e) amplitude expressed as a percentage of the maximum hyperpolarization from baseline in SNc DA neurons. DA-Raptor WT in black: n=28 neurons from six mice, DA-Raptor KO in blue: n=28 neurons from six mice. Sag (d), ***p=0.0003. Rebound (e), ****p<0.0001. Mann–Whitney tests. (f,g) Mean ± SEM membrane capacitance (f) and membrane resistance (g) of VTA DA neurons. DA-Raptor WT in black: n=22 neurons from eight mice, DA-Raptor KO in blue: n=22 neurons from six mice. Capacitance (f), ***p=0.0005. Resistance (g), p=0.6769. Unpaired two-tailed t-tests. (h) Example current-clamp recordings from VTA DA neurons of the indicated genotypes in response to a −100 pA current step. (i,j) Mean ± SEM sag (i) and rebound (j) amplitude expressed as a percentage of the maximum hyperpolarization from baseline in VTA DA neurons. DA-Raptor WT in black: n=22 neurons from six mice, DA-Raptor KO in blue: n=21 neurons from six mice. Sag (i), p=0.3660. Rebound (j), p=0.2513. Mann–Whitney tests. (k) Examples of action potential firing elicited with a+100 pA current step in SNc DA neurons of the indicated genotypes. (l) Mean ± SEM rheobase of SNc DA neurons calculated as the current at which action potentials were first elicited. DA-Raptor WT in black: n=28 neurons from eight mice, DA-Raptor KO in blue: n=27 neurons from six mice, ****p<0.0001, Mann–Whitney test. (m) Input-output curves showing the firing frequency of SNc DA neurons in response to positive current steps of increasing amplitude. Data are displayed as mean ± SEM. DA-Raptor WT in black: n=28 neurons from eight mice, DA-Raptor KO in blue: n=28 neurons from six mice. Two-way ANOVA p values are shown. Sidak’s multiple comparisons tests: p25pA >0.9999, p50pA=0.3649, *p75pA=0.0009, *p100pA=0.0002, *p125pA=0.0069, p150pA=0.2497, p200pA >0.9999, *p300pA=0.0009, *p400pA-600pA <0.0001. (n) Examples of action potential firing elicited with a+100 pA current step in VTA DA neurons of the indicated genotypes. (o) Mean ± SEM rheobase of VTA DA neurons calculated as the current at which action potentials were first elicited. DA-Raptor WT in black: n=22 neurons from eight mice, DA-Raptor KO in blue: n=22 neurons from six mice, *p=0.0190, Mann–Whitney test. (p) Input-output curves showing the firing frequency of VTA DA neurons in response to current steps of increasing amplitude. Data are displayed as mean ± SEM. DA-Raptor WT in black: n=22 neurons from eight mice, DA-Raptor KO in blue: n=22 neurons from six mice. Two-way ANOVA p values are shown. Sidak’s multiple comparisons tests: p25pA >0.9999, p50pA=0.0902, *p75pA=0.0014, *p100pA=0.0014, p125pA=0.1398, p150pA=0.9983, p200pA >0.9999, p300pA=0.6959, p400pA=0.5691, p500pA=0.9718, p600pA=0.9963. For all bar graphs, dots represent values for individual neurons. See also Table 1.
Figure 5
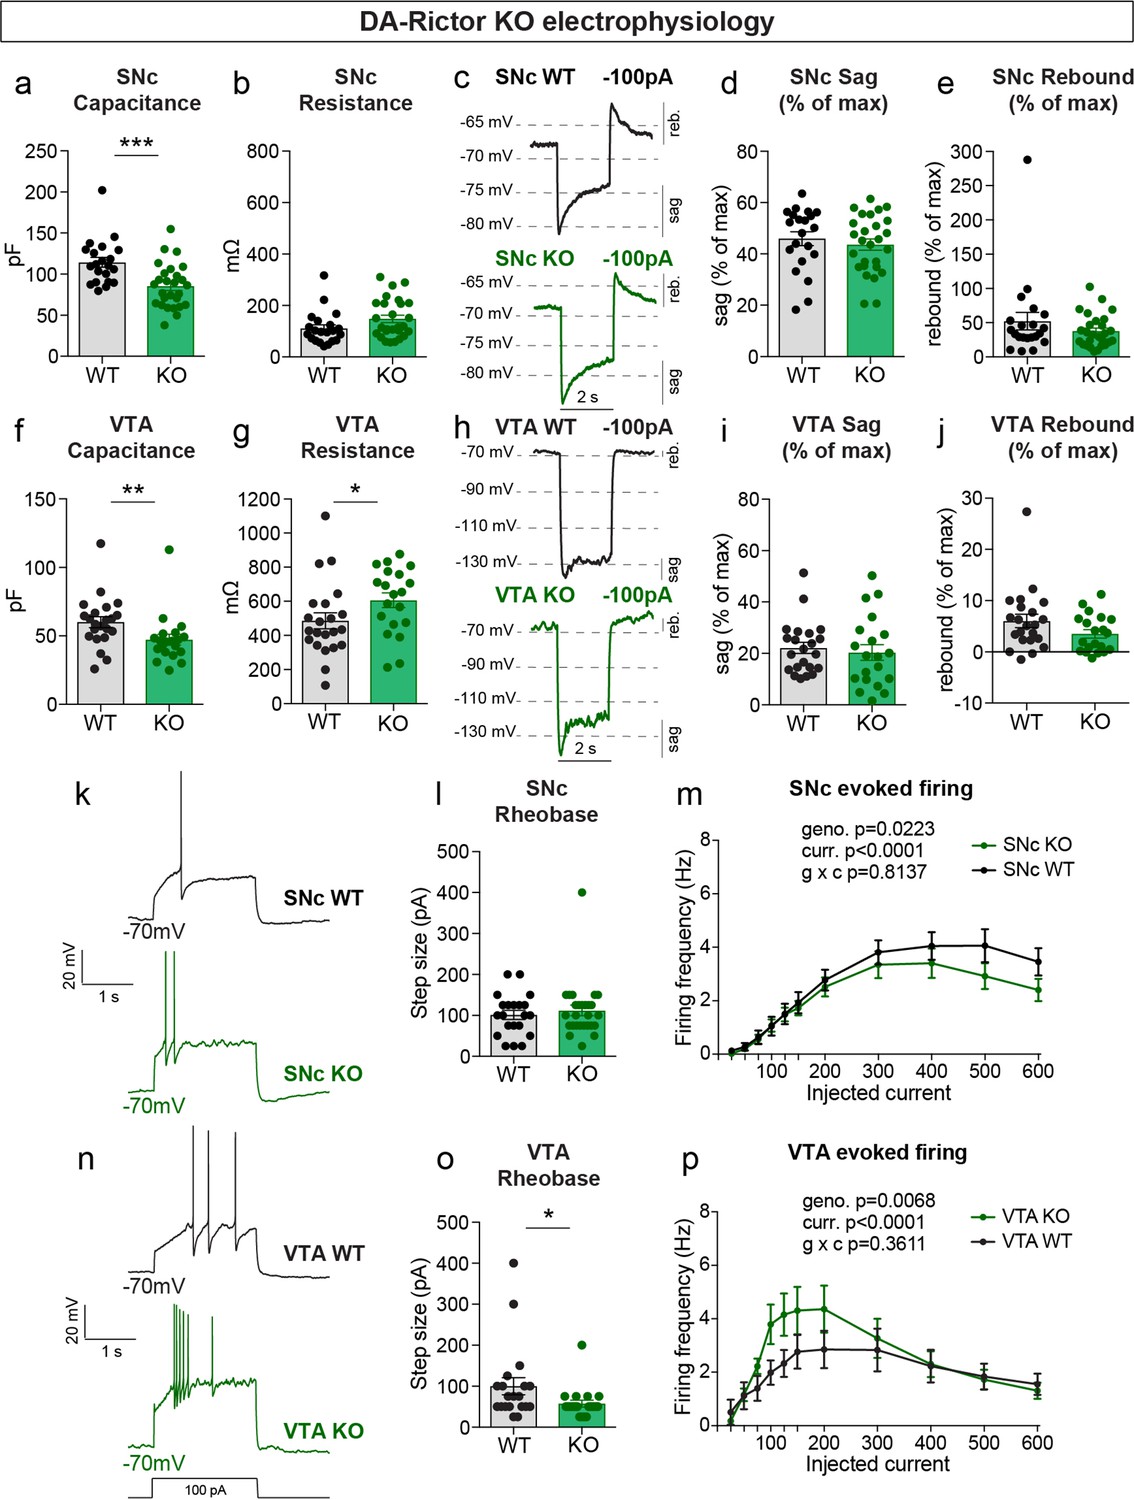
mTORC2 inhibition increases the excitability of VTA DA neurons.
(a,b) Mean ± SEM membrane capacitance (a) and membrane resistance (b) of SNc DA neurons. DA-Rictor WT in black: n=21 neurons from four mice, DA-Rictor KO in green: n=27 neurons from eight mice. Capacitance (a), ***p=0.0006. Resistance (b), P=0.0772 (b). Mann–Whitney tests. (c) Example current-clamp recordings from SNc DA neurons of the indicated genotypes in response to a −100 pA current step. (d,e) Mean ± SEM sag (d) and rebound (e) amplitude expressed as a percentage of the maximum hyperpolarization from baseline in SNc DA neurons. DA-Rictor WT in black: n=21 neurons from four mice, DA-Rictor KO in green: n=27 neurons from eight mice. Sag (d), p=0.5006, two-tailed t-test. Rebound (e), p=0.4212, Mann–Whitney test. (f,g) Mean ± SEM membrane capacitance (f) and membrane resistance (g) of VTA DA neurons. DA-Rictor WT in black: n=22 neurons from four mice, DA-Rictor KO in green: n=20 neurons from six mice. Capacitance (f), **p=0.0014. Resistance (g), *p=0.0418. Mann-Whitney tests. (h) Example current-clamp recordings from VTA DA neurons of the indicated genotypes in response to a −100 pA current step. (i,j) Mean ± SEM sag (i) and rebound (j) amplitude expressed as a percentage of the maximum hyperpolarization from baseline in VTA DA neurons. DA-Rictor WT in black: n=22 neurons from four mice, DA-Rictor KO in green: n=20 neurons from six mice. Sag (i), p=0.3880. Rebound (j), P=0.1638. Mann–Whitney tests. (k) Examples of action potential firing elicited with a +100 pA current step in SNc DA neurons of the indicated genotypes. (l) Mean ± SEM rheobase of SNc DA neurons calculated as the current at which action potentials were first elicited. DA-Rictor WT in black: n=21 neurons from four mice, DA-Rictor KO in green: n=27 neurons from eight mice, p=0.7414, Mann–Whitney test. (m) Input-output curves showing the firing frequency of SNc DA neurons in response to current steps of increasing amplitude. Data are displayed as mean ± SEM. DA-Rictor WT in black: n=21 neurons from four mice, DA-Rictor KO in green: n=27 neurons from eight mice. Two-way ANOVA p values are shown. Sidak’s multiple comparisons tests: p25pA >0.9999, p50pA >0.9999, p75pA >0.9999, p100pA >0.9999, p125pA >0.9999, p150pA >0.9999, p200pA >0.9999, p300pA=0.9948, p400pA=0.9341, p500pA=0.2913, p600pA=0.4672. (n) Examples of action potential firing elicited with a +100 pA current step in VTA DA neurons of the indicated genotypes. (o) Mean ± SEM rheobase of VTA DA neurons calculated as the current at which action potentials were first elicited. DA-Rictor WT in black: n=20 neurons from four mice, DA-Rictor KO in green: n=20 neurons from six mice, *p=0.0299, Mann–Whitney test. (p) Input-output curves showing the firing frequency of VTA DA neurons in response to current steps of increasing amplitude. Data are displayed as mean ± SEM. DA-Rictor WT in black: n=22 neurons from four mice, DA-Rictor KO in green: n=20 neurons from six mice. Two-way ANOVA p values are shown. Sidak’s multiple comparisons tests: p25pA >0.9999, p50pA >0.9999, p75pA=0.9842, p100pA=0.2640, p125pA=0.2515, p150pA=0.4871, p200pA=0.5233, p300pA >0.9999, p400pA >0.9999, p500pA >0.9999, p600pA >0.9999. For all bar graphs, dots represent values for individual neurons. See also Table 2.
Figure 6 with 1 supplement
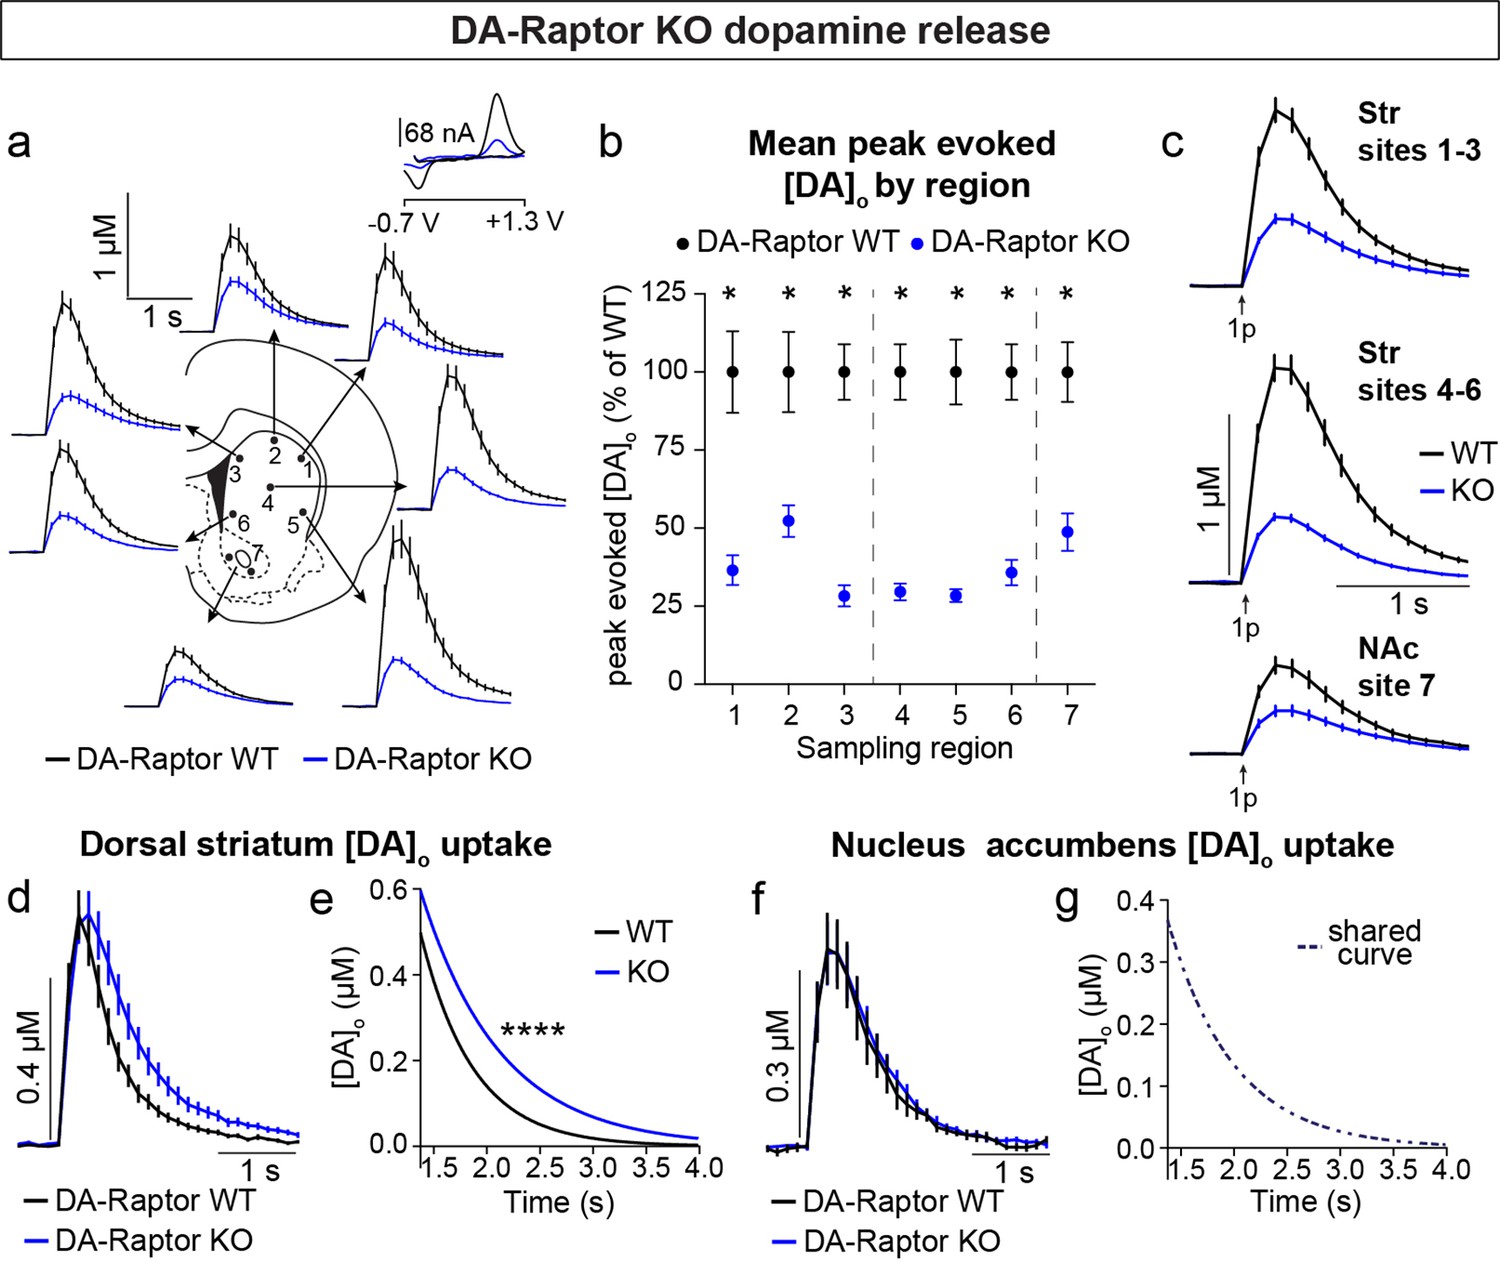
Deletion of Rptor reduces evoked DA release across all striatal regions.
(a) Mean ± SEM [DA]o versus time evoked from different striatal subregions by a single electrical pulse. Traces are an average of n=20 (sites #1,2,4), n=18 (sites #3,6), n=19 (site #5) and n=34 (site #7) transients per sampling region from five mice per genotype. DA-Raptor WT in black, DA-Raptor KO in blue. Inset, typical cyclic voltammograms show characteristic DA waveform. (b) Mean ± SEM peak [DA]o by striatal subregion expressed as a percentage of WT (sampling region numbers correspond to the sites in panel a). n=20 transients (sites #1,2,4), n=18 transients (sites #3,6), n=19 transients (site #5) and n=34 transients (site #7) per sampling region from five mice per genotype. *p1=0.0002, *p3 <0.0001, *p7 <0.0001, Wilcoxon’s two-tailed t-tests; *p2=0.0047, *p4 <0.0001, *p5 <0.0001, *p6 <0.0001, paired two-tailed t-tests. (c) Mean ± SEM [DA]o versus time averaged across all transients from three striatal territories, dorsal striatum (Str) (sites #1–3), central-ventral striatum (sites #4–6) and NAc core (site #7). Traces are an average of n=58 transients (sites #1–3), n=57 transients (sites #4–6) and n=34 transients (site #7) per sampling territory from five mice per genotype. Statistical comparisons for the peak evoked [DA]o between genotypes by sub-region: ****pStr 1-3<0.0001, ****pNAc 7<0.0001, Wilcoxon’s two-tailed t-tests; ****pStr 4-6<0.0001, paired two-tailed t-test. (d) Mean ± SEM [DA]o versus time from concentration- and site-matched FCV transients recorded in dorsal and central-ventral striatum (sites #1–6). DA-Raptor WT average of n=20 transients from five mice per genotype, DA-Raptor KO average of n=22 transients from five mice per genotype. (e) Single-phase exponential decay curve-fit of the falling phase of concentration- and site-matched striatal DA transients (from panel d). X-axis starts 375ms after stimulation. DA-Raptor WT average of n=20 transients from five mice per genotype, DA-Raptor KO average of n=22 transients from five mice per genotype. ****p<0.0001, least-squares curve-fit comparison. (f) Mean ± SEM [DA]o versus time from concentration- and site-matched FCV transients recorded in NAc core (site #7). DA-Raptor WT average of n=9 transients from five mice per genotype, DA-Raptor KO average of n=10 transients from five mice per genotype. (g) Single-phase exponential decay curve-fit of the falling phase of concentration-matched NAc DA transients (from panel f). X-axis starts 375ms after stimulation onset. DA-Raptor WT average of n=9 transients from five mice per genotype, DA-Raptor KO average of n=10 transients from five mice per genotype. p=0.4377, least-squares curve-fit comparison. See also Figure 6—figure supplement 1.
Figure 6—figure supplement 1
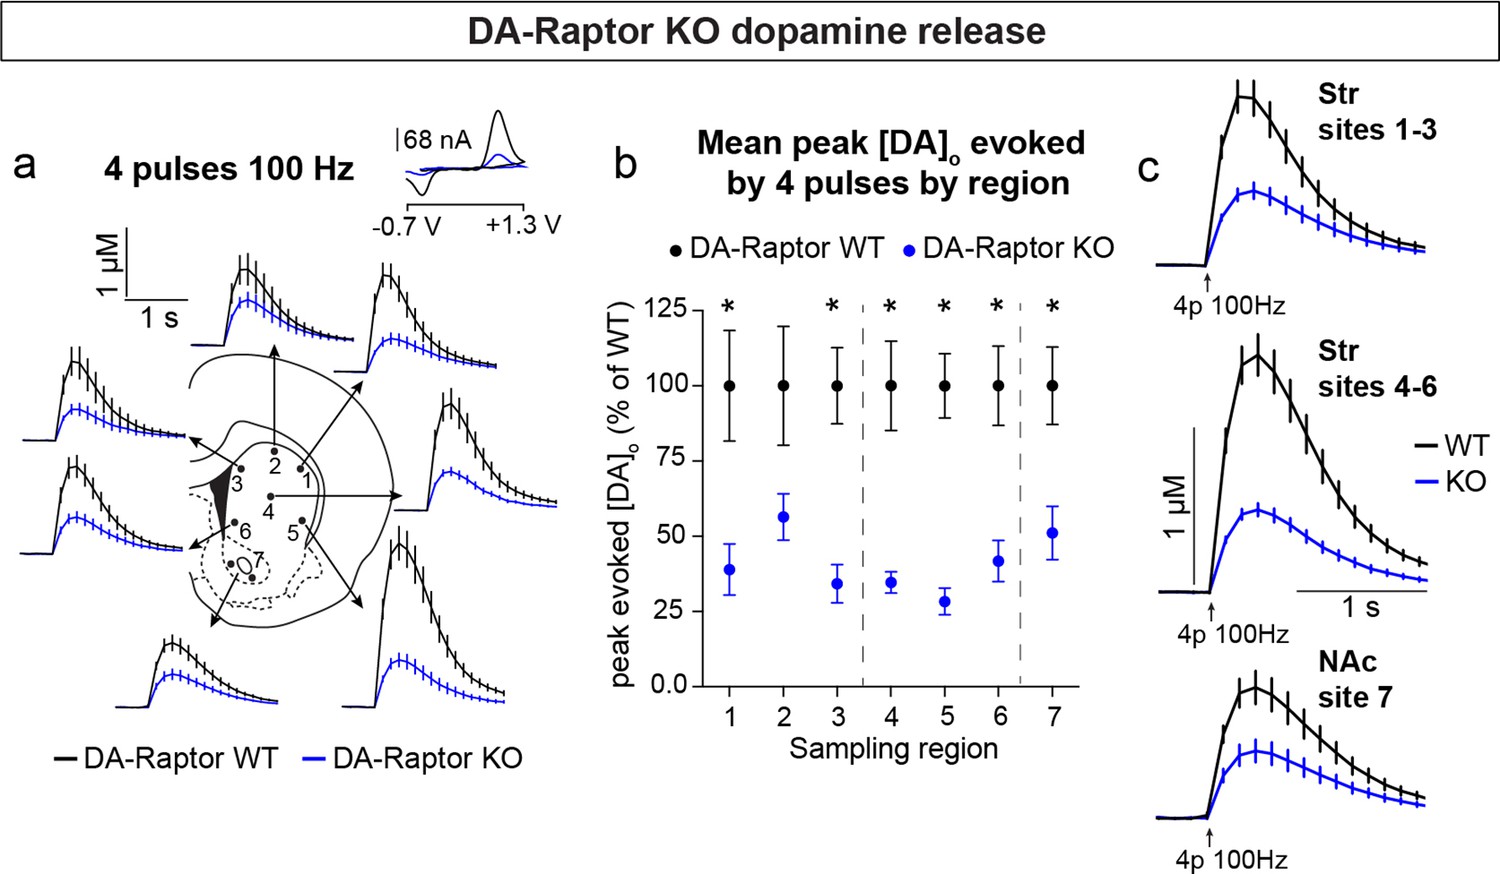
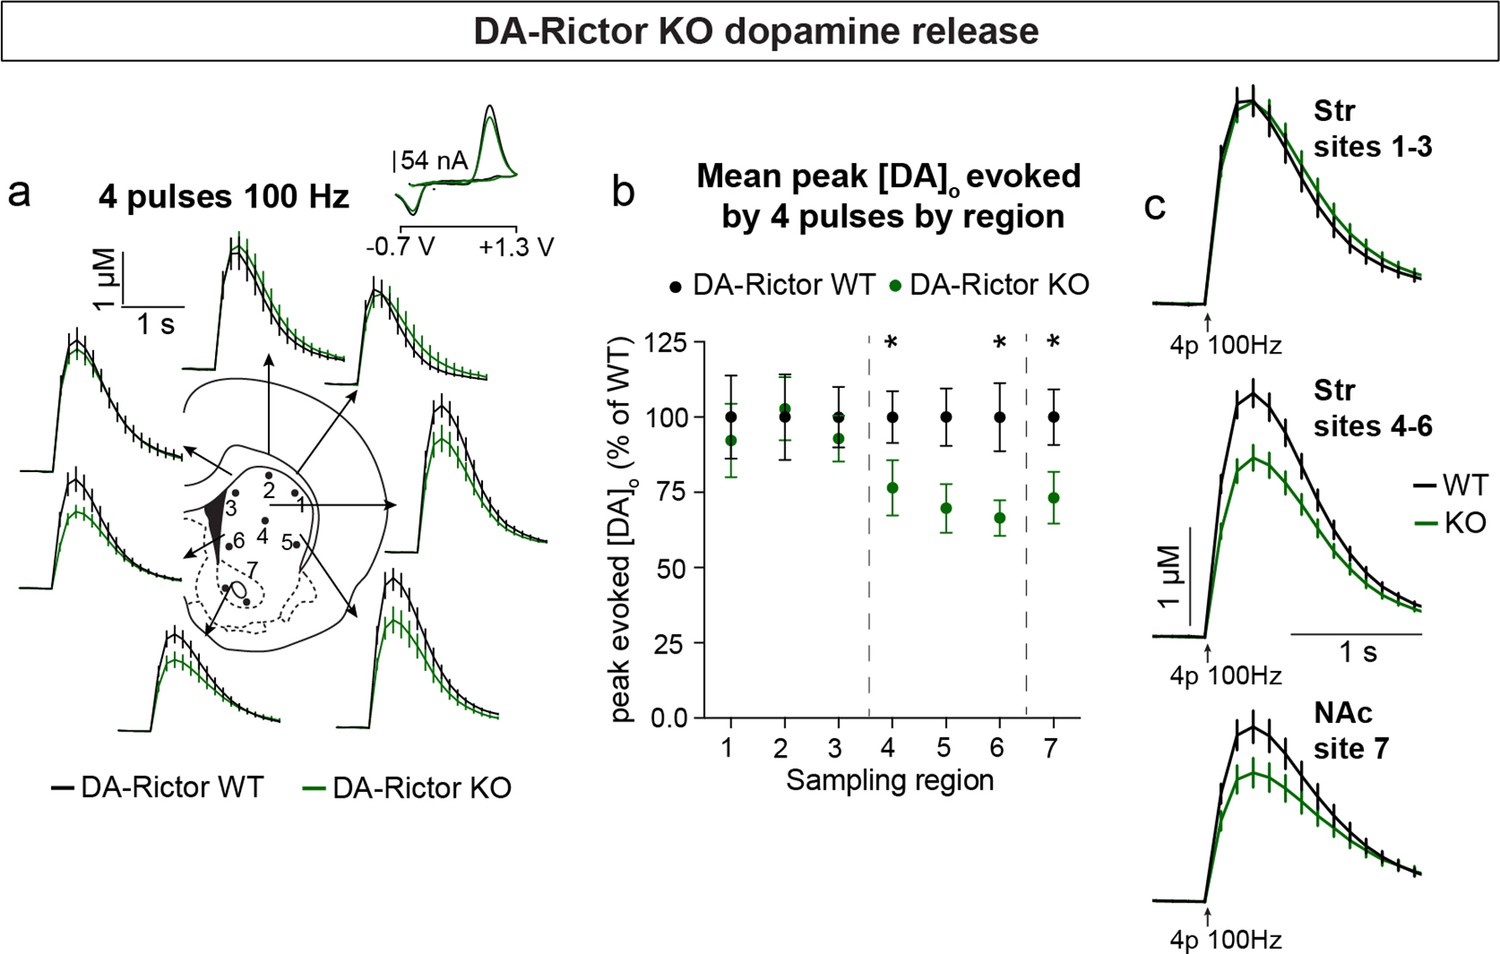
mTORC1 inhibition reduces evoked striatal DA release in response to high frequency stimulation (related to Figure 6).
(a) Mean ± SEM [DA]o versus time evoked from different striatal subregions by a high frequency train of 4 pulses delivered at 100 Hz. Traces are an average of n=10 (sites #1,2,4), n=9 (sites #3,6), n=8 (site #5) and n=17 transients (site #7) per sampling region from five mice per genotype. DA-Raptor WT in black, DA-Raptor KO in blue. Inset, typical cyclic voltammograms show characteristic DA waveform. (b) Mean ± SEM peak [DA]o by striatal subregion expressed as a percentage of WT (sampling region numbers correspond to the sites in panel a). n=10 (sites #1,2,4), n=9 (sites #3,6), n=8 (site #5), and n=17 transients (site #7) per sampling region from five mice per genotype. *p1=0.0273, *p3=0.0078, *p4=0.0020, Wilcoxon’s two-tailed t-tests; *p2=0.0826; *p5=0.0004, *p6=0.0021, *p7=0.0022, paired two-tailed t-tests. (c) Mean ± SEM [DA]o versus time averaged across all transients from three striatal territories, dorsal striatum (Str) (sites #1–3), central-ventral striatum (sites #4–6) and NAc core (site #7). Traces are an average of n=29 (sites #1–3), n=27 (sites #4–6) and n=17 transients (site #7) per sampling territory from five mice per genotype. Statistical comparisons for the peak evoked [DA]o between genotypes by subregion: ****pStr 1-3<0.0001, ****pStr 4-6<0.0001, ****pNAc 7=0.0022, paired two-tailed t-tests.
Figure 7 with 1 supplement
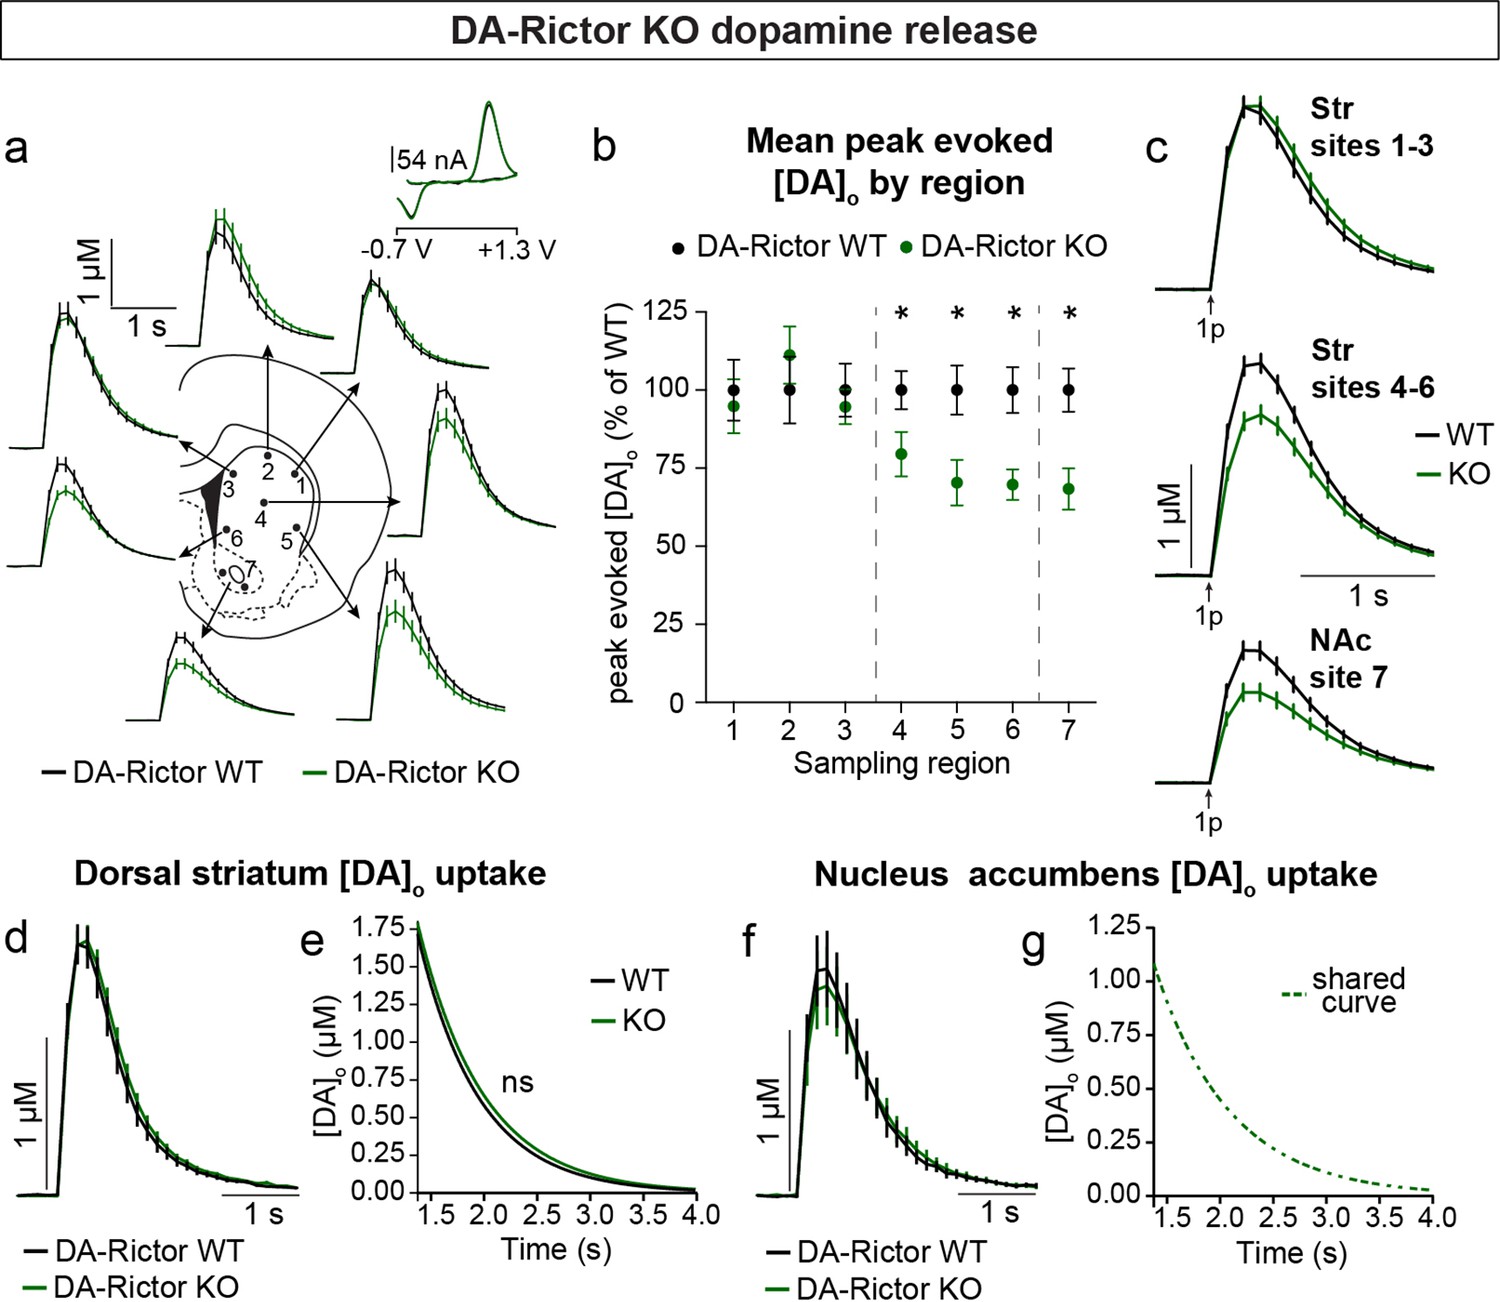
Deletion of Rictor reduces evoked DA release in central-ventral striatum and NAc.
(a) Mean ± SEM [DA]o versus time evoked from different striatal subregions by a single electrical pulse. Traces are an average of n=20 (sites #1–6) or n=40 (site #7) transients per sampling region from five mice per genotype. DA-Rictor WT in black, DA-Rictor KO in green. Inset, typical cyclic voltammograms show characteristic DA waveform. (b) Mean ± SEM peak [DA]o by striatal subregion expressed as a percentage of WT (sampling region numbers correspond to the sites in panel a). n=20 (sites #1–6) or n=40 (site #7) transients per sampling region from five mice per genotype. p1=0.5185, p2=0.2858, p3=0.4538, *p4=0.0111, *p5=0.0161, *p6=0.0003, paired two-tailed t-tests; *p7 <0.0001, Wilcoxon’s two-tailed t-test. (c) Mean ± SEM [DA]o versus time averaged across all transients from three striatal territories, dorsal striatum (Str) (sites #1–3), central-ventral striatum (sites #4–6) and NAc core (site #7). Traces are an average of n=60 transients (sites #1–3 and #4–6) or n=40 transients (site #7) per sampling territory from five mice per genotype. Statistical comparisons for the peak evoked [DA]o between genotypes by sub-region: pStr 1-3=0.9672, paired two-tailed t-test; ****pStr 4-6<0.0001, ****pNAc 7<0.0001, Wilcoxon’s two-tailed t-tests. (d) Mean ± SEM [DA]o versus time from concentration- and site-matched FCV transients recorded in dorsal and central-ventral striatum (sites #1–6). DA-Rictor WT average of n=16 transients from five mice per genotype, DA-Rictor KO average of n=17 transients from five mice per genotype. (e) Single-phase exponential decay curve-fit of the falling phase of concentration- and site-matched striatal DA transients (from panel d). X-axis starts 375ms after stimulation. DA-Rictor WT average of n=16 transients from five mice per genotype, DA-Rictor KO average of n=17 transients from five mice per genotype. p=0.0594, least-squares curve-fit comparison. (f) Mean ± SEM [DA]o versus time from concentration- and site-matched FCV transients recorded in NAc core (site #7). DA-Rictor WT average of n=10 transients from five mice per genotype, DA-Rictor KO average of n=10 transients from five mice per genotype. (g) Single-phase exponential decay curve-fit of the falling phase of concentration-matched NAc DA transients (from panel f). X-axis starts 375ms after stimulation onset. DA-Rictor WT average of n=10 transients from five mice per genotype, DA-Rictor KO average of n=10 transients from five mice per genotype. p=0.8759, least-squares curve-fit comparison. See also Figure 7—figure supplement 1.
Figure 7—figure supplement 1
mTORC2 inhibition reduces evoked ventral striatal DA release in response to high frequency stimulation (related to Figure 7).
(a) Mean ± SEM [DA]o versus time evoked from different striatal subregions by a high frequency train of 4 pulses delivered at 100 Hz. Traces are an average of n=10 (sites #1–6) or n=20 (site #7) transients per sampling region from five mice per genotype. DA-Rictor WT in black, DA-Rictor KO in green. Inset, typical cyclic voltammograms show characteristic DA waveform. (b) Mean ± SEM peak [DA]o by striatal subregion expressed as a percentage of WT (sampling region numbers correspond to the sites in panel a). n=10 (sites #1–6) or n=20 (site #7) transients per sampling region from five mice per genotype. p1=0.4354, p2=0.8331, p3=0.4252, *p4=0.0281; p5=0.0548, *p6=0.0042, *p7=0.0031, paired two-tailed t-tests. (c) Mean ± SEM [DA]o versus time averaged across all transients from three striatal territories, dorsal striatum (Str) (sites #1–3), central-ventral striatum (sites #4–6) and NAc core (site #7). Traces are an average of n=30 (sites #1–3 and #4–6) and n=20 transients (site #7) per sampling territory from five mice per genotype. Statistical comparisons for the peak evoked [DA]o between genotypes by subregion: pStr 1-3=0.4522, Wilcoxon’s two-tailed t-test; ****pStr 4-6<0.0001, **pNAc 7 = 0.0031, paired two-tailed t-tests.
Figure 8
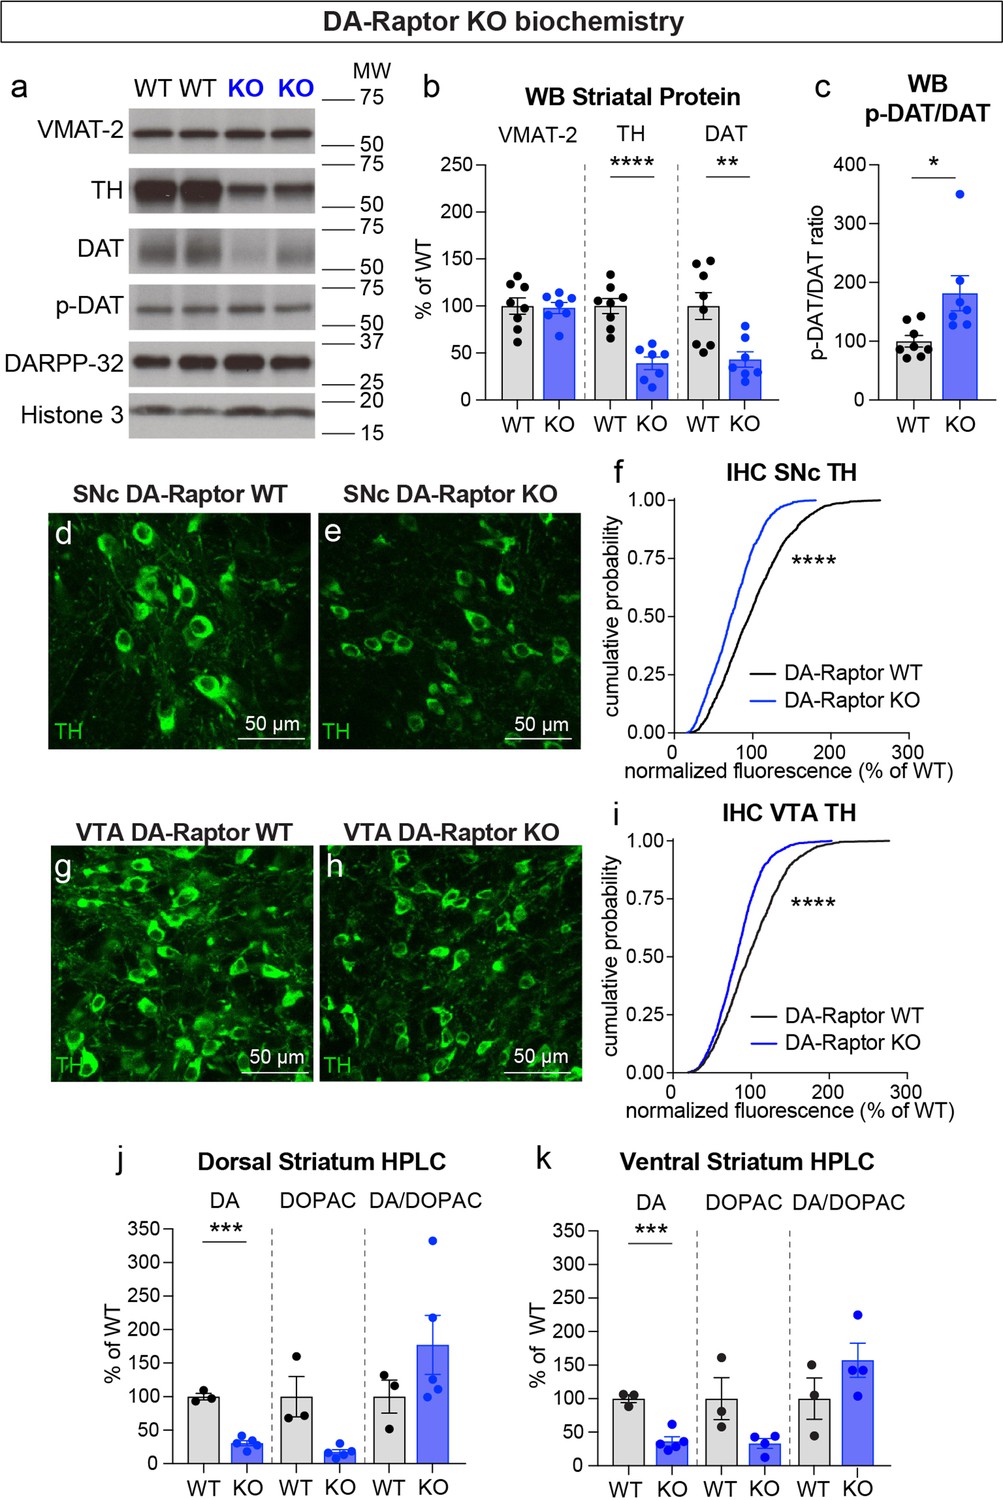
Deletion of Rptor reduces TH expression and DA synthesis.
(a) Striatal lysates were harvested from DA-Raptor WT or KO mice. Representative western blots for vesicular monoamine transporter-2 (VMAT-2), tyrosine hydroxylase (TH), DA transporter (DAT), DAT phosphorylated on Thr53 (p-DAT), DARPP-32 and Histone 3. Two independent samples per genotype are shown. Observed molecular weight (MW) is noted on the right. See also Figure 8—source data 1 and 2. (b) Mean ± SEM striatal protein content of VMAT-2, TH and DAT. Dots represent values for individual mice (averaged from two samples per mouse). n=8 DA-Raptor WT mice in black and n=7 DA-Raptor KO mice in blue. VMAT-2, p=0.8476; TH, ****p<0.0001; DAT, **p=0.0053, Welch’s two-tailed t-tests. (c) Mean ± SEM ratio of DAT phosphorylated at Thr53 (p-DAT) to total DAT protein, *p=0.0340, Welch’s two-tailed t-test. (d,e) Representative confocal images of SNc neurons from DA-Raptor WT (d) or DA-Raptor KO (e) mice immunostained for TH, scale bars = 50 μm. (f) Cumulative distributions of TH levels in SNc DA neurons. DA-Raptor WT in black: n=1,024 neurons from three mice, DA-Raptor KO in blue: n=1045 neurons from three mice, ****p<0.0001, Kolmogorov–Smirnov test. (g,h) Representative confocal images of VTA neurons from DA-Raptor WT (g) or DA-Raptor KO (h) mice immunostained for TH, scale bars = 50 μm. (i) Cumulative distribution of TH levels in VTA DA neurons. DA-Raptor WT in black: n=1389 neurons from three mice, DA-Raptor KO in blue: n=1526 neurons from three mice, ****p<0.0001, Kolmogorov–Smirnov test. (j,k) Mean ± SEM total tissue content of DA, 3,4-dihydroxyphenylacetic acid (DOPAC) and the DOPAC/DA ratio per mouse assessed by HPLC from tissue punches from dorsal striatum (j) or ventral striatum (k). Dots represent values for individual mice (averaged from two samples per mouse). n=3 DA-Raptor WT mice in black and n=5 DA-Raptor KO mice in blue (n=4 DA-Raptor KO mice in blue for ventral striatum DOPAC). Dorsal striatum DA, ***p=0.0002, DOPAC, p=0.1084, DA/DOPAC ratio, p=0.1790, Welch’s two-tailed t-tests. Ventral striatum DA, ***p=0.0005, DOPAC, p=0.1599, DA/DOPAC ratio, p=0.2190, Welch’s two-tailed t-tests. See also Figure 8—source data 3 for a summary of the raw HPLC measurement values.
-
Figure 8—source data 1
Western blot scans for the data presented in Figure 8a–c (DA-Raptor WT and KO).
The scans used for quantification for each antibody are indicated by the arrows. Films containing the first batch of samples (Gel 1) are shown.
- https://cdn.elifesciences.org/articles/75398/elife-75398-fig8-data1-v1.pdf
-
Figure 8—source data 2
Western blot scans for the data presented in Figure 8a–c (DA-Raptor WT and KO).
The scans used for quantification for each antibody are indicated by the arrows. Films containing the second batch of samples (Gel 2) are shown. Shown in red are the cropped regions presented in Figure 8a. W=wild type, K=knock out.
- https://cdn.elifesciences.org/articles/75398/elife-75398-fig8-data2-v1.pdf
-
Figure 8—source data 3
Summary of raw values for HPLC measurements for DA-Raptor WT and KO mice.
- https://cdn.elifesciences.org/articles/75398/elife-75398-fig8-data3-v1.docx
Figure 9
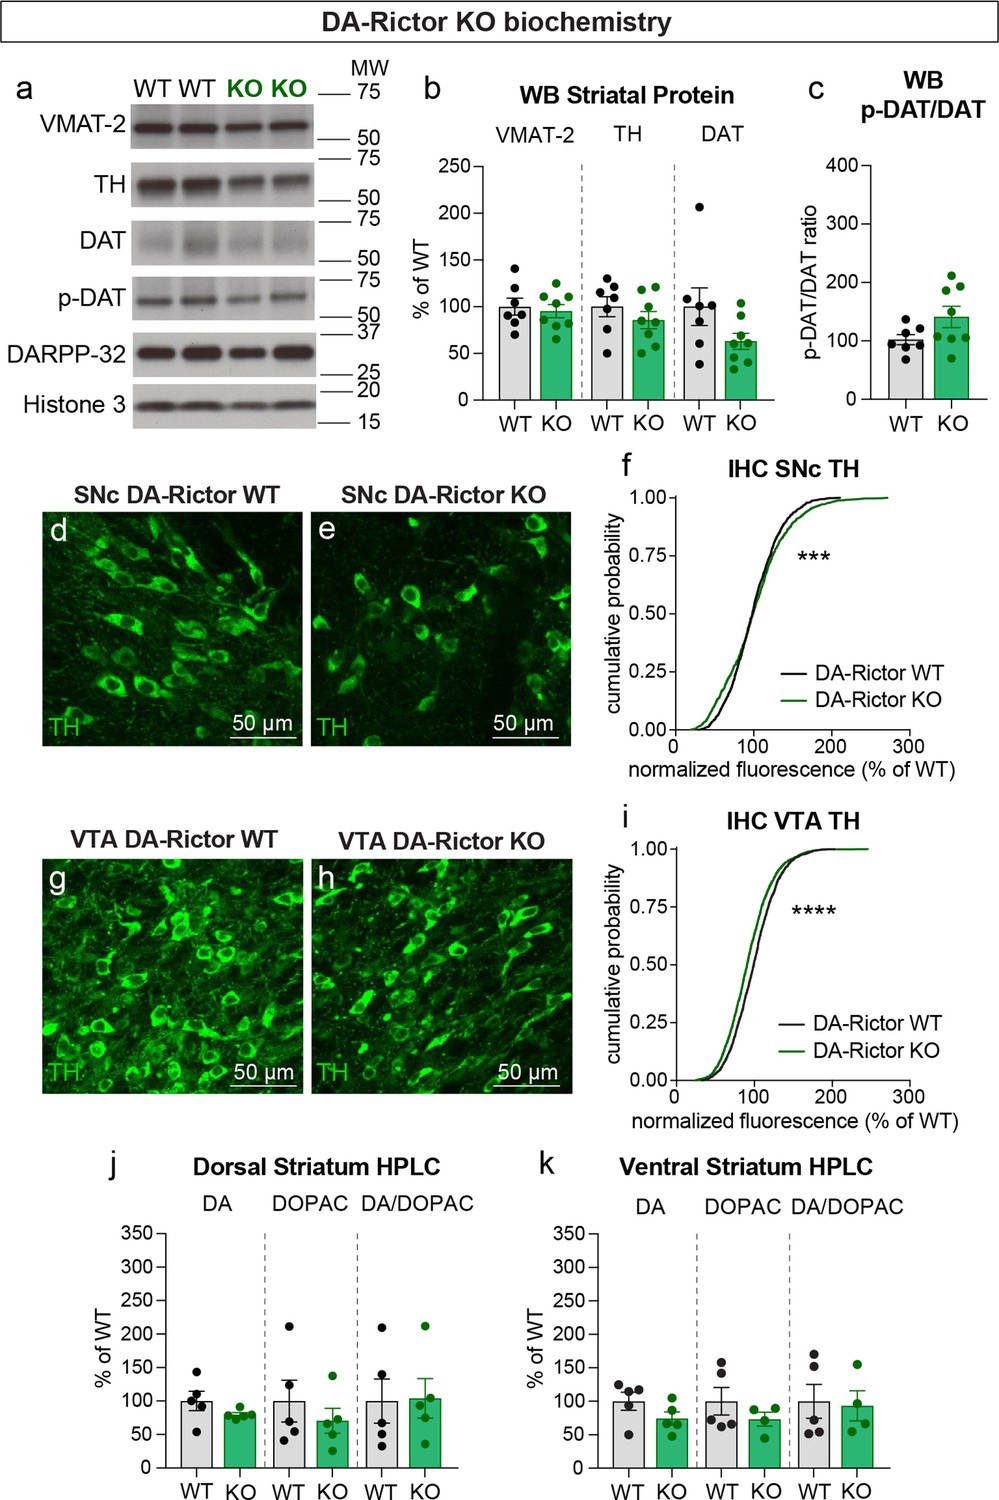
Deletion of Rictor does not alter striatal DA synthesis.
(a) Striatal lysates were harvested from DA-Rictor WT or KO mice. Representative western blots for vesicular monoamine transporter-2 (VMAT-2), tyrosine hydroxylase (TH), DA transporter (DAT), DAT phosphorylated at Thr53 (p-DAT), DARPP-32 and Histone 3. Observed molecular weight (MW) is noted on the right. See also Figure 9—source data 1–2. (b) Mean ± SEM striatal protein content of VMAT-2, TH and DAT. Dots represent values for individual mice (averaged from two samples per mouse). n=7 DA-Rictor WT mice in black and n=8 DA-Rictor KO mice in green. VMAT-2, p=0.6882; TH, p=0.3281; DAT, p=0.1282 Welch’s two-tailed t-tests. (c) Mean ± SEM ratio of DAT phosphorylated at Thr53 (p-DAT) to total DAT protein, p=0.0838, Welch’s two-tailed t-test. (d,e) Representative confocal images of SNc neurons from DA-Rictor WT (d) or DA-Rictor KO (e) mice immunostained for TH, scale bars = 50 μm. (f) Cumulative distributions of TH levels in SNc DA neurons. DA-Rictor WT in black: n=1280 neurons from three mice, DA-Rictor KO in green: n=1550 neurons from four mice, ***p=0.0009, Kolmogorov–Smirnov test. (g,h) Representative confocal images of VTA neurons from DA-Rictor WT (g) or DA-Rictor KO (h) mice immunostained for TH, scale bars = 50 μm. (i) Cumulative distribution of TH levels in VTA DA neurons. DA-Rictor WT in black: n=1968 neurons from three mice, DA-Rictor KO in green: n=2370 neurons from four mice, ****p<0.0001, Kolmogorov–Smirnov test. (j,k) Mean ± SEM total tissue content of DA, 3,4-dihydroxyphenylacetic acid (DOPAC) and the DOPAC/DA ratio per mouse assessed by HPLC from tissue punches from dorsal striatum (j) or ventral striatum (k). Dots represent values for individual mice (averaged from two samples per mouse). n=5 DA-Rictor WT mice in black and n=5 DA-Rictor KO mice in green (n=4 DA-Rictor KO mice in green for ventral striatum DOPAC). Dorsal striatum DA, p=0.2356, DOPAC, p=0.4438, DA/DOPAC ratio, p=0.9289, Welch’s two-tailed t-tests. Ventral striatum DA, p=0.1648, DOPAC, p=0.2896, DA/DOPAC ratio, p=0.8455, Welch’s two-tailed t-tests. See also Figure 9—source data 3 for a summary of the raw HPLC measurement values.
-
Figure 9—source data 1
Western blot scans for the data presented in Figure 9a–c (DA-Rictor WT and KO).
The scans used for quantification for each antibody are indicated by the arrows. Films containing the first batch of samples (Gel 1) are shown.
- https://cdn.elifesciences.org/articles/75398/elife-75398-fig9-data1-v1.pdf
-
Figure 9—source data 2
Western blot scans for the data presented in Figure 9a–c (DA-Rictor WT and KO).
The scans used for quantification for each antibody are indicated by the arrows. Films containing the second batch of samples (Gel 2) are shown. Shown in red are the cropped regions presented in Figure 9a. W=wild type, K=knock out.
- https://cdn.elifesciences.org/articles/75398/elife-75398-fig9-data2-v1.pdf
-
Figure 9—source data 3
Summary of raw values for HPLC measurements for DA-Rictor WT and KO mice.
- https://cdn.elifesciences.org/articles/75398/elife-75398-fig9-data3-v1.docx
Figure 10
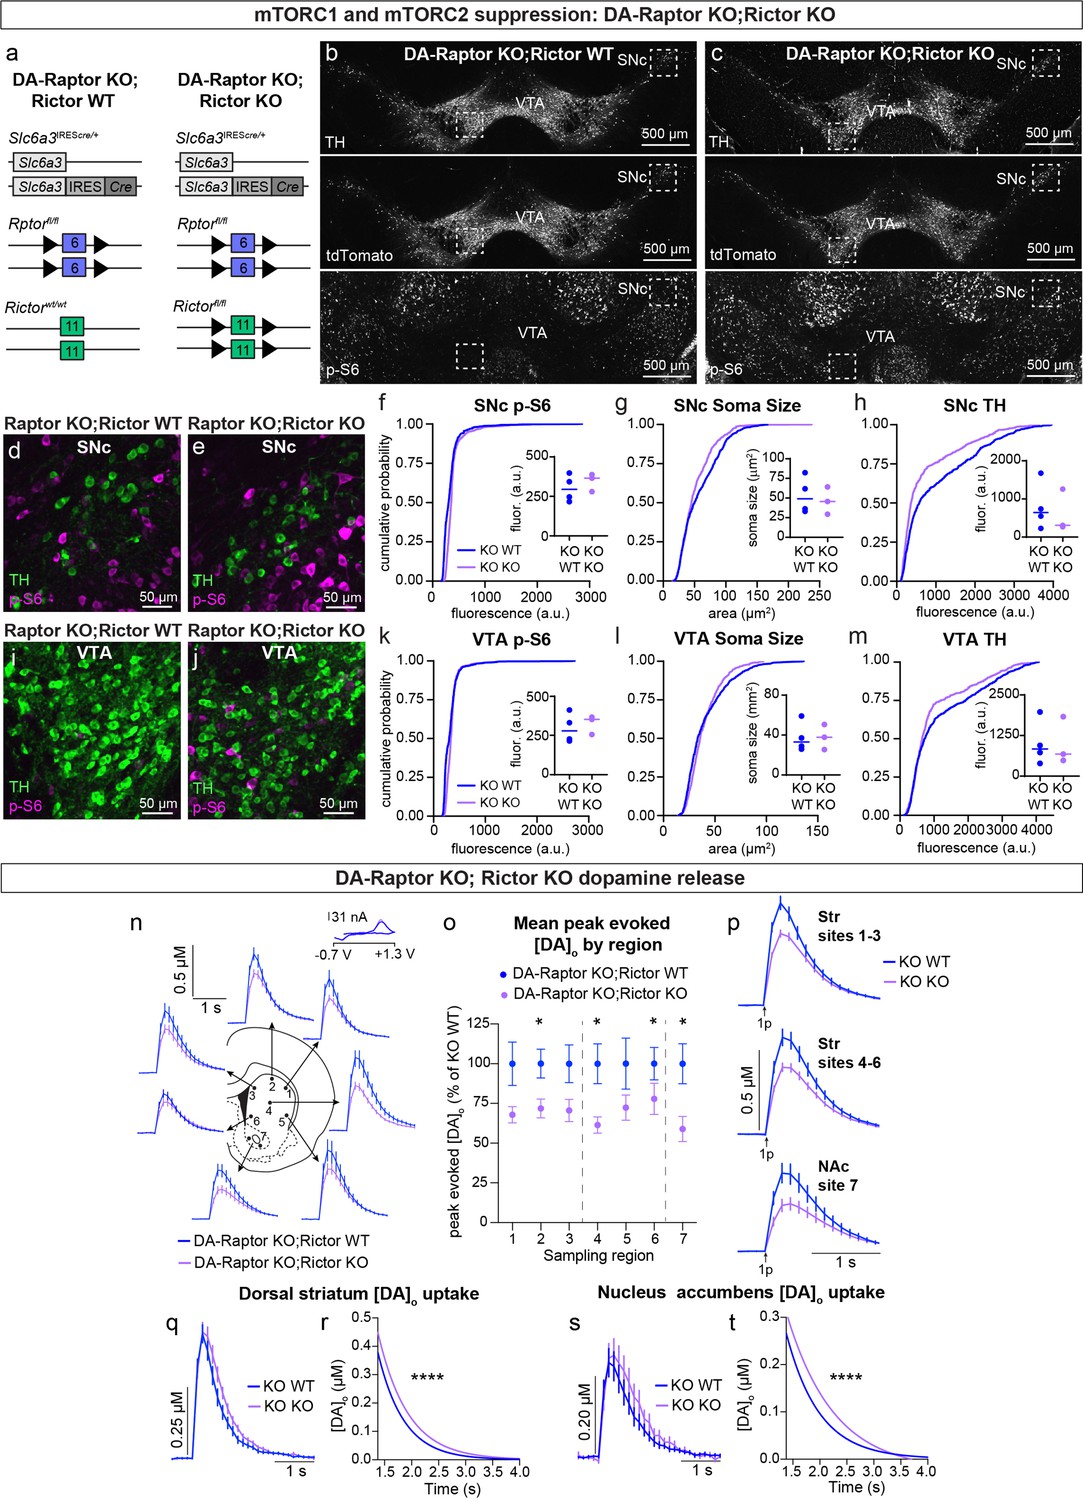
Double knock-out of Rptor and Rictor strongly impairs DA synthesis, release, and re-uptake.
(a) Schematic of the genetic strategy to delete either Rptor alone or Rptor and Rictor selectively from DA neurons. Numbered boxes represent exons and triangles represent loxP sites. (b,c) Representative confocal images of midbrain sections from DA-Raptor KO;Rictor WT (b) and DA-Raptor KO;Rictor KO (c) mice with DA neurons visualized by Cre-dependent tdTomato expression and tyrosine hydroxylase (TH) immunostaining. Bottom panels show p-S6 (Ser240/244) immunostaining. Scale bars = 500 μm. (d,e) Higher magnification merged images of the boxed SNc regions in panels b and c, showing TH (green) and p-S6 (magenta), scale bars = 50 μm. (f–h) Cumulative distributions of SNc DA neuron p-S6 levels (f), soma area (g) and TH expression (h). DA-Raptor KO;Rictor WT in blue: n=1040 neurons from four mice, DA-Raptor KO;Rictor KO in purple: n=780 neurons from three mice, ****p<0.0001, Kolmogorov–Smirnov tests. Inset plots show the median per mouse, dots represent individual mice. Lines represent median per genotype. a.u.=arbitrary units. (i,j) Higher magnification merged images of the boxed VTA regions in panels b and c, showing TH (green) and p-S6 (magenta), scale bars = 50 μm. (k–m) Cumulative distributions of VTA DA neuron p-S6 levels (k), soma area (l) and TH expression (m). DA-Raptor KO;Rictor WT in blue: n=1,172 neurons from four mice, DA-Raptor KO;Rictor KO in purple: n=879 neurons from three mice. ****P<0.0001, Kolmogorov–Smirnov tests. Inset plots show the median per mouse, dots represent individual mice. Lines represent median per genotype. (n) Mean ± SEM [DA]o versus time evoked from different striatal subregions elicited by a single electrical pulse. Traces are an average of n=24 (sites #1–6) or n=48 (site #7) transients per sampling region from six mice per genotype. DA-Raptor KO;Rictor WT in blue and DA-Raptor KO;Rictor KO in purple. Inset, typical cyclic voltammograms show characteristic DA waveform. (o) Mean ± SEM peak [DA]o by striatal subregion expressed as a percentage of DA-Raptor KO;Rictor WT (sampling region numbers correspond to the sites in panel n). n=24 (sites #1–6) or n=48 (site #7) transients per sampling region from six mice per genotype. p1=0.1208, p3=0.0691, p5=0.1875, *p6=0.0425, *p7=0.0002, Wilcoxon’s two-tailed t-tests; *p2=0.0238, *p4=0.0098, paired two-tailed t-tests. (p) Mean ± SEM [DA]o versus time averaged across all transients from three striatal territories, dorsal striatum (Str) (sites #1–3), central-ventral striatum (sites #4–6) and NAc core (site #7). Traces are an average of n=72 transients (sites #1–3 and #4–6) or n=48 transients (site #7) per sampling territory from six mice per genotype. Statistical comparisons for the peak evoked [DA]o between genotypes by sub-region: ***pStr 1-3=0.0004, **pStr 4-6=0.0019, ***pNAc 7 = 0.0002, Wilcoxon’s two-tailed t-tests. (q) Mean ± SEM [DA]o versus time from concentration- and site-matched FCV transients recorded in dorsal and central-ventral striatum (sites #1–6). DA-Raptor KO;Rictor WT (“KO WT”) in blue and DA-Raptor KO;Rictor KO (“KO KO”) in purple. DA-Raptor KO;Rictor WT average of n=26 transients from six mice per genotype, DA-Raptor KO;Rictor KO average of n=24 transients from six mice per genotype. (r) Single-phase exponential decay curve-fit of the falling phase of concentration- and site-matched striatal DA transients (from panel q). X-axis starts 375ms after stimulation. DA-Raptor KO;Rictor WT average of n=26 transients from six mice per genotype, DA-Raptor KO;Rictor KO average of n=24 transients from six mice per genotype. ****P<0.0001, least-squares curve-fit comparison. (s) Mean ± SEM [DA]o versus time from concentration- and site-matched FCV transients recorded in NAc core (site #7). DA-Raptor KO;Rictor WT (“KO WT”) in blue and DA-Raptor KO;Rictor KO (“KO KO”) in purple. DA-Raptor KO;Rictor WT average of n=10 transients from five mice per genotype, DA-Raptor KO; Rictor KO average of n=9 transients from five mice per genotype. (t) Single-phase exponential decay curve-fit of the falling phase of concentration-matched NAc DA transients (from panel s). X-axis starts 375ms after stimulation onset. DA-Raptor KO;Rictor WT average of n=10 transients from five mice per genotype, DA-Raptor KO;Rictor KO average of n=9 transients from five mice per genotype. ****p<0.0001, least-squares curve-fit comparison.
Author response image 1
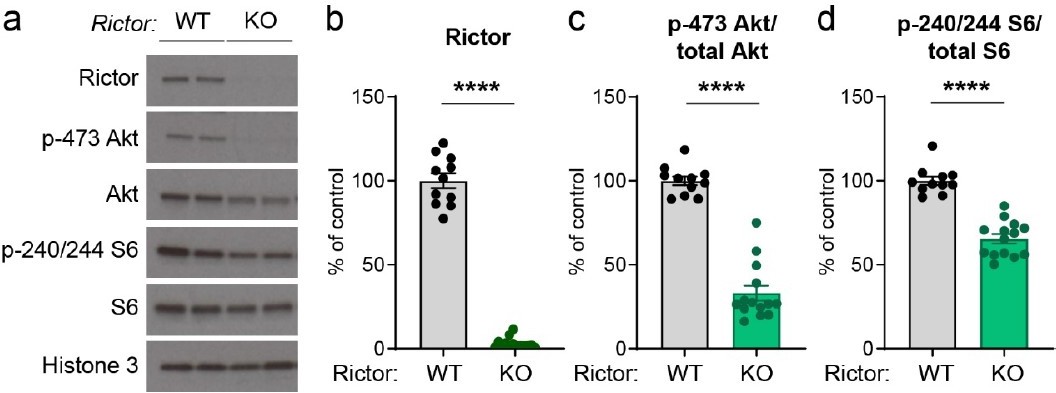
Conditional deletion of Rictor suppresses Akt and S6 phosphorylation.
Primary hippocampal cultures were prepared from Rictorfl/fl mice and AAV-GFP (WT) or AAV-Cre (KO) was added on DIV 2. Cultures were harvested for western blotting on DIV 14. (a) Representative western blots for the indicated proteins (two independent samples are shown). (b-d) Quantification of western blots (mean +/- SEM) for Rictor (b), p-473 Akt normalized to total Akt (c) and p-240/244 S6 normalized to total S6 (d). Dots represent individual culture wells. ****, p<0.0001, Mann-Whitney tests. n=11 Rictor WT and 14 Rictor KO samples.
Author response image 2
Videos
Video 1
3D rendering of tdTomato-labeled DA axons in the dorsolateral striatum.
3D rendering of tdTomato-labeled Raptor KO DA axons (Rptorfl/fl;Slc6a3IREScre/+;ROSA26Ai9/+ mouse) in the dorsolateral striatum (DLS).Tissue sections were expanded ~4 x using ProExM. Video shows a 41.87 × 41.87 x 50.52 μm volume generated from z-stack lightsheet images (normalized by expansion factor).
Video 2
Video of z-stack lightsheet images of tdTomato-labeled Tsc1 WT and Tsc1 KO DA axons in the nucleus accumbens core.
Striatal sections containing tdTomato-labeled DA axons from DA-Tsc1 WT (Tsc1+/+;Slc6a3IREScre/+;ROSA26Ai9/+) and DA-Tsc1 KO (Tsc1fl/fl;Slc6a3IREScre/+;ROSA26Ai9/+) mice were expanded with ProExM and imaged on a lightsheet microscope. Video shows 39.32 × 39.32 x 25.13 μm (DA-Tsc1 WT) and 40.84 × 40.84 x 26.10 μm (DA-Tsc1 KO) z-stacks (normalized by expansion factor) from the nucleus accumbens core (NAc).
Video 3
Video of z-stack lightsheet images of tdTomato-labeled Tsc1 WT and Tsc1 KO DA axons in the dorsolateral striatum.
Striatal sections containing tdTomato-labeled DA axons from DA-Tsc1 WT (Tsc1+/+; Slc6a3IREScre/+;ROSA26Ai9/+) and DA-Tsc1 KO (Tsc1fl/fl; Slc6a3IREScre/+;ROSA26Ai9/+) mice were expanded with ProExM and imaged on a lightsheet microscope. Video shows 38.64 × 38.64 x 32.07 μm (DA-Tsc1 WT) and 41.25 × 41.25 x 34.25 μm (DA-Tsc1 KO) z-stacks (normalized by expansion factor) from the DLS.
Video 4
Video of z-stack lightsheet images of tdTomato-labeled Raptor WT and Raptor KO DA axons in the nucleus accumbens core.
Striatal sections containing tdTomato-labeled DA axons from DA-Raptor WT (Rptor+/+;Slc6a3IREScre/+;ROSA26Ai9/+) and DA-Raptor KO (Rptorfl/fl;Slc6a3IREScre/+;ROSA26Ai9/+) mice were expanded with ProExM and imaged on a lightsheet microscope. Video shows 41.65 × 41.65 x 35.45 μm (DA-Raptor WT) and 42.08 × 42.08 x 35.81 μm (DA-Raptor KO) z-stacks (normalized by expansion factor) from the NAc.
Video 5
Video of z-stack lightsheet images of tdTomato-labeled Raptor WT and Raptor KO DA axons in the dorsolateral striatum.
Striatal sections containing tdTomato-labeled DA axons from DA-Raptor WT (Rptor+/+;Slc6a3IREScre/+;ROSA26Ai9/+) and DA-Raptor KO (Rptorfl/fl;Slc6a3IREScre/+;ROSA26Ai9/+) mice were expanded with ProExM and imaged on a lightsheet microscope. Video shows 40.97 × 40.97 x 35.60 μm (DA-Raptor WT) and 41.87 × 41.87 x 36.39 μm (DA-Raptor KO) z-stacks (normalized by expansion factor) from the DLS. For DA-Raptor KO sections, putative patch and matrix regions were imaged separately.
Video 6
Video of z-stack lightsheet images of tdTomato-labeled Rictor WT and Rictor KO DA axons in the nucleus accumbens core.
Striatal sections containing tdTomato-labeled DA axons from DA-Rictor WT (Rictor+/+;Slc6a3IREScre/+;ROSA26Ai9/+) and DA-Rictor KO (Rictorfl/fl;Slc6a3IREScre/+;ROSA26Ai9/+) mice were expanded with ProExM and imaged on a lightsheet microscope. Video shows 39.19 × 39.19 x 36.52 μm (DA-Rictor WT) and 42.58 × 42.58 x 39.67 μm (DA-Rictor KO) z-stacks (normalized by expansion factor) from the NAc.
Video 7
Video of z-stack lightsheet images of tdTomato-labeled Rictor WT and Rictor KO DA axons in the dorsolateral striatum.
Striatal sections containing tdTomato-labeled DA axons from DA-Rictor WT (Rictor+/+;Slc6a3IREScre/+;ROSA26Ai9/+) and DA-Rictor KO (Rictorfl/fl;Slc6a3IREScre/+;ROSA26Ai9/+) mice were expanded with ProExM and imaged on a lightsheet microscope. Video shows 39.62 × 39.62 x 30.17 μm (DA-Rictor WT) and 44.05 × 44.05 x 33.54 μm (DA-Rictor KO) z-stacks (normalized by expansion factor) from the DLS.
Tables
Table 1
Summary of the electrophysiology properties of DA-Raptor WT and DA-Raptor KO SNc and VTA DA neurons.
| Properties | DA-Raptor WT (SNc) | DA-Raptor KO (SNc) | WT vs KO | ||||||
|---|---|---|---|---|---|---|---|---|---|
| Mean | SEM | n (cells) | n (mice) | Mean | SEM | n (cells) | n (mice) | p-value/ test | |
| Series resistance (mOhms) | 3.269 | 0.308 | 28 | 6 | 3.494 | 0.213 | 28 | 6 | 0.0965 Mann-Whitney |
| Membrane resistance (mOhms) | 85.79 | 7.869 | 28 | 6 | 321.0 | 22.20 | 28 | 6 | <0.0001 Mann-Whitney |
| Membrane capacitance (pF) | 115.8 | 5.365 | 28 | 6 | 48.92 | 1.661 | 28 | 6 | <0.0001 unpaired t-test |
| Resting membrane potential (mV) | –56.13 | 0.904 | 28 | 6 | –53.29 | 1.372 | 28 | 6 | 0.0902 unpaired t-test |
| Rheobase (current when first action potentials occur, pA) | 156.3 | 21.54 | 28 | 6 | 66.67 | 8.333 | 27 | 6 | <0.0001 Mann-Whitney |
| Action potential (AP) threshold (mV) | –33.45 | 0.976 | 28 | 6 | –32.56 | 1.313 | 27 | 6 | 0.5885 unpaired t-test |
| Action potential peak (maximum membrane potential, mV) | 24.85 | 1.279 | 28 | 6 | 15.55 | 1.478 | 27 | 6 | <0.0001 unpaired t-test |
| Action potential height (change in membrane potential from the start of the AP to maximum depolarization, mV) | 66.44 | 1.556 | 28 | 6 | 57.74 | 1.468 | 27 | 6 | 0.0002 unpaired t-test |
| Afterhyperpolarization (minimum membrane potential after the AP, mV) | –61.70 | 1.645 | 28 | 6 | –56.17 | 1.365 | 27 | 6 | 0.0127 unpaired t-test |
| Afterhyperpolarization (change in membrane potential from the start of the AP to maximum hyperpolarization, mV) | 20.11 | 1.171 | 28 | 6 | 15.06 | 1.011 | 27 | 6 | 0.0020 unpaired t-test |
| Maximum hyperpolarization in response to –100 pA (from ~–70 mV in response to a 2 second –100 pA current step, mV) | –91.04 | 1.841 | 28 | 6 | –124.4 | 2.271 | 28 | 6 | <0.0001 unpaired t-test |
| Sag component in response to –100 pA (maximum hyperpolarization minus the steady state membrane potential in the last 50ms of the current step, mV) | 11.49 | 1.060 | 28 | 6 | 19.38 | 1.283 | 28 | 6 | <0.0001 unpaired t-test |
| Sag component expressed as a percentage (sag component as a percentage of the total step size, calculated as the difference between the max hyperpolarization and baseline potential, %) | 48.99 | 2.219 | 28 | 6 | 36.18 | 2.472 | 28 | 6 | 0.0003 Mann-Whitney |
| Rebound depolarization in response to –100 pA (baseline membrane potential minus the maximum depolarization within 500ms of the end of the current step, mV) | 11.32 | 1.350 | 28 | 6 | 10.15 | 1.030 | 28 | 6 | 0.4946 unpaired t-test |
| Rebound depolarization expressed as a percentage (rebound as a percentage of the total step size, calculated as the difference between the max hyperpolarization and baseline potential, %) | 50.77 | 6.156 | 28 | 6 | 19.28 | 1.961 | 28 | 6 | <0.0001 Mann-Whitney |
| Properties | DA-Raptor WT (VTA) | DA-Raptor KO (VTA) | WT vs KO | ||||||
| Mean | SEM | n (cells) | n (mice) | Mean | SEM | n (cells) | n (mice) | p-value/ test | |
| Series resistance (mOhms) | 4.216 | 0.282 | 22 | 8 | 4.472 | 0.337 | 22 | 6 | 0.8617 Mann-Whitney |
| Membrane resistance (mOhms) | 463.7 | 34.41 | 22 | 8 | 485.9 | 40.15 | 22 | 6 | 0.6769 unpaired t-test |
| Membrane capacitance (pF) | 64.88 | 5.117 | 22 | 8 | 43.21 | 2.581 | 22 | 6 | 0.0005 unpaired t-test |
| Resting membrane potential (mV) | –52.03 | 2.130 | 22 | 8 | –51.42 | 3.046 | 22 | 6 | 0.8697 unpaired t-test |
| Rheobase (current when first action potentials occur, pA) | 69.32 | 6.565 | 22 | 8 | 63.64 | 16.75 | 22 | 6 | 0.0190 Mann-Whitney |
| Action potential threshold (mV) | –26.06 | 1.458 | 22 | 8 | –32.35 | 1.391 | 22 | 6 | 0.0039 Mann-Whitney |
| Action potential peak (maximum membrane potential, mV) | 17.65 | 2.180 | 22 | 8 | 10.50 | 1.708 | 22 | 6 | 0.0134 unpaired t-test |
| Action potential height (change in membrane potential from the start of the AP to maximum depolarization, mV) | 54.72 | 2.378 | 22 | 8 | 53.49 | 1.735 | 22 | 6 | 0.6766 unpaired t-test |
| Afterhyperpolarization (minimum membrane potential after the AP, mV) | –51.09 | 1.619 | 22 | 8 | –54.24 | 0.875 | 22 | 6 | 0.0942 unpaired t-test |
| Afterhyperpolarization (change in membrane potential from the start of the AP to maximum hyperpolarization, mV) | 14.02 | 0.826 | 22 | 8 | 11.83 | 0.703 | 22 | 6 | 0.0983 Mann-Whitney |
| Maximum hyperpolarization in response to –100 pA (from ~–70 mV in response to a 2 second –100 pA current step, mV) | –128.9 | 4.016 | 22 | 8 | –148.4 | 4.986 | 21 | 6 | 0.0038 unpaired t-test |
| Sag component in response to –100 pA (maximum hyperpolarization minus the steady state membrane potential in the last 50ms of the current step, mV) | 14.34 | 3.756 | 22 | 8 | 15.78 | 3.329 | 21 | 6 | 0.9329 Mann-Whitney |
| Sag component expressed as a percentage (sag component as a percentage of the total step size, calculated as the difference between the max hyperpolarization and baseline potential, %) | 20.33 | 3.465 | 22 | 8 | 19.18 | 3.388 | 21 | 6 | 0.3660 Mann-Whitney |
| Rebound depolarization in response to –100 pA (baseline membrane potential minus the maximum depolarization within 500ms of the end of the current step, mV) | 2.414 | 0.595 | 22 | 8 | 2.027 | 0.753 | 21 | 6 | 0.6219 Mann-Whitney |
| Rebound depolarization expressed as a percentage (rebound as a percentage of the total step size, calculated as the difference between the max hyperpolarization and baseline potential, %) | 3.857 | 0.777 | 22 | 8 | 2.944 | 1.177 | 21 | 6 | 0.2513 Mann-Whitney |
Table 2
Summary of the electrophysiology properties of DA-Rictor WT and DA-Rictor KO SNc and VTA DA neurons.
| Properties | DA-Rictor WT (SNc) | DA-Rictor KO (SNc) | WT vs KO | ||||||
|---|---|---|---|---|---|---|---|---|---|
| Mean | SEM | n (cells) | n (mice) | Mean | SEM | n (cells) | n (mice) | p-value/ test | |
| Series resistance (mOhms) | 2.979 | 0.249 | 21 | 4 | 2.573 | 0.171 | 27 | 8 | 0.1249 Mann-Whitney |
| Membrane resistance (mOhms) | 110.9 | 14.05 | 21 | 4 | 147.9 | 14.52 | 27 | 8 | 0.0772 Mann-Whitney |
| Membrane capacitance (pF) | 114.4 | 6.016 | 21 | 4 | 85.41 | 5.165 | 27 | 8 | 0.0006 Mann-Whitney |
| Resting membrane potential (mV) | –55.46 | 1.337 | 21 | 4 | –52.27 | 1.565 | 27 | 8 | 0.1419 unpaired t-test |
| Rheobase (current when first action potentials occur, pA) | 101.2 | 11.11 | 21 | 4 | 112.0 | 12.96 | 27 | 8 | 0.7414 Mann-Whitney |
| Action potential threshold (mV) | –32.94 | 1.520 | 21 | 4 | –31.34 | 0.974 | 27 | 8 | 0.9180 Mann-Whitney |
| Action potential peak (maximum membrane potential, mV) | 25.46 | 1.647 | 21 | 4 | 23.61 | 1.429 | 27 | 8 | 0.3964 unpaired t-test |
| Action potential height (change in membrane potential from the start of the AP to maximum depolarization, mV) | 66.31 | 1.253 | 21 | 4 | 62.61 | 1.616 | 27 | 8 | 0.1590 Mann-Whitney |
| Afterhyperpolarization (minimum membrane potential after the AP, mV) | –59.49 | 2.276 | 21 | 4 | –58.46 | 1.416 | 27 | 8 | 0.5467 Mann-Whitney |
| Afterhyperpolarization (change in membrane potential from the start of the AP to maximum hyperpolarization, mV) | 18.65 | 1.517 | 21 | 4 | 19.45 | 1.063 | 27 | 8 | 0.6582 unpaired t-test |
| Maximum hyperpolarization in response to –100 pA (from ~–70 mV in response to a 2 second –100 pA current step, mV) | –94.91 | 2.162 | 21 | 4 | –101.0 | 2.079 | 27 | 8 | 0.0490 unpaired t-test |
| Sag component in response to –100 pA (maximum hyperpolarization minus the steady state membrane potential in the last 50ms of the current step, mV) | 11.90 | 0.992 | 21 | 4 | 14.74 | 1.129 | 27 | 8 | 0.0772 Mann-Whitney |
| Sag component expressed as a percentage (sag component as a percentage of the total step size, calculated as the difference between the max hyperpolarization and baseline potential, %) | 45.96 | 2.701 | 21 | 4 | 43.63 | 2.172 | 27 | 8 | 0.5006 unpaired t-test |
| Rebound depolarization in response to –100 pA (baseline membrane potential minus the maximum depolarization within 500ms of the end of the current step, mV) | 14.17 | 4.150 | 21 | 4 | 12.02 | 1.363 | 27 | 8 | 0.8049 Mann-Whitney |
| Rebound depolarization expressed as a percentage (rebound as a percentage of the total step size, calculated as the difference between the max hyperpolarization and baseline potential, %) | 52.27 | 12.87 | 21 | 4 | 37.70 | 4.586 | 27 | 8 | 0.4212 Mann-Whitney |
| DA-Rictor WT (VTA) | DA-Rictor KO (VTA) | WT vs KO | |||||||
| Properties | Mean | SEM | n (cells) | n (mice) | Mean | SEM | n (cells) | n (mice) | p-value/ test |
| Series resistance (mOhms) | 3.608 | 0.303 | 22 | 4 | 4.239 | 0.446 | 20 | 6 | 0.2418 unpaired t-test |
| Membrane resistance (mOhms) | 485.9 | 46.92 | 22 | 4 | 606.2 | 43.56 | 20 | 6 | 0.0418 Mann-Whitney |
| Membrane capacitance (pF) | 60.06 | 3.977 | 22 | 4 | 47.28 | 4.014 | 20 | 6 | 0.0014 Mann-Whitney |
| Resting membrane potential (mV) | –49.72 | 1.700 | 22 | 4 | –50.45 | 2.267 | 20 | 6 | 0.9305 Mann-Whitney |
| Rheobase (current when first action potentials occur, pA) | 100.0 | 20.76 | 20 | 4 | 57.50 | 8.331 | 20 | 6 | 0.0299 Mann-Whitney |
| Action potential threshold (mV) | –26.61 | 2.422 | 20 | 4 | –24.32 | 1.568 | 19 | 6 | 0.4376 unpaired t-test |
| Action potential peak (maximum membrane potential, mV) | 19.25 | 2.135 | 20 | 4 | 14.25 | 2.431 | 19 | 6 | 0.1298 unpaired t-test |
| Action potential height (change in membrane potential from the start of the AP to maximum depolarization, mV) | 60.49 | 2.102 | 20 | 4 | 54.17 | 2.303 | 19 | 6 | 0.0496 unpaired t-test |
| Afterhyperpolarization (minimum membrane potential after the AP, mV) | –54.66 | 1.367 | 20 | 4 | –52.49 | 0.858 | 19 | 6 | 0.1935 unpaired t-test |
| Afterhyperpolarization (change in membrane potential from the start of the AP to maximum hyperpolarization, mV) | 14.15 | 1.135 | 20 | 4 | 12.57 | 0.883 | 19 | 6 | 0.2829 unpaired t-test |
| Maximum hyperpolarization in response to –100 pA (from ~–70 mV in response to a 2 second –100 pA current step, mV) | –135.2 | 5.016 | 22 | 4 | –143.5 | 4.862 | 20 | 6 | 0.2433 unpaired t-test |
| Sag component in response to –100 pA (maximum hyperpolarization minus the steady state membrane potential in the last 50ms of the current step, mV) | 14.20 | 1.589 | 22 | 4 | 16.73 | 3.457 | 20 | 6 | 0.7178 Mann-Whitney |
| Sag component expressed as a percentage (sag component as a percentage of the total step size, calculated as the difference between the max hyperpolarization and baseline potential, %) | 22.13 | 2.189 | 22 | 4 | 20.35 | 3.093 | 20 | 6 | 0.3888 Mann-Whitney |
| Rebound depolarization in response to –100 pA (baseline membrane potential minus the maximum depolarization within 500ms of the end of the current step, mV) | 3.42 | 0.573 | 22 | 4 | 2.720 | 0.661 | 20 | 6 | 0.4252 unpaired t-test |
| Rebound depolarization expressed as a percentage (rebound as a percentage of the total step size, calculated as the difference between the max hyperpolarization and baseline potential, %) | 6.044 | 1.290 | 22 | 4 | 3.515 | 0.808 | 20 | 6 | 0.1638 Mann-Whitney |
Table 3
Summary of the major dopaminergic phenotypes associated with mTOR signaling manipulations.
| complex | direction of change | component | role in mTOR signaling | type of manipulation | cell type affected | manipulation timing | pS6 levels | DA neuron number | DA neuron somato-dendritic morphology | DA neuron intrinsic excitability | DA neuron axonal morphology | DA release | TH expression | DA tissue content | DAT expression and function | Reference |
|---|---|---|---|---|---|---|---|---|---|---|---|---|---|---|---|---|
| mTORC1 | ↑ | Tsc1 gene (Tsc1 fl/fl) | mTORC1 signaling suppression | homozygous conditional deletion | dopaminergic neurons (DAT- Cre driver line) | embryonic | Increased in SNc and VTA (IHC) | No changes in SNc or VTA (IHC) | Increased soma size and dendritic complexity in SNc and VTA (IHC) | Increased rheobase, decreased excitability in SNc and VTA neurons | Hypertrophic axon terminals, greater enlargement in dorsal than ventral striatum (EM) | ~60% decreased evoked release, more pronounced in dorsal than ventral striatum (FCV, electrical stim) | Increased in midbrain SNc and VTA and striatum (IHC, WB) | Increased in dorsal and ventral striatum (HPLC) | Increased striatal DAT function (FCV) | Kosillo et al., 2019 |
| mTORC1 | ↓ | Rptor + Tsc1 genes (Tsc1 fl/fl; Rptor fl/fl) | mTORC1 signaling suppression + mTORC1 obligatory protein | homozygous conditional deletion | dopaminergic neurons (DAT- Cre driver line) | embryonic | Abolished in SNc and VTA (IHC) | No changes in SNc or VTA (IHC) | Decreased soma size in SNc and VTA (IHC) | — | — | ~60% decreased evoked release (FCV, electrical stim) | Decreased in midbrain SNc and VTA (IHC) | — | — | Kosillo et al., 2019 |
| mTORC1 | ↓ | Rptor gene (Rtpor fl/fl) | mTORC1 obligatory protein | homozygous conditional deletion | dopaminergic neurons (DAT- Cre driver line) | embryonic | Abolished in SNc and VTA (IHC) | Reduced in SNc and VTA (stereology) | Decreased soma size and dendritic complexity in SNc and VTA (IHC) | Decreased rheobase, increased excitability in SNc and VTA neurons at low currents, depolarization block with large depolarizing inputs | Reduced total axonal volume in dorsal and ventral striatum; reduction in both DA axon density and radius, matrix compartment most affected | ~60% decreased evoked release, dorsal and ventral striatum affected equally (FCV, electrical stim) | Decreased in midbrain SNc and VTA (IHC) and striatum (WB) | Decreased in dorsal and ventral striatum (HPLC) | Decreased striatal DAT function (FCV) and striatal DAT protein expression (WB) | this paper |
| mTORC2 | ↓ | Rictor gene (Rictor fl/fl) | mTORC2 obligatory protein | homozygous conditional deletion | dopaminergic neurons (DAT- Cre driver line) | embryonic | Decreased in SNc and VTA (IHC) | No changes in SNc or VTA (stereology) | Decreased soma size in SNc and VTA, increased proximal dendrite complexity in SNc and VTA (IHC) | Unchanged excitability in SNc, decreased rheobase and increased excitability in VTA neurons | Reduced total axonal volume in dorsal striatum, reduced axonal density in both dorsal and ventral striatum | ~25% decreased in central-ventral and ventral striatum (FCV, electrical stim) | Unchanged in striatum (WB), slightly decreased in VTA (IHC) | Unchanged in dorsal and ventral striatum (HPLC) | Unchanged DAT function (FCV) and striatal DAT protein expression (WB) | this paper |
| total mTOR | ↓ | Rptor + Rictor genes (Rtpro fl/fl; Rictor fl/fl) | mTORC1/ mTORC2 obligatory proteins | homozygous conditional deletion | dopaminergic neurons (DAT- Cre driver line) | embryonic | Abolished in SNc and VTA (IHC) | - | Decreased soma size in SNc and VTA (IHC) | — | — | ~20% decrease in evoked release in dorsal and ventral striatum compared to DA-Rptor KO alone (FCV, electrical stim) | Decreased in midbrain SNc and VTA (IHC) | — | Decreased DAT function in both striatum and NAc core (FCV) | this paper |
-
Abbreviations: DA Dopamine; DAT Dopamine Active Transporter; EM Electron Microscopy; FCV Fast-Scan Cyclic Voltammetry; HPLC High Performance Liquid Chromatography; KO Knock-out; NAc Nucleus Accumbens; SNc Substantia Nigra pars compacta; TH Tyrosine Hydroxylase; VTA Ventral Tegmental Area; WB Western Blot; IHC Immunohistochemistry; — no measurement
Key resources table
| Reagent type (species) or resource | Designation | Source or reference | Identifiers | Additional information |
|---|---|---|---|---|
| Genetic reagent (Mus musculus) | Rptorfl/fl | Jackson Laboratory | Stock #: 013188 | Male and female;C57Bl/6J background strain |
| Genetic reagent (Mus musculus) | Rictorfl/fl | Jackson Laboratory | Stock #: 020649 | Male and female;C57Bl/6J, 129 SvJae and BALB/cJ mixed background strain |
| Genetic reagent (Mus musculus) | Slc6a3IREScre | Jackson Laboratory | Stock #: 0066600 | Male and female;C57Bl/6J, CD1, 129 SvJae and BALB/cJ mixed background strain |
| Genetic reagent (Mus musculus) | ROSA26Ai9/+ | Jackson Laboratory | Stock #: 007909 | Male and female;C57Bl/6J, CD1, 129 SvJae and BALB/cJ mixed background strain |
| Antibody | Anti-tyrosine hydroxylase (mouse monoclonal) | Immunostar | Cat #: 22,941 | (1:1000) IHC (1:2000) WB |
| Antibody | Anti-phospho-S6 ribosomal protein (rabbit monoclonal) | Cell Signaling | Cat #: 5,364 S | (1:1000) IHC |
| Antibody | Anti-RFP (rabbit polyclonal) | Rockland | Cat #: 600-401-379 | (1:500) IHC |
| Antibody | Anti-mu opioid receptor (rabbit polyclonal) | EMD Millipore | Cat #: AB5511 | (1:1000) IHC |
| Antibody | Goat anti-mouse Alexa 488 secondary (goat polyclonal) | Thermo Fisher | Cat #: A11001 | (1:500) IHC |
| Antibody | Goat anti-mouse Alexa 633 secondary (goat polyclonal) | Thermo Fisher | Cat #: A21050 | (1:500) IHC |
| Antibody | Goat anti-rabbit Alexa 488 secondary (goat polyclonal) | Thermo Fisher | Cat #: A11008 | (1:500) IHC |
| Antibody | Goat anti-rabbit Alexa 546 secondary (goat polyclonal) | Thermo Fisher | Cat #: A11035 | (1:500) IHC |
| Antibody | Goat anti-rabbit Alexa 633 secondary (goat polyclonal) | Thermo Fisher | Cat #: A11034 | (1:500) IHC |
| Antibody | Anti-DARPP32 (rabbit monoclonal) | Cell Signaling | Cat #: 2,306 S | (1:1500) WB |
| Antibody | Anti-Histone-3 (mouse monoclonal) | Cell Signaling | Cat #: 96C10 | (1:1500) WB |
| Antibody | Anti-VMAT2 (rabbit polyclonal) | Alomone Labs | Cat #: AMT-006 | (1:1000) WB |
| Antibody | Anti-DAT (mouse monoclonal) | Abcam | Cat #: 128,848 | (1:1000) WB |
| Antibody | Anti DAT phospho-T53 (rabbit polyclonal) | Abcam | Cat #: 183,486 | (1:1000) WB |
| Antibody | Goat anti-rabbit HRP secondary (goat polyclonal) | Bio-Rad | Cat #: 170–5046 | (1:5000) WB |
| Antibody | Goat anti-mouse HRP secondary (goat polyclonal) | Bio-Rad | Cat #: 170–5047 | (1:5000) WB |
| Commercial assay, kit | BCA assay | Fisher | Cat #: PI23227 | |
| Commercial assay, kit | Chemiluminesence substrate | Perkin-Elmer | Cat #: NEL105001EA | |
| Peptide, recombinant protein | Streptavidin Alexa 488 conjugate | Invitrogen | Cat #: S11223 | |
| Chemical compound, drug | GYKI 52466 dihydrochloride | Tocris | Cat #: 1,454 | (10 μM) final |
| Chemical compound, drug | (R)-CPP | Tocris | Cat #: 0247 | (10 μM) final |
| Chemical compound, drug | Picrotoxin | Tocris | Cat #: 1,128 | (50 μM) final |
| Software, algorithm | IMARIS | Oxford Instruments (https://imaris.oxinst.com) | Version 9.2.1 | |
| Software, algorithm | Stereoinvestigator | MBFBiosciences (https://www.mbfbioscience.com/stereo-investigator) | ||
| Software, algorithm | Igor Pro | Wavemetrics (https://www.wavemetrics.com/products/igorpro) | Version 6.37 | |
| Software, algorithm | GraphPad Prism | GraphPad Prism (https://graphpad.com) | Version 6 + Version 8 | |
| Software, algorithm | FIJI | ImageJ (http://imagej.nih.gov) | ||
| Software, algorithm | ScanImage | Pologruto et al., 2003; Pologruto et al., 2019 (https://github.com/bernardosabatini/SabalabAcq) | ||
| Software, algorithm | TrailMap | https://github.com/kamodulin/TRAILMAP | https://doi.org/10.1073/pnas.191846511 | Modified from Friedmann et al., 2020 |
| Software, algorithm | Scale-invariant feature transform | https://github.com/kamodulin/expansion-microscopy | https://doi.org/10.1023/B:VISI.0000029664.99615.94 | Modified from Lowe, 2004 |
Additional files
Download links
A two-part list of links to download the article, or parts of the article, in various formats.
Downloads (link to download the article as PDF)
Open citations (links to open the citations from this article in various online reference manager services)
Cite this article (links to download the citations from this article in formats compatible with various reference manager tools)
Dopamine neuron morphology and output are differentially controlled by mTORC1 and mTORC2
eLife 11:e75398.
https://doi.org/10.7554/eLife.75398


