Fine-grained functional parcellation maps of the infant cerebral cortex
- Key Laboratory of Biomedical Information Engineering of Ministry of Education, Department of Biomedical Engineering, School of Life Science and Technology, Xi'an Jiaotong University, China
- Department of Radiology and Biomedical Research Imaging Center, the University of North Carolina at Chapel Hill, United States
- Department of Psychiatry, the University of North Carolina at Chapel Hill, United States
Figures
Figure 1
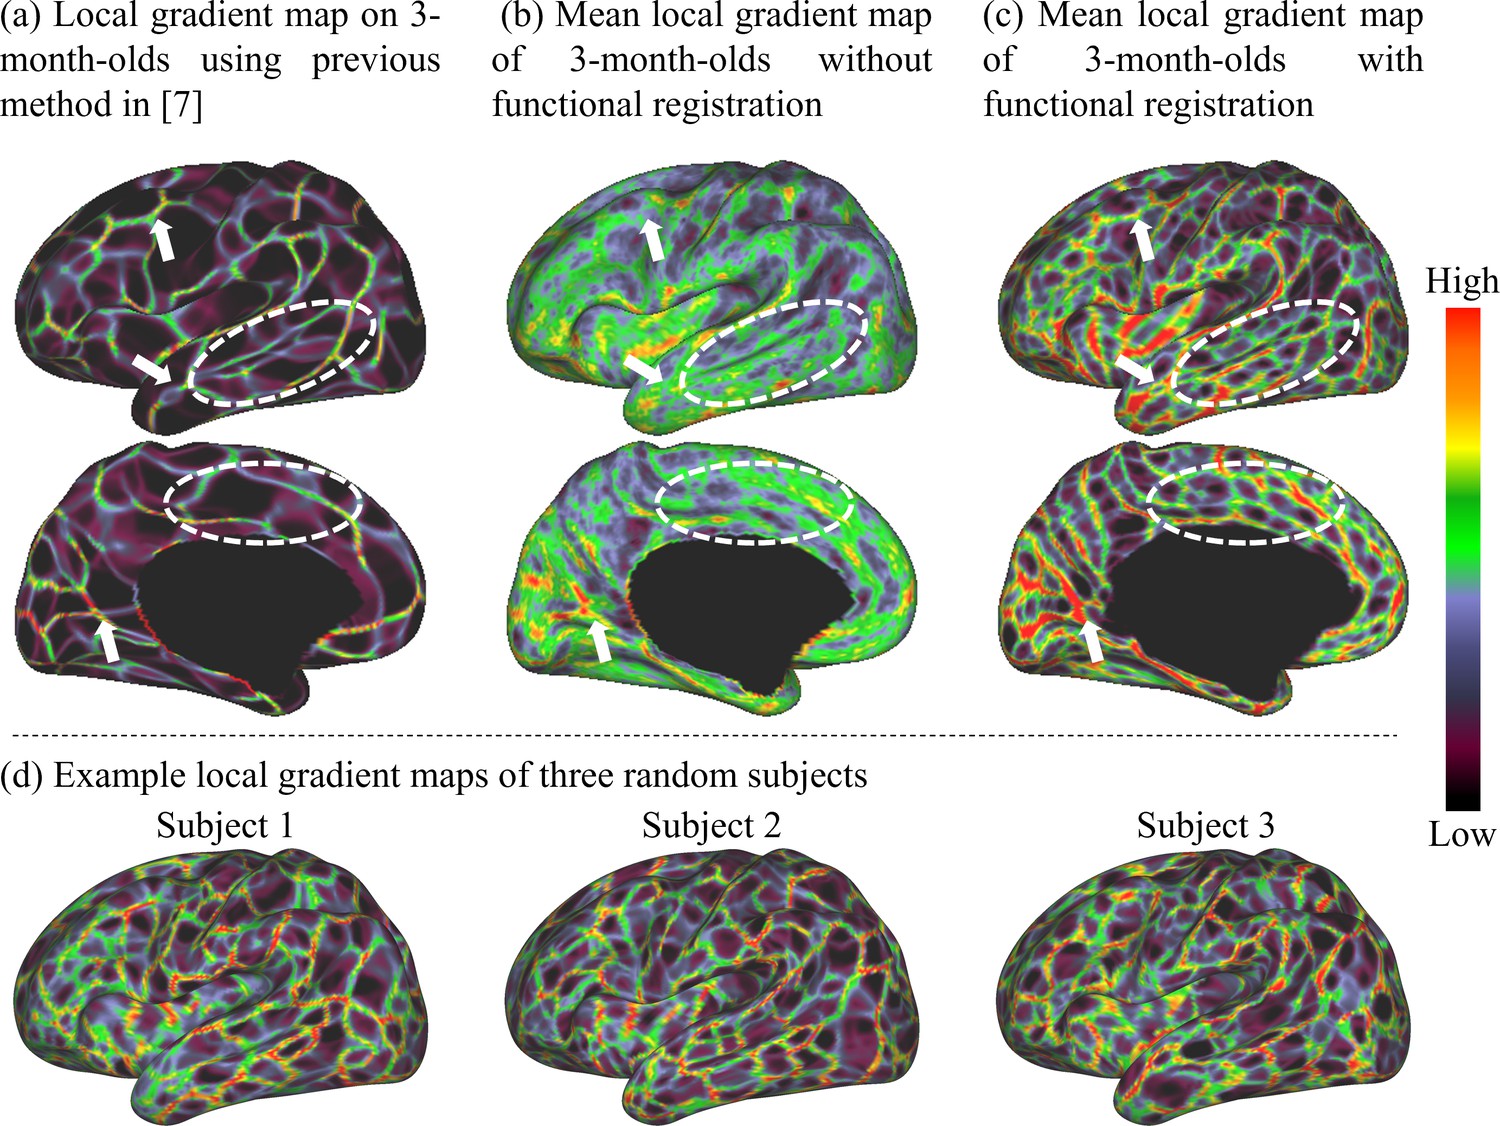
Comparison of the mean local gradient maps of functional connectivity (FC) of the 3-month age group generated by different methods, where more detailed and clearer local gradient patterns are revealed by our proposed method.
(a) The local gradient map computed directly on the average FC matrix across individuals as in Gordon et al., 2016. (b) The local gradient map computed on each individual and then averaged across individuals. (c) The local gradient map generated by our method, which computes the average of individual local gradient maps after co-registering them based on both cortical folding and local gradient features. White arrows point out consistent local gradient patterns by different methods, and white dashed circles indicate some more detailed and fine-grained patterns revealed by our method. (d) Local gradient maps of three random subjects. This figure demonstrates that many detailed local gradient patterns in individual cortices are usually missed by other methods, but are well captured by our method.
Figure 2
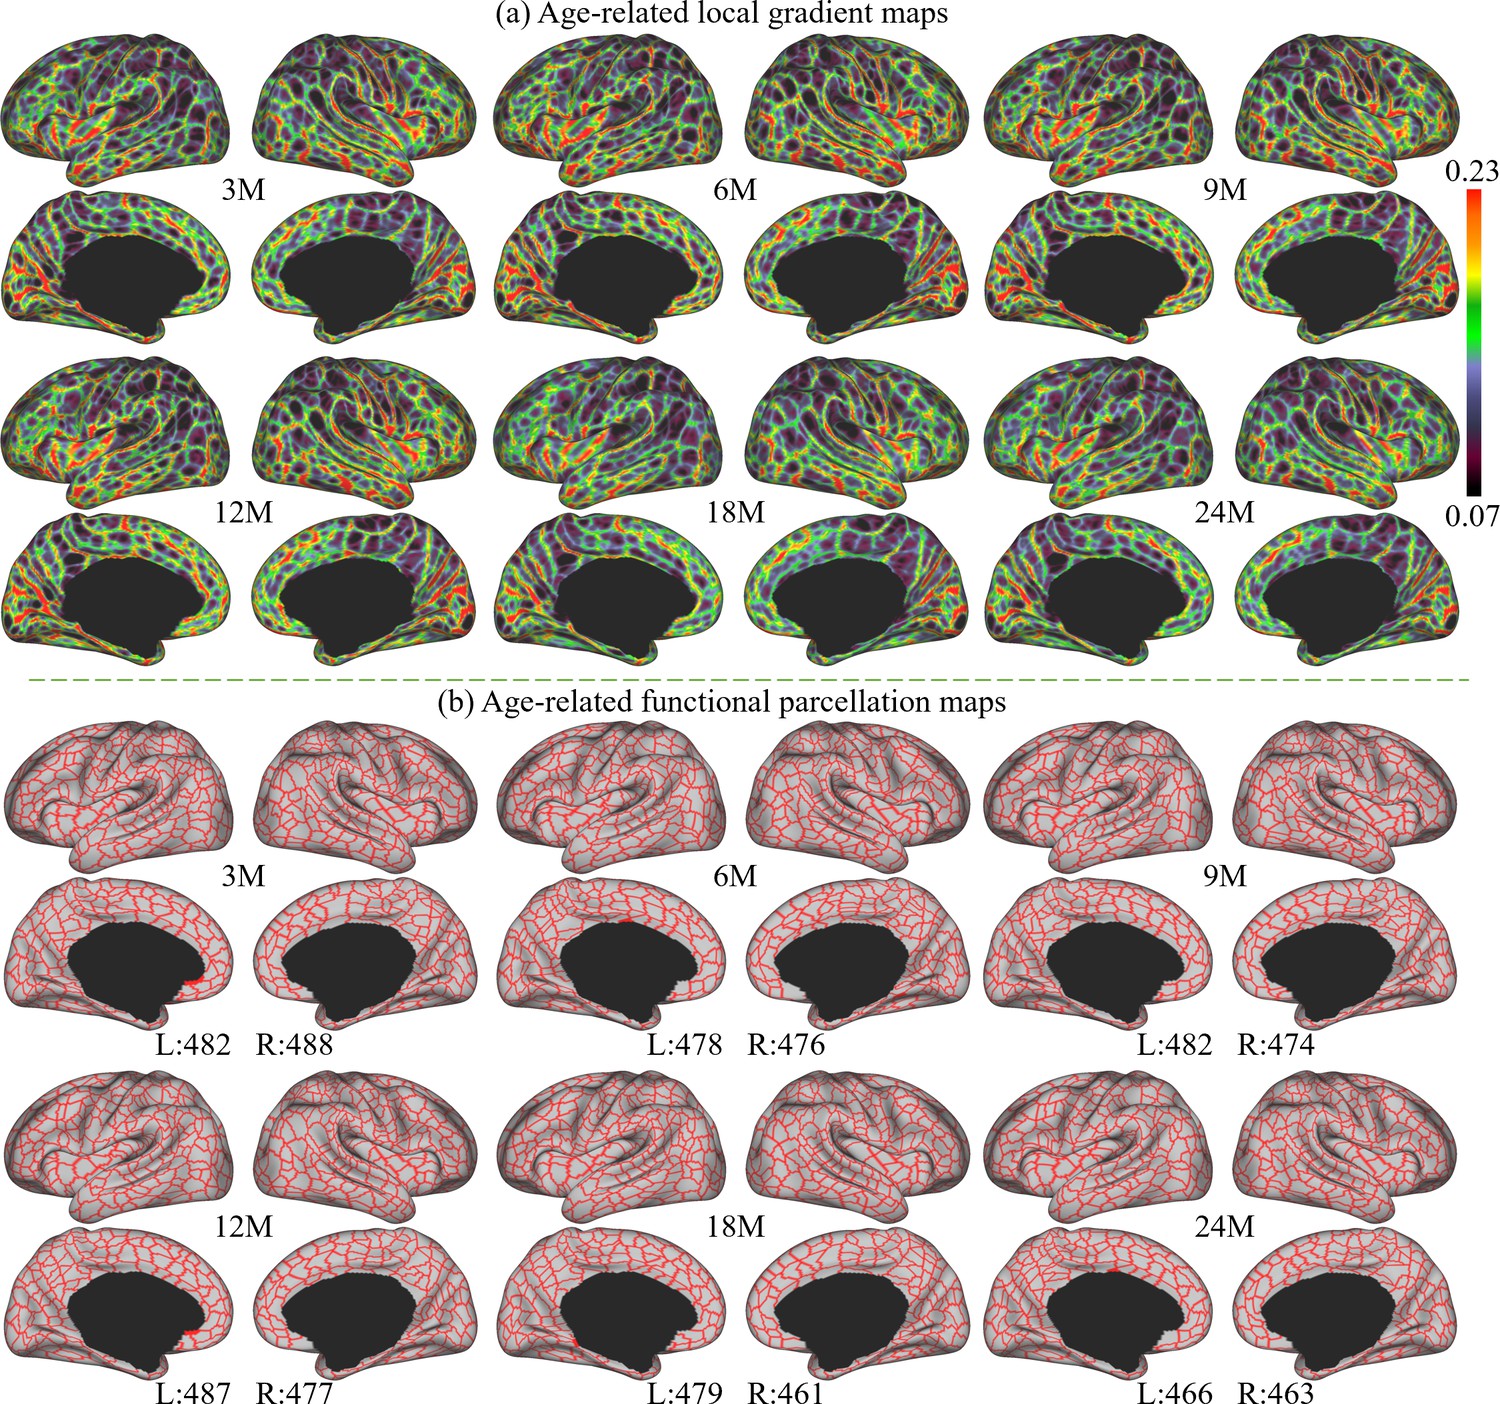
The local gradient maps and parcellation maps, where M stands for months, and 3M, 6M, 9M, 12M, 18M, and 24M represent different age groups in months defined in Table 1.
(a) The age-related local gradient maps generated at different ages, where brighter colors represent higher local gradient. (b) Age-related fine-grained functional parcellation maps were obtained from local gradient maps using a watershed algorithm without thresholding or any manual editing. The parcel numbers are annotated below the parcellation map of each age group and are observed between 461 and 493 per hemisphere (L: left hemisphere, R: right hemisphere).
Figure 3
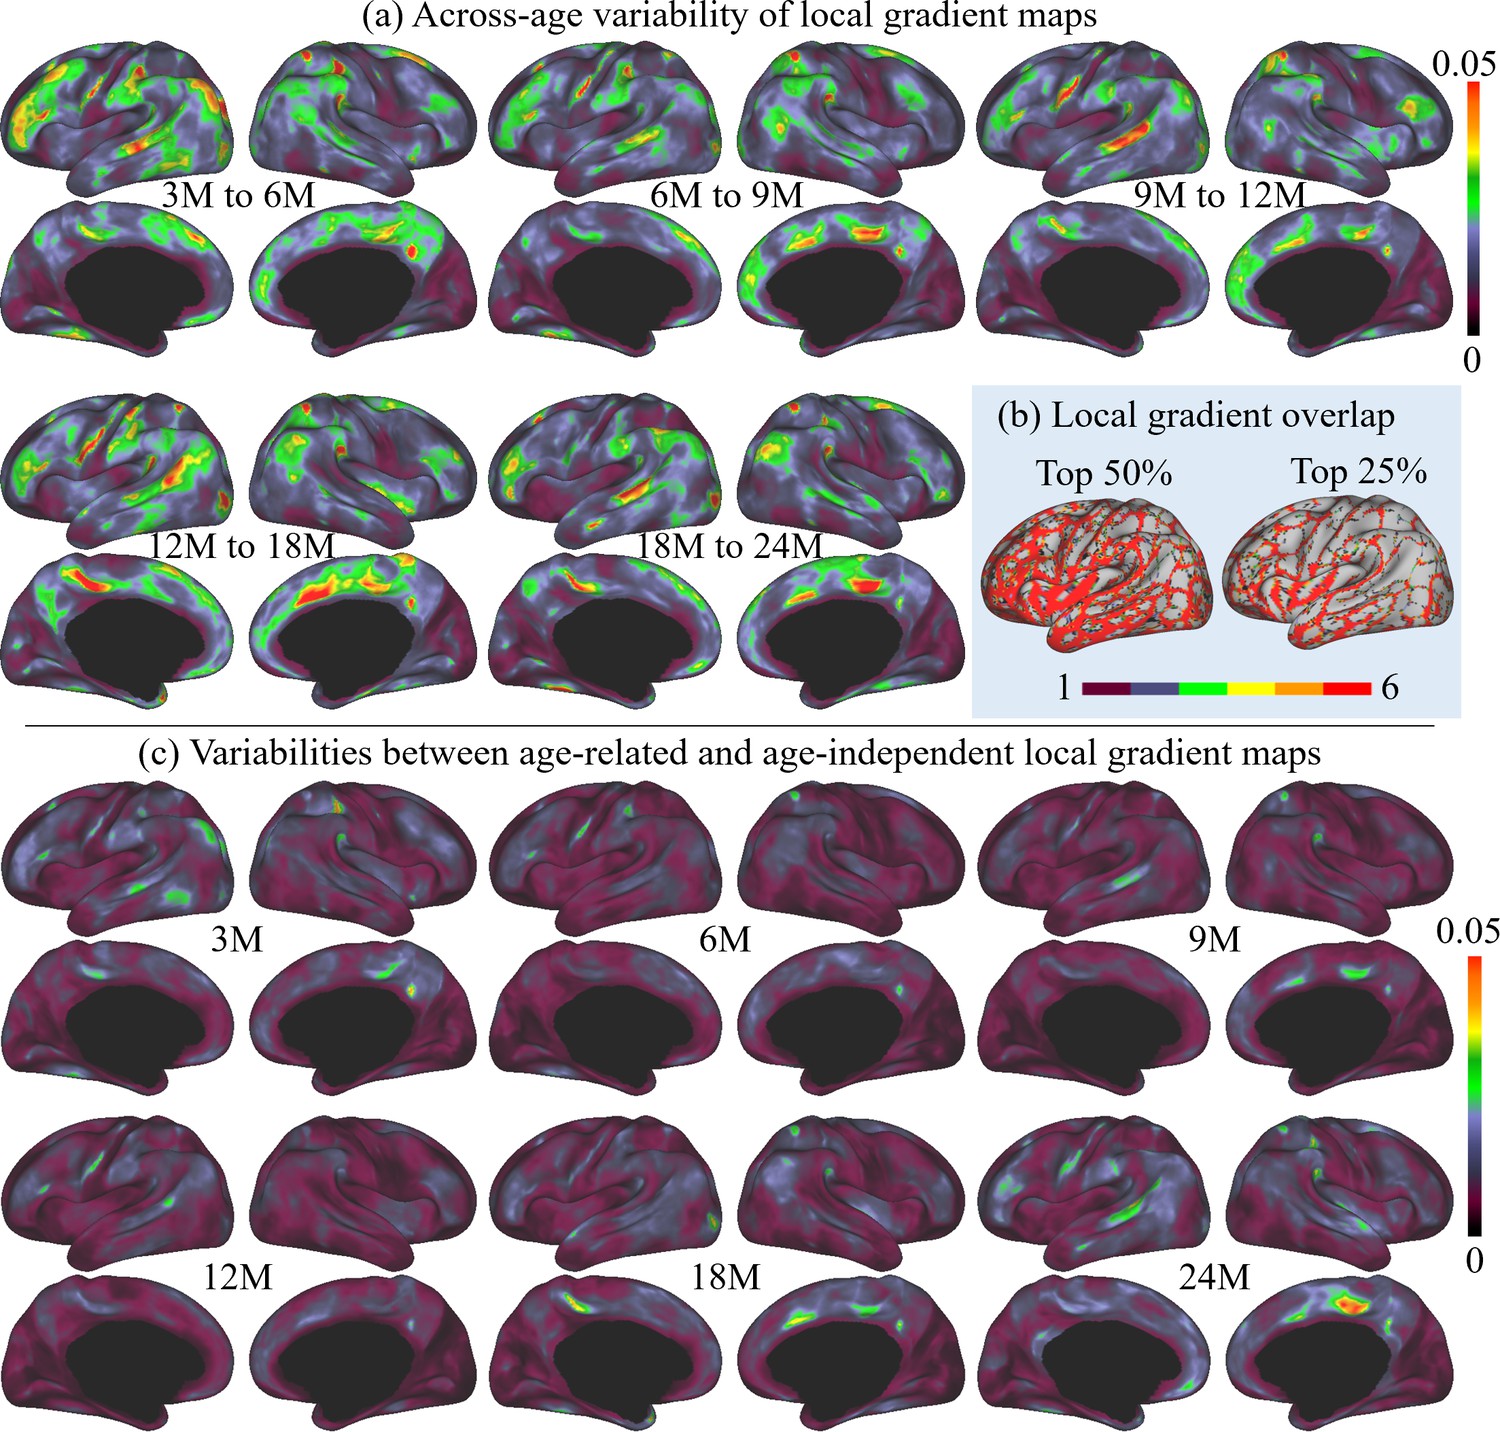
The across-age variabilities of local gradient maps and the variabilities between age-related and age-independent local gradient maps, where M stands for months, and 3M, 6M, 9M, 12M, 18M, and 24M represent different age groups in months defined in Table 1.
(a) Across-age variabilities of local gradient maps between every two consecutive ages, where ‘3M to 6M’ measures the variability of the local gradient maps between 3 and 6 months age groups and so on. The across-age variability shows a multipeak fluctuation. (b) Consistency of high local gradient across ages, where ‘one’ stands for high local gradient appeared in only one age group, and ‘six’ represents high local gradient appeared in all six age groups. Brighter colors stand for higher consistency of local gradient, suggesting high consistency of age-related local gradient maps. (c) Variabilities between each age-related local gradient map and the age-independent local gradient map.
Figure 4
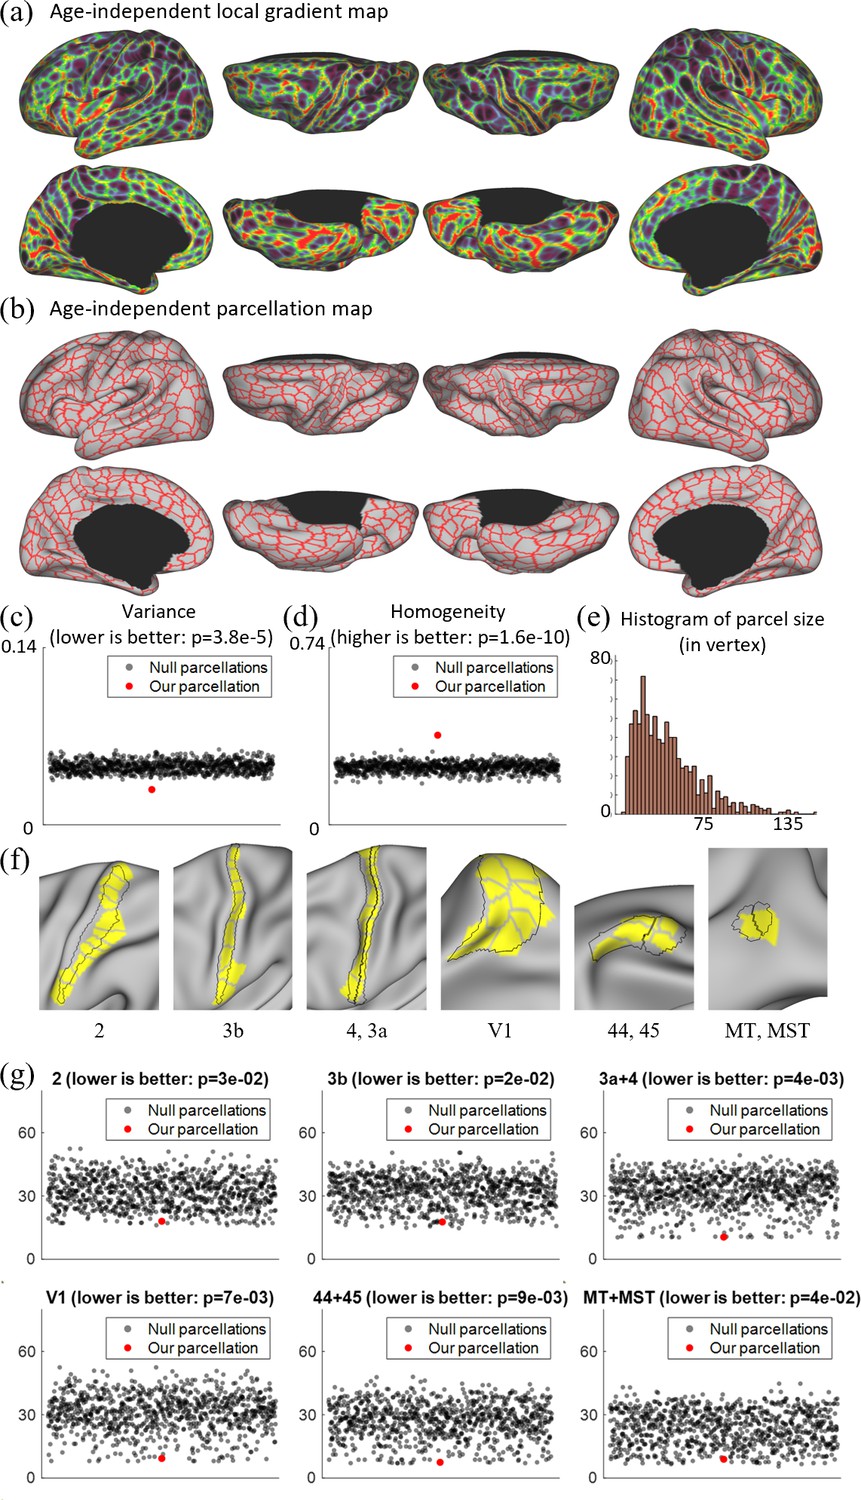
Local gradient map-derived parcels correspond to known cortical areas with low Hausdolff distances, and show lower variability and higher homogeneity than null models.
(a) The age-independent local gradient map obtained by averaging all age-related local gradient maps. (b) The age-independent parcellation map obtained by applying the watershed algorithm on the age-independent local gradient map and manually removing 39 over-segmented regions, resulting in 860 cortical parcels, with 430 parcels in each hemisphere. (c) Our age-independent parcellation shows significantly lower variance compared to the null parcellations. (d) Our age-independent parcellation shows significantly higher homogeneity compared to null parcellations. (e) The histogram of parcel size, where parcel sizes are counted in vertices. (f) Some parcels correspond to known cortical areas defined by multimodal features in adults (Glasser et al., 2016). (g) The quantitative comparison between our parcellation and 1000 null parcellations with the Human Connectome Project (HCP) parcellation, including Brodmann’s area 2, 3b, 4 + 3a, 44 + 45, V1, and MT + MST, using Hausdorff distance on the spherical space (in mm). For each circle in (c), (d), and (g), the y coordinate represents its corresponding variance, homogeneity, or Hausdorff distance, and the x coordinate is set to an integer between 1 and 50 in sequence for the purpose of visualization.
Figure 5
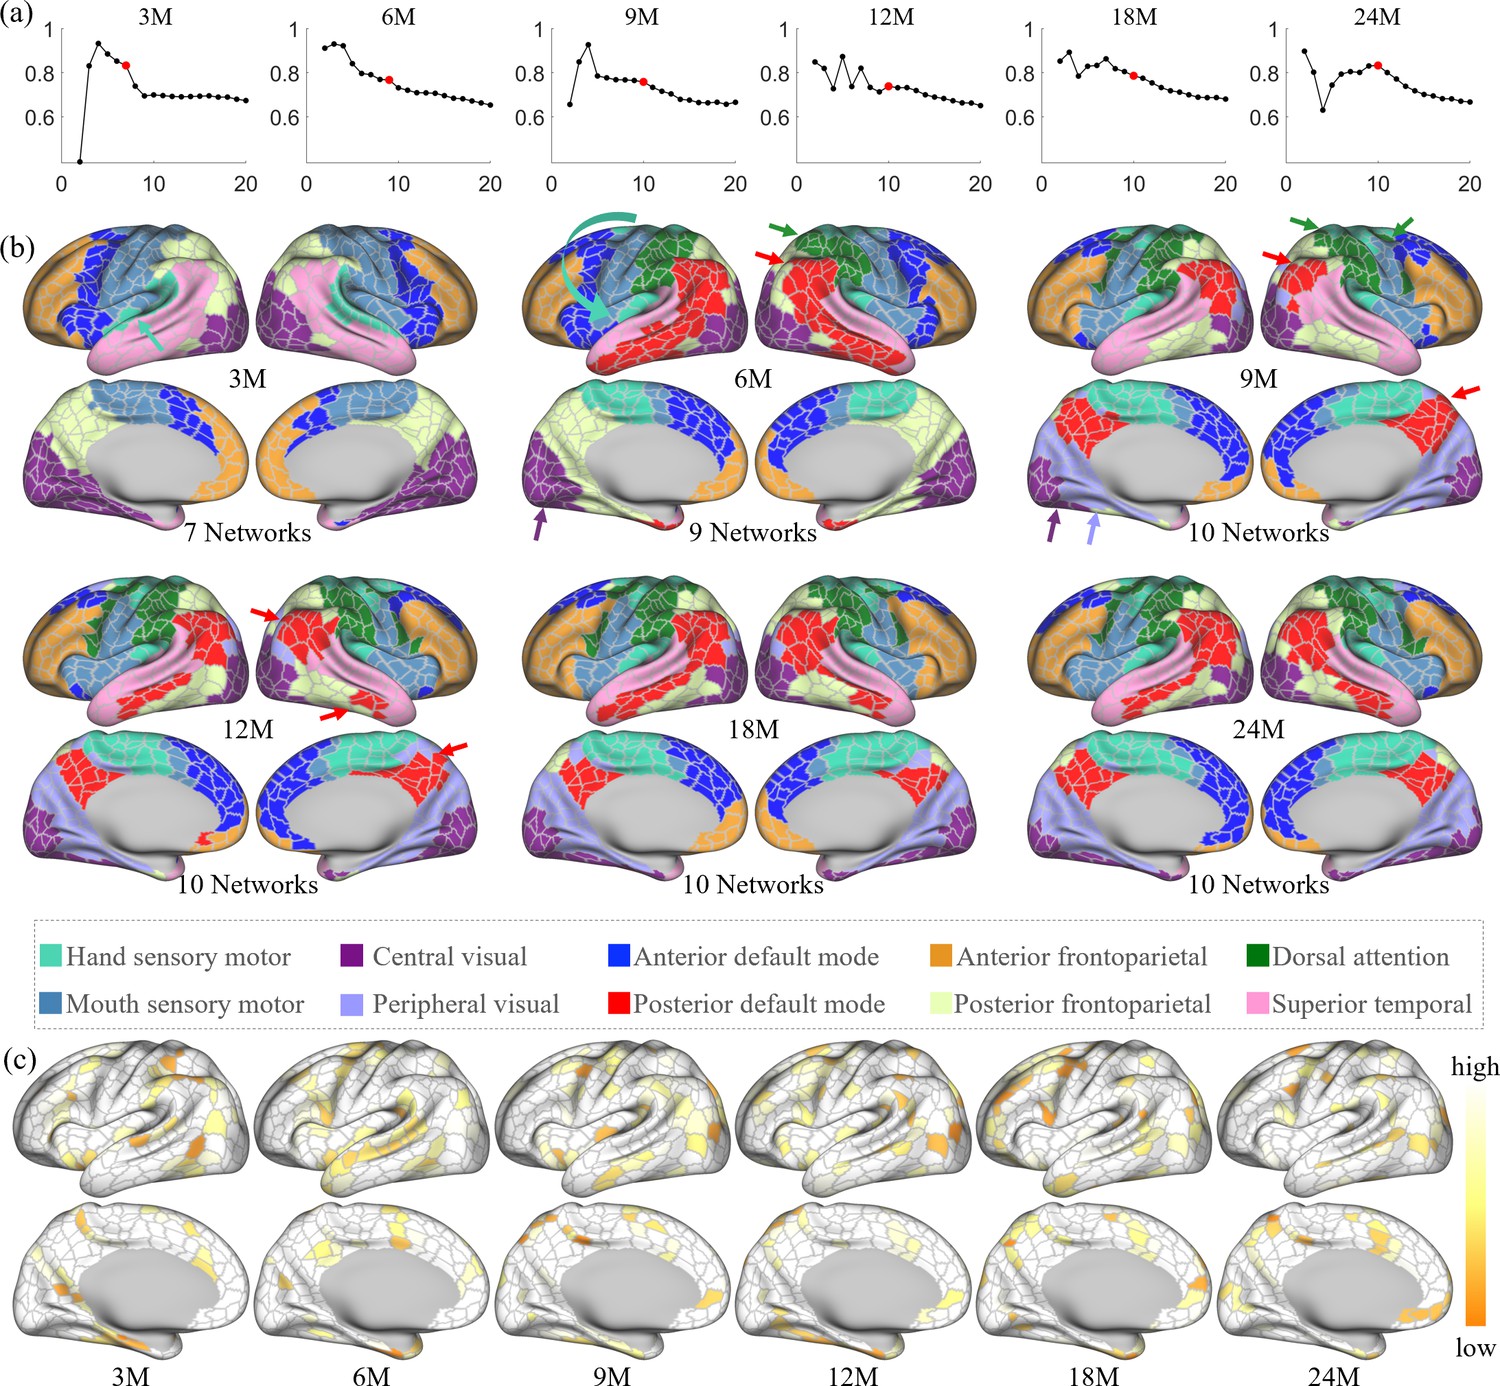
The spatiotemporal network developmental trend of infant brain functional networks.
Herein, M stands for months, and 3M, 6M, 9M, 12M, 18M, and 24M represent different age groups in months defined in Table 1. (a) Stabilities of different network numbers of different age groups computed by repeating 200 times random split-half test. The selected numbers are highlighted in solid red dots. (b) Discovered functional network organization of parcels during infantile brain development, color coded by corresponding networks denoted below. The corresponding network numbers are annotated below each age group accordingly. Arrows point out the noteworthy changes in networks during development, colored according to the related networks. (c) The reproducibility of each parcel belonging to the same clustering during random clustering, where high reproducible parcels are whiter, and low reproducible parcels are more yellowish.
Figure 6
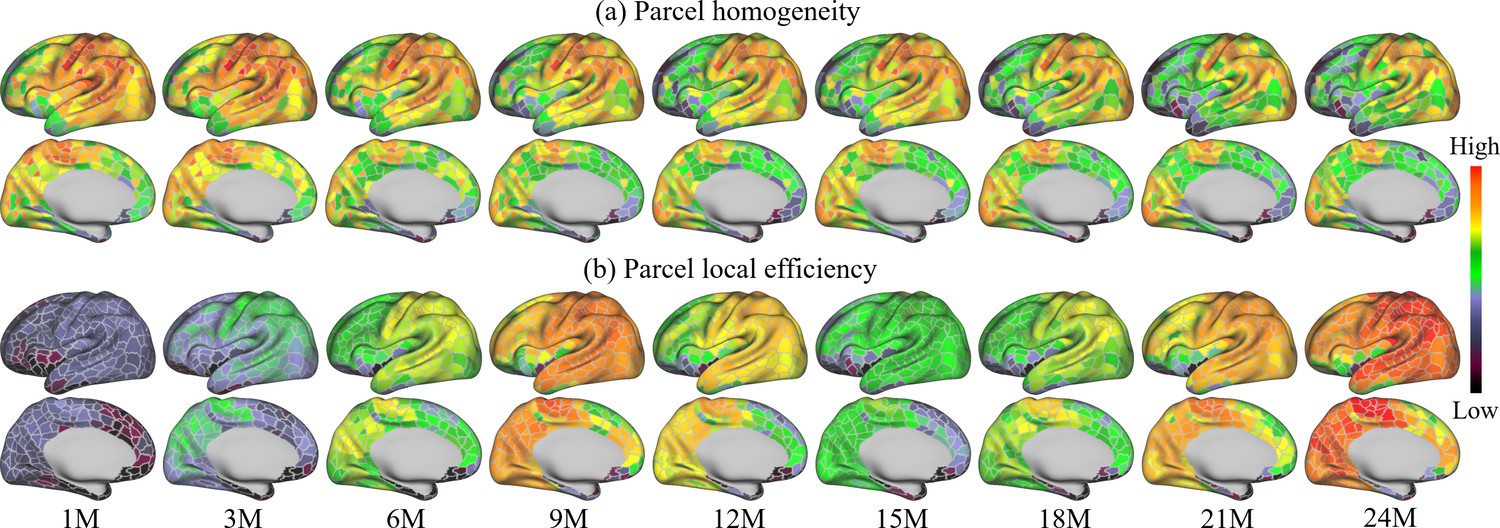
Parcel-wise development maps of infant brain functional architecture.
(a) shows the parcel-wise homogeneity monotonically decreases with age, and (b) indicates that the efficiency of each parcel shows multipeak fluctuation.
Figure 7
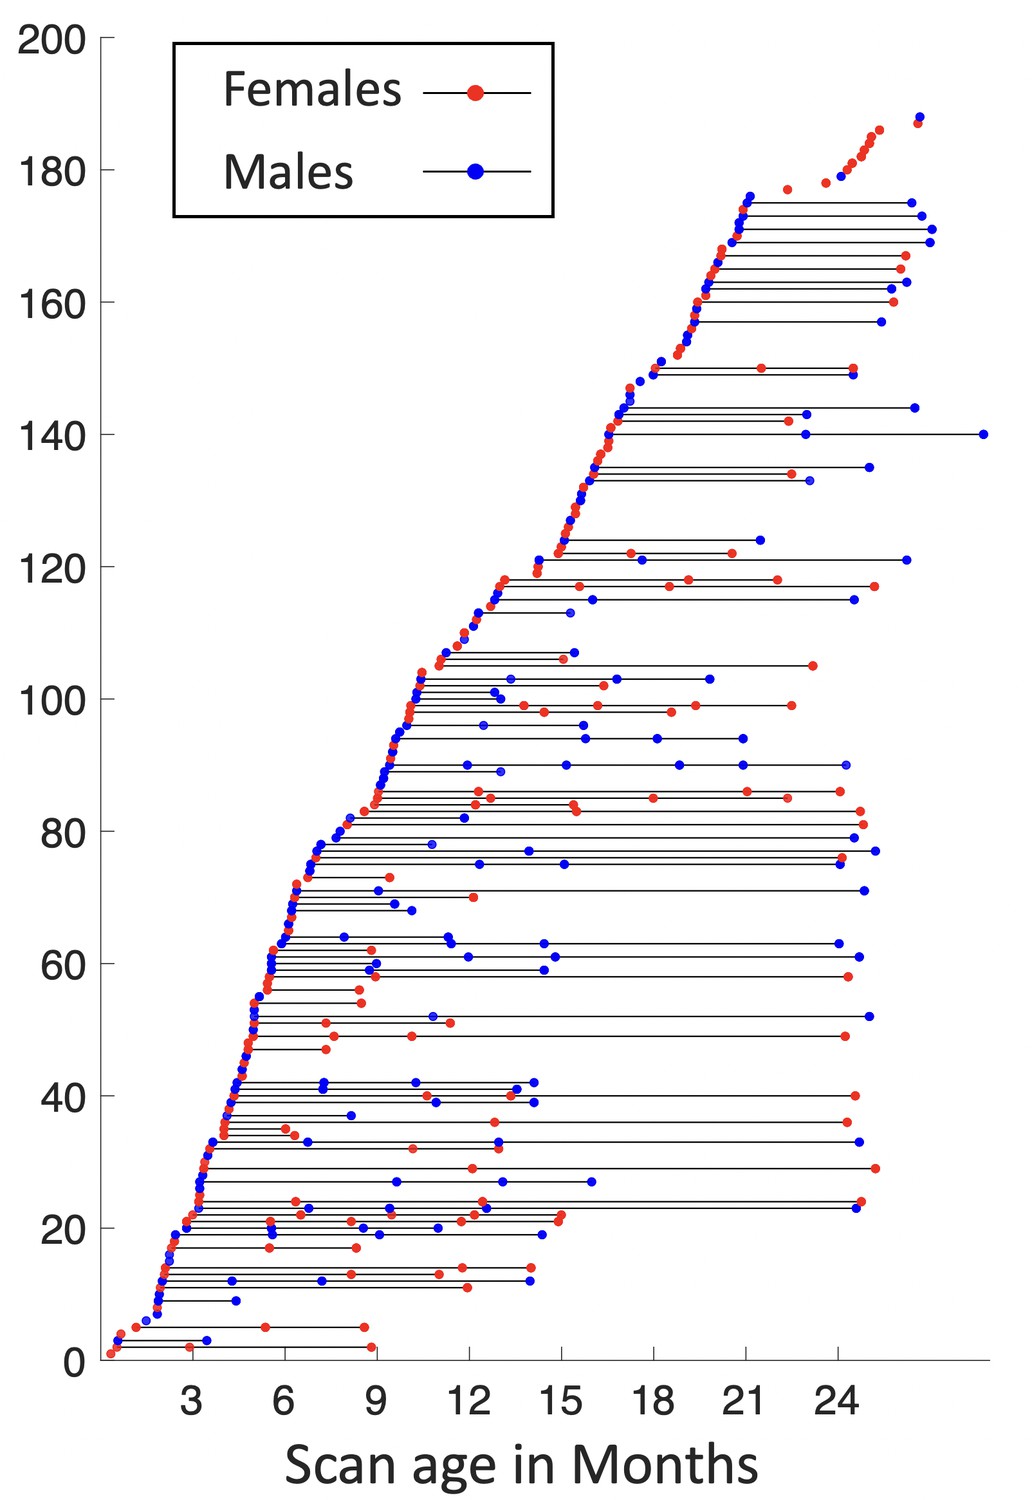
Longitudinal distribution of scans.
Each point represents a scan with its scanned age (in months) shown on the x-axis, with males in blue and females in red, and each horizontal line represents one subject, with males in blue and females in red.
Figure 8
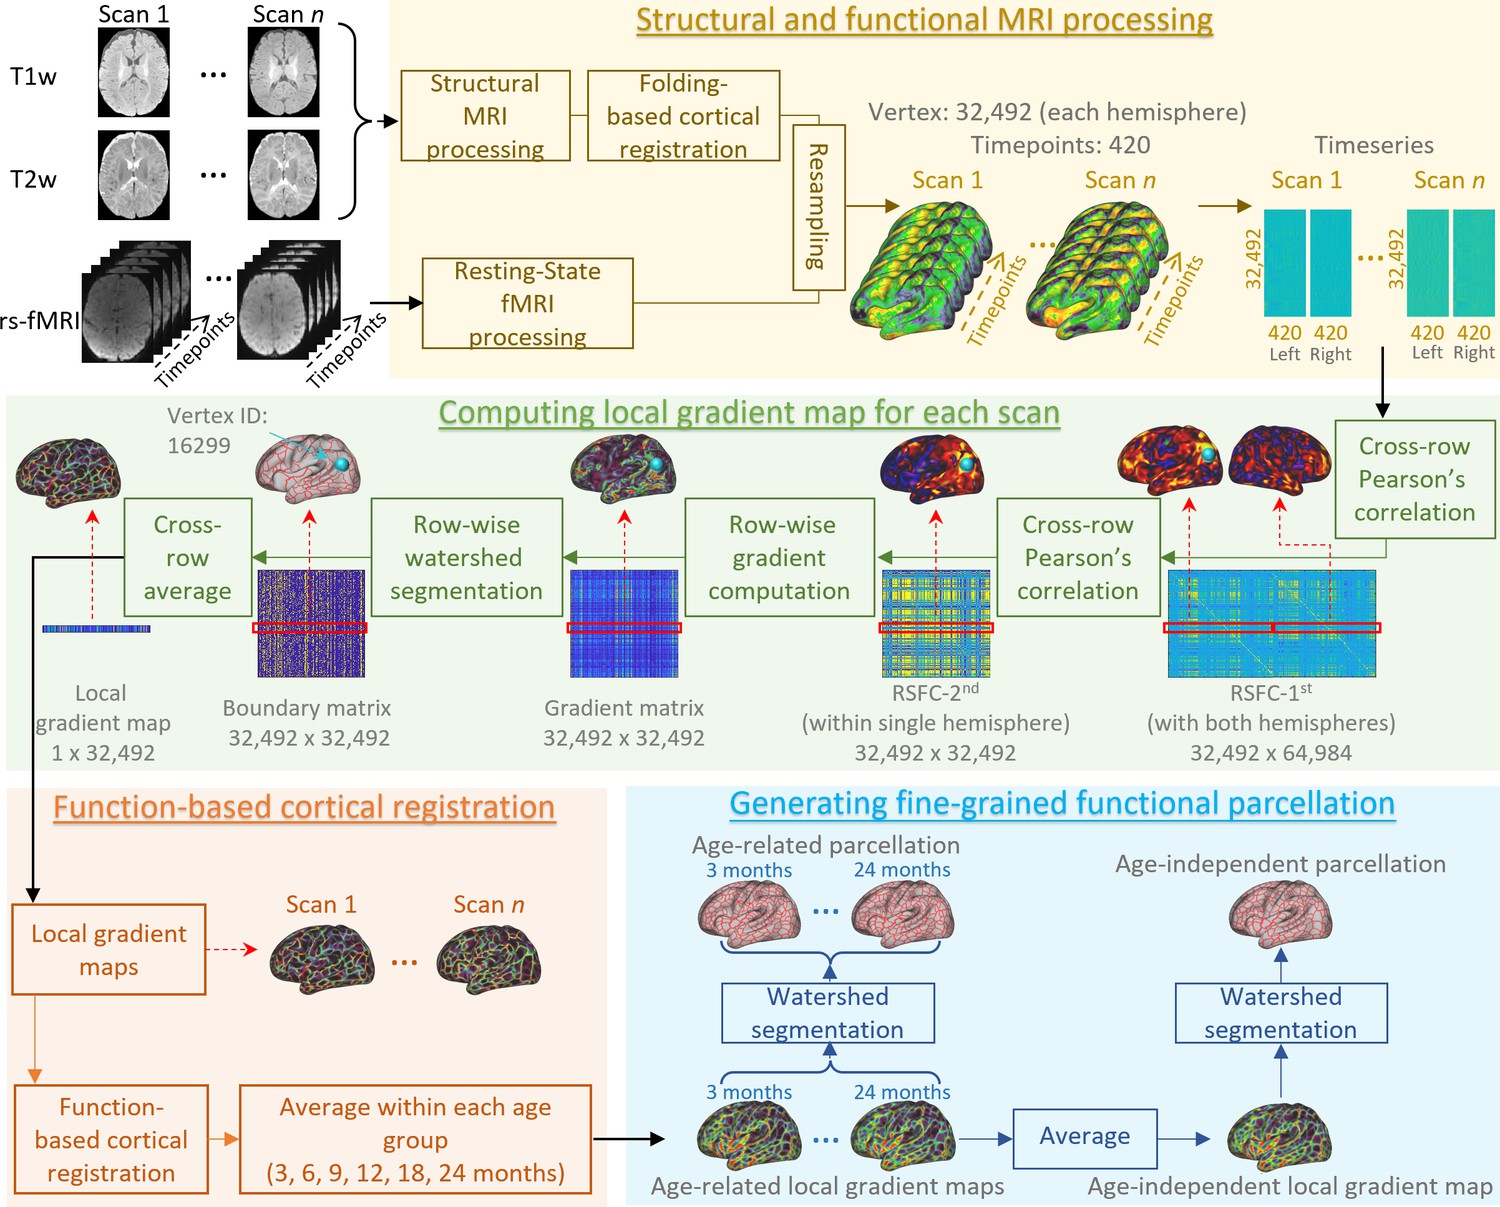
An illustration of the procedure of infant cortical parcellation using local gradient map of functional connectivity.
Detailed steps are described in the following corresponding parts as: structural and functional MRI processing (sections ‘Structural MRI processing’, ‘Resting-state fMRI processing’, and ‘Cortical surface reconstruction and mapping’), computing local gradient map of functional connectivity for each scan (section ‘Computation of individual local gradient map’), function-based cortical registration (section ‘Cortical surface registration based on local gradient map’), and generating fine-grained functional parcellation (section ‘Generation of parcellation maps based on local gradient map’).
Author response image 1

The comparison of clustering stability of different methods.
The red line refers to the clustering stability when binarizing the correlation matrices first and then averaging the matrices across individuals, while the blue line refers to the clustering stability when averaging the correlation matrices across individuals first and then binarizing the average matrix.
Author response image 2

Top panel: the network clustering results using all data in the original manuscript.
Bottom panel: the network clustering results using majority voting through 100 times of bootstrapping. Black circles and red arrows point to the parahippocampal gyrus, which was included in the posterior frontoparietal network, and is not well repeated in the bootstrapped results. (M: months).
Author response image 3

Parcellation boundaries from different sites.
The black color indicates the parcel boundaries agreed by both sites, and the red and yellow colors show the boundaries from UNC and UMN, respectively. The parcellation boundaries from the two sites are observed very close to each other, which suggests that acquisition sites do not place strong influences on the parcellation map.
Tables
Table 1
Demographic information of each age group from the longitudinal dataset under study.
| Age group | Age range (days) | fMRI scans | APscans | PAscans | Structural MRI scans (males/females) | Mean ± stdgestational age (days) | |
|---|---|---|---|---|---|---|---|
| 3M | 10–144 (98.2 ± 35.1) | 104 | 52 | 52 | 50 (25/25) | 280.2 ± 7.1 | |
| 6M | 145–223 (184.2 ± 22.8) | 154 | 77 | 77 | 48 (24/24) | 279.7 ± 9.6 | |
| 9M | 224–318 (279.1 ± 24) | 132 | 66 | 66 | 52 (26/26) | 280.3 ± 6.8 | |
| 12M | 319–410 (367.7 ± 21) | 132 | 66 | 66 | 48 (24/24) | 279.8 ± 7.8 | |
| 18M | 411–591 (494.5 ± 53.2) | 222 | 111 | 111 | 80 (40/40) | 277.6 ± 7.3 | |
| 24M | 592–874 (722.9 ± 66.3) | 242 | 121 | 121 | 82 (41/41) | 277.3 ± 6.2 | |
| Total | 10–874 (414.9 ± 220.1) | 986 | 493 | 493 | 360 (180/180) | 278.0 ± 7.8 | |
Author response table 1
Reproducibility of gradient density maps by rebalancing the sex in each age group (M: months).
| Threshold | 3 M | 6 M | 9 M | 12 M | 18 M | 24 M |
|---|---|---|---|---|---|---|
| Top 25% | 95.25% | 97.00% | 96.73% | 91.95% | 94.96% | 95.15% |
| Top 50% | 96.70% | 97.80% | 97.37% | 95.30% | 97.32% | 97.33% |
Additional files
Download links
A two-part list of links to download the article, or parts of the article, in various formats.
Downloads (link to download the article as PDF)
Open citations (links to open the citations from this article in various online reference manager services)
Cite this article (links to download the citations from this article in formats compatible with various reference manager tools)
Fine-grained functional parcellation maps of the infant cerebral cortex
eLife 12:e75401.
https://doi.org/10.7554/eLife.75401


