Towards a molecular mechanism underlying mitochondrial protein import through the TOM and TIM23 complexes
- School of Biochemistry, University of Bristol, United Kingdom
Figures
Figure 1 with 2 supplements
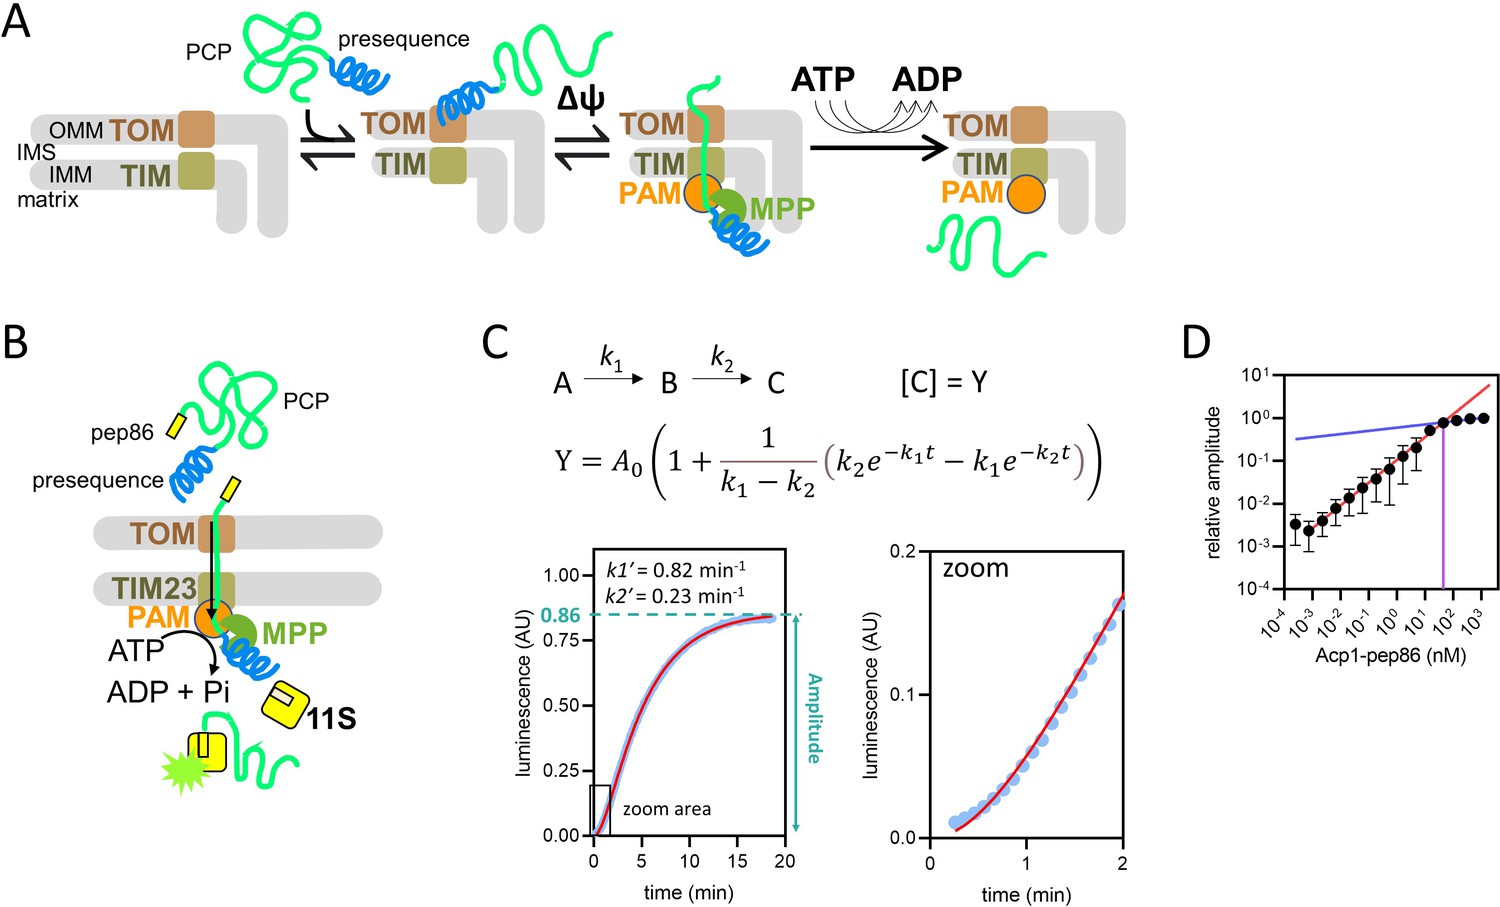
Model of pre-sequence-containing precursor (PCP) import into mitochondria and outline of the NanoLuc import assay.
(A) Simple model of PCP import into mitochondria, showing binding of PCP to the translocase of the outer membrane (TOM complex), ∆ψ-dependent movement of the pre-sequence into the matrix, and ATP-dependent translocation of the remainder of the protein. (B) Diagramatic representation of the NanoLuc real-time import assay, which is essentially the model in (A) plus the binding of the C-terminal pep86 to internalised 11S, which forms NanoLuc in the matrix. (C) An example of luminescence data from the NanoLuc import assay of 1 µM DDL (one of the length variant PCPs, see Results) in energised mitochondria, showing the fit to a model for two consecutive, irreversible steps (see Methods). The final step gives rise to signal such that [C] (concentration of C) is proportional to luminescence. The order of the two steps is assigned arbitrarily. (D) The effect of varying PCP concentration (Acp1-pep86) on amplitude of signal from import reactions. A straight line was fitted to the data where amplitude increased linearly with PCP concentration (red) and to the data where amplitude increased only marginally (blue). The intersect of these lines and corresponding PCP concentration (~45 nM), the point of plateau, is also shown (purple). Data are the mean ± SD of three independent biological experiments.
-
Figure 1—source data 1
Numerical data corresponding to the example luminescence data and fit in panel C.
- https://cdn.elifesciences.org/articles/75426/elife-75426-fig1-data1-v2.xlsx
-
Figure 1—source data 2
Numerical primary (luminescence) and secondary (amplitudes) data corresponding to the graph in panel D.
- https://cdn.elifesciences.org/articles/75426/elife-75426-fig1-data2-v2.xlsx
Figure 1—figure supplement 1

11S levels and signal amplitude.
(A) Western blot against 11S (bottom) and Tom40 (contro1, top) of eight different mitochondrial preparations extracted from four different batches of yeast. 60 µg each sample of mitochondria was fractionated by SDS-polyacrylamide gel electrophoresis (SDS-PAGE) prior to Western blot. Two known concentrations of purified his-tagged 11S are also included for quantification by densitometry. Matrix concentration of 11S was calculated using the previously published yeast mitochondrial matrix volume of 1.62±0.3 µl/mg (Koshkin and Greenberg, 2002; see Methods and source data). (B) Import traces of Acp1-pep86 with each of the mitochondrial preps in panel (A), performed in parallel and unnormalised. (C) Signal amplitude from panel (B) as a function of 11S concentration (normalised to Tom40) from panel (A), with points coloured as in panel (B). The results show no correlation between 11S concentration and amplitude. (D) Mitochondria from mt-11S-expressing yeast were solubilised with digitonin at concentrations from 0 to 5 mg/ml, then centrifuged to separate proteins released into the supernatant from mitochondrial pellets (according to the method for mitoplast preparation). Pellets and supernatants were analysed by SDS-PAGE and Western blotting with antibodies against the matrix marker glutathione reductase (GR) and the inter-membrane space (IMS) marker TIM10. Results of band densitometry are shown on the left axis. In the same samples of digitonin-treated mitochondria, the amount of 11S that was external to the matrix was quantified by measuring luminescence following addition of purified GST-pep86 fusion protein under NanoLuc assay conditions. The amplitude of the luminescence traces is shown on the right axis.
-
Figure 1—figure supplement 1—source data 1
Unprocessed image of the Western blot in panel A.
- https://cdn.elifesciences.org/articles/75426/elife-75426-fig1-figsupp1-data1-v2.zip
-
Figure 1—figure supplement 1—source data 2
Numerical data corresponding to the luminescence traces in panel B.
- https://cdn.elifesciences.org/articles/75426/elife-75426-fig1-figsupp1-data2-v2.xlsx
-
Figure 1—figure supplement 1—source data 3
Densitometry values for the bands in the Western blot in panel A, calculations of matrix 11S concentration, and numerical data corresponding to the graph in panel C.
- https://cdn.elifesciences.org/articles/75426/elife-75426-fig1-figsupp1-data3-v2.xlsx
-
Figure 1—figure supplement 1—source data 4
Data corresponding to panel D.
Image of the Western blot and values from band densitometry used to calculate the proportion of matrix and IMS markers in supernatants following digitonin treatment of mitochondria. Also numerical data corresponding to the amplitudes and luminescence traces from which these were obtained.
- https://cdn.elifesciences.org/articles/75426/elife-75426-fig1-figsupp1-data4-v2.zip
Figure 1—figure supplement 2
Constraints of data fitting to the NanoLuc import traces.
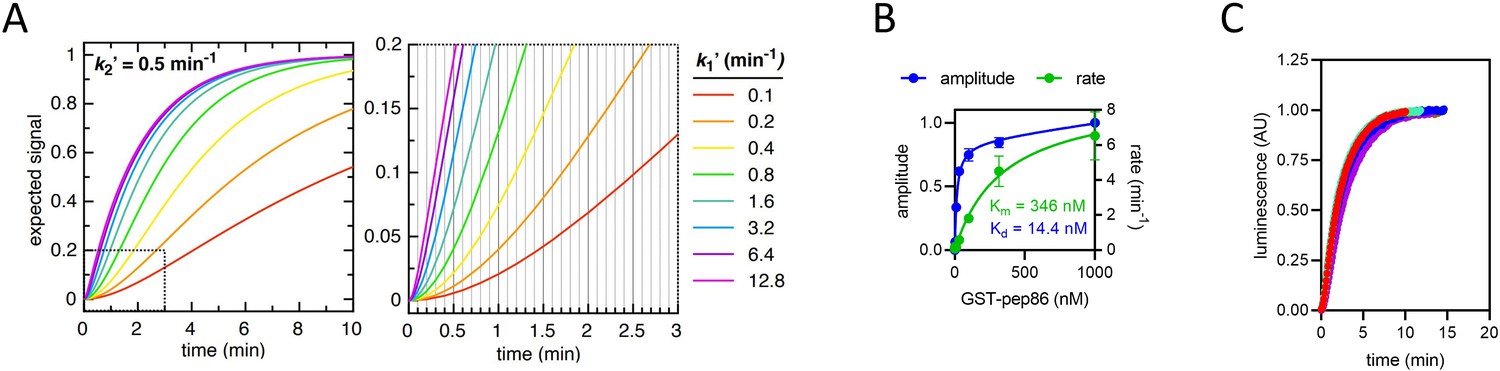
(A) The expected signal for a two-step import process, with k2ʹ fixed at 0.5 min–1 (for illustrative purposes) and k1ʹ varied between 0.1 min–1 (red) and 12.8 min–1 (magenta). As k1ʹ increases, it makes increasingly less difference to the overall shape of the curve. Because the plate reader measures luminescence with a frequency of 10 min–1 (represented as vertical gridlines in the zoomed in panel, right), any rate constants faster than about 5 min–1 will not be resolved. The same effect holds true for any additional rates that form part of the mechanism but are faster than ~5 min–1. (B) Amplitude (blue) and rate (green) determined from a single exponential fits to NanoLuc formation in solution. The pep86 tag is provided in the form of GST-pep86, which is not a pre-sequence-containing precursor, and 11S comes from mitochondria solubilised completely with digitonin (5 mg/ml) to simulate binding within the mitochondrial matrix. Fits are to the Michaelis-Menten equation giving an affinity of 14.4 nM and a vmax of 8.9 min–1. Data are shown as mean ± SD of two independent biological experiments. (C) The import traces in Figure 1—figure supplement 1B all normalised to 1, coloured in the same way. For each trace, data collected at times after the maximum luminescence was recorded were excluded. The fact that all the traces overlay well confirms that binding of 11S is too fast to constitute either of the rates extracted from the two-step fits – as expected given that the binding rate should be close to vmax for NanoLuc formation (as determined in panel B).
-
Figure 1—figure supplement 2—source data 1
Numerical primary (luminescence) and secondary (rate and amplitude values) corresponding to the graph in panel B.
- https://cdn.elifesciences.org/articles/75426/elife-75426-fig1-figsupp2-data1-v2.xlsx
-
Figure 1—figure supplement 2—source data 2
Numerical data corresponding to the (normalised) luminescence traces in panel C.
- https://cdn.elifesciences.org/articles/75426/elife-75426-fig1-figsupp2-data2-v2.xlsx
Figure 2 with 1 supplement

Basic characterisation of pre-sequence-containing precursor (PCP) import and turnover number.
(A) The effect of methotrexate (MTX) on signal amplitude of three proteins (depicted schematically below): PCP-pep86 (grey), for which MTX should have no effect; PCP-dihydrofolate reductase (DHFR)-pep86 (blue), where MTX prevents entry of pep86; and PCP-pep86-DHFR (orange), where MTX limits import to one pep86 per import site. Bars show the average and SEM from three independent biological replicates. Differences between groups were analysed using a one-way ANOVA test, with Geisser-Greenhouse correction applied, followed by the Holm-Sidak multiple comparisons test. **, p value 0.0038; ns, not significant. (B) Signal amplitude as a function of PCP-pep86-DHFR concentration in the absence (solid circles) and presence (open circles) of MTX.
-
Figure 2—source data 1
Numerical primary (luminescence) and secondary (amplitude) data corresponding to the bar chart in panel A.
- https://cdn.elifesciences.org/articles/75426/elife-75426-fig2-data1-v2.xlsx
-
Figure 2—source data 2
Primary and secondary numerical data corresponding to the graph in panel B.
- https://cdn.elifesciences.org/articles/75426/elife-75426-fig2-data2-v2.xlsx
Figure 2—figure supplement 1

Confirmation, by Western blotting,of efficient blocking of pre-sequence-containing precursor (PCP)-pep86-dihydrofolate reductase (DHFR) import by methotrexate (MTX) and estimation of amount imported in the absence of MTX.
The PCP-pep86-DHFR substrate was treated with or without MTX and NADPH before being incubated with energised or de-energised mitochondria. After the import reaction, half of each sample of mitochondria was treated with proteinase K (PK). Mitochondria were reisolated and proteins analysed by SDS-PAGE followed by Western blotting with an antibody against the myc tag. Samples of 1.2 pmol PCP-pep86-DHFR (treated ±MTX) were run alongside the samples of mitochondria (¼ input). An overexposed version of the same Western blot is shown in the middle and densitometric analysis provided on the right. In the image on the right, the area within the blue box numbered 1 was used for background correction, the band within the blue box numbered 2 corresponds to 1.2 pmol PCP-pep86-DHFR, and the band within the blue box numbered 3 corresponds to processed, matrix-localised PCP-pep86-DHFR, calculated as 0.66 pmol (0.0516/0.0938 × 1.2 pmol).
-
Figure 2—figure supplement 1—source data 1
Western blot acquisition files.
- https://cdn.elifesciences.org/articles/75426/elife-75426-fig2-figsupp1-data1-v2.zip
Figure 3 with 1 supplement
Using proteins of varying lengths to elucidate import kinetics.
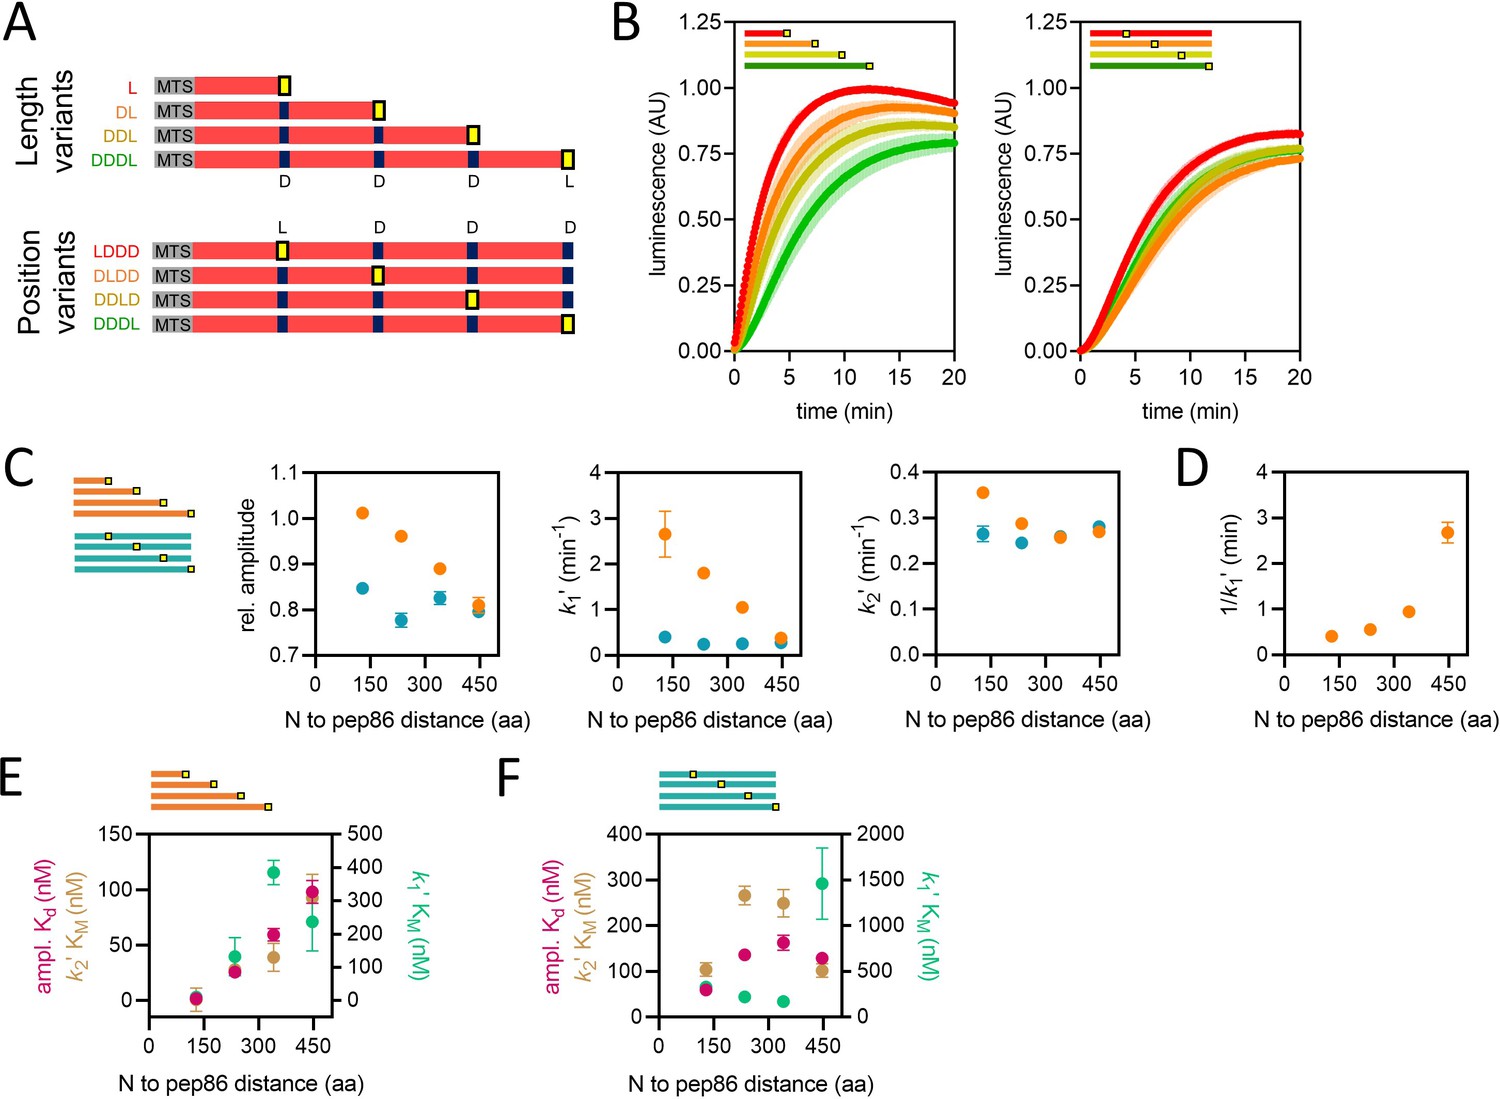
(A) Schematic of two protein series (length variants and position variants), with native mitochondrial targeting sequence (MTS) and mature part of Acp1 in grey and red, respectively, pep86 in yellow (L for live) and scrambled pep86 in dark blue (D for dead, i.e., it does not complement 11S). (B) Examples of import traces for length variants (left panel) and position variants (right panel). Error bars shown partially transparent in the same colours as the main traces. Those smaller than the main trace are not shown. SD from biological triplicate, each conducted in duplicate. (C) Parameters obtained from two-step fits to the data shown in panel B. The length variant series is shown in orange and the position variant series in teal. Error bars show SEM from three independent biological experiments, each conducted in duplicate. Error bars smaller than symbols are not shown. (D) Reciprocal of k1′ as a function of PCP length (same data as in panel C) – the time constant for that step – for the length variants. (E) The concentration dependence of length variants. Secondary data from import assays with varying concentrations of length series proteins (four to six independent biological replicates) were fitted to the Michaelis-Menten equation, from which apparent Kds and KMs are derived. Error represents the SEM of this fitting. (F) As in panel E but with the position variant proteins.
-
Figure 3—source data 1
Numerical data corresponding to the luminescence traces in panel B.
- https://cdn.elifesciences.org/articles/75426/elife-75426-fig3-data1-v2.xlsx
-
Figure 3—source data 2
Numerical data corresponding to the graphs in panel C (secondary data from Figure 3—source data 1).
- https://cdn.elifesciences.org/articles/75426/elife-75426-fig3-data2-v2.xlsx
-
Figure 3—source data 3
Numerical data corresponding to the graph in panel D.
- https://cdn.elifesciences.org/articles/75426/elife-75426-fig3-data3-v2.xlsx
-
Figure 3—source data 4
Numerical data corresponding to the graphs in panels E and F.
- https://cdn.elifesciences.org/articles/75426/elife-75426-fig3-data4-v2.xlsx
Figure 3—figure supplement 1
The concentration dependence of length and position variants.
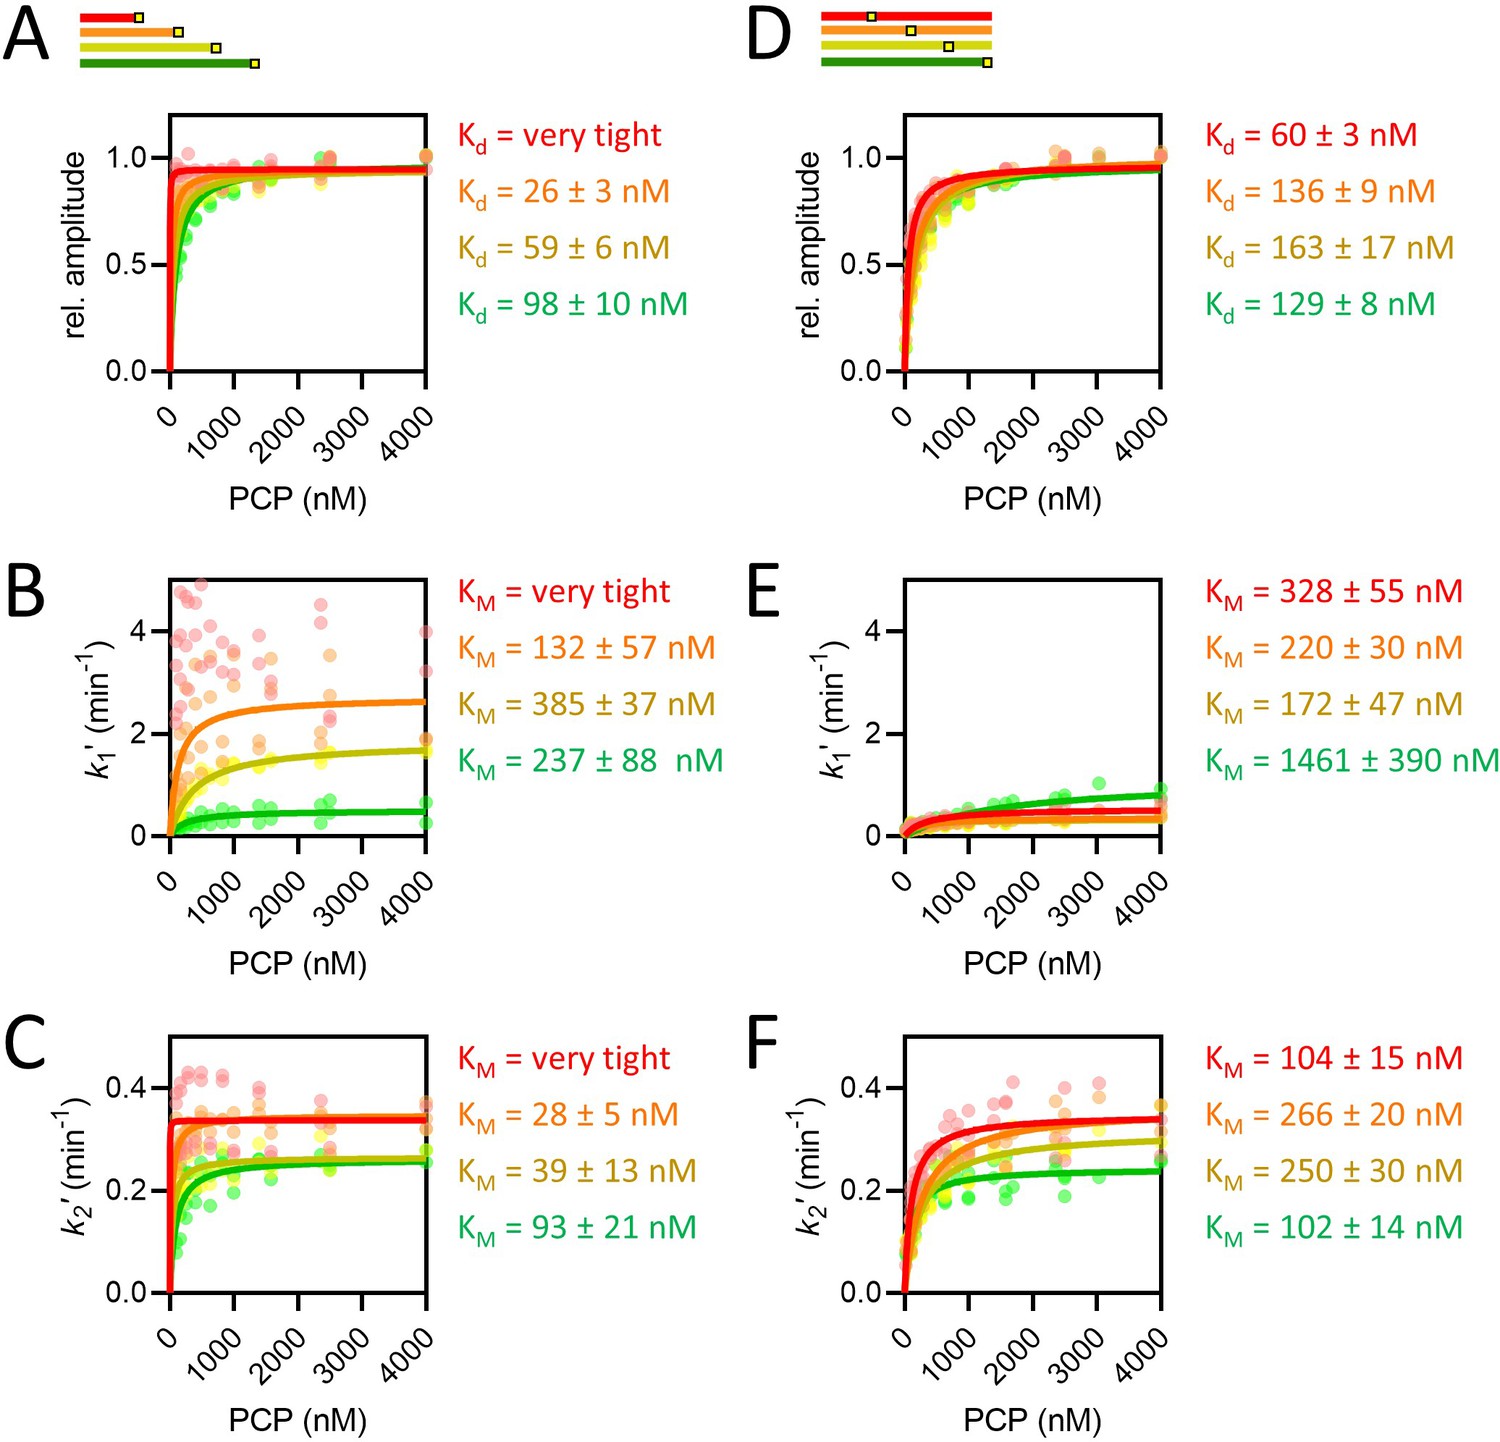
(A–F) Amplitudes (A, D), k1′, assigned as the faster rate (B, E) and k2′ (C, F) for the length (A–C) and position (D–F) series, coloured red, orange, yellow, and green in order of increasing length or pep86 position. All individual fits from four to six independent biological replicates of each set are shown, and the secondary data are fitted to the Michaelis-Menten equation, with errors estimated from the fitting.
-
Figure 3—figure supplement 1—source data 1
Numerical primary (luminescence) data corresponding to the graphs in panels A–C.
- https://cdn.elifesciences.org/articles/75426/elife-75426-fig3-figsupp1-data1-v2.xlsx
-
Figure 3—figure supplement 1—source data 2
Numerical primary (luminescence) data corresponding to the graphs in panels D–F.
- https://cdn.elifesciences.org/articles/75426/elife-75426-fig3-figsupp1-data2-v2.xlsx
-
Figure 3—figure supplement 1—source data 3
Numerical secondary data corresponding to the graphs in panels A–F.
- https://cdn.elifesciences.org/articles/75426/elife-75426-fig3-figsupp1-data3-v2.xlsx
Figure 4 with 1 supplement
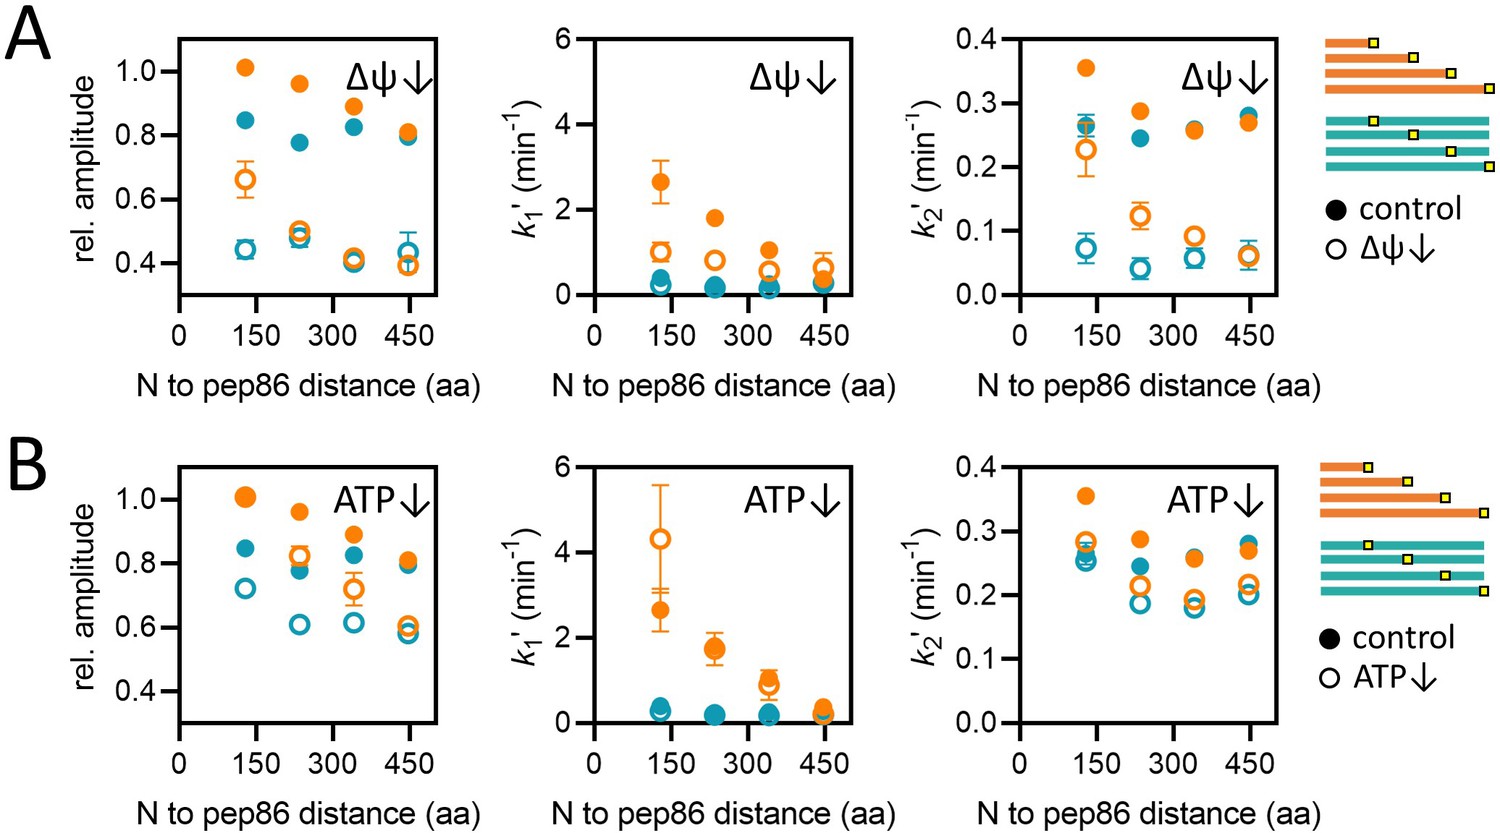
Effects of energy depletion on import of the length and position variants.
(A) Import in the presence (solid circles) or absence (open circles) of ∆ψ, for the length (orange) and position (teal) series. Depletion of ∆ψ was achieved by a 5-min pre-treatment of mitochondria with 10 nM valinomycin. Plots show amplitude (left), k1′ (middle), and k2′ (right) extracted from two-step fits to import traces as a function of PCP length or pep86 position. Each point is the average and SEM of three independent biological replicates. (B) As in panel A, but without (solid circles) or with (open circles) ATP depletion instead of valinomycin. Matrix ATP was depleted by excluding ATP and its regenerating system from the assay mix (see Results section for full description).
-
Figure 4—source data 1
Numerical primary (luminescence) and secondary (amplitudes) data corresponding to the graphs in panel A.
- https://cdn.elifesciences.org/articles/75426/elife-75426-fig4-data1-v2.xlsx
-
Figure 4—source data 2
Numerical primary (luminescence) and secondary (amplitudes) data corresponding to the graphs in panel B.
- https://cdn.elifesciences.org/articles/75426/elife-75426-fig4-data2-v2.xlsx
Figure 4—figure supplement 1

The effect of valinomycin (val) on ∆ψ and protein import, and confirmation of ATP depletion in the mitochondrial matrix.
(A) Tetramethylrhodamine methyl ester (TMRM) fluorescence over time in isolated yeast mitochondria with val added at the time indicated by arrowhead, at final concentrations of 0.5–10 nM in the left graph and up to 100 nM in the graph on the right (demonstrating saturation of the effect). In the left graph, data are the mean ± SD from three biological repeats. The data in the right graph are representative of three biological repeats. Note that the relationship between TMRM fluorescence and ∆ψ is not linear, so there will be some residual membrane potential even when the effect saturates (at ~10 nM val). (B) Amplitude of luminescence traces from the import of Acp1 and Mrp21 (left panel) and position variant proteins (right panel), into mitochondria pre-treated for 5 min with val at a range of concentrations. The data in the left panel are representative of three biological repeats. The data in the right panel are the mean ± SEM of three biological repeats. (C) Import traces for 1 µM Acp1-pep86 (left) and Mrp21-pep86 (right) in the presence (grey and orange symbols) or absence (turquoise and blue symbols) of ATP and its regenerating system, and the absence (grey and turquoise) or presence (orange and blue) of antimycin A (AA).
-
Figure 4—figure supplement 1—source data 1
Numerical data corresponding to the graphs in panel A.
- https://cdn.elifesciences.org/articles/75426/elife-75426-fig4-figsupp1-data1-v2.xlsx
-
Figure 4—figure supplement 1—source data 2
Primary (luminescence) and secondary (amplitude) data corresponding to the graphs in panel B.
- https://cdn.elifesciences.org/articles/75426/elife-75426-fig4-figsupp1-data2-v2.xlsx
-
Figure 4—figure supplement 1—source data 3
Numerical luminescence data corresponding to the traces shown in panel C.
- https://cdn.elifesciences.org/articles/75426/elife-75426-fig4-figsupp1-data3-v2.xlsx
Figure 5 with 1 supplement
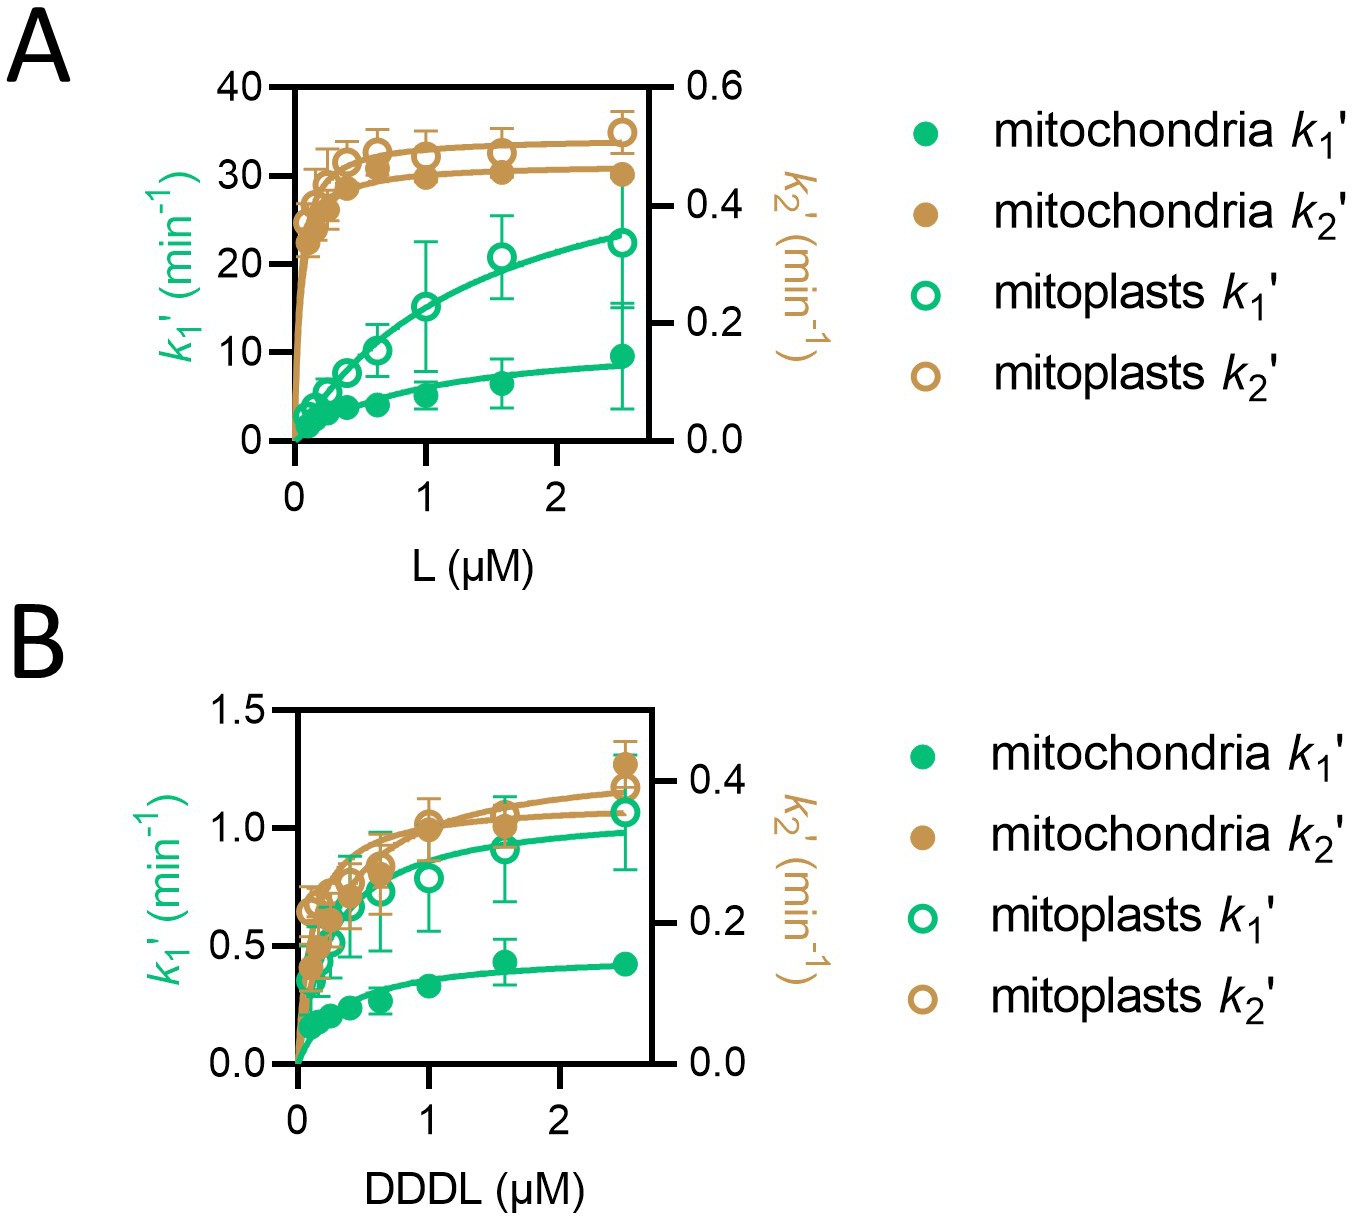
k1ʹ but not k2ʹ is affected by removal of the outer mitochondrial membrane.
(A) Values of k1ʹ (teal symbols) and k2ʹ (brown symbols) from fitting of the two-step model to luminescence data from import of L (PCP-pep86) at concentrations ranging from 0.1 to 2.5 µM into mitochondria (solid circles) and mitoplasts (open circles). Data are shown as the mean of three biological repeats with error bars showing SEM. Data were fit to the Michaelis-Menten equation, and resulting fits are shown in respective colours. (B) As in panel A but with DDDL instead of L.
Figure 5—figure supplement 1
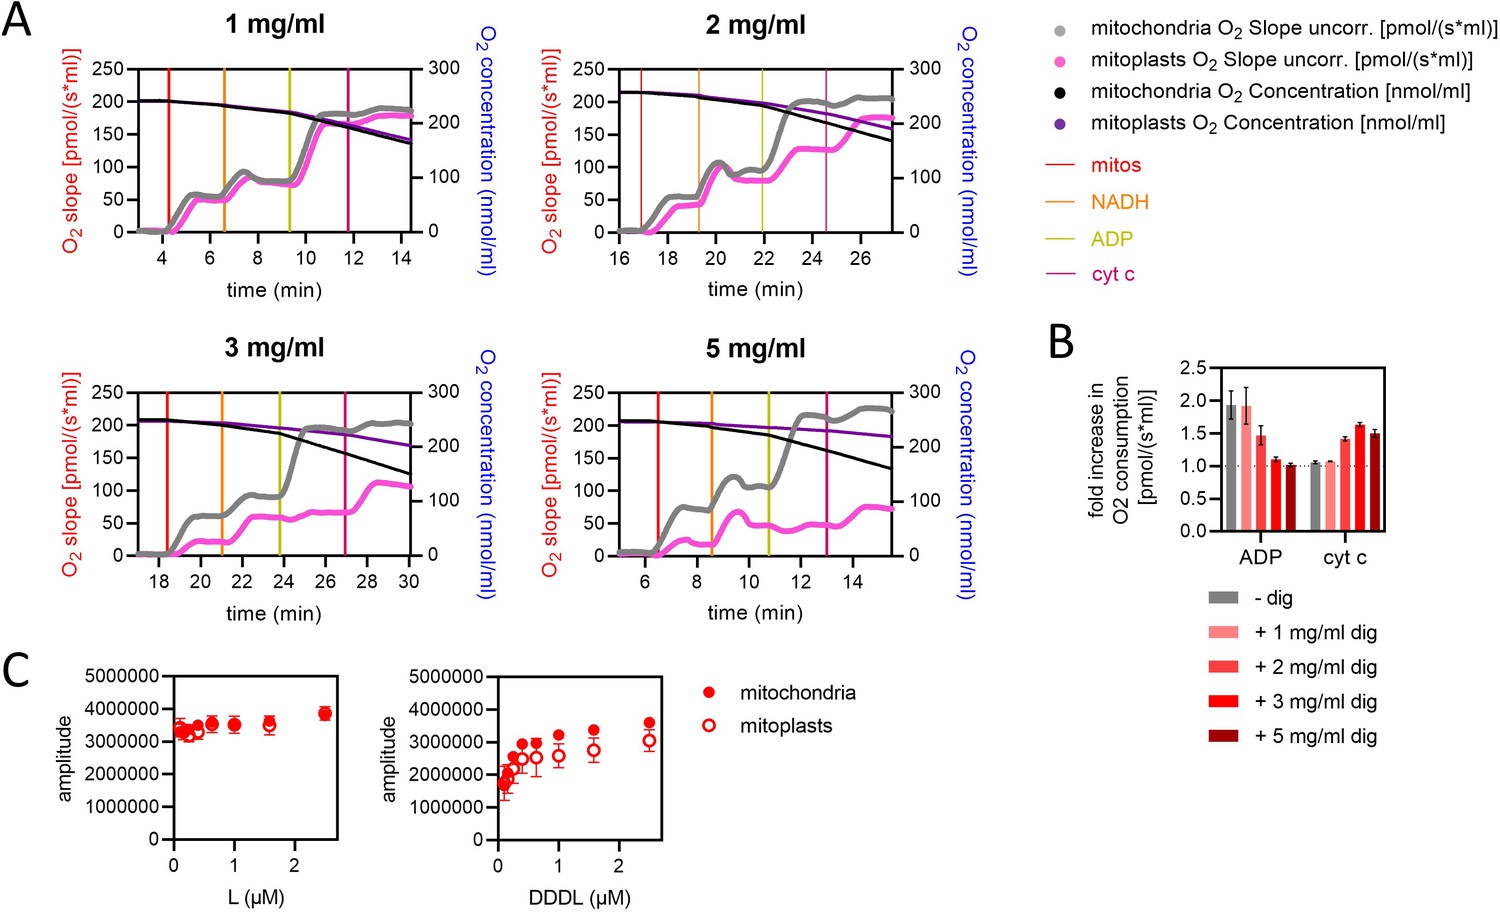
Validation of outer mitochondrial membrane removal in mitoplast preparations, and a comparison of pre-sequence-containing precursor import kinetics in mitochondria and mitoplasts.
(A) Assessment of respiration in mitochondria and mitoplasts. At times indicated by vertical lines, mitochondria or mitoplasts (mitos), respiratory substrate (NADH), and modulators of respiration were added to Oxygraph-2k chambers. cyt c, cytochrome c. The concentration of digitonin used to prepare mitoplasts is given at the top of each graph. Data are single, representative examples from three independent biological repeats. (B) Increase in O2 consumption relative to the level prior to addition of either ADP (left bars) or, subsequently, cyt c (right bars). From the data shown in panel A and two additional independent biological repeats, values for O2 slope after additions of (1) NADH, (2) ADP, and (3) cyt c were calculated by averaging data points once respiration stabilised. The mitochondrial data are the mean ± SD of three biological repeats each conducted three to four times. The digitonin data are the mean ± SD of three biological repeats. (C) Amplitude of luminescence traces from import of L and DDDL (the shortest and longest length variant proteins; left and right panels, respectively) at concentrations ranging from 0.1 to 2.5 µM into mitochondria (solid circles) and mitoplasts (open circles). Data are shown as the mean of three biological repeats with error bars showing SEM.
-
Figure 5—figure supplement 1—source data 1
Numerical data corresponding to the traces shown in panel A, and data from all biological repeats of the experiment from which the data in panel B was derived.
The data points that were averaged for values of O2 slope used to calculate fold increase in panel B are in bold, and derived values (corresponding to data in panel B) also provided.
- https://cdn.elifesciences.org/articles/75426/elife-75426-fig5-figsupp1-data1-v2.xlsx
-
Figure 5—figure supplement 1—source data 2
Numerical primary (luminescence) and secondary data corresponding to the graph in panel A (and the graph on the left in Figure 5—figure supplement 1C).
- https://cdn.elifesciences.org/articles/75426/elife-75426-fig5-figsupp1-data2-v2.xlsx
-
Figure 5—figure supplement 1—source data 3
Numerical primary (luminescence) and secondary (k1ʹ and k2ʹ) data corresponding to the graph in panel B (and the graph on the right in Figure 5—figure supplement 1C).
- https://cdn.elifesciences.org/articles/75426/elife-75426-fig5-figsupp1-data3-v2.xlsx
Figure 6 with 2 supplements
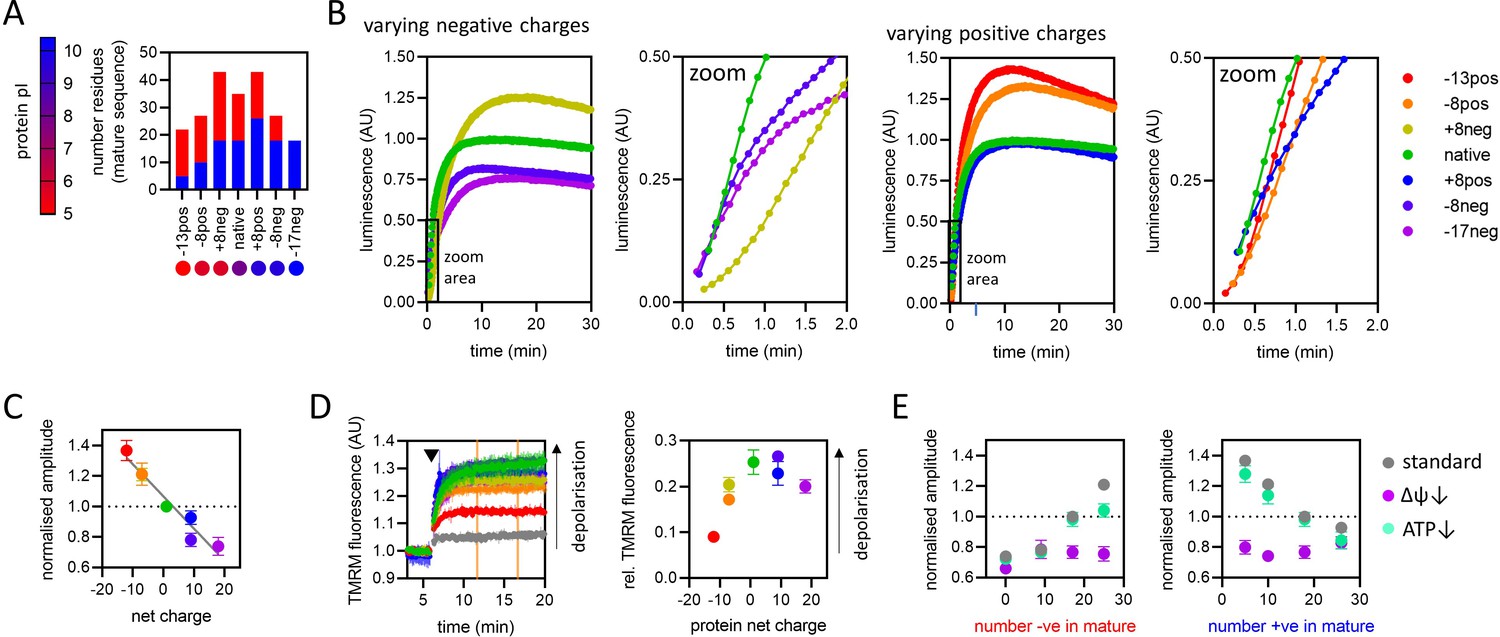
The effect of pre-sequence-containing precursor (PCP) charge on import kinetics.
(A) Overview of the charge variant protein series, showing numbers of positively (blue) and negatively (red) charged residues in the mature part of each protein, and symbols for each protein with colours corresponding to theoretical pI, according to the scale shown on the left. All proteins in the charge variant series have the same length (203 amino acids) and are based on the N-terminal section of yeast cytochrome b2 lacking the stop-transfer signal (∆43–65) to enable complete matrix import (Gold et al., 2014). (B) Import traces for the charge variant proteins in which the number of negative (left) and positive (right) charges is varied, normalised to the native PCP, coloured by rainbow from most negative (red) to most positive (violet). Data shown are a single representative trace; this is because starting points for each data set are slightly offset due to the injection time of the plate reader. Full data – three biological replicates each performed in duplicate – are shown in Figure 6—figure supplement 1. (C) Amplitudes obtained from panel B as a function of net charge (coloured as in panel B), with a line of best fit shown. The data point for the +8neg protein (yellow) is in the same position as the –8pos protein (orange) and is mostly hidden. Data are the mean ± SD of three biological replicates each performed in duplicate. (D) Tetramethylrhodamine methyl ester (TMRM) fluorescence over time in isolated yeast mitochondria (left), with PCPs added at the time indicated by arrowhead. A no protein control (buffer only) is shown in grey, and the remaining traces are shown with the PCP coloured as in panel B. Average TMRM fluorescence over a 5-min window (between orange vertical lines) was calculated for each trace then plotted, relative to no protein control, against protein net charge (right). Data shown is mean ± SD from three biological repeats. (E) Amplitude (normalised to the native PCP in standard conditions) of import signal for the charge variants, where number of negatively (left) or positively (right) charged residues is varied, under standard reaction conditions (grey) or when ∆ψ (purple) or ATP (green) is depleted. Each data point is the mean ± SEM from three biological repeats (shown in Figure 6—figure supplement 1B, C). Error bars smaller than symbols are not shown.
-
Figure 6—source data 1
Numerical data corresponding to the bar chart in panel A.
- https://cdn.elifesciences.org/articles/75426/elife-75426-fig6-data1-v2.xlsx
-
Figure 6—source data 2
Numerical data corresponding to the luminescence traces in panel B.
- https://cdn.elifesciences.org/articles/75426/elife-75426-fig6-data2-v2.xlsx
-
Figure 6—source data 3
Numerical data corresponding to the graph in panel C.
- https://cdn.elifesciences.org/articles/75426/elife-75426-fig6-data3-v2.xlsx
-
Figure 6—source data 4
Numerical data corresponding to the graphs in panel D.
- https://cdn.elifesciences.org/articles/75426/elife-75426-fig6-data4-v2.xlsx
-
Figure 6—source data 5
Numerical data corresponding to the graphs in panel E.
- https://cdn.elifesciences.org/articles/75426/elife-75426-fig6-data5-v2.xlsx
Figure 6—figure supplement 1
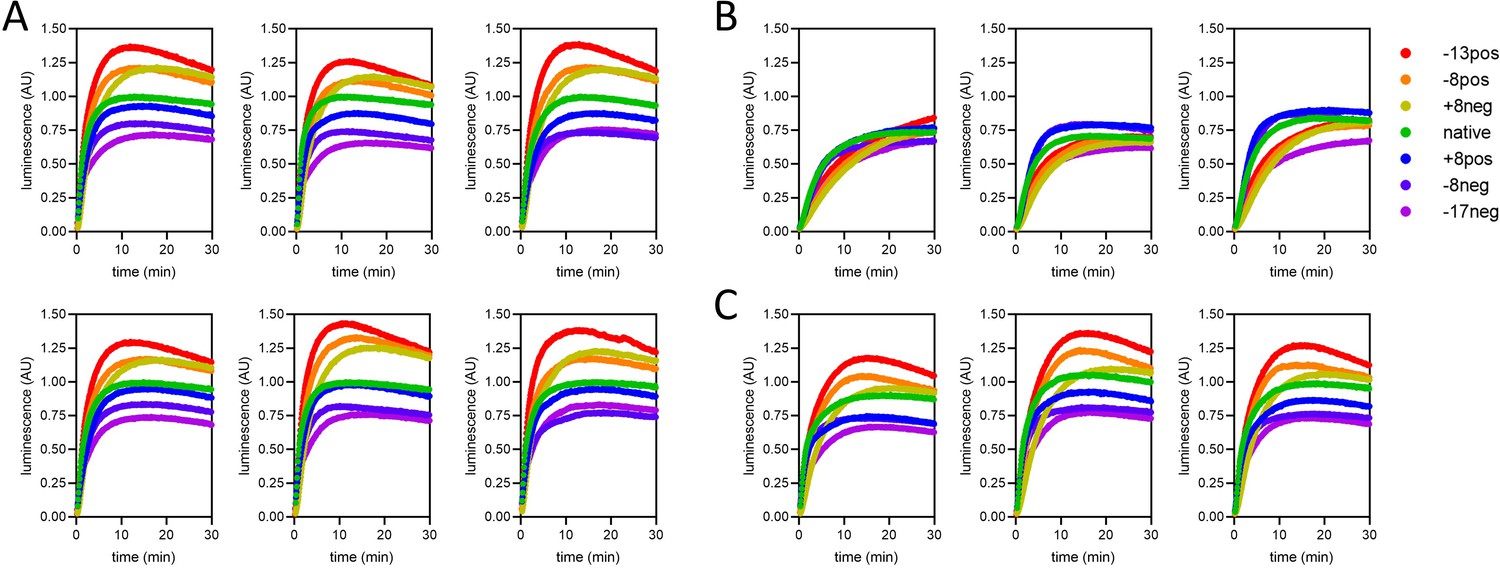
Complete import traces for the data in Figure 6.
(A) Two technical repeats each of three biological replicates, under standard conditions (1 µM pre-sequence-containing precursor, ATP, and regenerating system present and valinomycin absent). (B) Three biological replicates with ∆ψ depletion (achieved by 5-min pre-treatment of mitochondria with 10 nM valinomycin). (C) Three biological replicates with ATP depletion (achieved by excluding ATP and its regenerating system from the assay buffer).
-
Figure 6—figure supplement 1—source data 1
Numerical luminescence data corresponding to the traces in panels A–C.
- https://cdn.elifesciences.org/articles/75426/elife-75426-fig6-figsupp1-data1-v2.xlsx
Figure 6—figure supplement 2

Dissipation of ∆ψ with protein import is not an artefact specific to the NanoLuc assay or of the method of ∆ψ measurement.
(A) Dissipation of ∆ψ with import of a pre-sequence-containing precursor (PCP) lacking pep86. Tetramethylrhodamine methyl ester (TMRM) fluorescence over time in isolated yeast mitochondria with PCP-dihydrofolate reductase (DHFR) at various concentrations added at the time indicated by arrowhead. A no protein control (buffer only) is shown in grey. (B) Isolated yeast mitochondria can build ∆ψ upon addition of NADH, and dissipation of ∆ψ in response to external ADP addition is transient. The graph shows TMRM fluorescence over time in isolated yeast mitochondria. NADH (2 mM) is added at 0 min and ADP added at time indicated by arrowhead.
-
Figure 6—figure supplement 2—source data 1
Numerical data corresponding to the TMRM data.
- https://cdn.elifesciences.org/articles/75426/elife-75426-fig6-figsupp2-data1-v2.xlsx
Figure 7
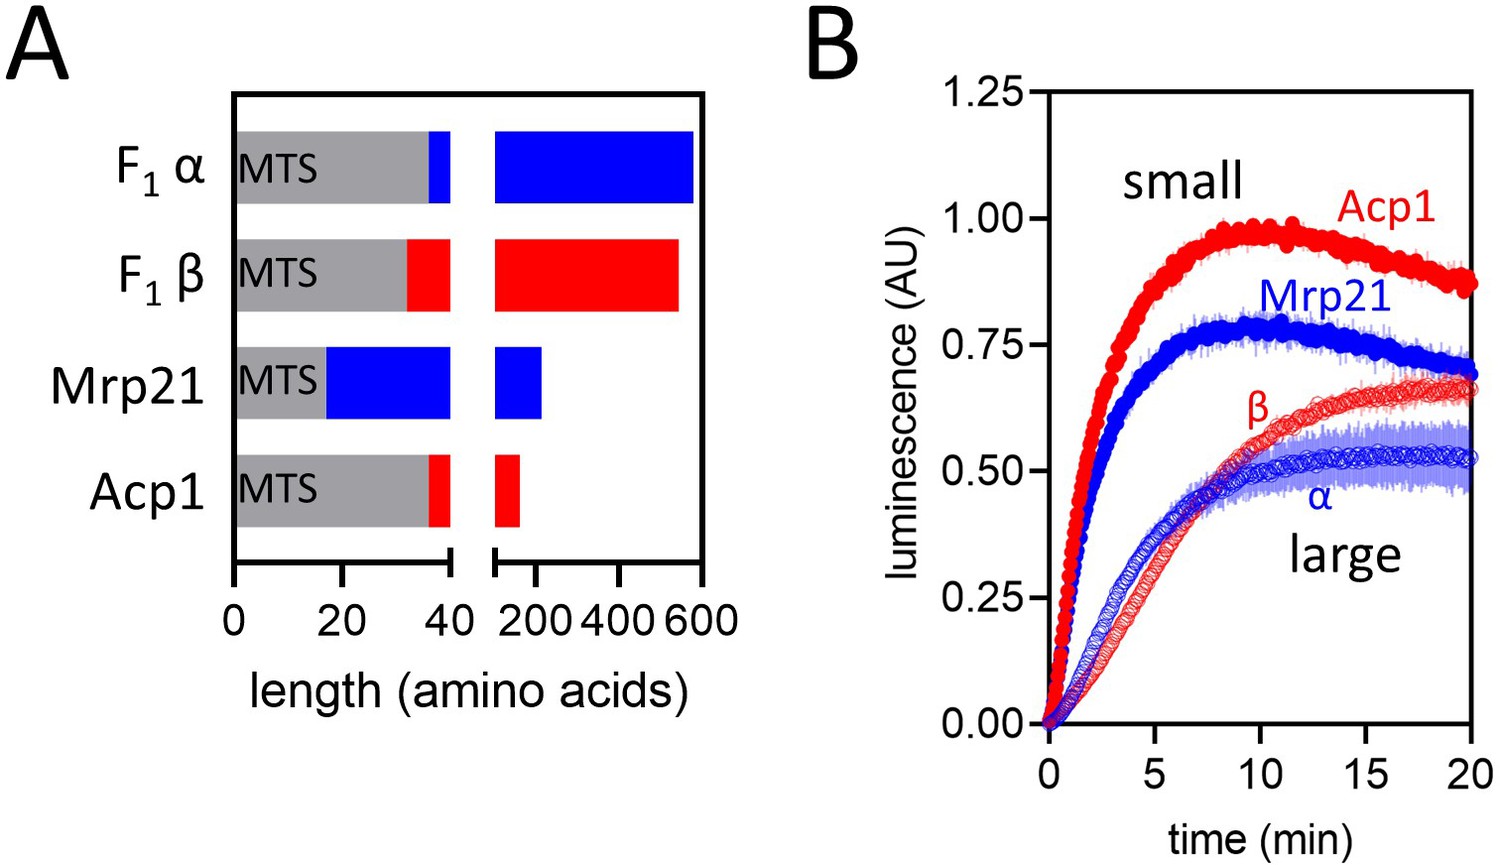
Import of pep86-fused native precursors.
(A) Schematic representation of four native pre-sequence-containing precursors (PCPs) : F1α (long, positively charged, predicted pI of mature part is 6.98), F1β (long, negatively charged, predicted pI of mature part is 5.43), Mrp21 (short, positively charged, predicted pI of mature part is 10.00), and Acp1 (short, negatively charged, predicted pI of mature part is 4.87). (B) Import traces for the four PCPs in panel A under standard conditions (1 µM PCP), normalised to Acp1. Each trace is the mean ± SD of three biological repeats.
-
Figure 7—source data 1
Numerical data corresponding to the bar chart in panel A.
- https://cdn.elifesciences.org/articles/75426/elife-75426-fig7-data1-v2.xlsx
-
Figure 7—source data 2
Numerical data corresponding to the luminescence traces in panel B.
- https://cdn.elifesciences.org/articles/75426/elife-75426-fig7-data2-v2.xlsx
Additional files
-
Supplementary file 1
Table containing full list of PCPs, their amino acid sequences, and expression vectors.
- https://cdn.elifesciences.org/articles/75426/elife-75426-supp1-v2.docx
-
Transparent reporting form
- https://cdn.elifesciences.org/articles/75426/elife-75426-transrepform1-v2.docx
Download links
A two-part list of links to download the article, or parts of the article, in various formats.
Downloads (link to download the article as PDF)
Open citations (links to open the citations from this article in various online reference manager services)
Cite this article (links to download the citations from this article in formats compatible with various reference manager tools)
Towards a molecular mechanism underlying mitochondrial protein import through the TOM and TIM23 complexes
eLife 11:e75426.
https://doi.org/10.7554/eLife.75426


