A discrete parasubthalamic nucleus subpopulation plays a critical role in appetite suppression
- Department of Biology, Williams College, United States
- Department of Physics, Williams College, United States
- Diabetes, Endocrinology, and Obesity Branch, National Institute of Diabetes and Digestive and Kidney Diseases, United States
Figures
Figure 1
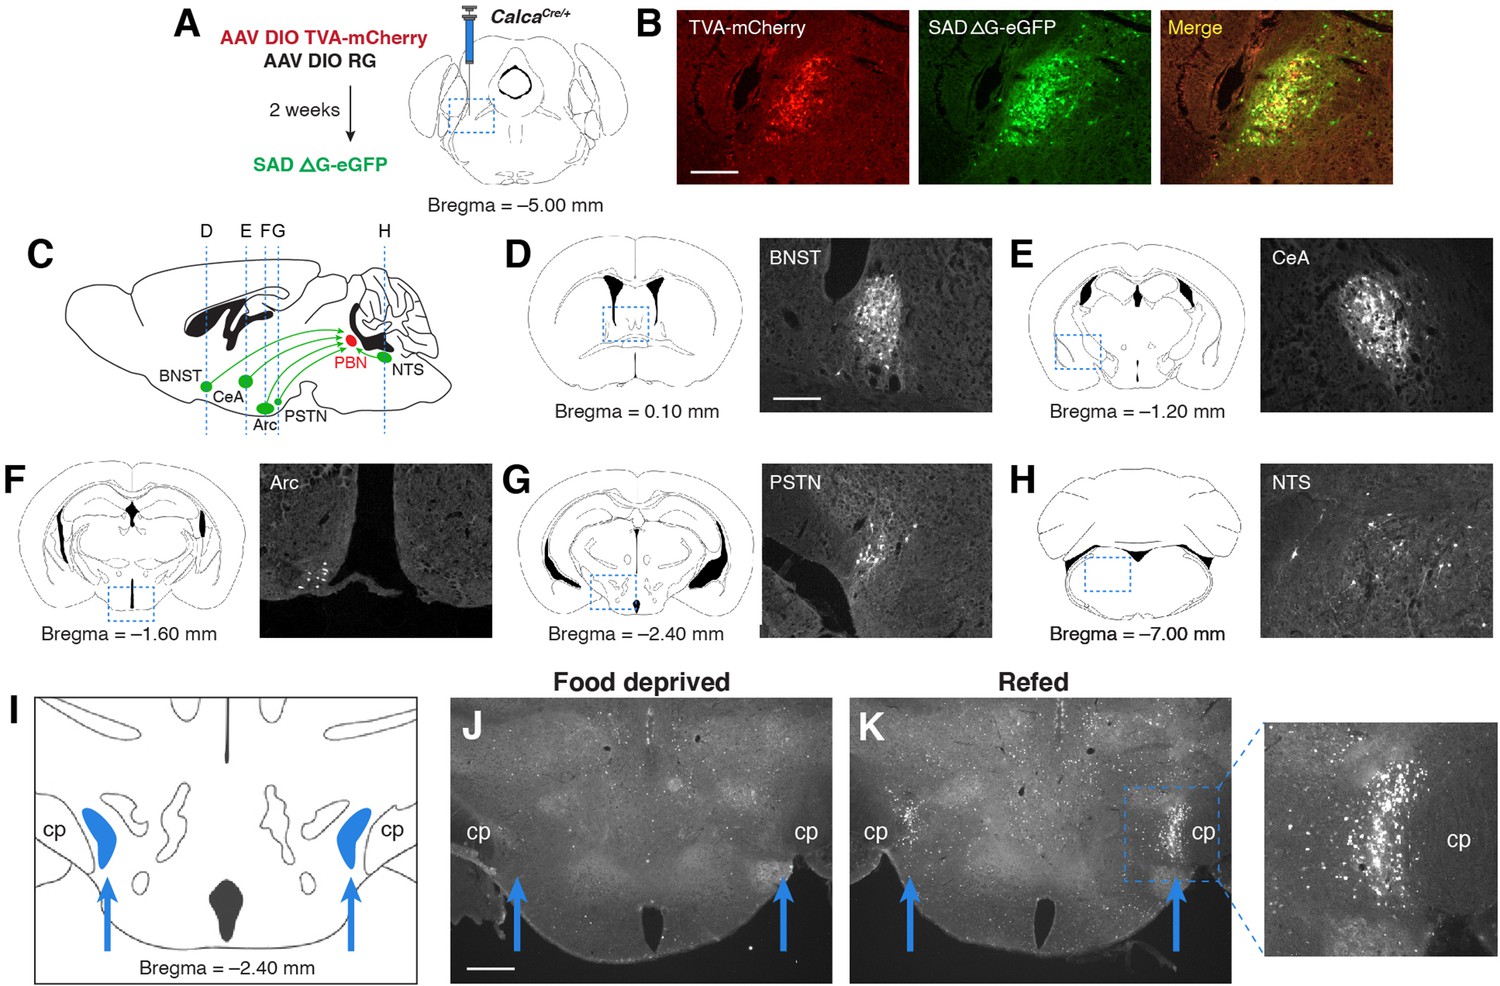
PSTN neurons project to anorexigenic PBNCGRP neurons and are activated by refeeding.
(A) Modified rabies viral strategy used to identify afferent input to PBNCGRP neurons. (B) Confirmation of modified rabies virus reporter transgenes in PBNCGRP neurons. Experiments repeated in N=6 mice. Scale bar, 250 µm. (C) Sagittal mouse brain diagram showing locations of retrograde eGFP expression in (D–H). (D–H) eGFP-expressing neurons in (D) the bed nucleus of the stria terminalis (BNST); (E) the central nucleus of the amygdala (CeA); (F) the hypothalamic arcuate nucleus (Arc); (G) the parasubthalamic nucleus (PSTN); and (H) the nucleus of the solitary tract (NTS). Scale bar, 250 µm. (I) Coronal mouse brain diagram depicting the bilateral location of the PSTN medial to the cerebral peduncle (cp). Blue arrows point to the location of the PSTN. (J) Immunolabelling of Fos expression following 18 hr food deprivation. Scale bar, 500 µm. (K) Immunolabelling of Fos expression following 18 hr food deprivation followed by 30 min refeeding. Right, higher magnification image.
Figure 2
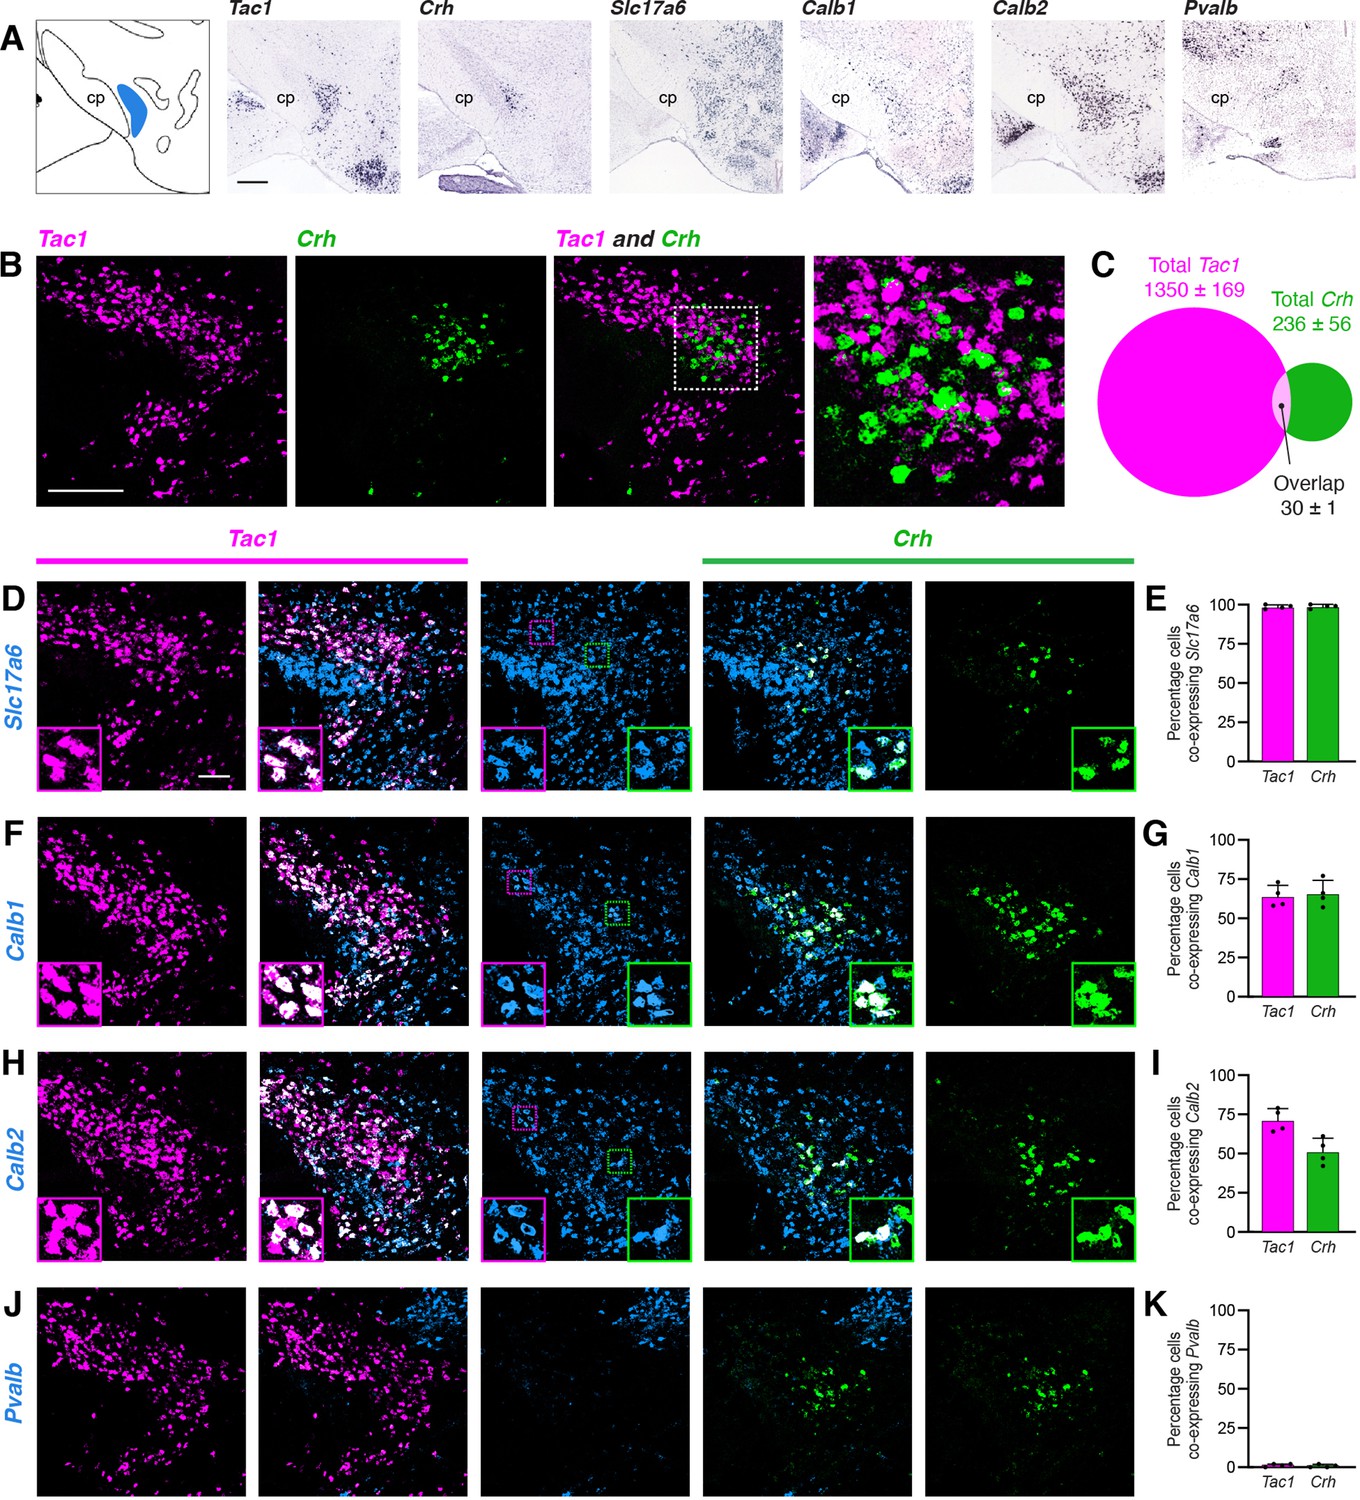
Characterization of PSTN cell types.
(A) In situ hybridization images of selected mRNA transcripts from the Allen Mouse Brain Expression Atlas. cp, cerebral peduncle. Scale bar, 500 µm. (B) Two-color fluorescent in situ hybridization shows near distinct expression of Tac1 and Crh in PSTN neurons. Right, higher magnification image. Scale bar, 200 µm. (C) Quantification of overlap between PSTNTac1 and PSTNCRH neurons. N=4 mice. (D–K) Three-color fluorescent in situ hybridization comparing spatial overlap between neurons expressing Tac1 and Crh with (D,E) Slc17a6; (F,G) Calb1; (H,I) Calb2; and (J,K) Pvalb. Insets show higher magnification images from middle column. Data at right represent mean ± standard deviation. Dots represent individual experimental animals; N=4 mice. Scale bar, 100 µm.
-
Figure 2—source data 1
This file contains the raw data for the visualization of data presented in Figure 2.
- https://cdn.elifesciences.org/articles/75470/elife-75470-fig2-data1-v2.xlsx
Figure 3
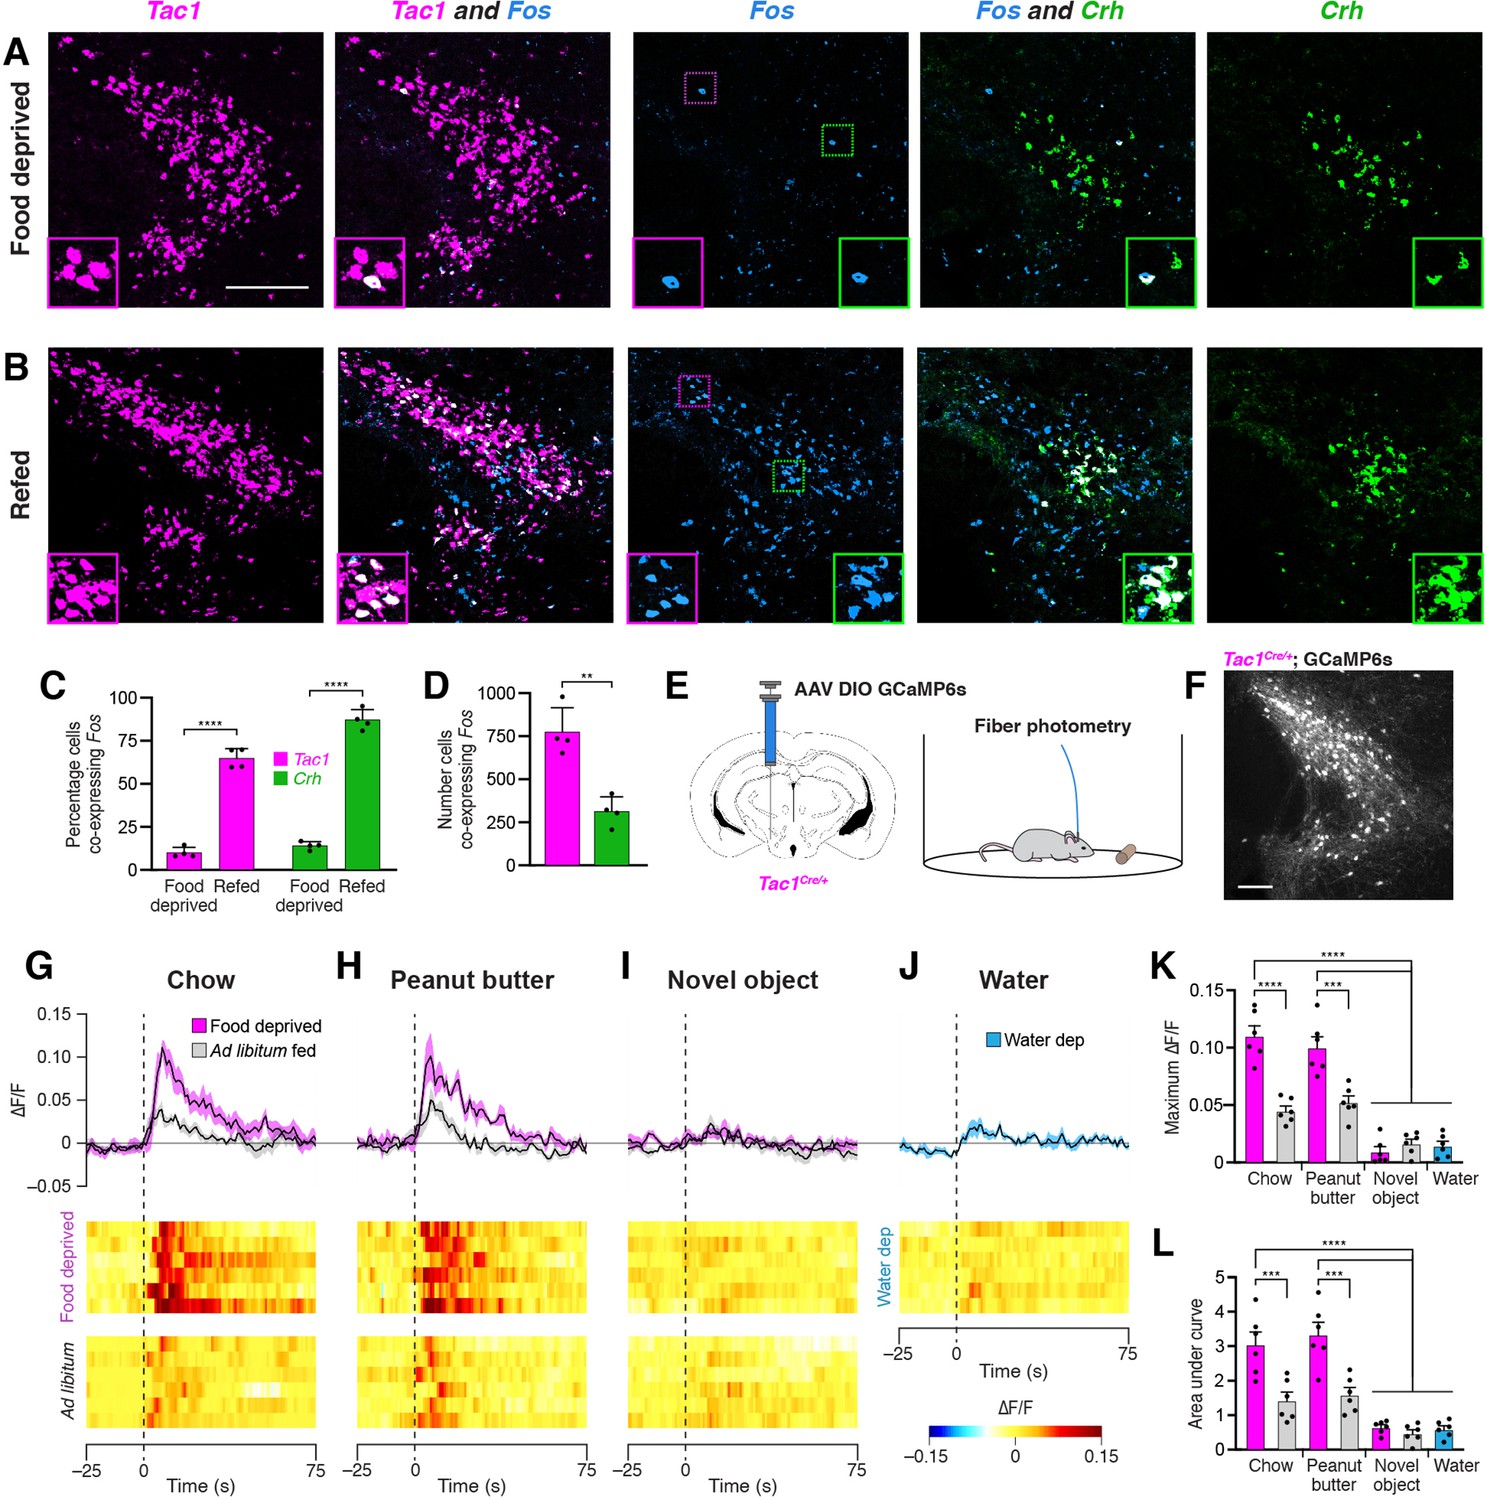
Refeeding and food consumption activate PSTN neurons.
(A–B) Three-color fluorescent in situ hybridization comparing co-expression of Fos in neurons expressing Tac1 or Crh following (A) 18 hr food deprivation or (B) 18 hr food deprivation followed by 30 min refeeding. Insets show higher magnification images from middle column. Scale bar, 200 µm. (C) Quantification of the percentage of Tac1- or Crh-expressing neurons co-expressing Fos in 18 hr food deprivation versus refeeding conditions. N=4 mice. (D) Quantification of the number of Tac1- or Crh-expressing neurons co-expressing Fos following refeeding. N=4 mice. (E) Diagrams showing (left) viral injection strategy to unilaterally target PSTNTac1 neurons with GCaMP6s and (right) subsequent fiber photometry recording in freely moving mice. (F) Representative photomicrograph showing PSTNTac1 neurons expressing GCaMP6s. Scale bar, 100 µm. (G–J) Top, fiber photometry traces in PSTNTac1 neurons following exposure to (G) standard mouse chow, (H) peanut butter, or (I) a novel object from animals food deprived for 18 hr (magenta) or fed ad libitum (grey). (J) Fiber photometry trace in PSTNTac1 neurons following exposure to a water port in water-deprived mice. Data represent the mean ± standard error. Vertical dashed lines depict time of exposure. Bottom, heat maps depicting changes in fluorescence intensity in individual animals. (K) Quantification of maximum values of fluorescence intensity in conditions (G–J). N=6 mice. (L) Quantification of area under the curve of fluorescence intensity among conditions in (G–J). N=6 mice. Data represent mean ± standard error. Dots represent individual experimental animals. Post hoc comparisons: **p<0.01, ***p<0.001, ****p<0.0001. See Supplementary file 1 for additional statistical information.
-
Figure 3—source data 1
This file contains the raw data for the visualization of data presented in Figure 3.
- https://cdn.elifesciences.org/articles/75470/elife-75470-fig3-data1-v2.xlsx
Figure 4
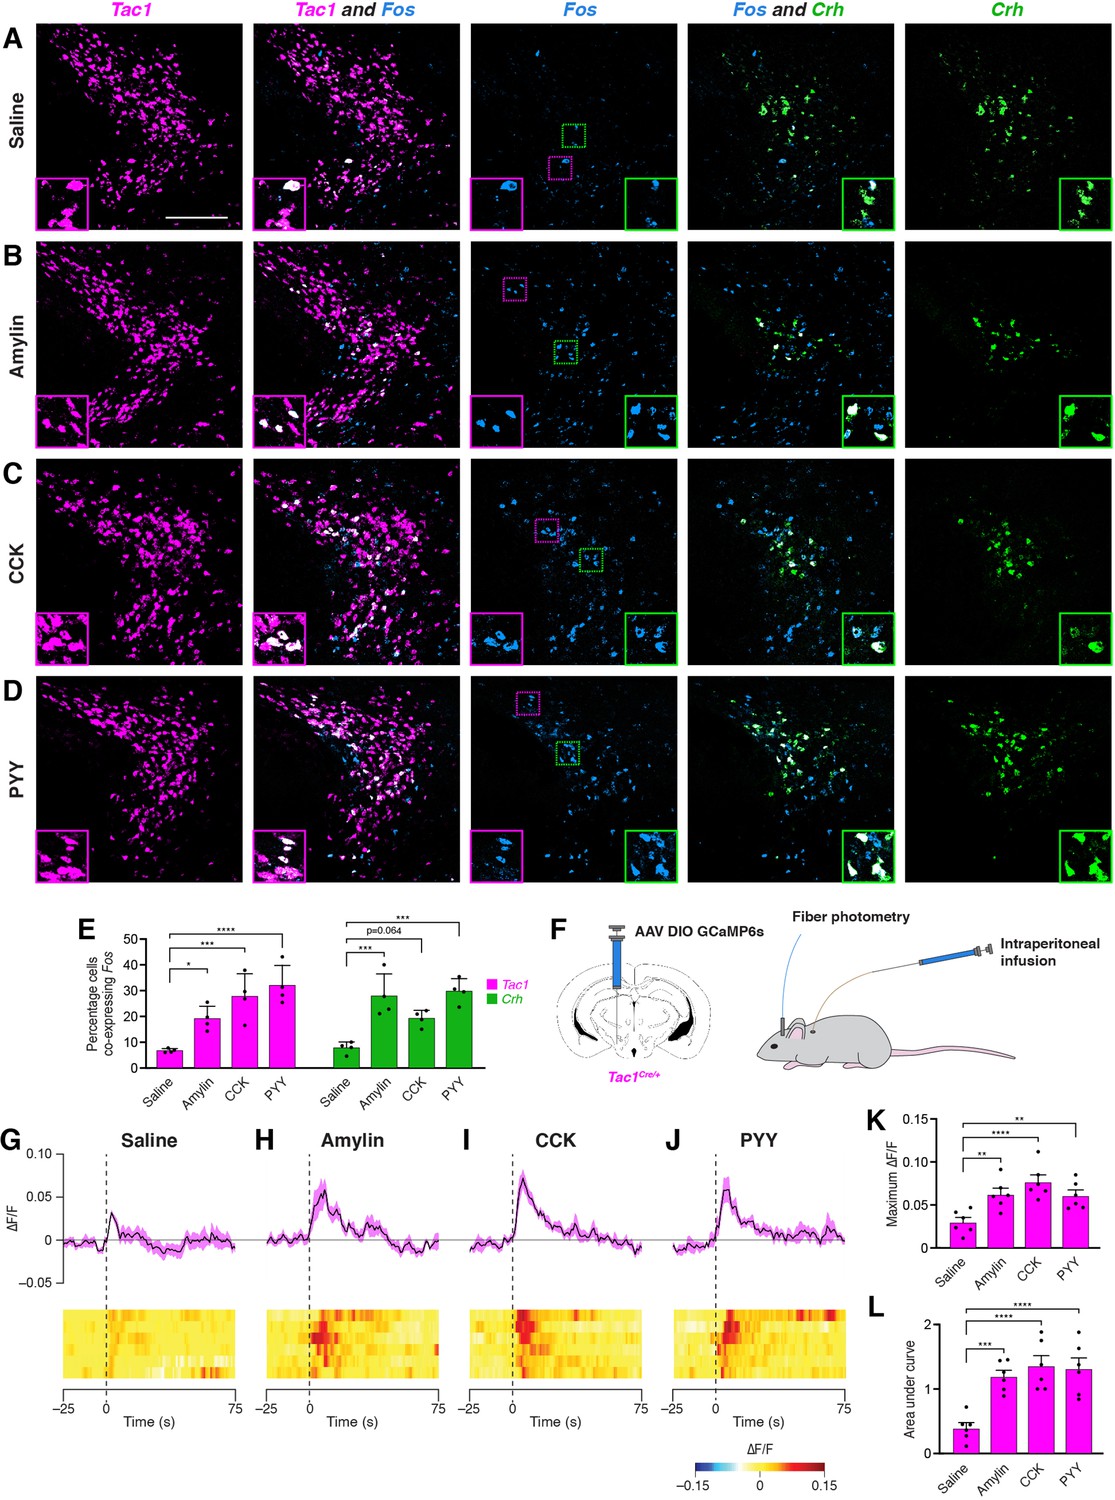
Anorexigenic hormones cause transient activation of PSTN neurons.
(A–D) Three-color fluorescent in situ hybridization comparing co-expression of Fos in neurons expressing Tac1 or Crh following administration of (A) saline, (B) amylin, (C) CCK, or (D) PYY. Insets show higher magnification images from middle column. Scale bar, 200 µm. (E) Quantification of the percentage of Tac1- or Crh-expressing neurons co-expressing Fos across conditions in (A–D). N=4 mice. (F) Diagram showing (left) viral injection strategy to unilaterally target PSTNTac1 neurons with GCaMP6s and (right) subsequent fiber photometry recording in freely moving mice coupled with intraperitoneal infusion of anorexigenic hormones. (G–J) Top, fiber photometry traces in PSTNTac1 neurons following intraperitoneal infusion of (G) saline, (H) amylin, (I) CCK, or (J) PYY. Data represent the mean ± standard error. Vertical dashed lines depict time of injection. Bottom, heat maps depicting changes in fluorescence intensity in individual animals. (K) Quantification of maximum values of fluorescence intensity in conditions (G–J). N=6 mice. (L) Quantification of area under the curve of fluorescence intensity among conditions in (G–J). N=6 mice. Data represent mean ± standard error. Dots represent individual experimental animals. Post hoc comparisons: *p<0.05, **p<0.01, ***p<0.001, ****p<0.0001. See Supplementary file 1 for additional statistical information.
-
Figure 4—source data 1
This file contains the raw data for the visualization of data presented in Figure 4.
- https://cdn.elifesciences.org/articles/75470/elife-75470-fig4-data1-v2.xlsx
Figure 5
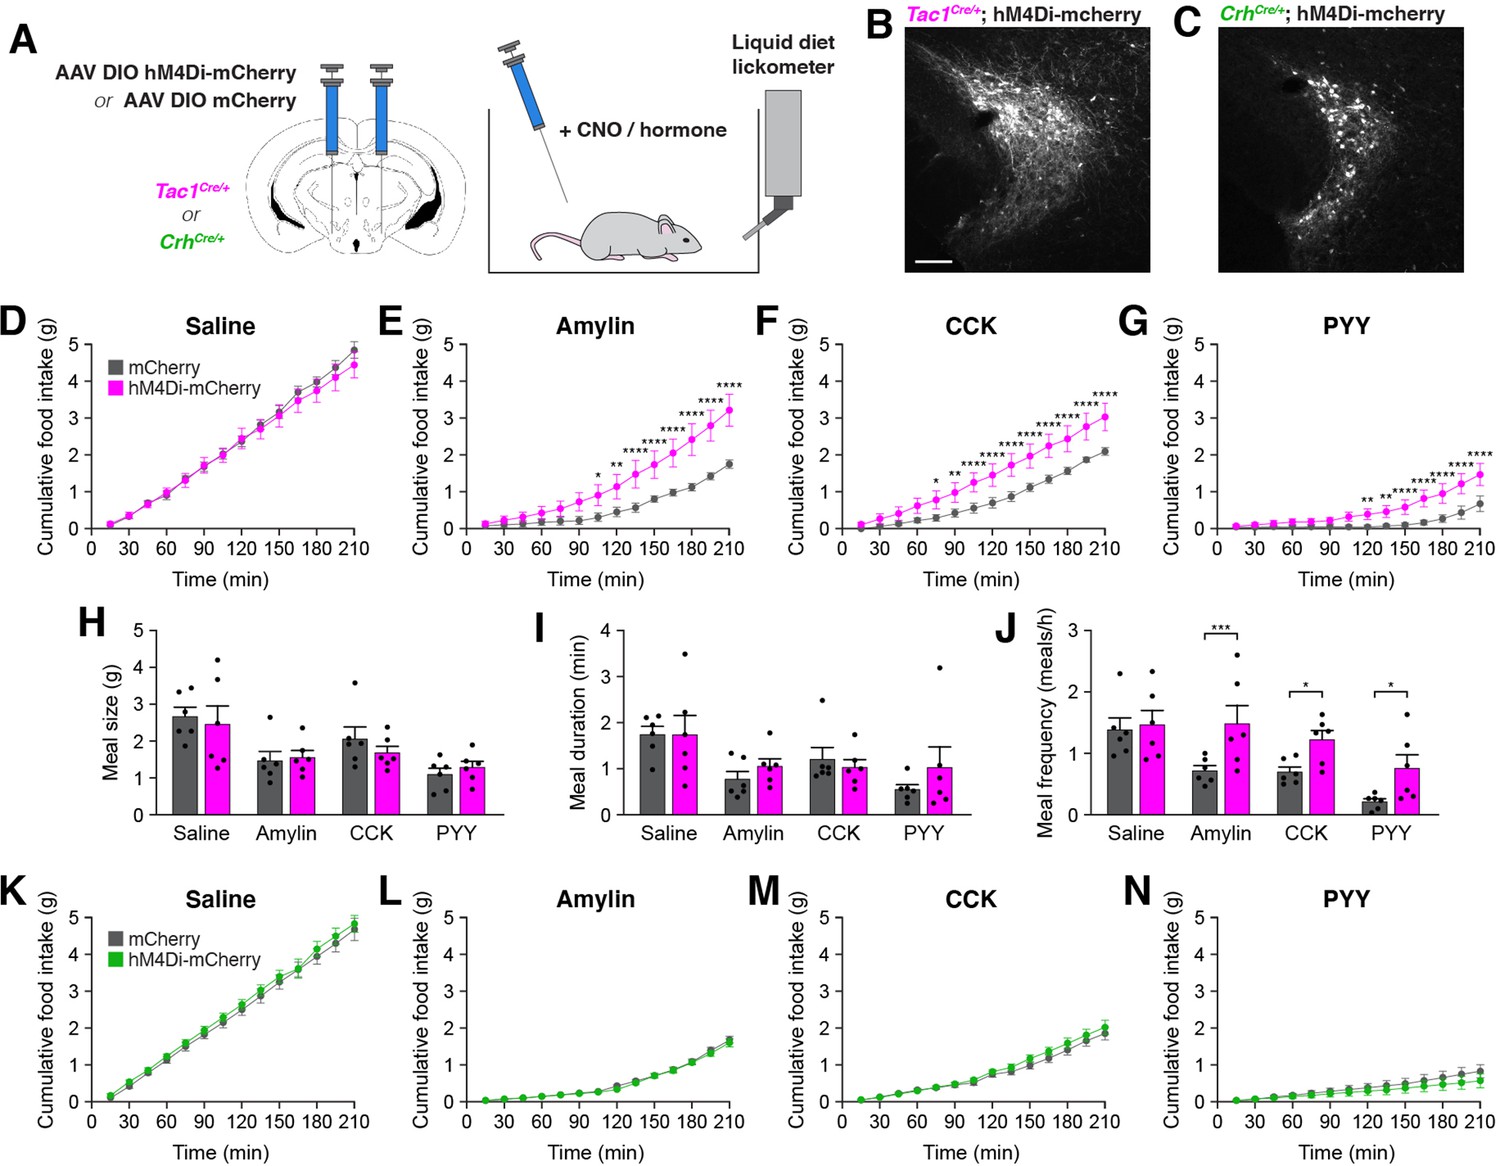
Inhibition of PSTNTac1 neurons attenuates the anorexigenic effects of appetite-suppressing hormones.
(A) Diagram showing (left) viral injection strategy to unilaterally target PSTNTac1 or PSTNCRH neurons with hM4Di-mCherry or mCherry transgenes and (right) subsequent food intake measurements following administration of CNO and anorexigenic hormones. (B) Representative photomicrograph showing PSTNTac1 neurons expressing hM4Di-mCherry. Scale bar, 100 µm. (C) Representative photomicrograph showing PSTNCRH neurons expressing hM4Di-mCherry. (D–G) Cumulative food intake in Tac1Cre/+ animals administered CNO followed with (D) saline, (E) amylin, (F) CCK, or (G) PYY. (H–J) Quantification of (H) meal size, (I) meal duration, (J) and meal frequency in conditions (D–G). (K–N) Cumulative food intake in CrhCre/+ animals administered CNO followed with (K) saline, (L) amylin, (M) CCK, or (N) PYY. Data represent mean ± standard error. Dots represent individual experimental animals; N=6 mice in all experiments. Post hoc comparisons: *p<0.05, **p<0.01, ***p<0.001, ****p<0.0001. See Supplementary file 1 for additional statistical information.
-
Figure 5—source data 1
This file contains the raw data for the visualization of data presented in Figure 5.
- https://cdn.elifesciences.org/articles/75470/elife-75470-fig5-data1-v2.xlsx
Figure 6
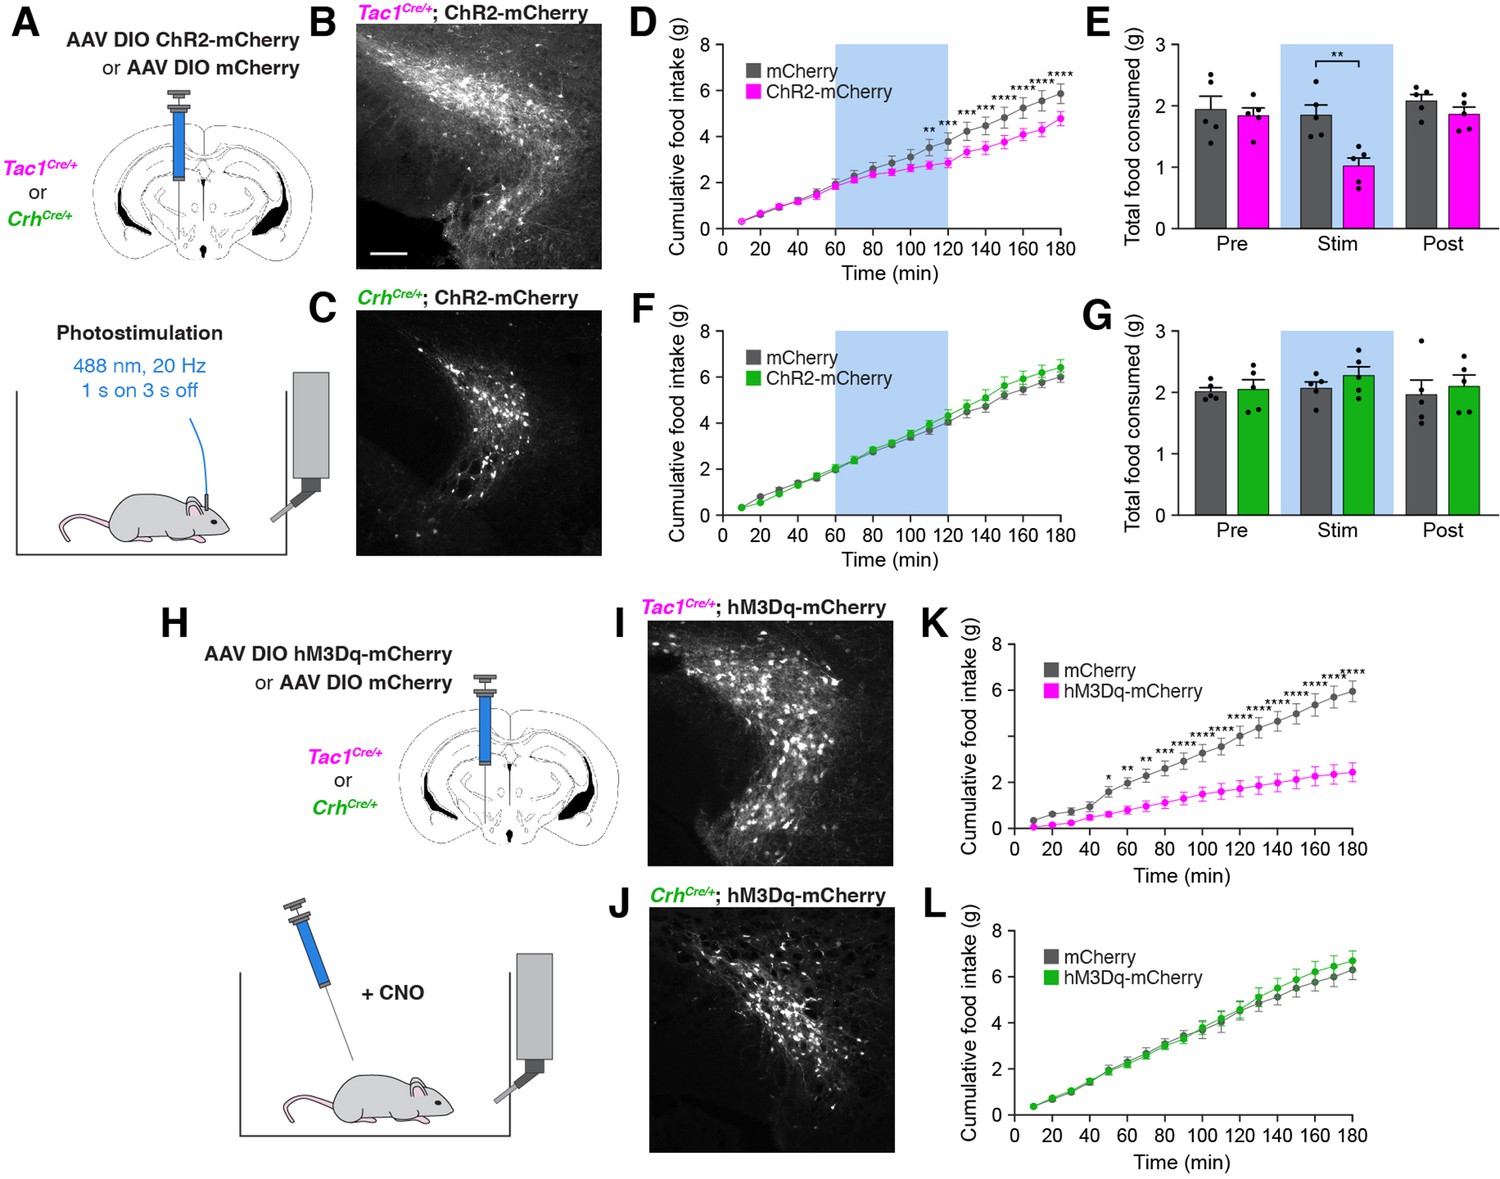
Stimulation of PSTNTac1 neurons suppresses feeding.
(A) Diagram showing (top) viral injection strategy to unilaterally target PSTNTac1 or PSTNCRH neurons with ChR2-mCherry or mCherry transgenes and (bottom) subsequent optogenetic manipulation during food intake recordings. (B) Representative photomicrograph showing PSTNTac1 neurons expressing ChR2-mCherry. Scale bar, 100 µm. (C) Representative photomicrograph showing PSTNCRH neurons expressing ChR2-mCherry. (D–E) Quantification of (D) cumulative food intake and (E) total food consumed during pre-stimulation, stimulation, and post-stimulation of PSTNTac1 neurons. Blue background represents the 60-min photostimulation period. (F–G) Quantification of (F) cumulative food intake and (G) total food consumed during pre-stimulation, stimulation, and post-stimulation of PSTNCRH neurons. Blue background represents the 60-min photostimulation period. (H) Diagram showing (top) viral injection strategy to unilaterally target PSTNTac1 or PSTNCRH neurons with hM3Dq-mCherry or mCherry transgenes and (bottom) subsequent chemogenetic manipulation during food intake recordings. (I) Representative photomicrograph showing PSTNTac1 neurons expressing hM3Dq-mCherry. (J) Representative photomicrograph showing PSTNCRH neurons expressing hM3Dq-mCherry. (K–L) Quantification of cumulative food intake in (K) Tac1Cre/+ or (L) CrhCre/+ mice following administration of CNO. Data represent mean ± standard error. Dots represent individual experimental animals; N=5 mice in all experiments. Post hoc comparisons: *p<0.05, **p<0.01, ***p<0.001, ****p<0.0001. See Supplementary file 1 for additional statistical information.
-
Figure 6—source data 1
This file contains the raw data for the visualization of data presented in Figure 6.
- https://cdn.elifesciences.org/articles/75470/elife-75470-fig6-data1-v2.xlsx
Figure 7
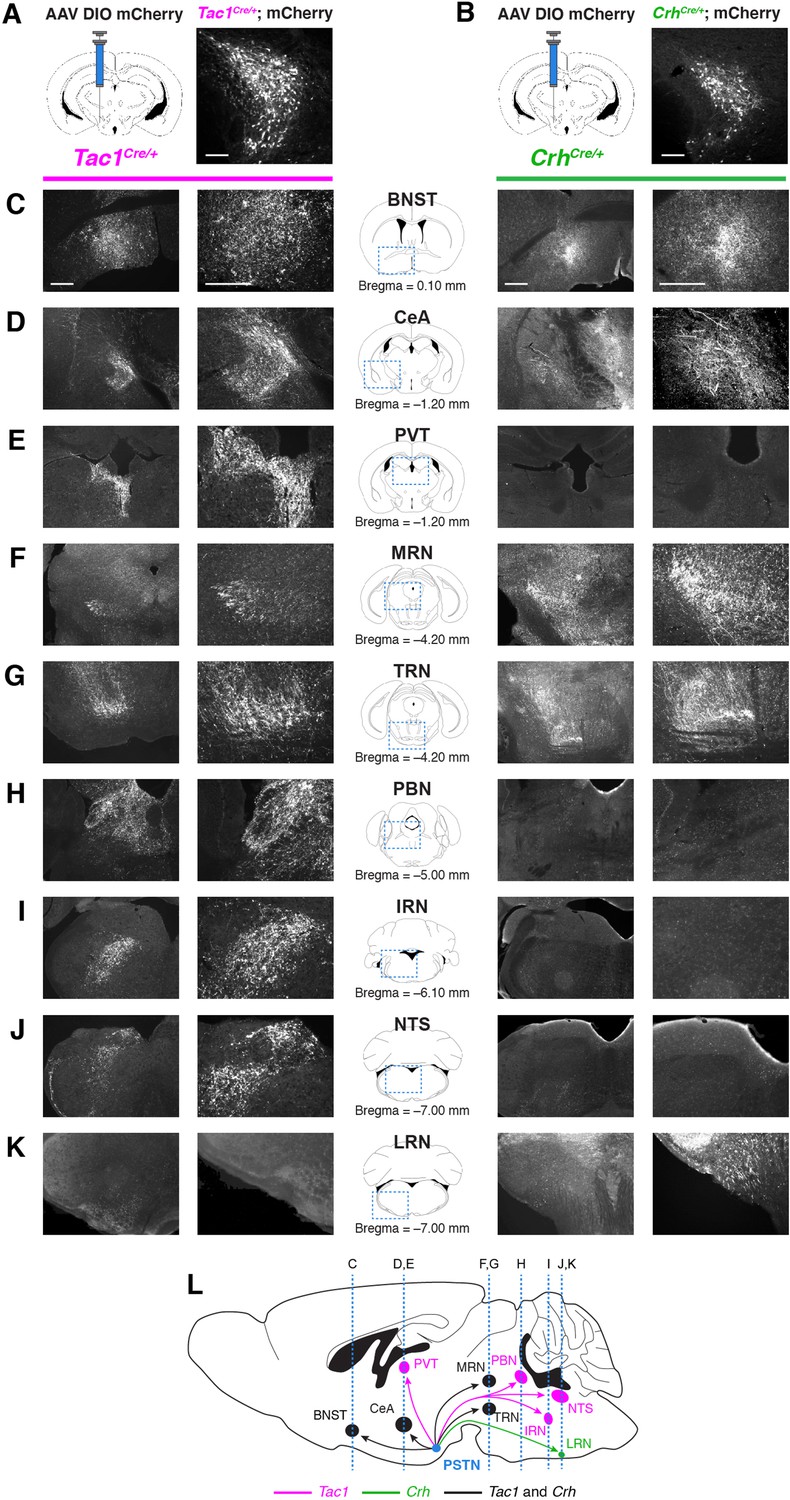
Nonidentical efferent projections from PSTNTac1 and PSTNCRH neurons throughout the brain.
(A–B) Left, diagram showing viral injection strategy to unilaterally target (A) PSTNTac1 or (B) PSTNCRH neurons with the mCherry transgene. Right, representative images of mCherry expression. N=4 mice in each condition. Scale bar, 100 µm. (C–K) Representative lower and higher magnification images of mCherry expression in PSTNTac1 projections (left columns) and PSTNCRH projections (right columns) throughout the brain. Scale bars, 500 µm. (L) Sagittal mouse brain diagram summarizing locations of PSTNTac1 and PSTNCRH projections throughout the brain. BNST, bed nucleus of the stria terminalis; CeA, central nucleus of the amygdala; IRN, intermediate reticular nucleus; LRN, lateral reticular nucleus; MRN, midbrain reticular nucleus; NTS, nucleus of the solitary tract; PBN, parabrachial nucleus; PVT, paraventricular thalamic nucleus; TRN, tegmental reticular nucleus.
Figure 8

Stimulation of PSTNTac1 neuron projections suppresses feeding.
(A) Diagram showing optogenetic strategy to unilaterally target PSTNTac1 neurons with ChR2-mCherry or mCherry transgenes with ipsilateral optic fiber implantation above the BNST. (B) Representative photomicrograph showing PSTNTac1 projections expressing ChR2-mCherry in the BNST. (C–D) Quantification of (C) cumulative food intake and (D) total food consumed during pre-stimulation, stimulation, and post-stimulation of PSTNTac1 projections to the BNST. (E) Diagram showing optogenetic strategy to unilaterally target PSTNTac1 neurons with ChR2-mCherry or mCherry transgenes with ipsilateral optic fiber implantation above the CeA. (F) Representative photomicrograph showing PSTNTac1 projections expressing ChR2-mCherry in the CeA. (G–H) Quantification of (G) cumulative food intake and (H) total food consumed during pre-stimulation, stimulation, and post-stimulation of PSTNTac1 projections to the CeA. (I) Diagram showing optogenetic strategy to unilaterally target PSTNTac1 neurons with ChR2-mCherry or mCherry transgenes with ipsilateral optic fiber implantation above the PVT. (J) Representative photomicrograph showing PSTNTac1 projections expressing ChR2-mCherry in the PVT. (K–L) Quantification of (K) cumulative food intake and (L) total food consumed during pre-stimulation, stimulation, and post-stimulation of PSTNTac1 projections to the PVT. (M) Diagram showing optogenetic strategy to unilaterally target PSTNTac1 neurons with ChR2-mCherry or mCherry transgenes with ipsilateral optic fiber implantation above the PBN. (N) Representative photomicrograph showing PSTNTac1 projections expressing ChR2-mCherry in the PBN. (O–P) Quantification of (O) cumulative food intake and (P) total food consumed during pre-stimulation, stimulation, and post-stimulation of PSTNTac1 projections to the PBN. (Q) Diagram showing optogenetic strategy to unilaterally target PSTNTac1 neurons with ChR2-mCherry or mCherry transgenes with ipsilateral optic fiber implantation above the NTS. (R) Representative photomicrograph showing PSTNTac1 projections expressing ChR2-mCherry in the NTS. (S–T) Quantification of (S) cumulative food intake and (T) total food consumed during pre-stimulation, stimulation, and post-stimulation of PSTNTac1 projections to the NTS. Data represent mean ± standard error. Dots represent individual experimental animals; N=6 mice in all experiments. Blue background represents the 60 min photostimulation period. Post hoc comparisons: *p<0.05, **p<0.01, ***p<0.001, ****p<0.0001. See Supplementary file 1 for additional statistical information. Scale bar, 250 µm.
-
Figure 8—source data 1
This file contains the raw data for the visualization of data presented in Figure 8.
- https://cdn.elifesciences.org/articles/75470/elife-75470-fig8-data1-v2.xlsx
Tables
Key resources table
| Reagent type (species) or resource | Designation | Source or reference | Identifiers | Additional information |
|---|---|---|---|---|
| Genetic reagent (Mus musculus) | B6;129S-Tac1tm1.1(cre)Hze/J | The Jackson Laboratory | JAX: 021877 | Tac1Cre mouse |
| Genetic reagent (Mus musculus) | B6(Cg)-Crhtm1(cre)Zjh/J | The Jackson Laboratory | JAX: 012704 | CrhCre mouse |
| Genetic reagent (Mus musculus) | B6.Cg-Calcatm1.1(cre/EGFP)Rpa/J | The Jackson Laboratory | JAX: 033168 | CalcaCre mouse |
| Genetic reagent (Dependoparvovirus) | AAV9-hSyn-DIO-mCherry | Addgene | #50,459 | Adeno-associated viral vector |
| Genetic reagent (Dependoparvovirus) | AAV9-CAG-Flex-GCaMP6s | Addgene | #100,842 | Adeno-associated viral vector |
| Genetic reagent (Dependoparvovirus) | AAV9-hSyn-DIO-hM3Dq-mCherry | Addgene | #44,361 | Adeno-associated viral vector |
| Genetic reagent (Dependoparvovirus) | AAV9-hSyn-DIO-hM4Di-mCherry | Addgene | #44,362 | Adeno-associated viral vector |
| Genetic reagent (Dependoparvovirus) | AAV5-Ef1a-DIO-ChR2-mCherry | UNC North Carolina Vector Core | #AV4379J | Adeno-associated viral vector |
| Genetic reagent (Dependoparvovirus) | AAV5-Ef1a-Flex-TVA-mCherry | Stanford University Gene Vector and Virus Core | #GVVC-AAV-67 | Adeno-associated viral vector |
| Genetic reagent (Dependoparvovirus) | AAV8-CAG-Flex-RabiesG | Stanford University Gene Vector and Virus Core | #GVVC-AAV-59 | Adeno-associated viral vector |
| Genetic reagent (Rabies lyssavirus) | SAD-ΔG-eGFP | Salk Institute Viral Vector Core | SAD-ΔG-eGFP | Modified rabies viral vector |
| Antibody | anti-Fos (Rabbit polyclonal) | Cell Signaling Technology | #2,250 | (1:1000) |
| Antibody | AlexaFluor 488-conjugated anti-rabbit (Donkey polyclonal) | Jackson ImmunoResearch | #711-545-152 | (1:250) |
| Chemical compound, drug | Amylin | Bachem | #H-9475 | 10 μg/kg |
| Chemical compound, drug | Cholecystokinin | Bachem | #4033010 | 10 μg/kg |
| Chemical compound, drug | Protein YY | Bachem | #H-6042 | 100 μg/kg |
| Chemical compound, drug | Clozapine-N-oxide | Sigma-Aldrich | #C0832 | 0.3 mg/kg |
| Chemical compound, drug | 2,2,2-Tribromoethanol | Sigma-Aldrich | #48,402 | |
| Sequence-based reagent | RNAscope Probe-Mm-Crh | ACDBio | #316,091 | |
| Sequence-based reagent | RNAscope Probe-Mm-Tac1 | ACDBio | #410,351 | |
| Sequence-based reagent | RNAscope Probe-Mm-Tac1-C3 | ACDBio | #410351-C3 | |
| Sequence-based reagent | RNAscope Probe-Mm-Slc17a6-C2 | ACDBio | #319171-C2 | |
| Sequence-based reagent | RNAscope Probe-Mm-Calb1-C2 | ACDBio | #428431-C2 | |
| Sequence-based reagent | RNAscope Probe-Mm-Calb2-C2 | ACDBio | #313641-C2 | |
| Sequence-based reagent | RNAscope Probe-Mm-Pvalb-C2 | ACDBio | #421931-C2 | |
| Sequence-based reagent | RNAscope Probe-Mm-Fos-C2 | ACDBio | #316921-C2 | (1:10) |
| Commercial assay, kit | RNAscope Multiplex Fluorescent Reagent Kit v2 | ACDBio | #323,100 | |
| Software, algorithm | Fusion Software | Omnitech Electronics | Food intake measurement software | |
| Software, algorithm | Synapse Software | Tucker-Davis Technologies | Fiber photometry measurement software | |
| Software, algorithm | MATLAB | Mathworks | Fiber photometry measurement data analysis | |
| Software, algorithm | Prism 8.0 | GraphPad | Statistical software | |
| Other | Opal 520 | Akoya Biosciences | #FP1487001KT | Histological stain for RNAscope (1:1500) |
| Other | Opal 570 | Akoya Biosciences | #FP1488001KT | Histological stain for RNAscope (1:1500) |
| Other | Opal 690 | Akoya Biosciences | #FP1497001KT | Histological stain for RNAscope (1:1500) |
| Other | DAPI Fluoromount-G | Southern Biotech | #0100–20 | Slide mounting medium with DAPI nuclear stain |
| Other | Fluoromount-G | Southern Biotech | #0100–01 | Slide mounting medium |
Additional files
-
Supplementary file 1
This file contains detailed statistical information for all data analyzed throughout this study.
- https://cdn.elifesciences.org/articles/75470/elife-75470-supp1-v2.xlsx
-
Transparent reporting form
- https://cdn.elifesciences.org/articles/75470/elife-75470-transrepform1-v2.docx
Download links
A two-part list of links to download the article, or parts of the article, in various formats.
Downloads (link to download the article as PDF)
Open citations (links to open the citations from this article in various online reference manager services)
Cite this article (links to download the citations from this article in formats compatible with various reference manager tools)
A discrete parasubthalamic nucleus subpopulation plays a critical role in appetite suppression
eLife 11:e75470.
https://doi.org/10.7554/eLife.75470


