One-shot generalization in humans revealed through a drawing task
- Department of Experimental Psychology, Justus Liebig University Giessen, Germany
- Laboratory of Experimental Psychology, University of Leuven (KU Leuven), Belgium
- Center for Mind, Brain and Behavior (CMBB), University of Marburg and Justus Liebig University Giessen, Germany
Figures
Figure 1 with 1 supplement
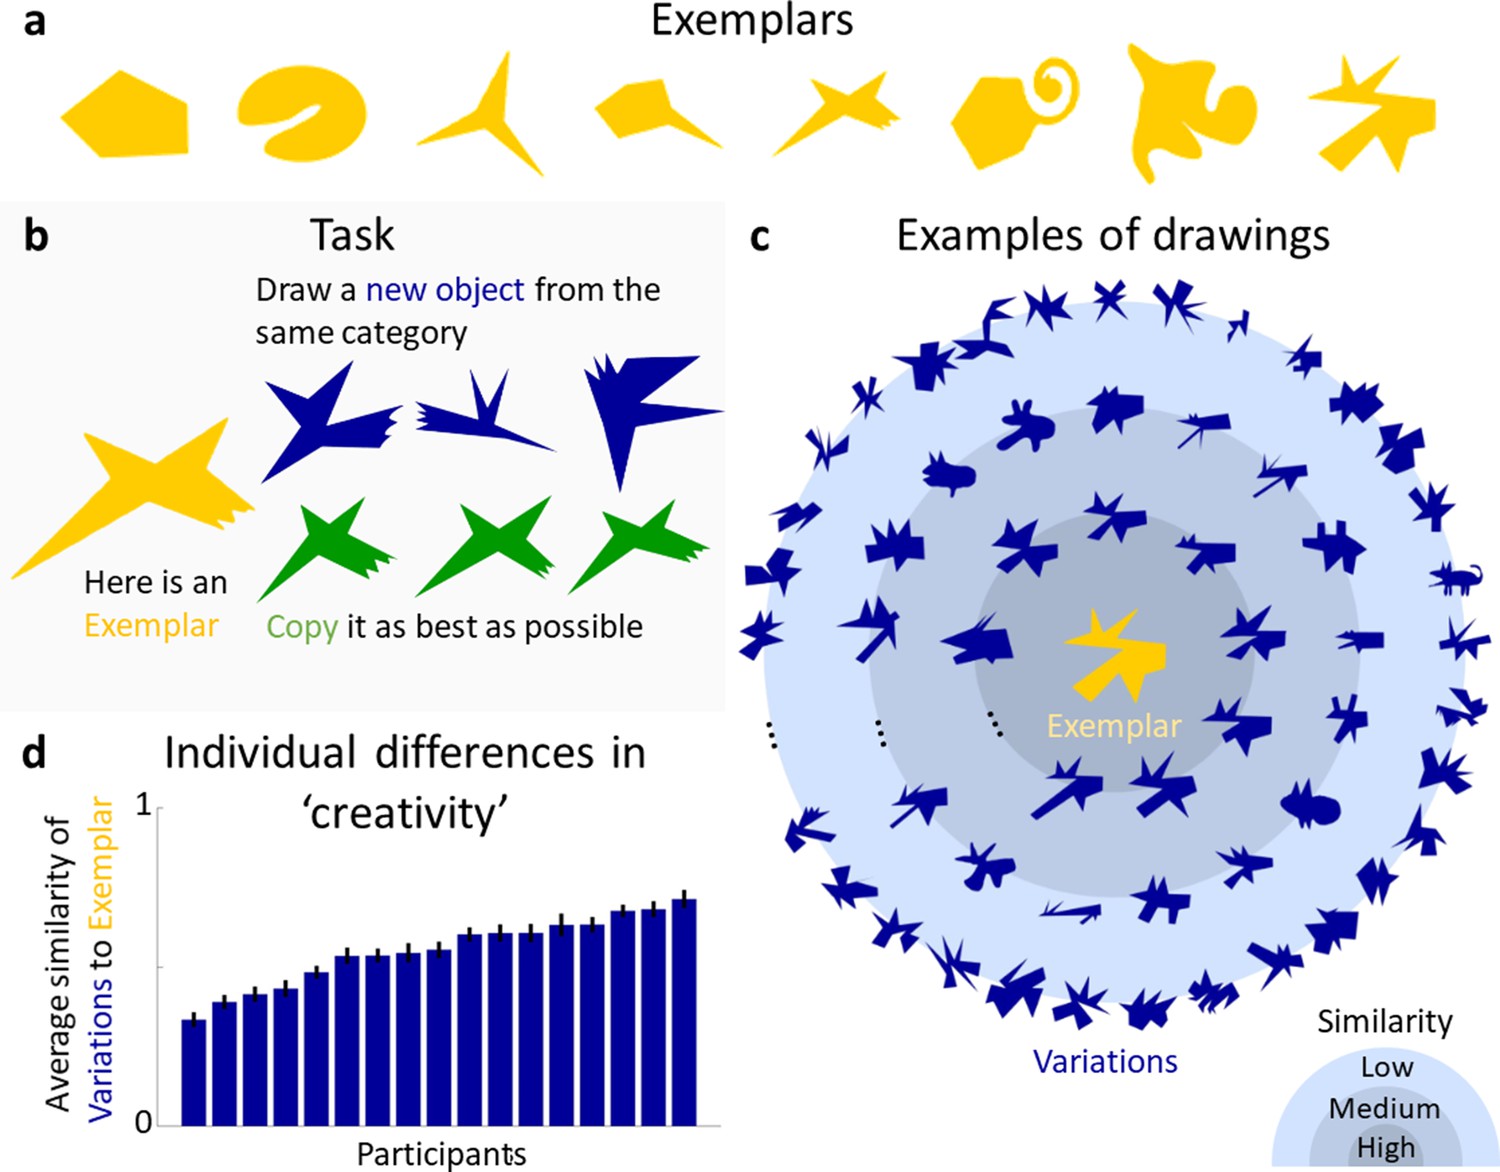
Generative one-shot categorization task and results.
(a) Exemplars presented in the Experiments. (b) In the task, a group of participants was presented with an Exemplar and asked to draw new objects from the same category (blue). As a measure of baseline performance, another group of participants was asked to copy the Exemplar as accurately as possible (green). (c) Examples of drawn Variations (blue) generated in response to one of the Exemplars (yellow). Variations are plotted according to their perceptual similarity to the Exemplar, with more similar Variations closer to the centre. (d) Individual differences in ‘creativity’, defined by the average perceived similarity of participant’s drawings to the respective Exemplar. Error bars indicate standard errors.
Figure 1—figure supplement 1
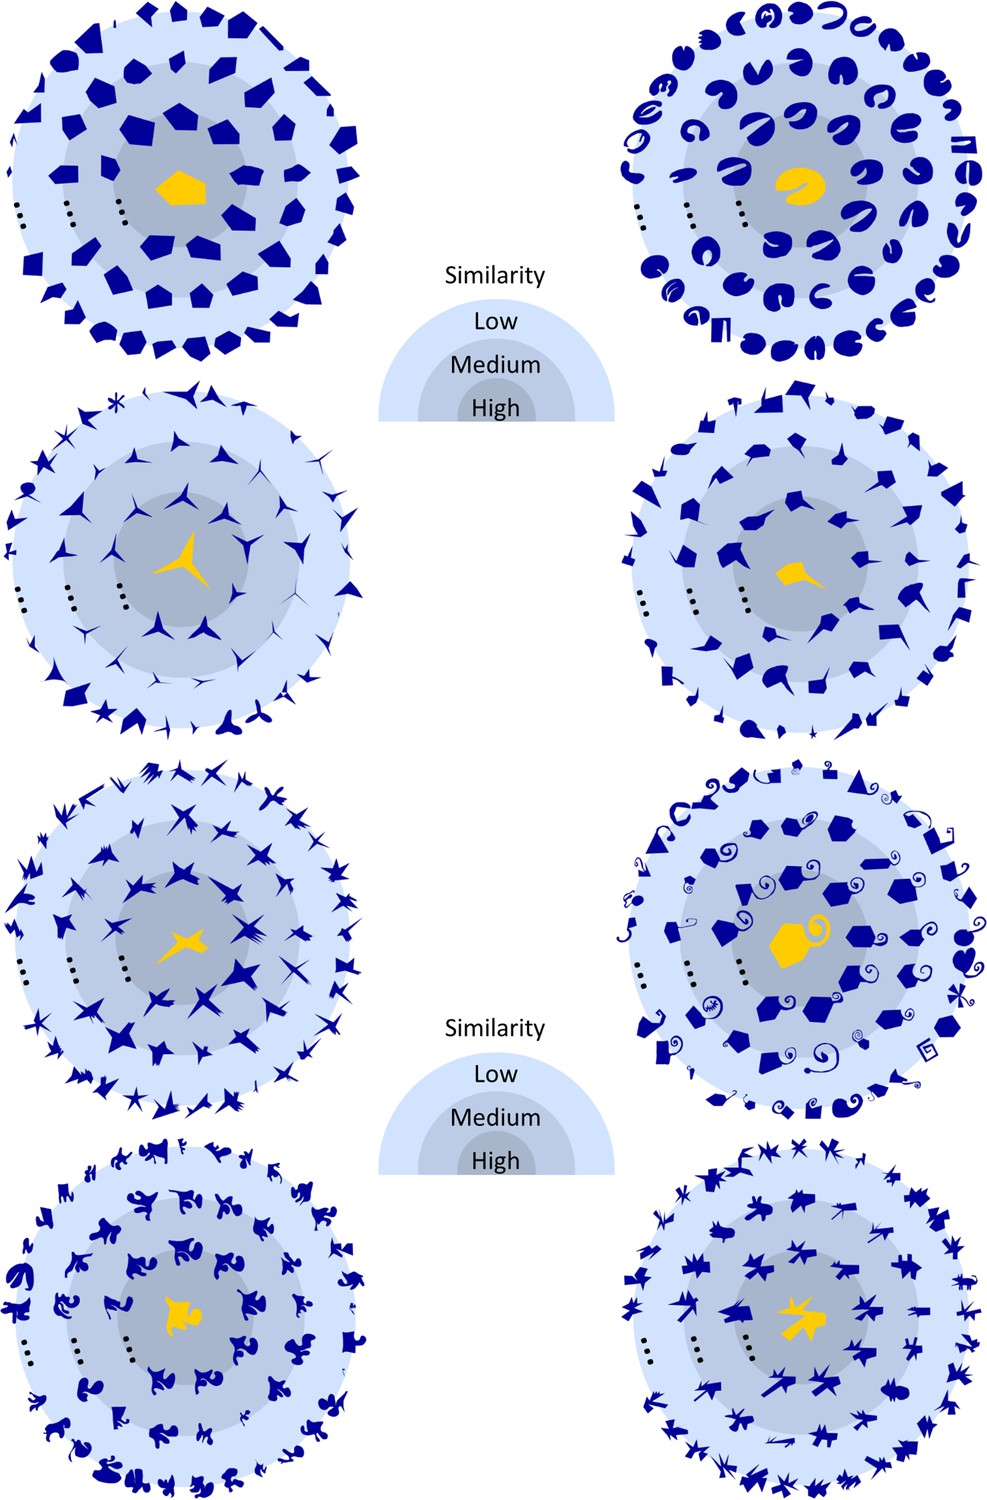
A subset of Variations (dark blue) created for each Exemplar (yellow, centre).
Variations shown closer to the centre were deemed more similar to the respective Exemplar (Experiment 2). The complete set of all Variations and their corresponding similarities to the originating Exemplar can be downloaded from Zenodo.
Figure 2
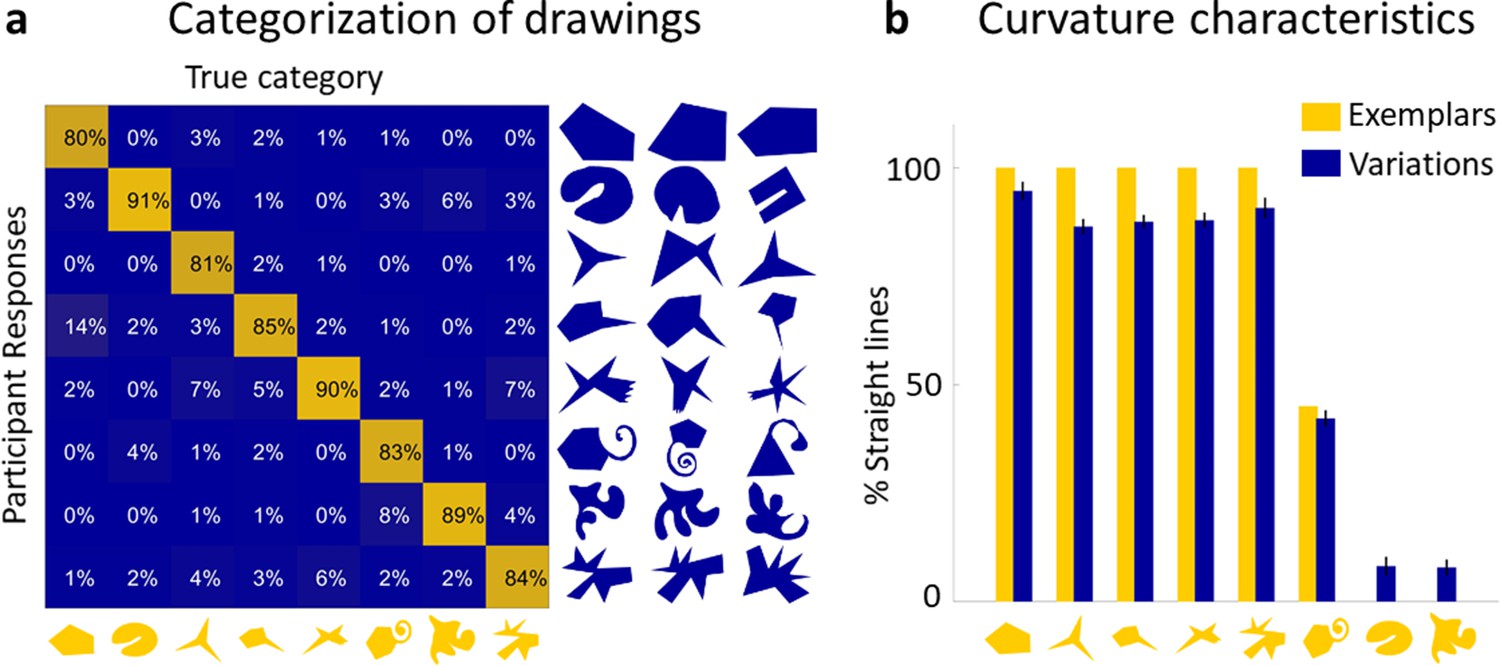
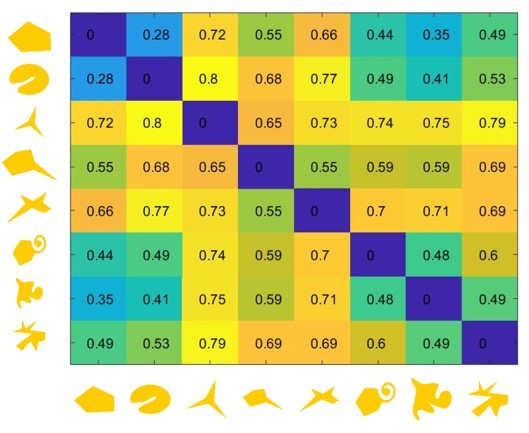
Drawings constitute a real perceptual category.
(a) The confusion matrix for true classes and participant responses shows that the vast majority of Variations were classified correctly. A subset of Variations that had to be categorized is shown on the right of the matrix with the Exemplars on the bottom. (b) Variations largely reproduce the global curvature characteristics of the Exemplar. Curvature similarity across Variations and their Exemplars: Exemplars (yellow) ordered by percentage of perimeter comprised of straight lines, together with average percentage of straight lines in all Variations of that category (blue). Error bars indicate standard error.
Figure 3 with 2 supplements

Variations and Exemplars of the same category share most of their parts.
(a) Aggregated mapping of correspondences for two categories, showing high agreement between participants about corresponding parts. Colours are explained in main text. (b) Comparison of percentage of correspondences seen within (blue) and across (green) categories, showing that significantly more correspondence was perceived within categories. Error bars indicate standard error.
Figure 3—figure supplement 1
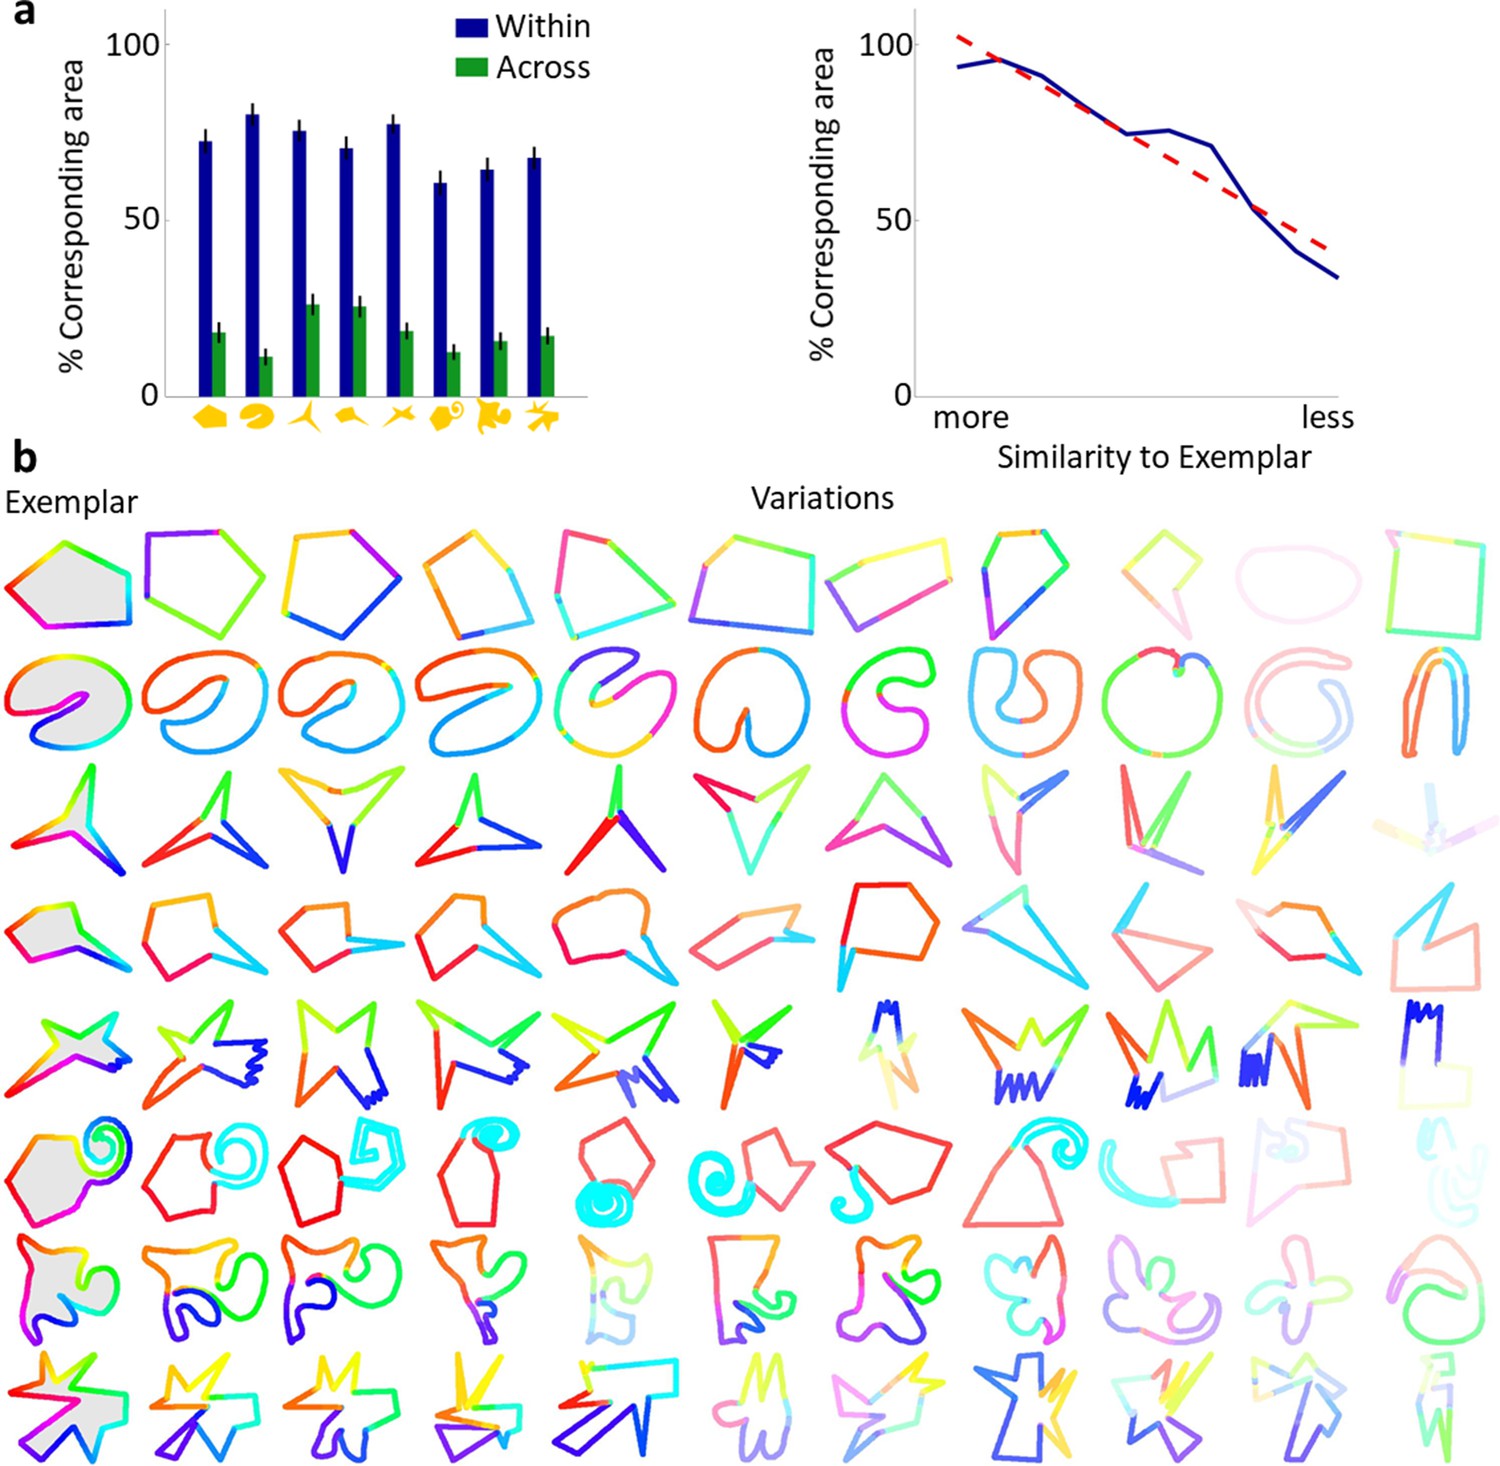
Correspondence data for whole subset.
(a) Left panel: mean area seen to correspond for each category’s Exemplar with Variations from other categories (green bars) and from the same category (blue), showing both the large difference in area corresponding within and across categories and that on average a large majority of each within-category shape pair was seen to correspond. Right panel: mean corresponding area as a function of similarity to the Exemplar (blue, linear regression model in red), showing that corresponding area decreases with decreasing similarity. (b) Correspondence mapping for each Exemplar and Variation used in Experiment 4. Variations are ordered from left to right by decreasing similarity to Exemplar (similarities from Experiment 2).
Figure 3—figure supplement 2
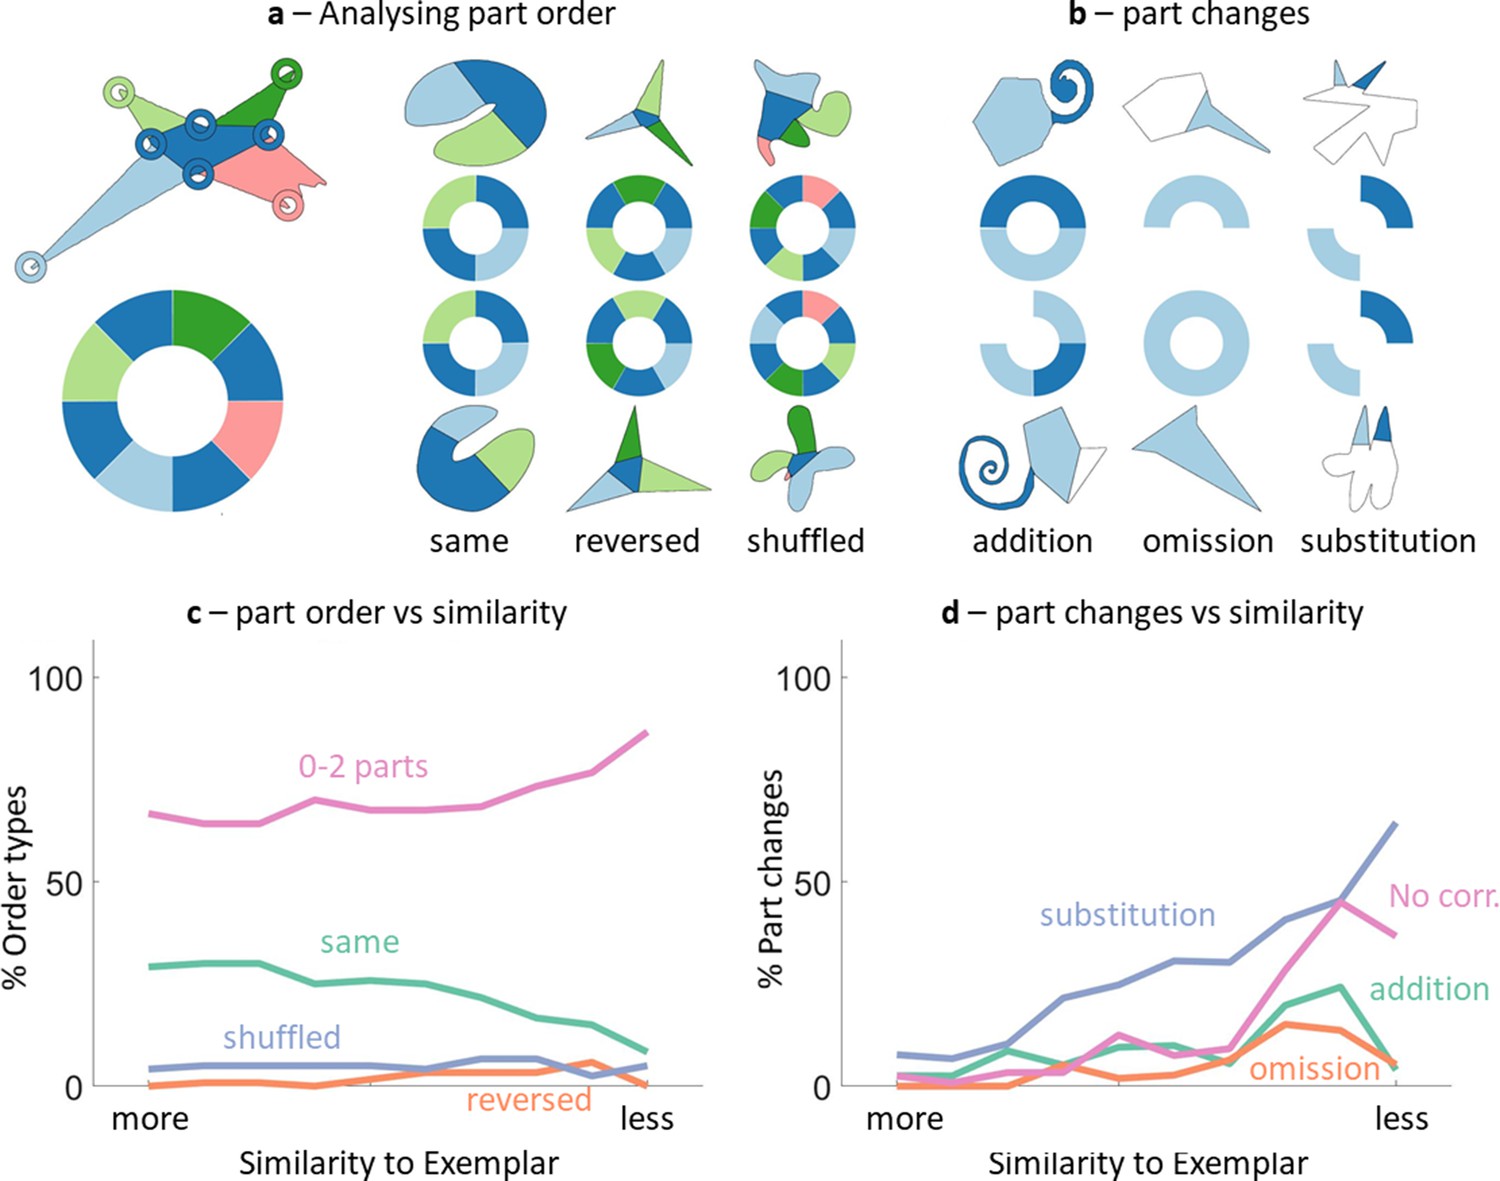
Analysing part order and part changes in the correspondence task (Experiment 4).
(a) Part order analysis and part order types. The left-most panel shows that part order was extracted by moving clockwise from the left-most point along the contour and creating a simplified ‘part circle’ below. Creating such a circle for each shape in a shape pair and comparing them allows to see whether part order was the same, reversed or shuffled, as shown columnwise here. (b) Part changes types. Part changes were defined by ‘gaps’ in the circle, that is, sections of the shape not seen to correspond. These resulted in additions (a gap existed in the Variation but not Exemplar), omissions (a gap existed in the Exemplar but not Variation), and substitutions (gaps occupied the same spot in the part order but were not seen to correspond). (c) Part order versus similarity. Percentages of part order types along with shapes not used in the analysis (pink line, includes all trials where 0–2 parts were seen to correspond and thus being insufficient to create an alterable part order) with respect to the similarity of the Variation to the Exemplar (as derived from Experiment 2), showing that most shapes with more than 2 corresponding parts had the same part order as the Exemplar. (d) Part changes versus similarity. Percentage of part order types, along with shapes with no correspondence (pink line), compared to similarity to the Exemplar, showing that substitutions were the most common part change, increasing with dissimilarity.
Figure 4 with 1 supplement

Observers agree on the most distinctive parts.
(a) Individual responses of all participants for an example Variation, showing which parts were marked as most distinctive (red), second most distinctive (orange), and third most distinctive (yellow). Aggregating these responses results in the shape on the right. The redder each point in the contour, the more distinctive it was evaluated across all participants. (b) Comparing aggregated responses between Exemplars and corresponding Variations (a subset shown here) suggests that in most categories similar parts (e.g., the indentation, spike or twirl) were identified as distinctive across most Variations.
Figure 4—figure supplement 1
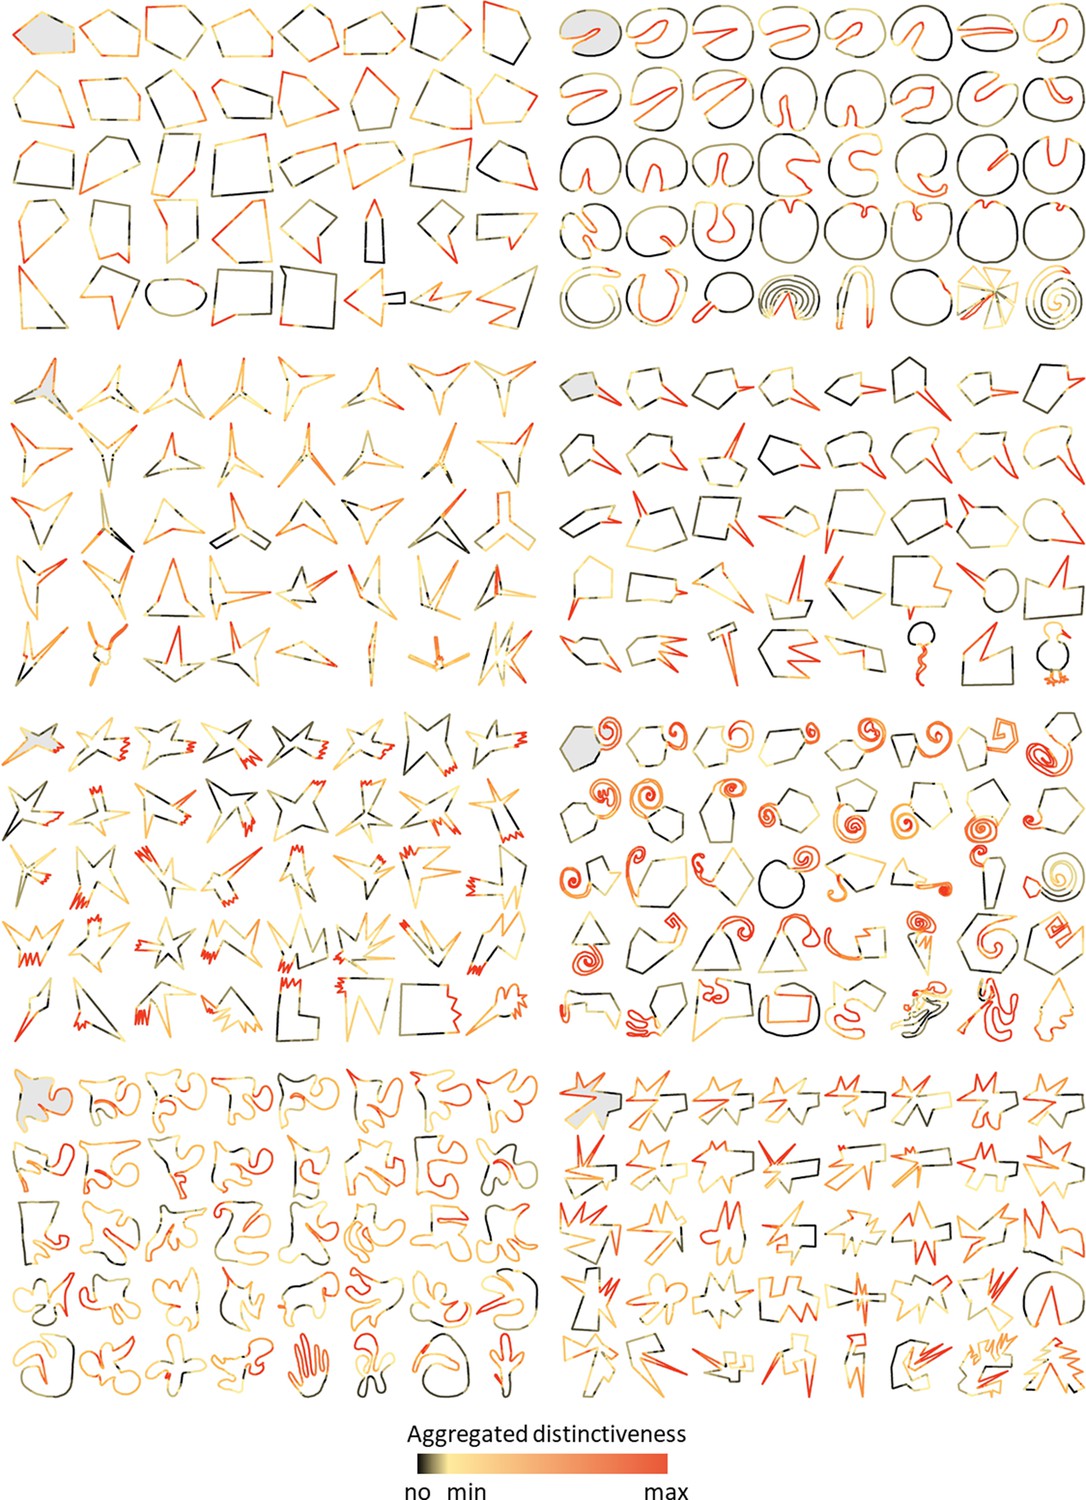
Aggregated distinctiveness scores for all shapes.
The first (top left) shape in each category is the Exemplar, with the following shapes representing all other drawings used in Experiment 5 in descending order of similarity to the respective Exemplar (similarity derived from Experiment 2). Distinctiveness is represented by colour of each point from black (completely indistinctive) through yellow and orange to red (highly distinctive), as shown at the bottom.
Figure 5
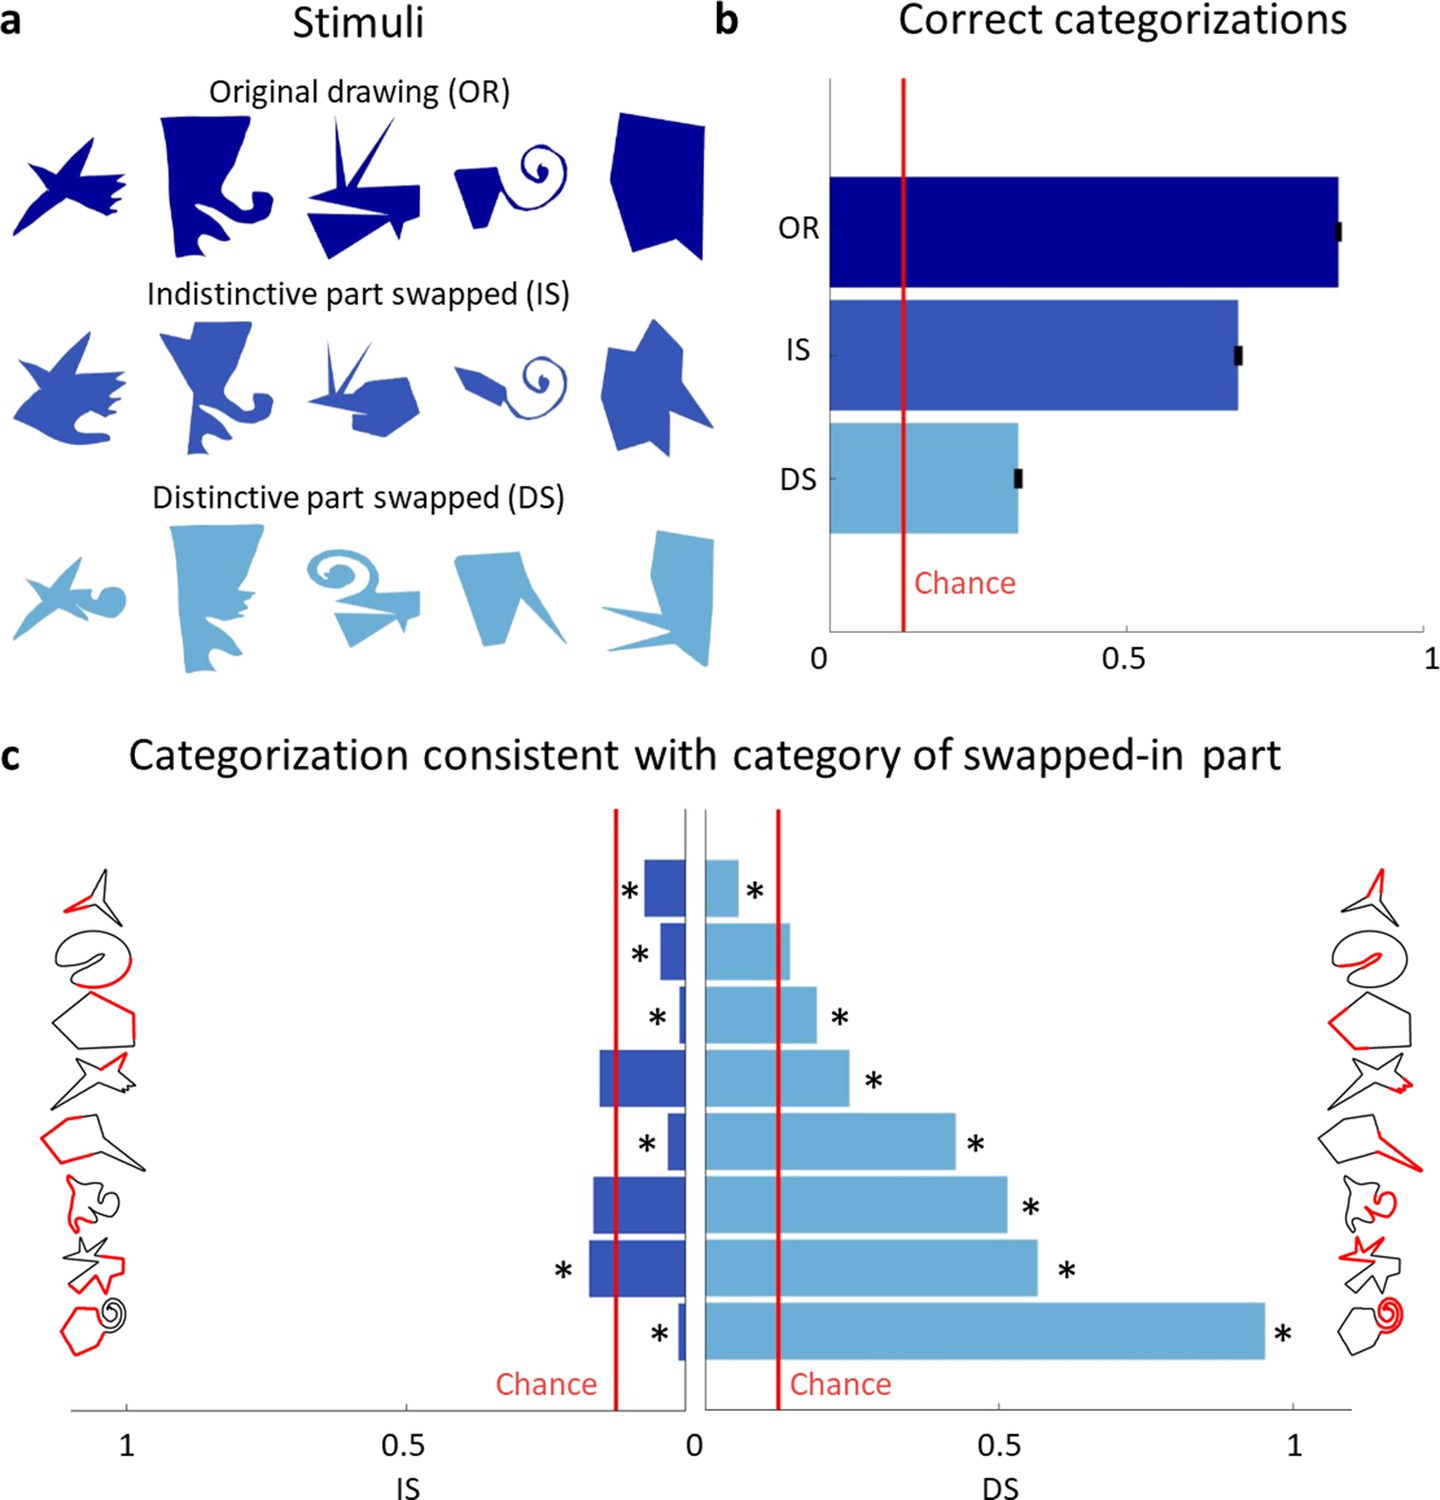
Distinctive parts are the main categorization cue.
(a) Original drawings (top row) were altered so that either the least distinctive part was swapped with the least distinctive part of a different category (second row) or the most distinctive part was swapped with the most distinctive part of another category (third row). (b) Comparison of the percentage of correct categorizations for the original shapes (from Experiment 2), swapped indistinctive parts and swapped distinctive parts (error bars indicate standard errors). (c) Bar plots showing how often the category of the swapped-in part determined the categorization choice. The indistinctive (left) and distinctive (right) parts are shown in red on the shapes’ silhouette. Bars significantly different from chance (p < 0.01) are marked with an asterisk.
Figure 6

Examples of proposed strategies used by participants.
Selected examples representing part-based strategies like warp, shuffle, and other strategies, both successful (i.e., shapes were correctly classified almost all the time) and unsuccessful strategies (i.e., shapes were correctly classified far below average).
Figure 7

Proposed steps of shape creation using a predominantly part-based approach.
After analyzing shape features and identifying distinctive parts, the individual parts get transformed and re-assembled to form a new shape. In the transformation process, distinctive parts are changed to a lesser extent than other, non-distinctive parts. The creation of a new shape from the individual parts might involve adding, merging, or removing parts, as well as changing their order. Note that this is an illustration of only one strategy (albeit an important one); however, Variations might also be created using non-part-based strategies, where other features such as curvature are varied.
Author response image 1
Additional files
Download links
A two-part list of links to download the article, or parts of the article, in various formats.
Downloads (link to download the article as PDF)
Open citations (links to open the citations from this article in various online reference manager services)
Cite this article (links to download the citations from this article in formats compatible with various reference manager tools)
One-shot generalization in humans revealed through a drawing task
eLife 11:e75485.
https://doi.org/10.7554/eLife.75485


