The Candida albicans virulence factor candidalysin polymerizes in solution to form membrane pores and damage epithelial cells
- Department of Biochemistry & Cellular and Molecular Biology, University of Tennessee, United States
- Department of Physics and Astronomy, University of Missouri, United States
- Department of Chemistry, University of Tennessee, United States
- Department of Biochemistry, University of Missouri, United States
- Electron Microscopy Core, University of Missouri, United States
Figures
Figure 1 with 2 supplements
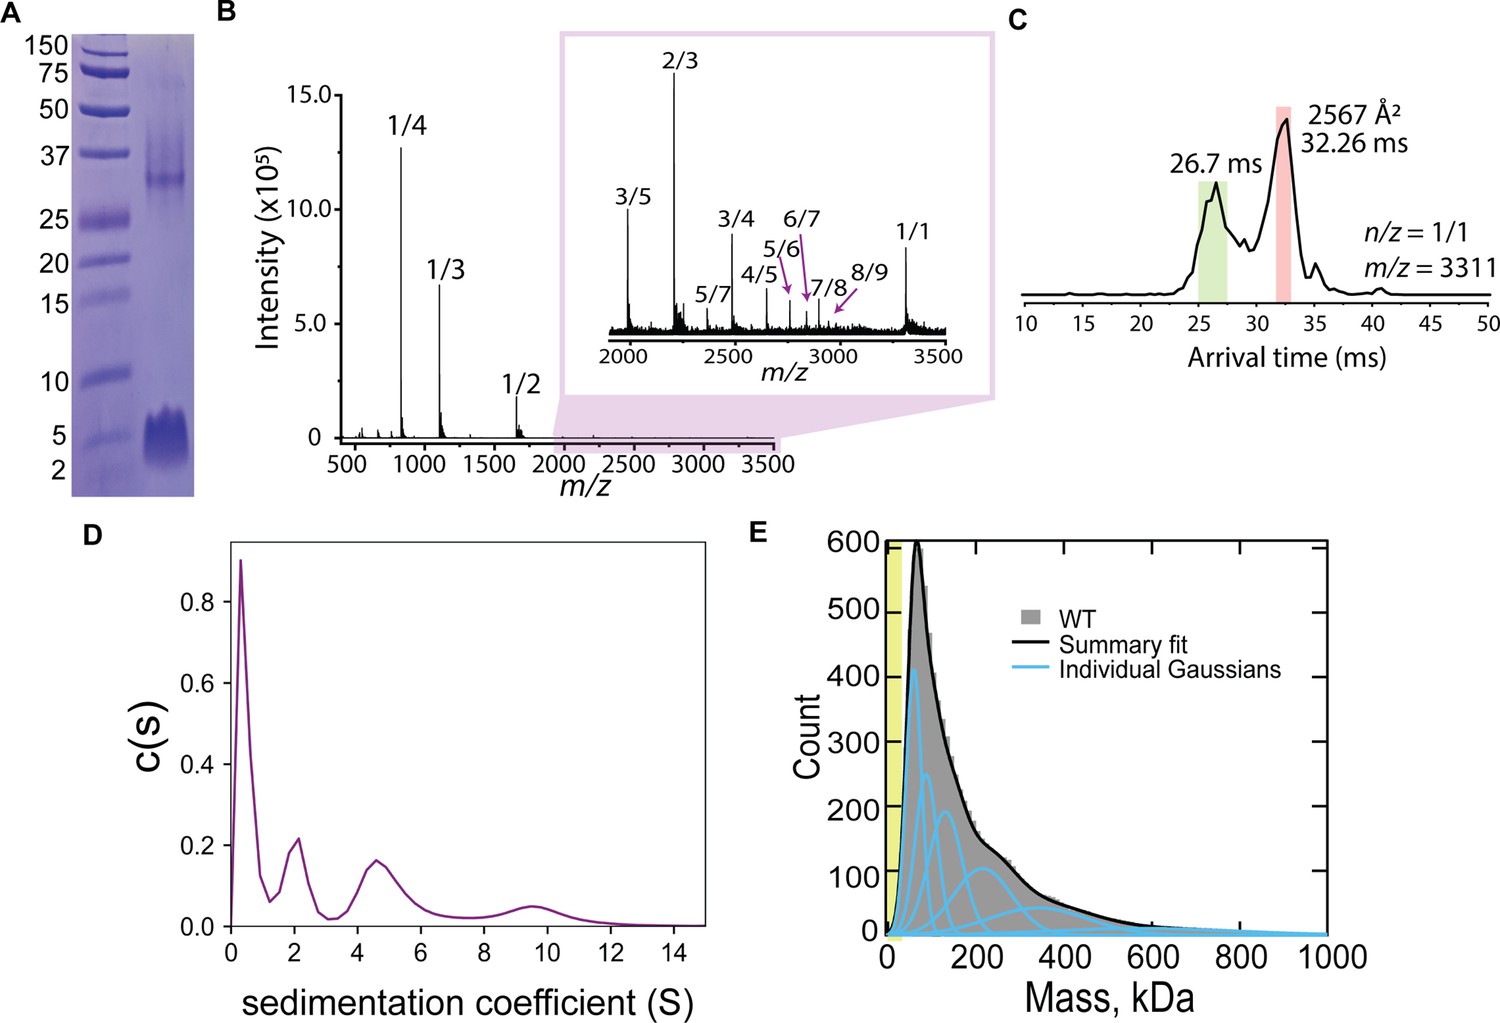
CL forms complex assemblies in solution.
(A) SDS-PAGE of CL shows a~4 kDa monomeric band, and a band corresponding to a large oligomer. Molecular weight markers are shown on the left. (B) IM-MS mass spectrum of CL annotated with oligomer-to-charge (n/z) ratios. The inset spectrum reveals oligomers that are not immediately identifiable in the top spectrum. (C) Arrival time distribution of the 8-mer (n/z=1/1) species. This peak was more populated than those corresponding to smaller oligomers, which might result from decomposition of the 8-mer in the gas phase. The experimental collisional cross section for the single 8-mer (highlighted in salmon) is given. (D) Analytical ultracentrifugation data identifies populations of increasingly larger CL oligomers. (E) Mass photometry data of CL oligomeric species. The green area marks the approximate mass range (<50 kDa) below the resolution of the technique. Data distribution was best fit with six Gaussian populations (shown as blue lines, and summary fit is the black line). The mass of the peaks agree with the expected mass for 2, 3, 4, 8, 13, and 22 CL 8-mers (similar to a Fibonacci sequence).
-
Figure 1—source data 1
Original SDS-PAGE gel corresponding to Figure 1A.
- https://cdn.elifesciences.org/articles/75490/elife-75490-fig1-data1-v1.zip
-
Figure 1—source data 2
Raw mass photometry data corresponding to Figure 1E.
- https://cdn.elifesciences.org/articles/75490/elife-75490-fig1-data2-v1.zip
Figure 1—figure supplement 1
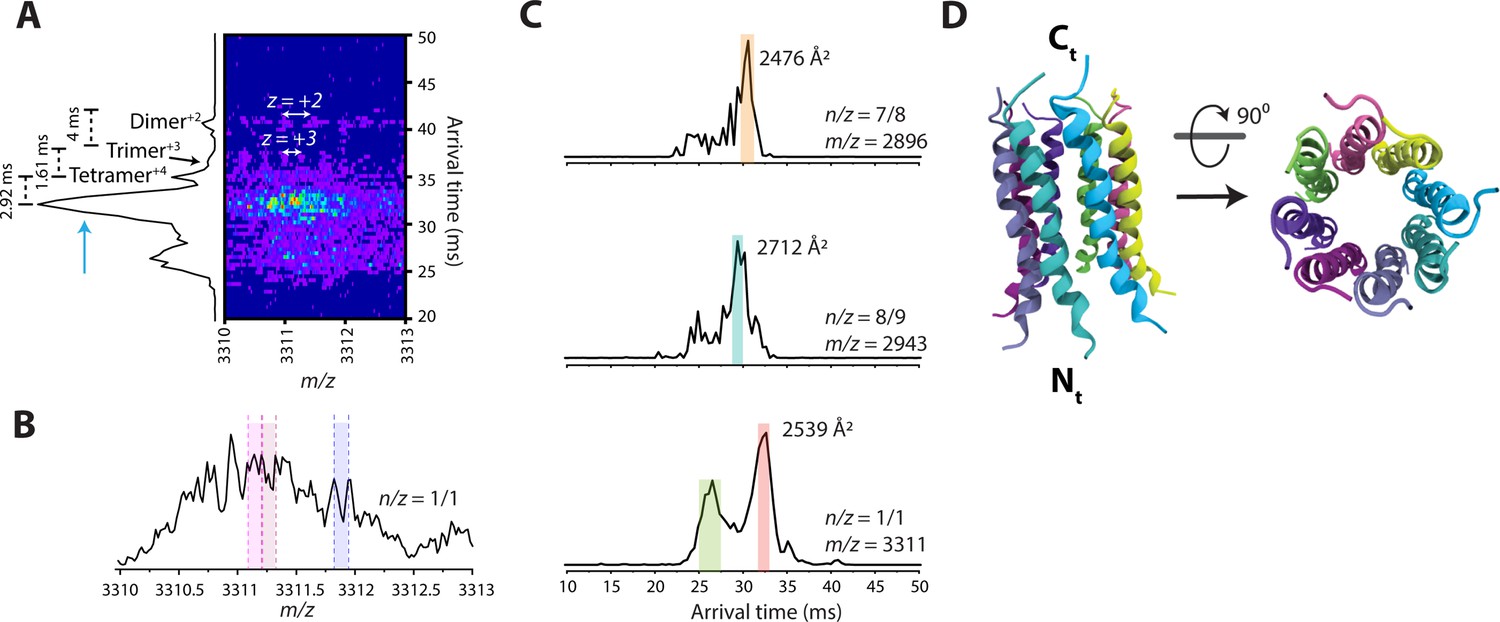
IM-MS results.
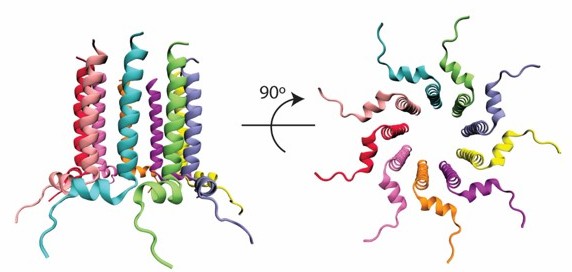
(A) The 2D-ion mobility plot and corresponding arrival time distribution of m/z 3311. It is unambiguous from the isotope spacings that the peaks represent multiple very high charge state species. Our instrument can routinely discern up to z = +6 within the ion mobility plot, but in this case, the spacing of the most abundant species is too small to be resolved. The trimer is largest species with a resolved isotopic spacing as shown in panel A. We conservatively assigned the feature next to the trimer as a tetramer. Note that the difference in arrival time of the features decrease from the dimer to the trimer (4ms), and the trimer to the tetramer (1.61ms). One would expect the arrival time difference between the tetramer and a pentamer to be smaller than 1.61ms, since the contribution of one monomeric unit decreases as the oligomeric assembly grows. However, the difference in arrival time of the tetramer to the most intense feature is 2.92ms, which allows us to deduce that this feature must be a large oligomer (n>5). (B) Mass spectral peak of m/z 3311. Spacing that roughly correlates to z = +8 are highlighted within the spectrum. This leads us to believe that the previously unknown feature (blue arrow) in panel A is that of an octamer with z = +8. (C) Comparison of arrival time distributions of higher-order Candidalysin oligomers. For m/z 3311, the collisional cross section for the feature highlighted in red is calculated under the assumption that this feature is an octamer. We note that the species at n/z=7/8 and 8/9 exhibit faster arrival times compared to the putative n/z=8/8. This follows the expectant logic since n/z=8/9 has a higher charge state than n/z=8/8, and thus traverses the drift cell faster. On the other hand, n/z=7/8 has the same charge state as n/z=8/8, but is a smaller oligomer, which results in a shorter arrival time. (D) Atomistic model of the CL 8-mer, with a molecular weight of 26.5 kDa. Each monomer helix is colored differently, and the C- and N-termini are marked.
Figure 1—figure supplement 2
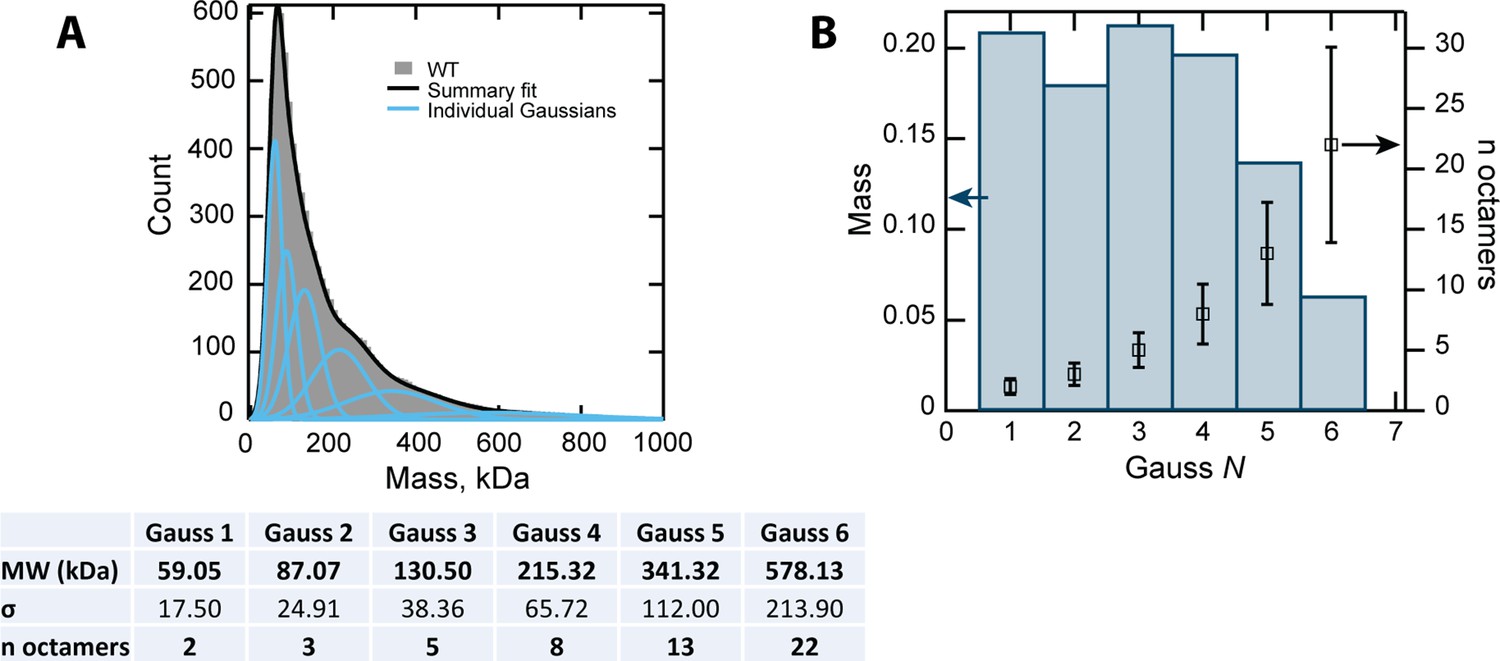
Deconvolution of MP data.
(A) Gaussian fitting of the MP data of CL WT. The table shows the fitting parameters and the resulting errors. BIC (Bayesian information criterion) analysis was used to determine the optimal number of Gaussian terms for the fitting. (B) The relative mass of the six Gaussian components shows that the first peaks, corresponding to two, three, five and eight 8-mers, are the most abundant species, and are similarly populated.
Figure 2 with 3 supplements
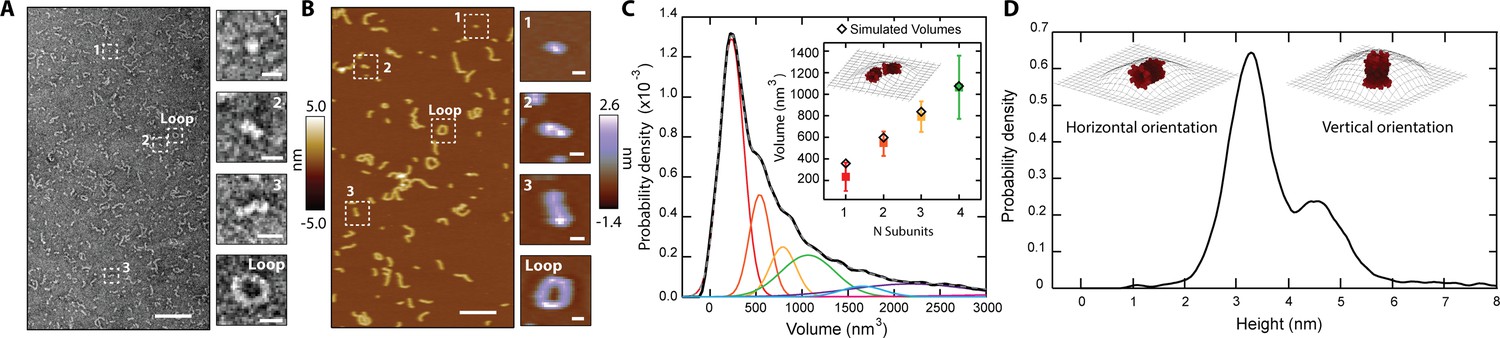
CL in solution forms progressively longer linear polymers and loops.
(A) TEM reveals CL polymerization; scale bar = 100 nm. Features of growing complexity are magnified in the side panels; scale bar = 10 nm. (B) AFM imaging in fluid shows overall agreement with TEM data; scale bar = 100 nm. Four similar CL features are also highlighted in the side panels; scale bar = 10 nm. (C) Smoothed volume histogram of N=7838 individual features (solid black line) fitted with Gaussian distributions (solid colored lines, summary fit is the gray dashed line). The inset compares the experimental volume of the first four peaks (squares colored as in panel C) with simulated volumes (black diamonds) calculated from N 8-mers. The cartoon shows an example of head-to-toe assembly of two 8-mers. Error bars for the peak positions represent the standard deviation. (D) When the height of the individual features was measured, it yielded a bimodal distribution, with heights of 3.2 nm and 4.6 nm. The insets show the two proposed orientations of the 8-mer. The topographic surface is overlaid to show convolution of the AFM tip.
Figure 2—figure supplement 1

Persistence length of CL polymers.
(A) AFM images of CL in solution yield a persistence length, Lp, of 9±2 nm. The value was calculated from a fit (solid line, coefficient of determination = 0.87) to the mean square end-to-end distance of N=100 polymers. (B) An identical value of Lp (within uncertainty of the analysis) was obtained by calculating the decay of tangent-tangent correlations. I9A in solution yielded a persistence length, Lp, of 13±2 nm. The value was calculated from the exponential decay (solid line) of tangent-tangent correlations of N=100 polymers. Inset: The angle q is defined by polymer segments separated by a distance l along the contour of the polypeptide.
Figure 2—figure supplement 2
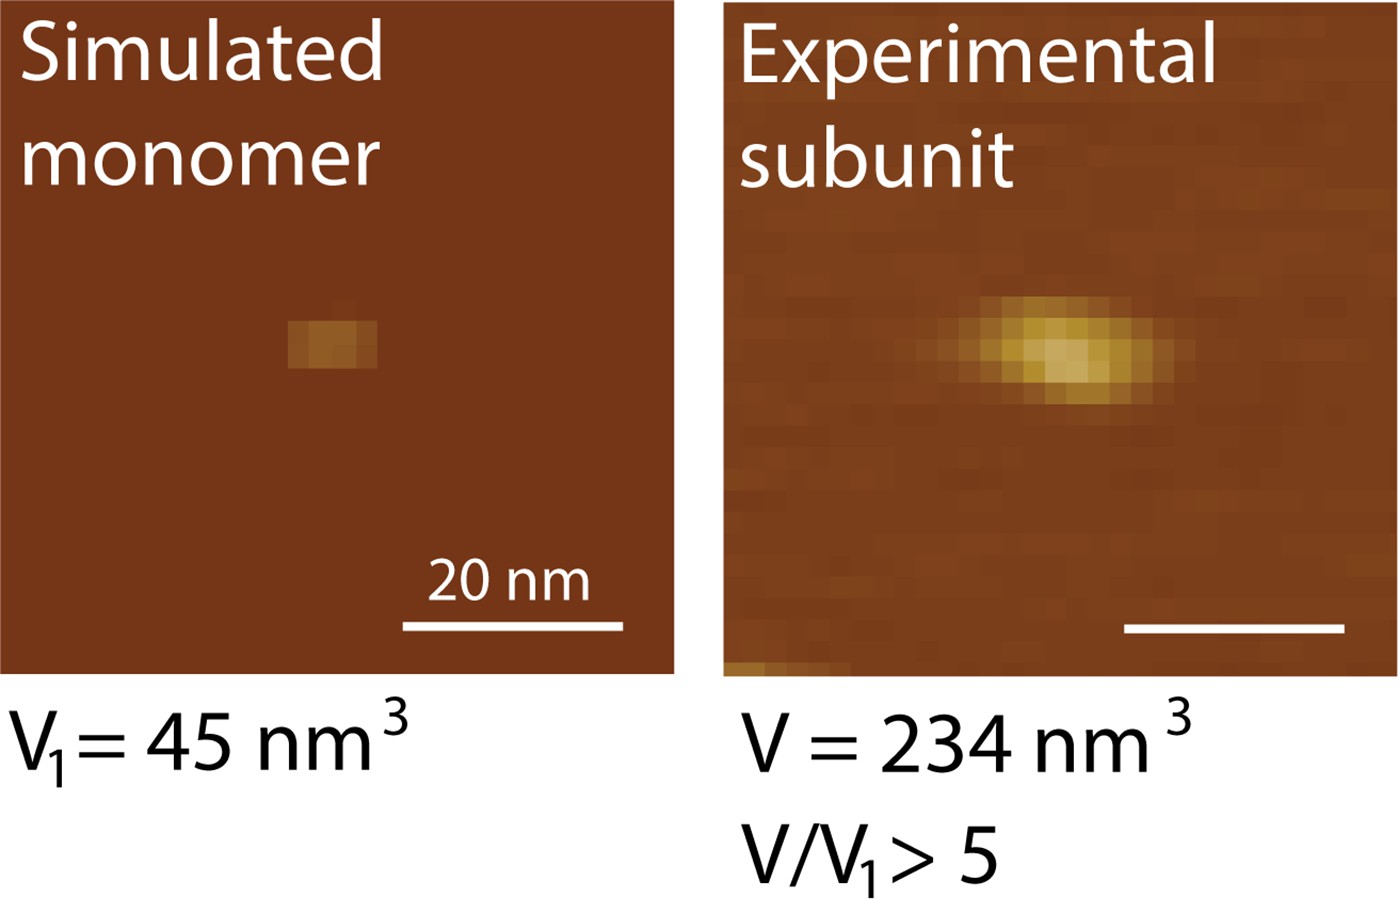
Simulated monomer versus experimental subunit.
AFM volume analysis indicates that the subunit observed to consitute the polymer seed is significantly larger than a peptide monomer. Based on comparison between simulated and experimental data, the primary subunit volume peak is at least a pentamer, but probably larger due to tip deconvolution.
Figure 2—figure supplement 3
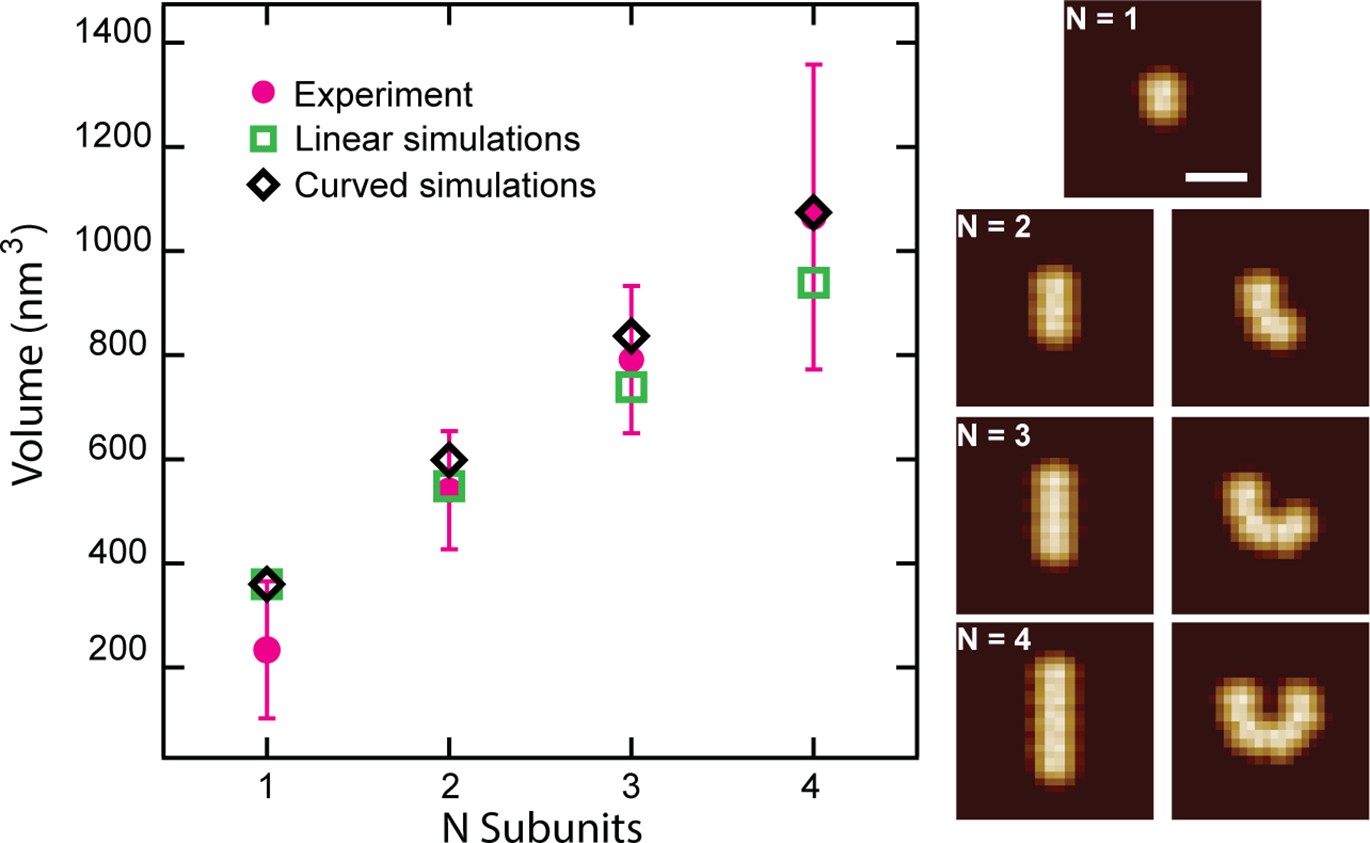
Simulated CL polymer volumes are comparable to experimental volumes.
Comparison of N 8-mer subunits in the side orientation arranged either linearly or with an added curvature (Scale bar = 15 nm). Volumes are plotted for each particle showing larger volumes for curved polymers. Error bars for the peak positions represent the standard deviation.
Figure 3 with 3 supplements
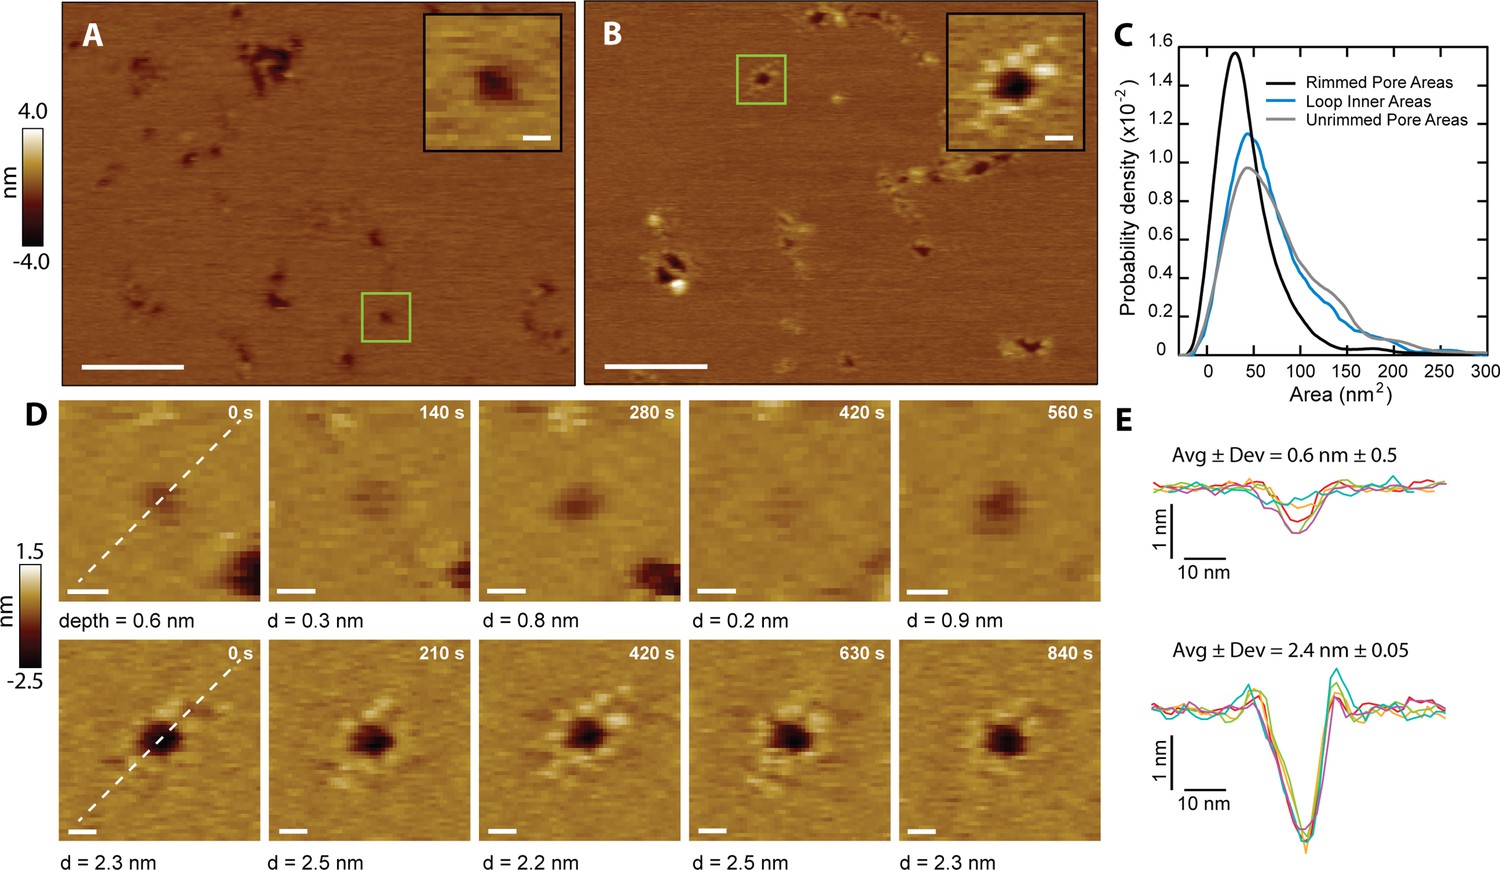
CL forms two types of membrane pores.
Representative images showing predominantly unrimmed (A) and rimmed (B) pore features in supported DOPC membranes; scale bars = 100 nm. The insets show zoomed views of green boxed features; scale bars = 10 nm. (C) Area histograms show that unrimmed pores (gray line) display a broad peak at 41±25 nm2 (mean ± S.D.) with a shoulder at ~130 nm2, similar to loops found in solution (38±21 nm2, aqua blue line). In contrast, the rimmed pores (black line) exhibit a narrower distribution with a smaller area (26±19 nm2) (Nunrimmed pores = 1468, Nrimmed pores = 492, Nloops = 261). (D) Unrimmed (top) and rimmed (bottom) features were imaged over several minutes; scale bars = 10 nm. (E) Line scans, marked as white lines in the previous panel, show the dynamics of the pore profile in both cases. Different colors were used for each image. The average depth (Avg) and relative deviation (Dev), defined as the standard deviation of the depth divided by Avg, are listed.
Figure 3—figure supplement 1
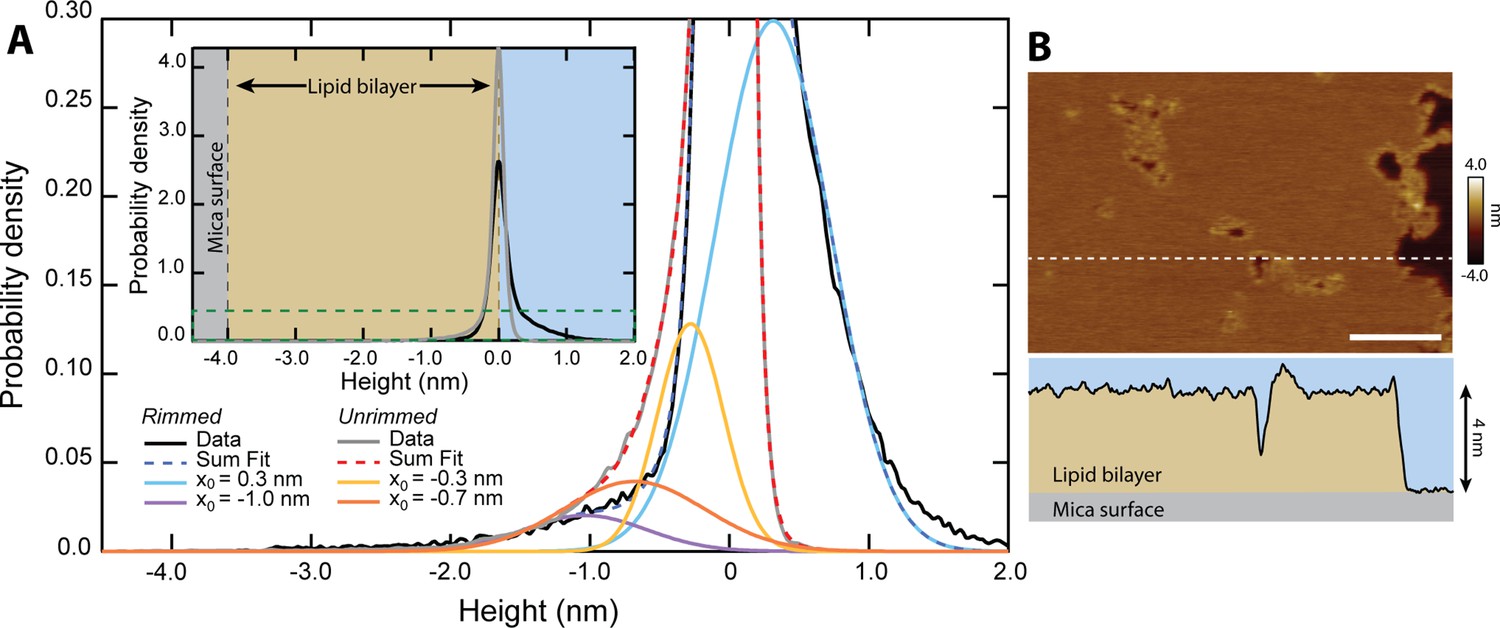
Quantification of pore depth.
(A) Inset shows the height distribution of all pixels for N=313 unrimmed pores (gray, n=153,832 pixels) and N=193 rimmed pores (black, n=114,996 pixels). Zero height represents the top of the upper leaflet of the lipid bilayer. The main graph is rescaled to show the area encompassed by the dark green dashed line. Multiple Gaussians are fitted to the histograms to deconvolve the different populations. Both unrimmed and rimmed pores had populations that deviated from the background (~0 nm), which are plotted in addition to the summary fits. The unrimmed pores show two distinct depths, –0.7±0.5 nm and –0.3±0.2 nm (mean ± σ.) The rimmed pores have a single population lower than the background, located at –1.0±0.4 nm. Additionally, a positive population is located at +0.3 ± 0.4 nm, corresponding to the topographically high rims. (B) A line scan (white dashed line) across an image of rimmed pores demonstrates the 4 nm depth of the DOPC bilayer in profile; scale bar = 100 nm.
Figure 3—figure supplement 2
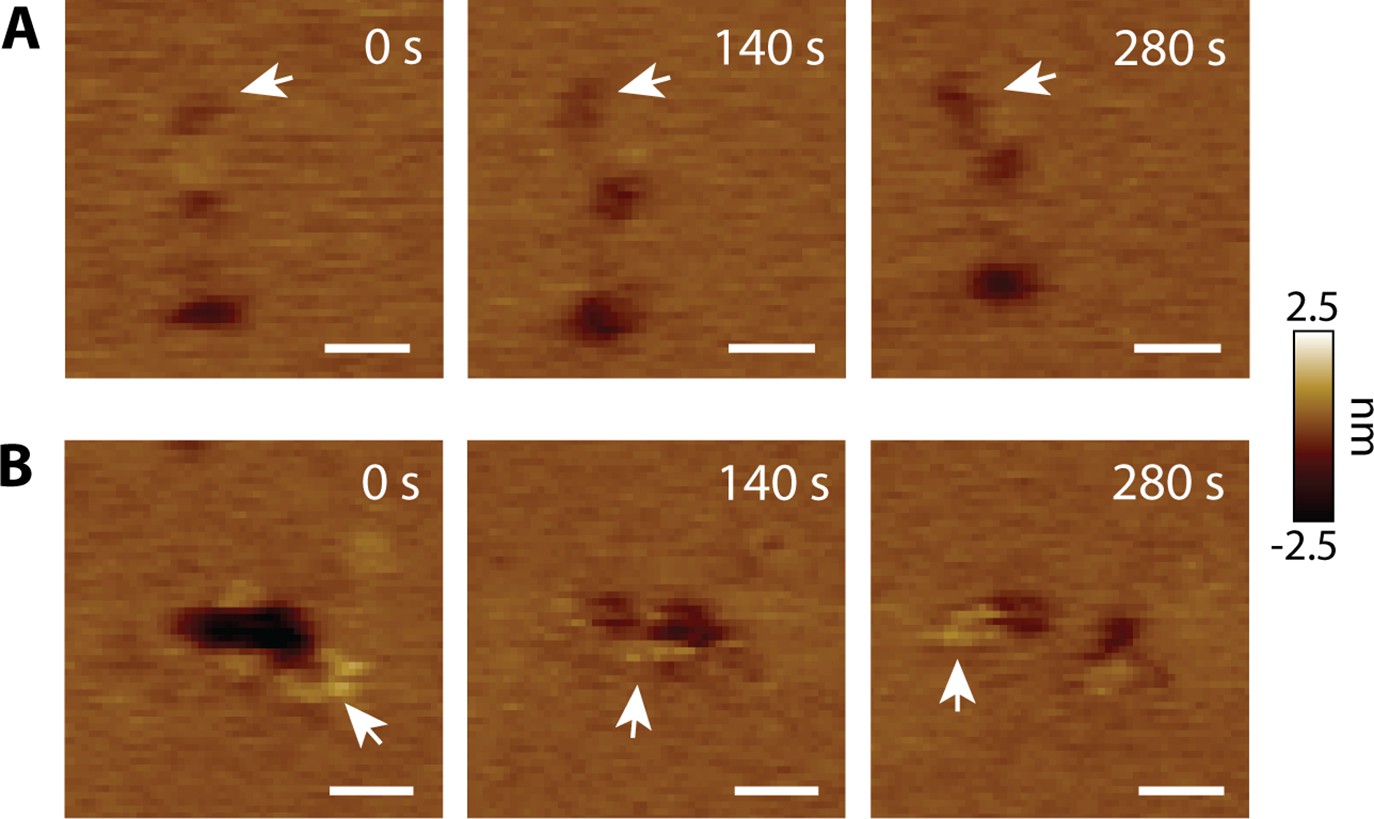
CL pores exhibit lateral dynamics in the AFM supported membrane.
(A) Lateral diffusion of an unrimmed pore (arrows). (B) A void forms two pores. The arrows highlight positive features; scale bars = 20 nm.
Figure 3—figure supplement 3
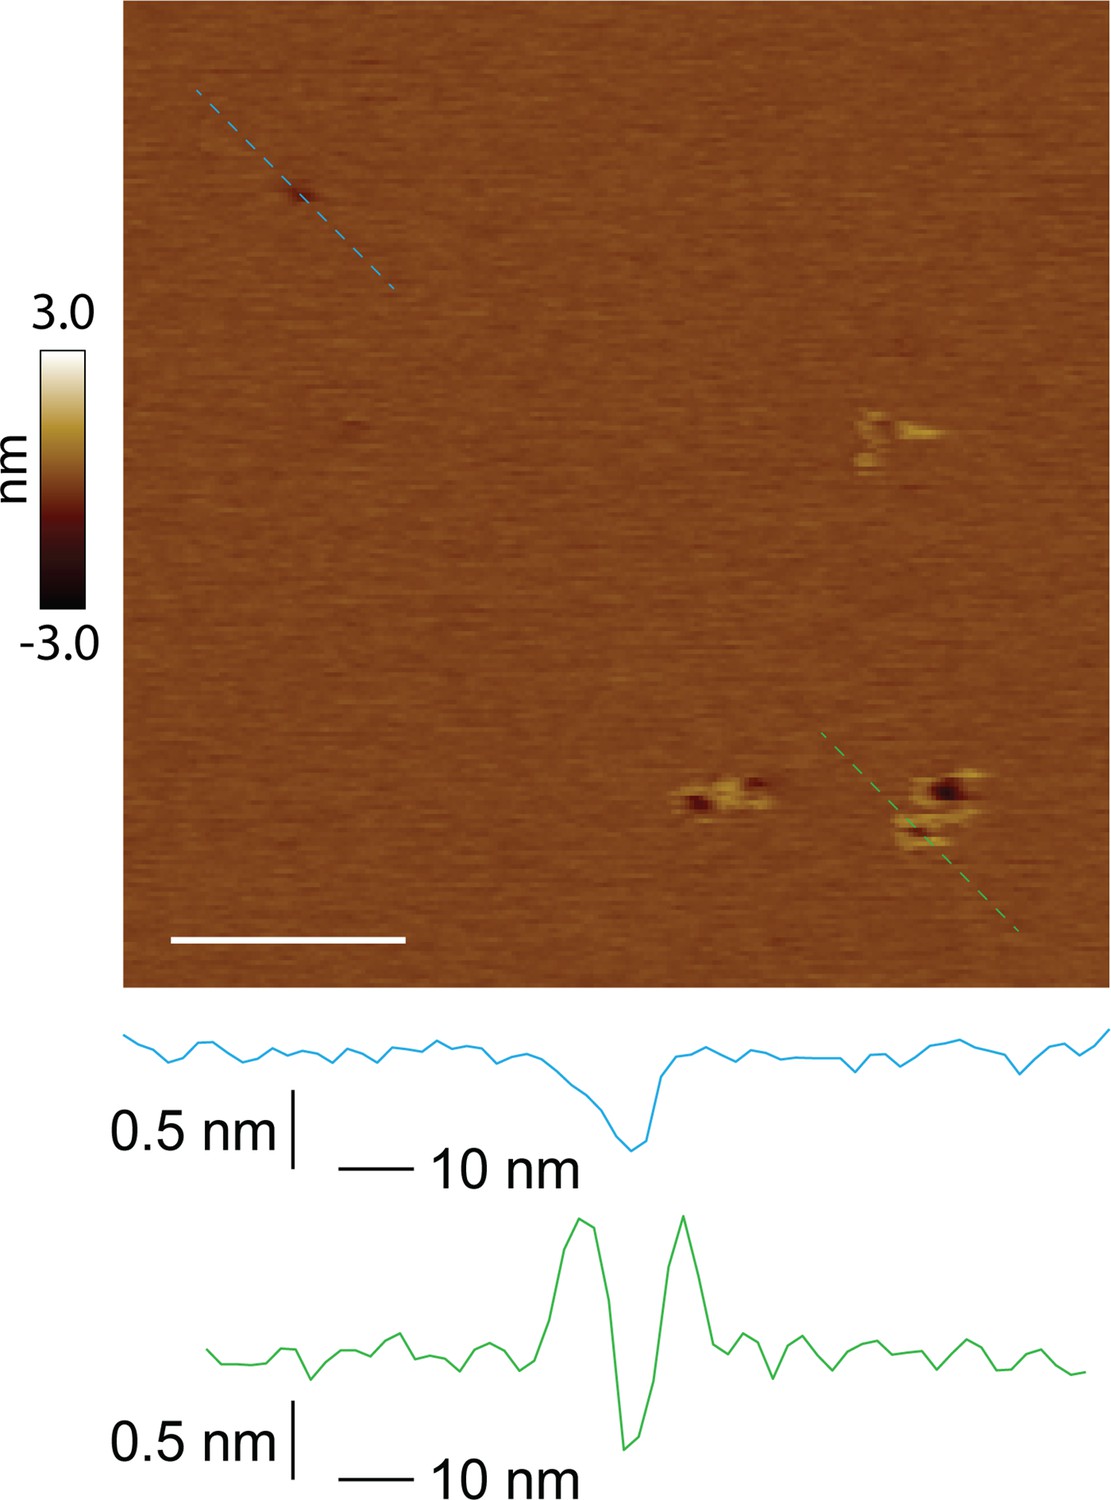
Unrimmed and rimmed pores locally coexist in the membrane.
Both unrimmed and rimmed pore species present in the same image; scale bar = 100 nm. Two pores of similar size are shown in line scan profile (unrimmed in blue, rimmed in green).
Figure 4 with 1 supplement
CL polymers and loops insert into membranes.
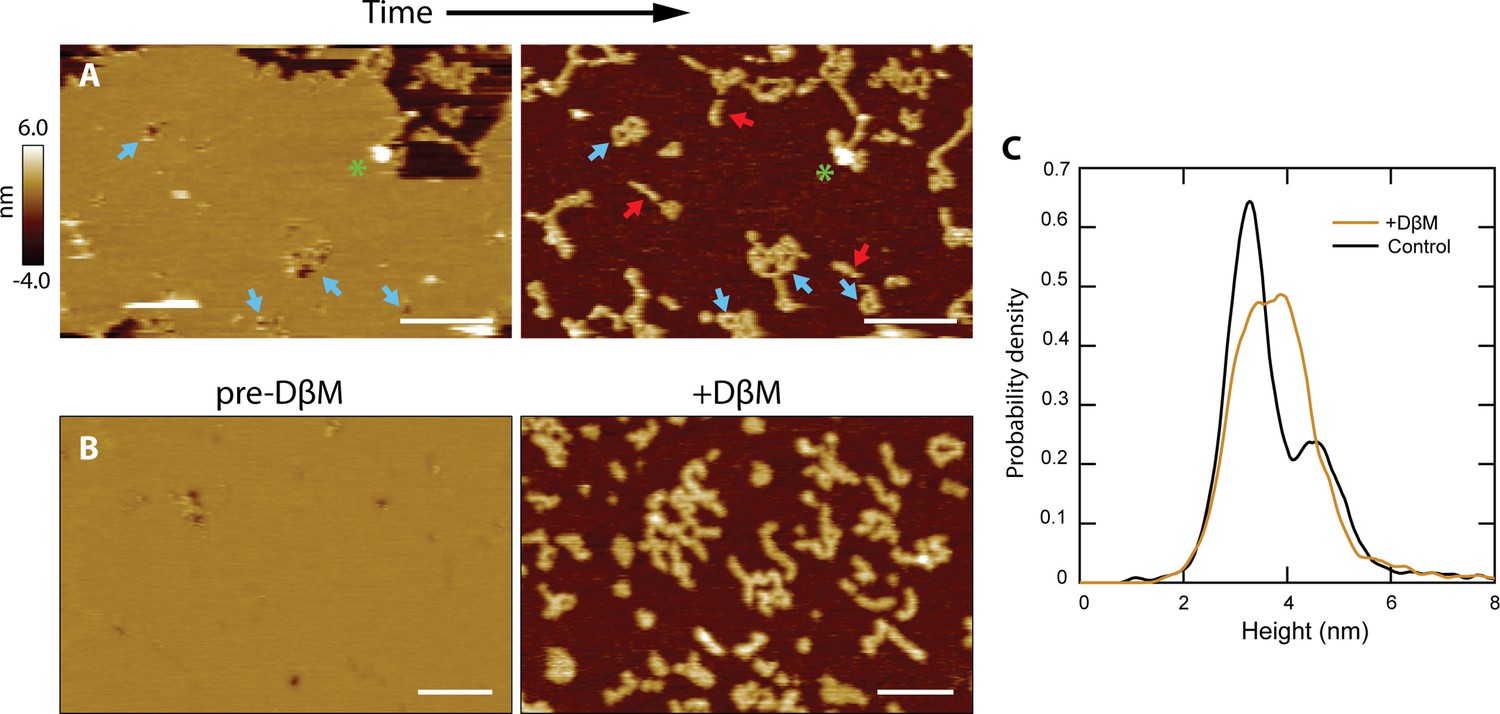
(A) Lipid patches exhibiting pore-like features occasionally dissociated from the mica surface, revealing underlying structures similar to CL polymers in solution [see Figure 2B]; scale bars = 200 nm. Blue arrows indicate pore features and corresponding polymer loops/tangles. Linear features were revealed that were not previously observed when lipid was present (red arrows). A green asterisk draws attention to a tall positive feature that remains in both images, serving as a reference. (B) Detergent was used to forcibly remove lipid bilayers. The addition of DβM followed by rinsing revealed underlying CL structures. Scale bars = 100 nm. (C) A histogram of particle heights compares data of CL adsorbed in solution (black, N=7838) to the features remaining after addition of DβM to the CL +DOPC system (gold, N=8170). The control results were bimodal, indicating two overall 8-mer orientations. The features left after detergent removal of the membrane exhibited a broad peak roughly encapsulating both of the solution peaks.
Figure 4—figure supplement 1
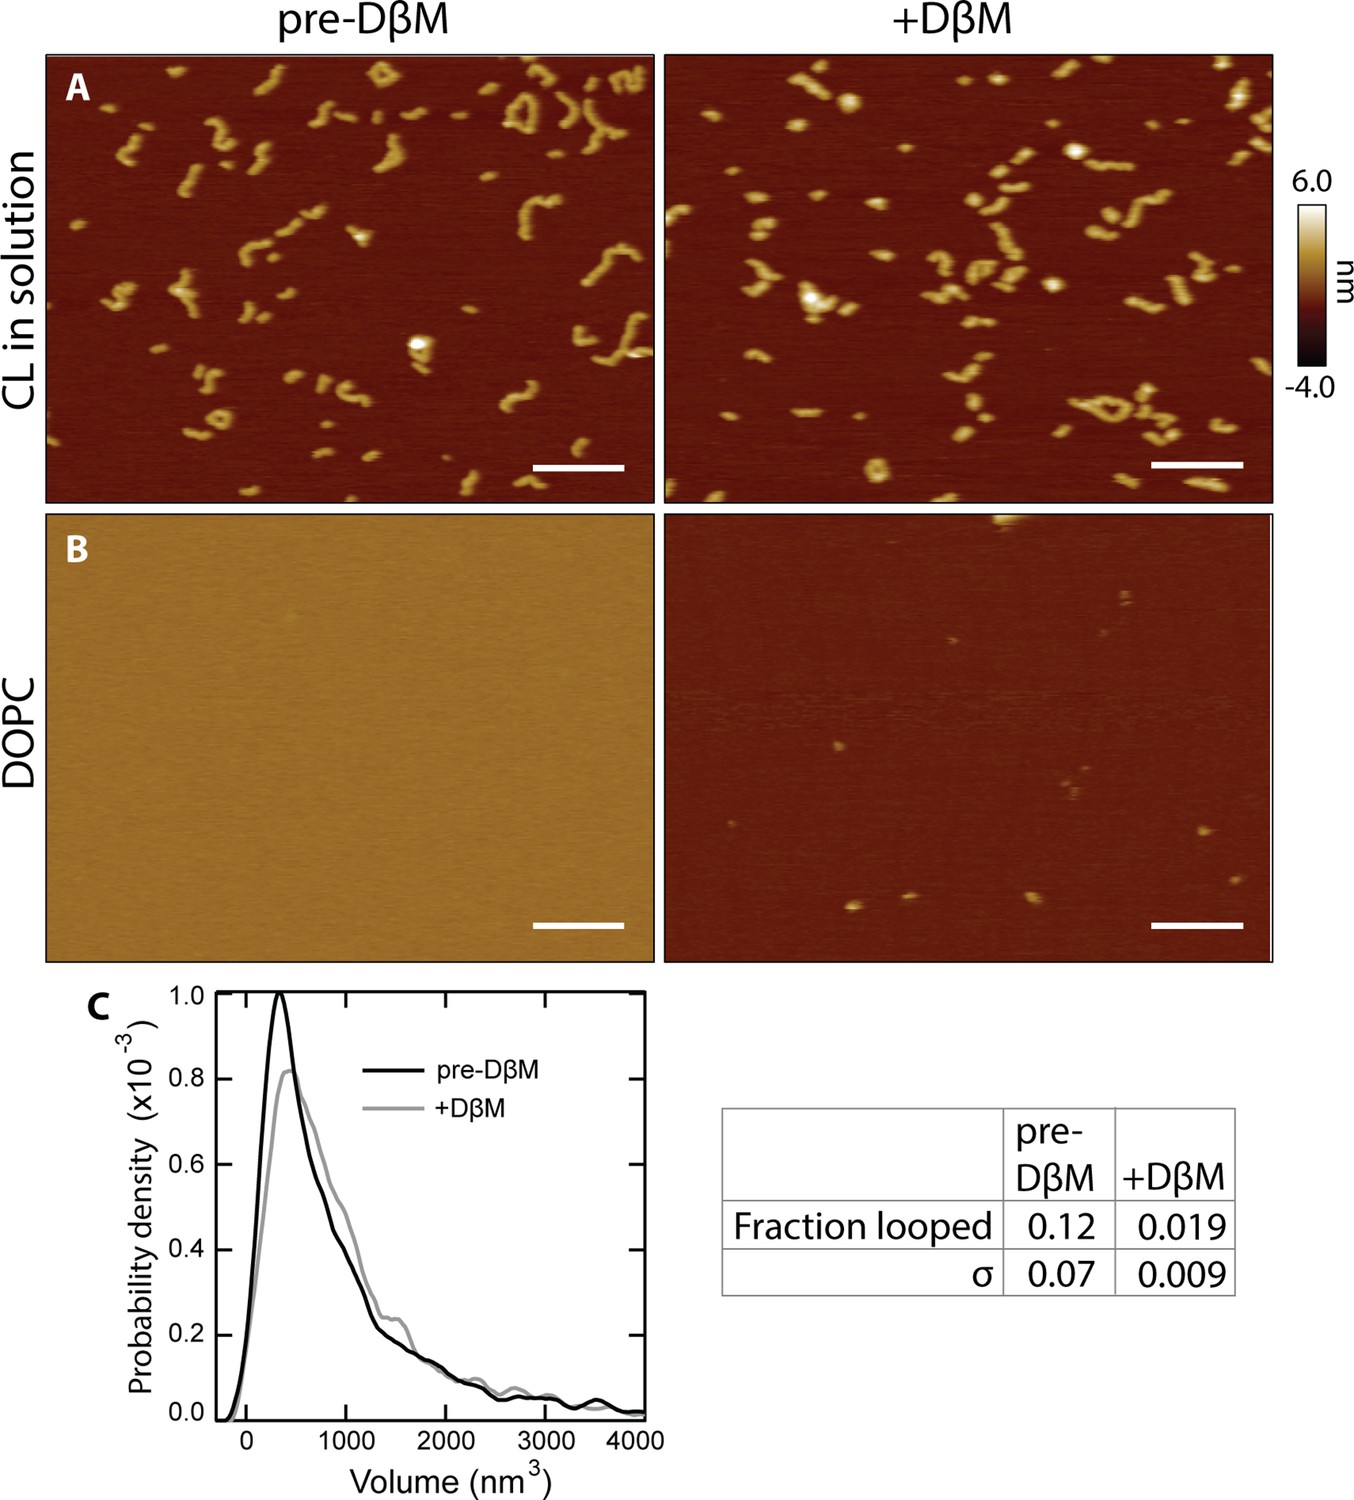
Detergent effect on bare lipid and CL on a surface.
(A) Adding DβM to CL in solution (i.e. in the absence of lipid) induces no drastic change in CL polymers, which remain adhered to the mica surface (scale bars = 100 nm). (B) DβM added to bare DOPC bilayers removes the bilayer with a small amount of residual lipid left behind on the mica surface. (C) A volume histogram of CL after DβM addition (gray) shows a slight increase in size of the features compared to the CL in solution data (black), likely attributable to occasional detergent molecules binding to CL. The fraction of looped features before and after the addition of DβM are shown in the table on the right (σ=standard deviation, 3 experiments).
Figure 5 with 1 supplement
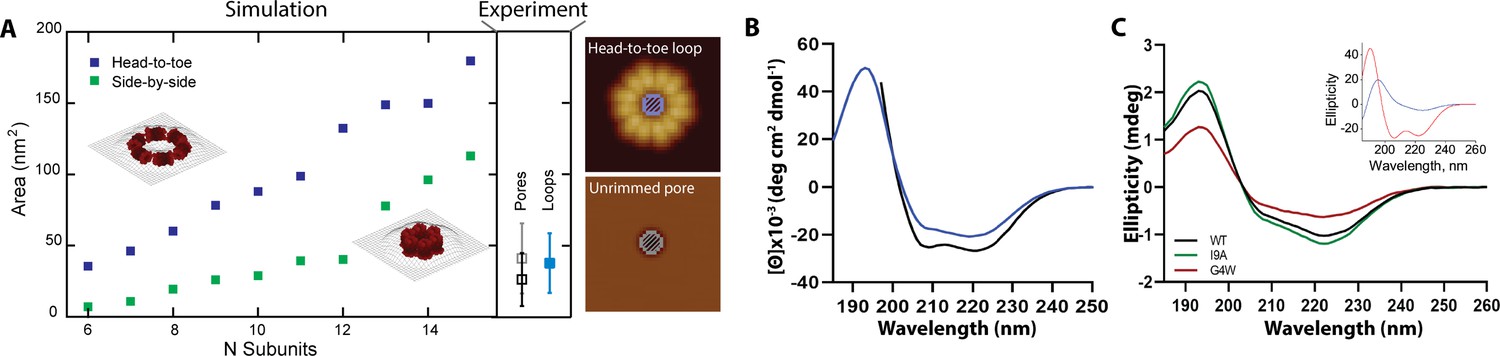
Rimmed pores appear upon a conformational rearrangement.
(A) CL pores were simulated using two possible arrangements of the 8-mer subunit, side-by-side (green) and head-to-toe (dark blue). The particle area is plotted versus the number of subunits. The insets show simulations for N=6 in both orientations. Closed loops with less subunits were not geometrically feasible. The side panel shows the experimental areas for unrimmed pores (gray symbol), rimmed pores (black), and the loops found in solution (aqua blue); error bars represent standard deviation. A cartoon depicts which measurements are being compared, the inner loop area (top) and the pore area (bottom). (B) Standard circular dichroism (CD) of CL in buffer (blue) and in the presence of lipid vesicles (black). (C) OCD data in supported membranes for CL WT (black), I9A (green), and G4W (red). The inset shows theoretical OCD curves for a TM helix (blue) or an α-helix aligned parallel to the membrane plane (red).
Figure 5—figure supplement 1
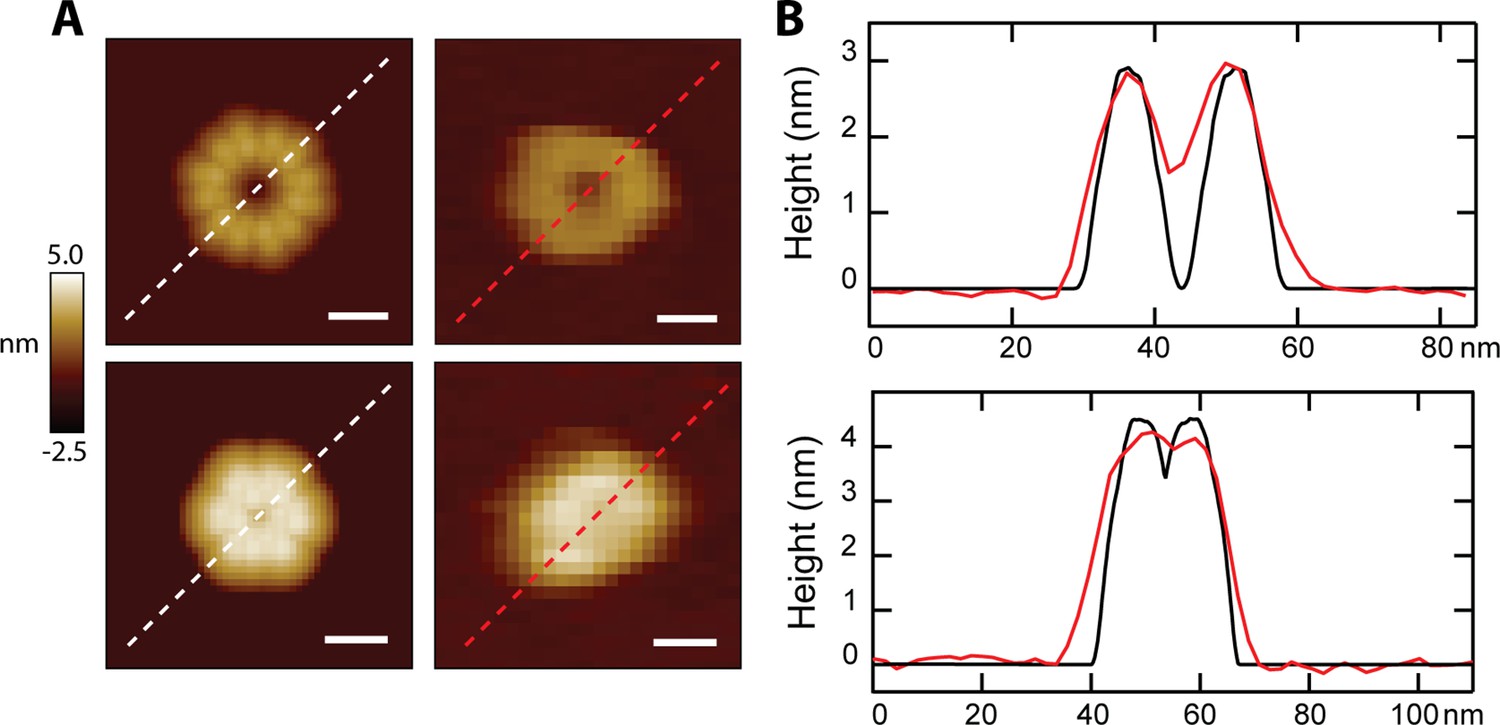
Direct comparison of simulated loops with AFM data.
(A) Simulated images of loops formed by six 8-mers are shown side-by-side with experimental data compatible for the two orientations. The upper panel compares a head-to-toe simulation with a solution loop, and the lower panel shows the vertical model compared to a CL pore after lipid spontaneously dissociated; scale bars = 10 nm. (B) Line scans through the feature demonstrate geometric agreement between models (black lines) and experimental data (red lines).
Figure 6 with 3 supplements

Mutational analysis indicates that polymerization in solution is required for pore formation.
(A) The position of the residues G4 (red) and I9 (green) are shown for two different orientations of the 8-mer model. The CL sequence highlighting the position of the mutations is shown at the bottom. (B) Mass photometry shows that the G4W variant has a lower tendency to form large assemblies than I9A in solution. (C) AFM data of CL variants in the absence of membranes. The I9A variant exhibits increased loop features, while G4W does not form polymers; scale bar = 100 nm. Representative I9A features are selected from the image: a protomer, a loop, and a large loop; scale bars = 10 nm. (D) The volumes of the features observed by AFM were calculated, and are shown as accumulated fraction. Data are shown for CL WT (N=7838 features), I9A (N=3609), and G4W (N=190). (E) The fraction of all polymers that close into a loop was calculated for all variants. Error bars are standard deviations (n=3 independent experiments); p-values are the result of a Student’s t-test comparing the I9A and G4W data to the WT. (F) I9A CL forms membrane pores, while pores were not observed for G4W; scale bars = 100 nm for full images, 10 nm for inset. (G) Liposome dye release assay shows that CL variants display different membrane disruption. Top panel shows a time course of dye release for CL WT (black), I9A (green), and G4W (red) at 333 nM, and the bottom panel shows the percentage of dye release after 2 hrs for different peptide concentrations. N=3–4 and error bars are S.D. (H) SDS-PAGE of variants. The 16% tricine gel was silver-stained. Samples were incubated at 37 °C. The position of molecular weight markers is shown. The lower mobility of the G4W oligomer results from the corresponding differences in molecular weight (MWCL-WT=3310 Da, and MWCL-G4W = 3439 Da).
-
Figure 6—source data 1
Raw mass photometry data corresponding to Figure 6B.
- https://cdn.elifesciences.org/articles/75490/elife-75490-fig6-data1-v1.zip
-
Figure 6—source data 2
Uncropped gel corresponding to Figure 6H.
- https://cdn.elifesciences.org/articles/75490/elife-75490-fig6-data2-v1.zip
Figure 6—figure supplement 1
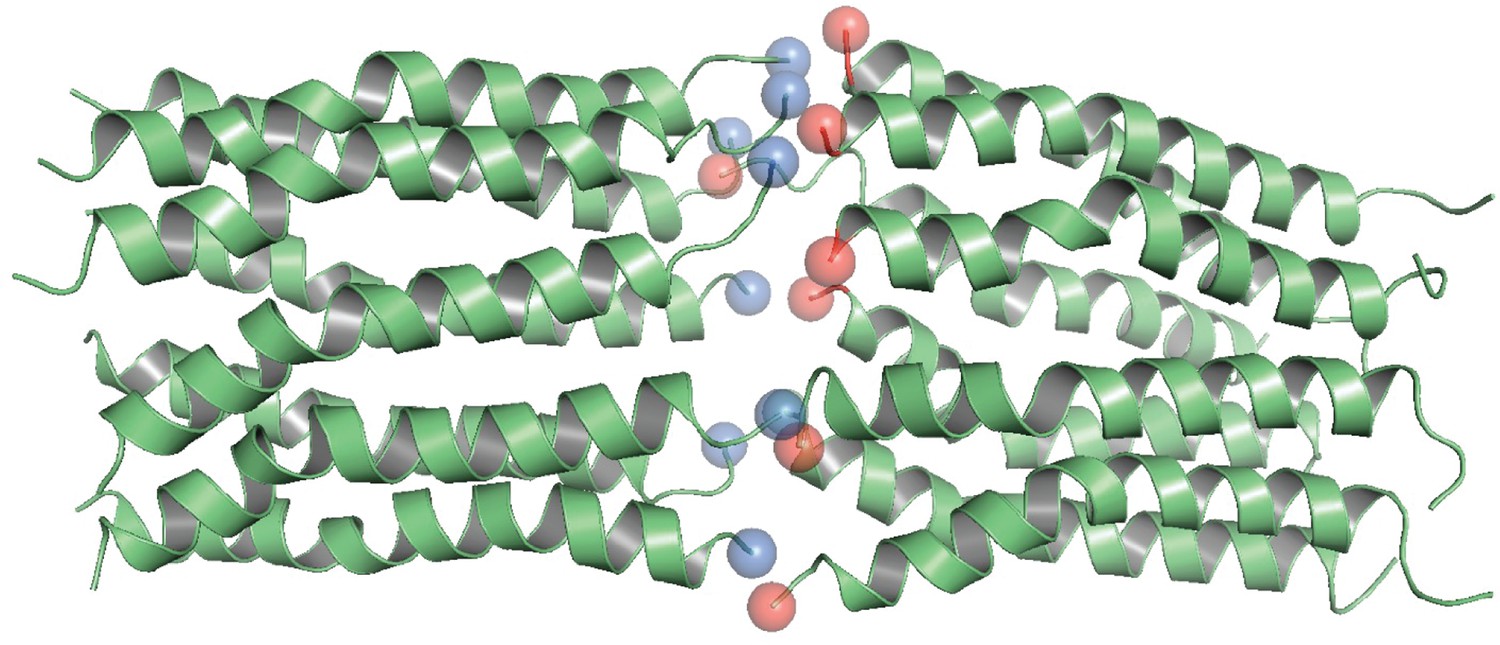
Head-to-toe model of CL 16-mer (dimer of octamer).
N-termini are shown in red, and C-termini in blue.
Figure 6—figure supplement 2
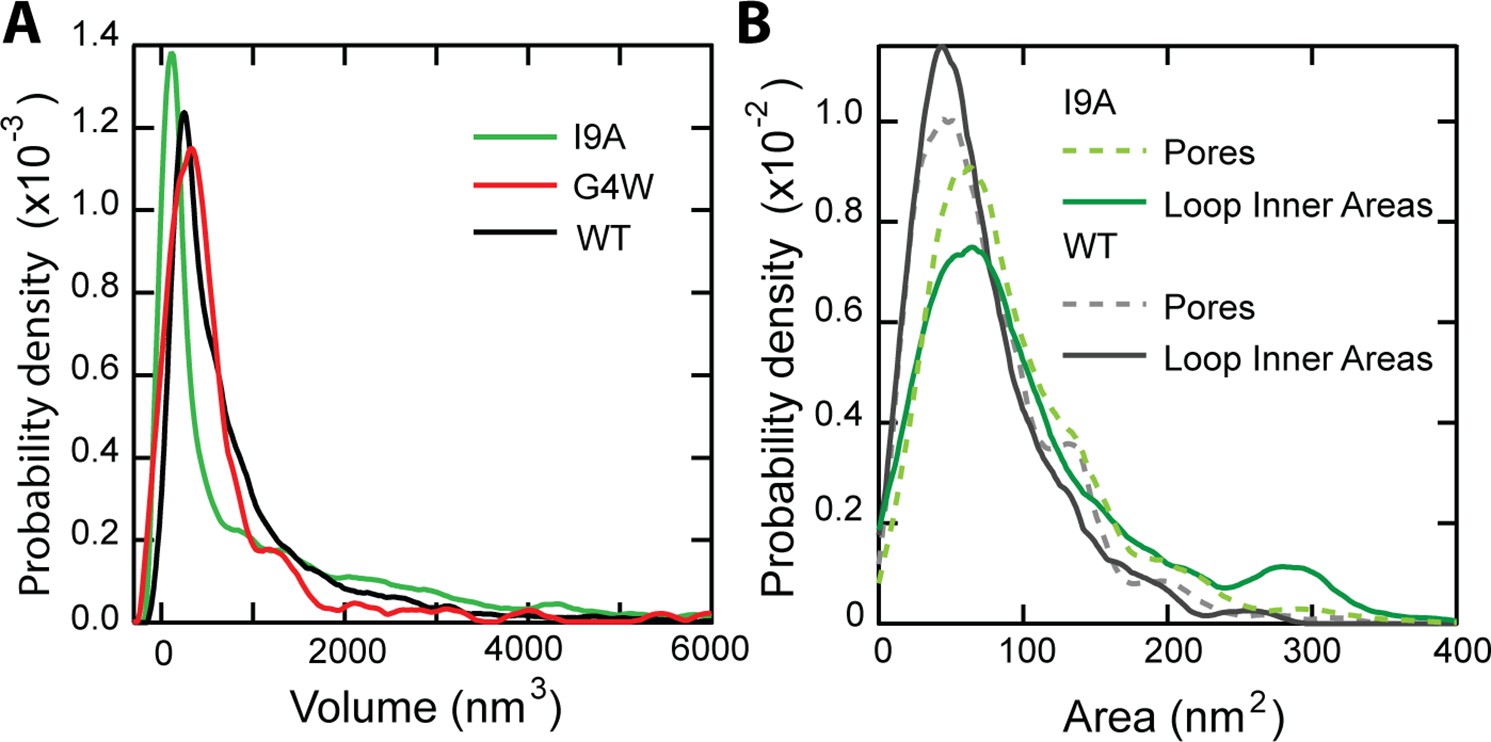
Particle volume and pore area histograms of CL variants.
(A) A volume histogram of CL in solution compares the wildtype (N=7838 features), I9A (N=3609), and G4W (N=422). The I9A mutant has a smaller primary peak,~100 nm3, indicating a large number of smaller features. The larger volumes of the loops fall into the long high-volume shoulder. (B) An area histogram of N=1397 unrimmed pore-like features shows I9A increases the pore area of the primary peak population >20%, from 50 nm2 (unrimmed wild type, N=1468)–61 nm2. N=156 I9A loops are analyzed with the Hessian blob algorithm to get the inner areas and compared to the unrimmed I9A pore areas (N=1397). The overall agreement between pore geometry and loop inner areas for both the I9A mutant and the WT (Nrings = 261) suggests that structures formed in solution can directly translate into membrane pores.
Figure 6—figure supplement 3

CD spectra of WT and variant CL in the presence and absence of lipid vesicles.
(A) Circular dichroism (CD) spectra of WT and variant CL collected in buffer. (B) CD spectra collected in the presence of a 200:1 molar excess of POPC LUVs, in 1 mM NaPi buffer, pH. Data are provided for CL WT (black), I9A (Green) and G4W (red).
Figure 7
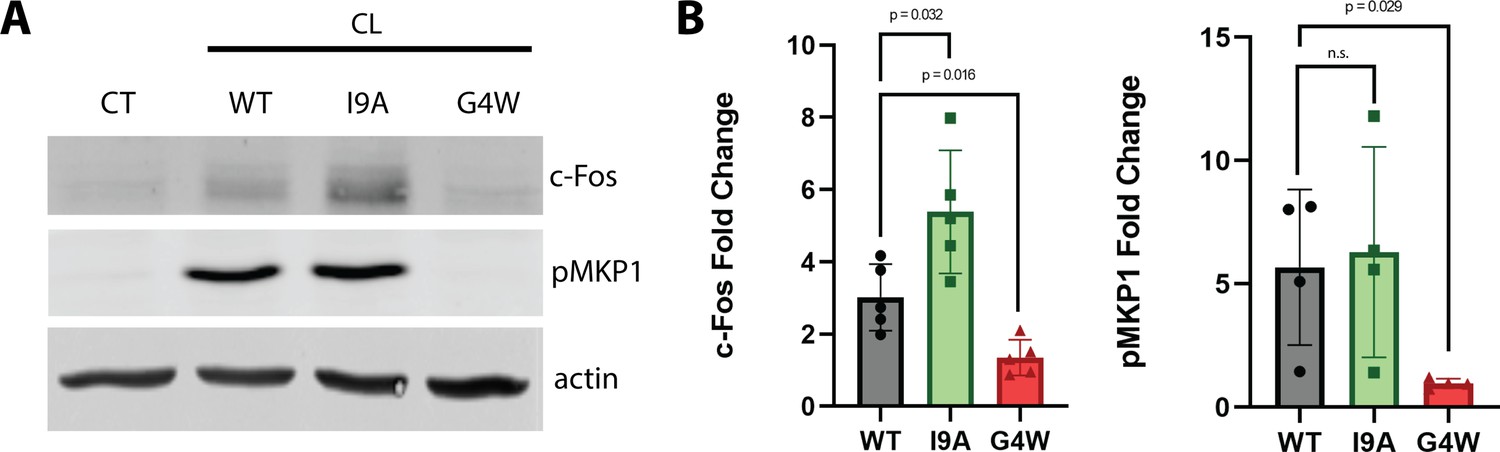
The polymerization-defective G4W variant does not cause danger response signaling in epithelial cells.
(A) Representative western blots of oral epithelial cells (TR146) probed for c-Fos expression and phosphorylation of MKP1 after 2 hr treatment with WT and variant CL. (B) Quantification of c-Fos and MKP1 phosphorylation was used to assess danger response signaling. Data were normalized to values obtained in control conditions. Actin was used as a loading control. N=4, and bars are the S.D.
-
Figure 7—source data 1
Uncropped western blot of TR146 cell lysates treated with WT and variant CL for two hours probed with antibodies for (A) c-Fos, actin and (B) pMKP1.
- https://cdn.elifesciences.org/articles/75490/elife-75490-fig7-data1-v1.zip
Figure 8
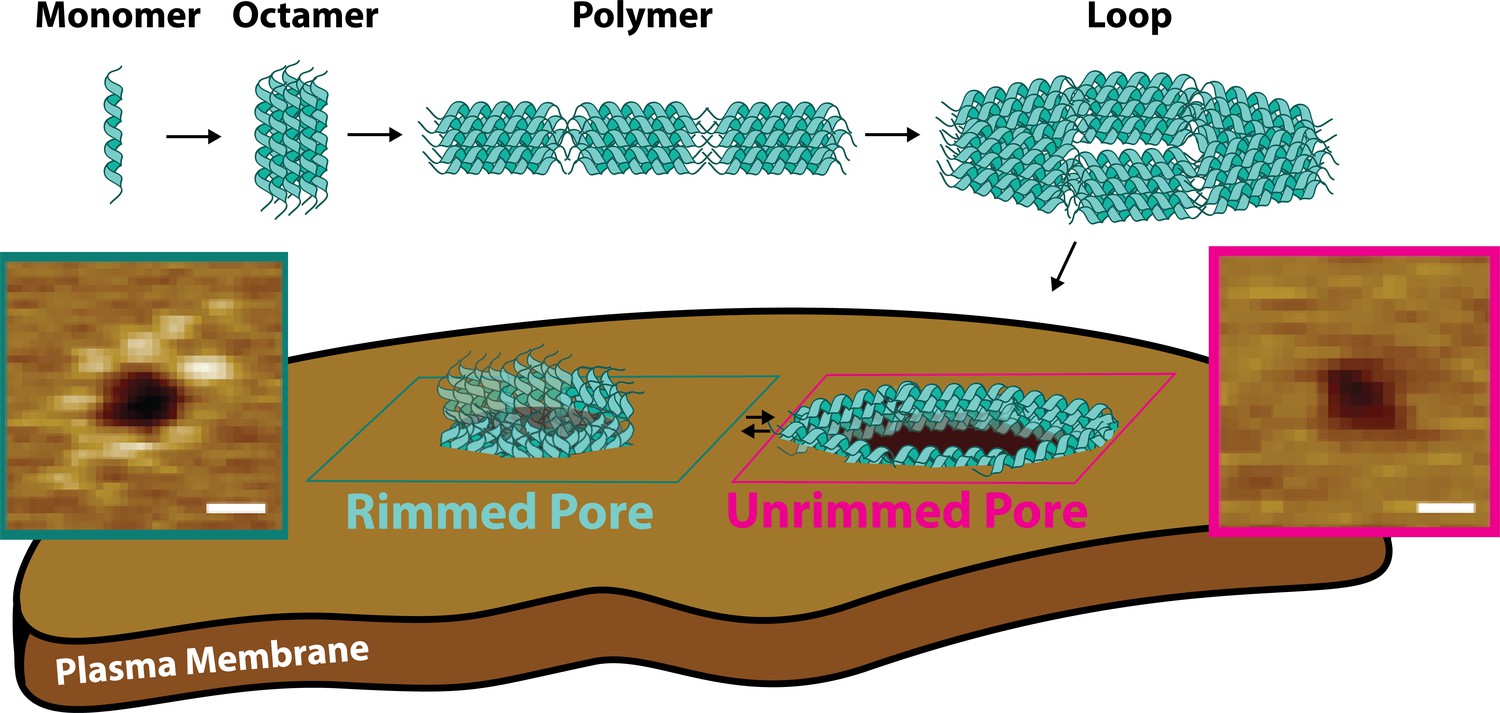
Candidalysin utilizes a novel mechanism of pore formation to attack human cell membranes.
The CL monomer oligomerizes into an intermediate oligomer, which we propose is 8-mer. CL polymers are formed when the oligomer assembles in a head-to-toe fashion. Polymers can close into loops, which have the ability to insert into membranes forming unrimmed pores. Upon insertion, pores exist in a dynamic equilibrium between unrimmed and rimmed pores, which cause cellular toxicity. Scale bars in the AFM images are 10 nm.
Author response image 1
Author response image 2
Tables
Key resources table
| Reagent type (species) or resource | Designation | Source or reference | Identifiers | Additional information |
|---|---|---|---|---|
| Software, algorithm | Agilent 6560 IMS-QTOF Software | Agilent Technologies | ||
| Software, algorithm | Origin Pro | Origin | Used to graph IMS-MS data | |
| Software, algorithm | Visual Molecular Dynamics (VMD) | http://www.ks.uiuc.edu/Research/vmd/ | ||
| Software, algorithm | EMBOSS | EMBL-EBI | ||
| Software, algorithm | GROMACS 4.6.7 | GROMACS | ||
| Chemical compound, drug | Ammonium Acetate, Ultrapure | VWR | 631-61-8 | |
| Chemical compound, drug | LC-MS Water | Sigma-Aldrich | 7732-18-5 | |
| Cell line (Homo sapiens) | Buccal squamous cell carcinoma | ECACC | TR146 | ECACC 10032305 |
| Antibody | Goat-anti mouse IRDye 680 (Goat polyclonal) | LI-COR | 925–68070 | 1:10,000 |
| Antibody | Phospho-MKP1 (Rabbit monoclonal) | Cell Signaling Technology | 2857 S | 1:1,000 |
| Antibody | c-Fos (Rabbit monoclonal) | Cell Signaling Technology | 2250 S | 1:500 |
| Antibody | Goat-anti rabbit IRDye 800 (Goat polyclonal) | LI-COR | 926–32211 | 1:10,000 |
| Antibody | β-actin (mouse monoclonal) | ABCAM | ab6276 | 1:1000 |
| Peptide, recombinant protein | Wild-Type Candidalysin | Peptide 2.0 | CL | |
| Peptide, recombinant protein | I9A Candidalysin | Peptide 2.0 | I9A | |
| Peptide, recombinant protein | G4W Candidalysin | Peptide 2.0 | G4W | |
| Chemical compound, drug | POPC | Avanti Polar Lipids | 850457 C | |
| Chemical compound, drug | DOPC | Avanti Polar Lipids | 850375 P | |
| Chemical compound, drug | Calcein | MP | 02190167-CF | |
| Software, algorithm | Discover MP | Refeyn version 2.2.0 | ||
| Software, algorithm | Acquire MP | Refeyn version 2.2.0 | ||
| Software, algorithm | SEDFIT | NIH | ||
| Software, algorithm | Image Studio | LI-COR | ||
| Chemical compound, drug | n-Dodecyl-beta-D-Maltoside | Millipore Sigma | D4641 | DBM |
| Software, algorithm | Igor Pro 7.08 | Wavemetrics | ||
| Software, algorithm | Igor Pro 6.38 | Wavemetrics | ||
| Software, algorithm | Asylum AFM Software | Oxford instruments | Version 16 | |
| Other | AFM tips | Olympus | See AFM Materials and methods Section |
Additional files
-
Transparent reporting form
- https://cdn.elifesciences.org/articles/75490/elife-75490-transrepform1-v1.docx
-
Supplementary file 1
Agilent 6560 IMS-QTOF parameters.
- https://cdn.elifesciences.org/articles/75490/elife-75490-supp1-v1.xlsx
Download links
A two-part list of links to download the article, or parts of the article, in various formats.
Downloads (link to download the article as PDF)
Open citations (links to open the citations from this article in various online reference manager services)
Cite this article (links to download the citations from this article in formats compatible with various reference manager tools)
The Candida albicans virulence factor candidalysin polymerizes in solution to form membrane pores and damage epithelial cells
eLife 11:e75490.
https://doi.org/10.7554/eLife.75490


