Neural synchronization is strongest to the spectral flux of slow music and depends on familiarity and beat salience
- Research Group “Neural and Environmental Rhythms”, Max Planck Institute for Empirical Aesthetics, Germany
- Goethe University Frankfurt, Institute for Cell Biology and Neuroscience, Germany
- Department of Psychology, Toronto Metropolitan University, Canada
Figures
Figure 1 with 2 supplements

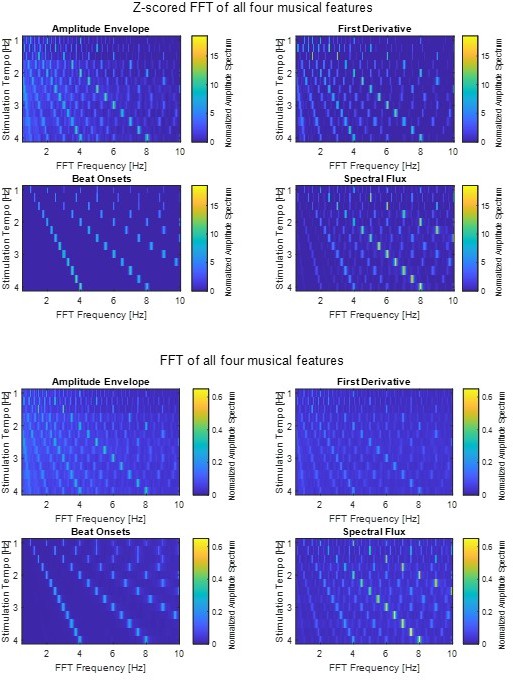
Experimental design and musical features.
(A) Schematic of the experimental procedure. Each trial consisted of the presentation of one music segment, during which participants were instructed to listen attentively without moving. After a 1 s silence, the last 5.5 s of the music segment was repeated while participants tapped their finger along with the beat. At the end of each trial, participants rated their enjoyment and familiarity of the music segment, as well as the ease with which they were able to tap to the beat (Translated English example in Figure: “How much did you like the song?” rated from “not at all” to “very much”). (B) Exemplary traces of the four musical features of one music segment. (C) Z-scored mean amplitude spectrum of all 4 musical features. Light orange dashed boxes highlight when the FFT Frequency corresponds to the stimulation tempo or first harmonic. (D) Mutual information (MI) for all possible feature combinations (green) compared to a surrogate distribution (yellow, three-way ANOVA, *pFDR <0.001, rest: pFDR <0.05). Boxplots indicate the median, the 25th and 75th percentiles (n=52). (E) MI scores between all possible feature combinations (*pFDR <0.001, rest: pFDR <0.05).
-
Figure 1—source data 1
Source data for visualizing and analyzing the musical features.
- https://cdn.elifesciences.org/articles/75515/elife-75515-fig1-data1-v1.zip
Figure 1—figure supplement 1
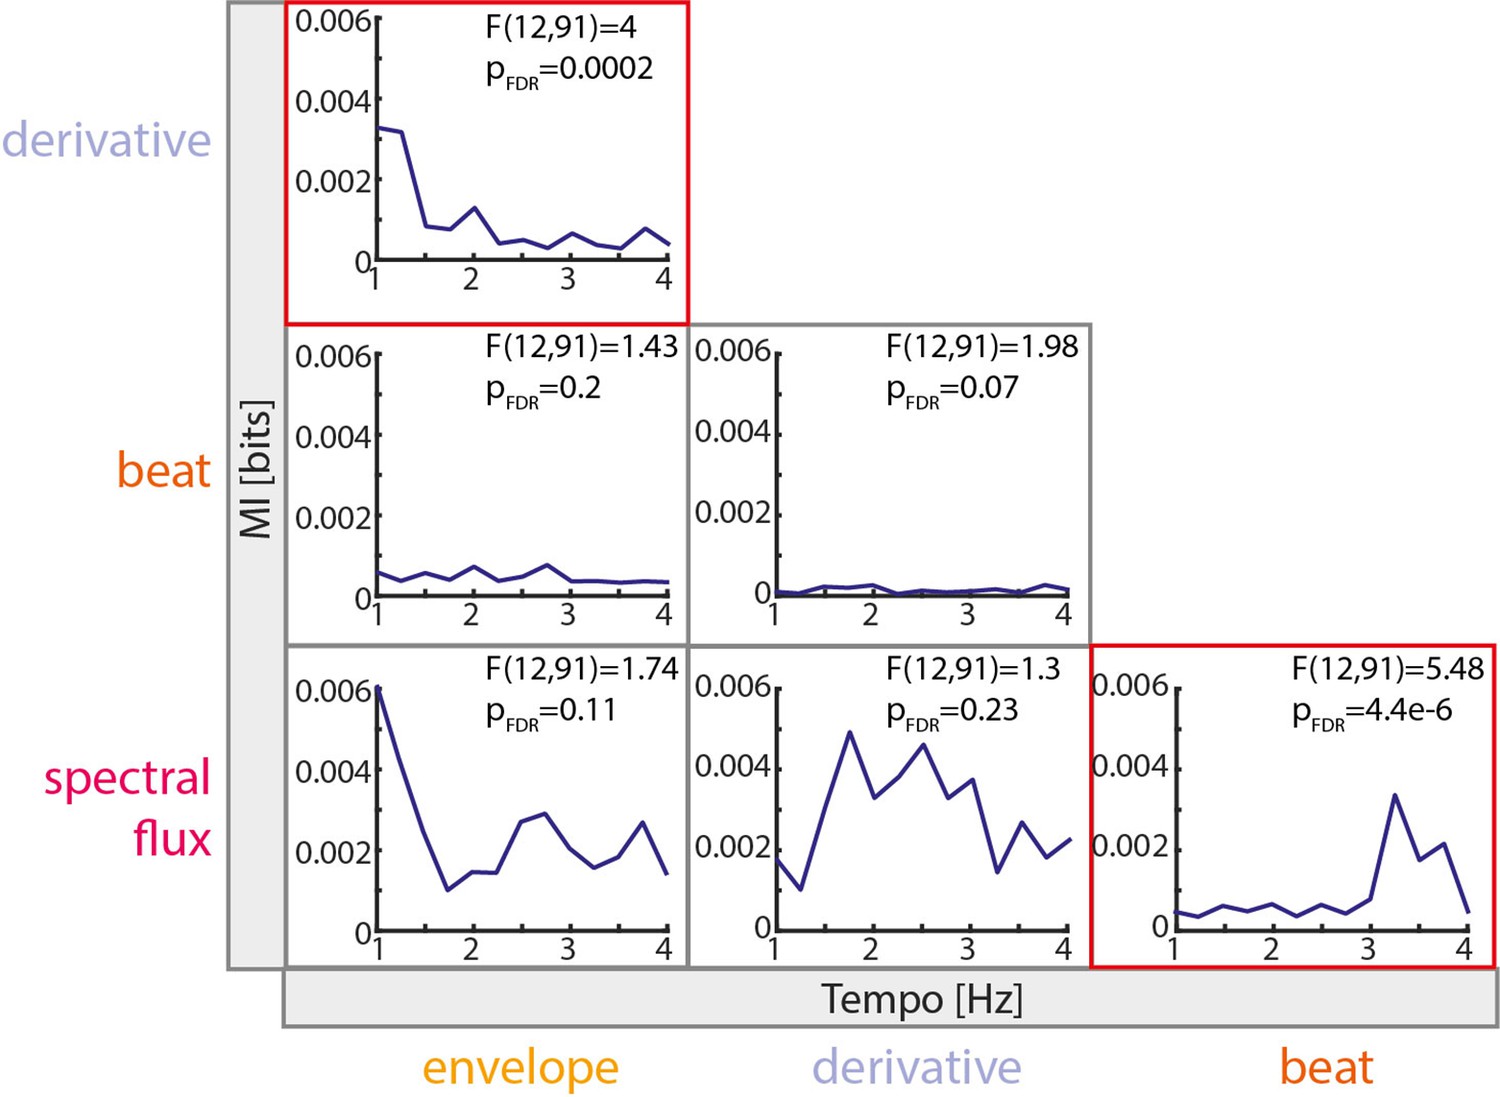
Shared Mutual Information (MI) between musical features across tempo conditions.
MI scores for all possible feature combinations as a function of tempo. Significance was evaluated based on a three-way ANOVA (with tempo as second factor, see Materials and methods for further information) and a follow-up pairwise comparison. Red boxes indicate significant tempo-dependent shared MI between musical features with a significance level of pFDR <0.05.
Figure 1—figure supplement 2

Tempo manipulations of original music segments.
(A) Histogram of the original tempo of the music segments prior to tempo manipulation binned between 1–4 Hz in steps of 0.25 Hz (n=72). Histograms of (B) the difference between the original tempo and the slowest possible tempo manipulation and (C) the difference between the fastest possible tempo manipulation and the original tempo per music segment.
Figure 2 with 2 supplements
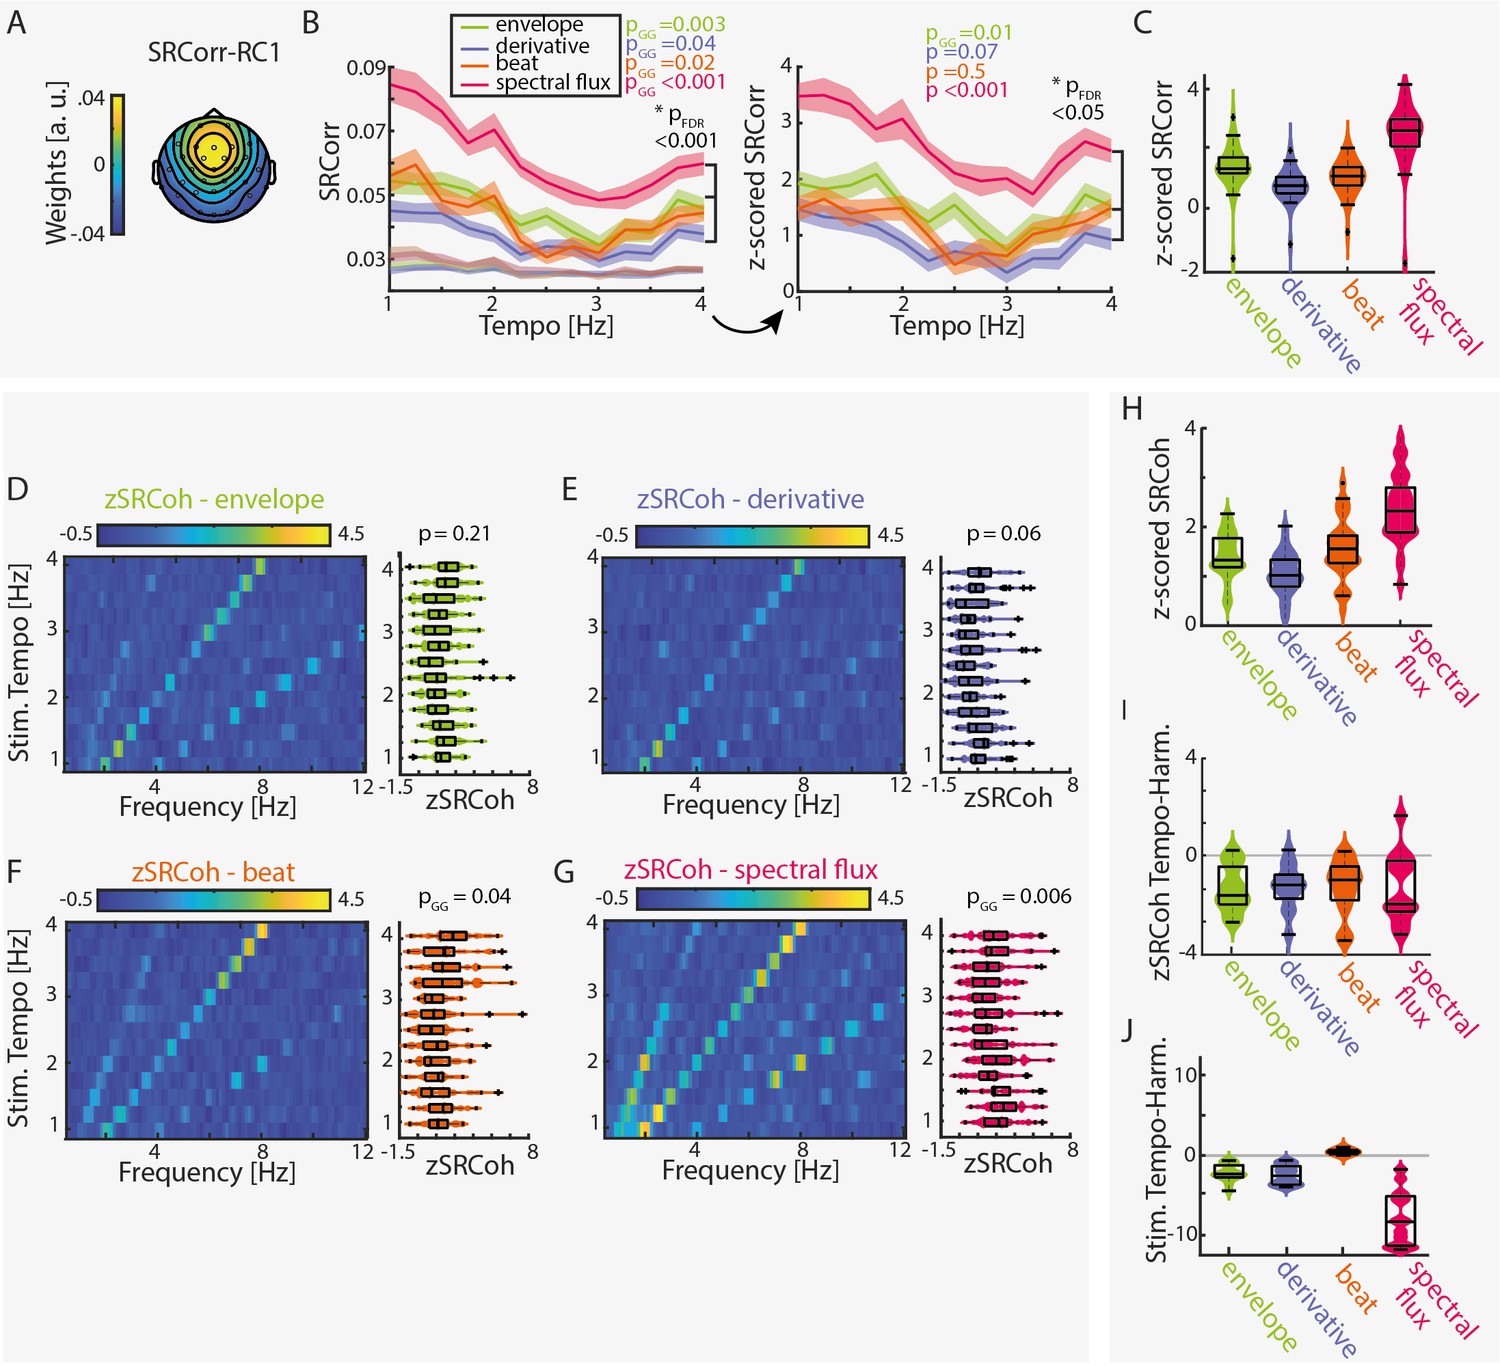
Stimulus–response correlation and stimulus–response coherence are tempo dependent for all musical features.
(A) Projected topography of the first reliable component (RC1). (B) Average SRCorr of the aligned neural response and surrogate distribution (grey) across tempi for each musical feature (left) and the z-scored SRCorr based on a surrogate distribution (right) (± SEM; shaded area). Highest correlations were found at slow tempi (repeated-measure ANOVA, Greenhouse-Geiser correction where applicable). The slopes of regression models were used to compare the tempo-specificity between musical features. (C) Mean SRCorr across musical features. Highest correlations were found in response to spectral flux with significant differences between all possible feature combinations, pFDR <0.001, except between the envelope or derivative and beat onsets, pFDR <0.01 (n=34, repeated-measure ANOVA, Tukey’s test, median, 25th and 75th percentiles). Z-scored SRCoh in response to the (D) amplitude envelope, (E) first derivative, (F) beat onsets and (G) spectral flux. Each panel depicts the SRCoh as colorplot (left) and the pooled SRCoh values at the stimulation tempo and first harmonic (right, n=34, median, 25th and 75th percentile). (H) Same as (C) for the SRCoh with significant differences between all possible feature combinations (pFDR <0.001) apart between the envelope and beat onsets. Coherence values were averaged over the stimulus tempo and first harmonic. (I) Mean differences of SRCoh values at the stimulation tempo and first harmonic (n=34, negative values: higher SRCoh at harmonic, positive values: higher SRCoh at stimulation tempo, paired-sample t-test, pFDR <0.05). (J) Same as (I) based on the FFT amplitudes (pFDR <0.001).
-
Figure 2—source data 1
Source data for the RCA-based measures stimulus-response correlation (SRCorr) and stimulus-response coherence (SRCoh).
- https://cdn.elifesciences.org/articles/75515/elife-75515-fig2-data1-v1.zip
-
Figure 2—source data 2
Output of the RCA-based analysis of the first two stimulation subgroups (based on Kaneshiro et al., 2020).
- https://cdn.elifesciences.org/articles/75515/elife-75515-fig2-data2-v1.zip
-
Figure 2—source data 3
Output of the RCA-based analysis of the last two stimulation subgroups (based on Kaneshiro et al., 2020).
- https://cdn.elifesciences.org/articles/75515/elife-75515-fig2-data3-v1.zip
Figure 2—figure supplement 1
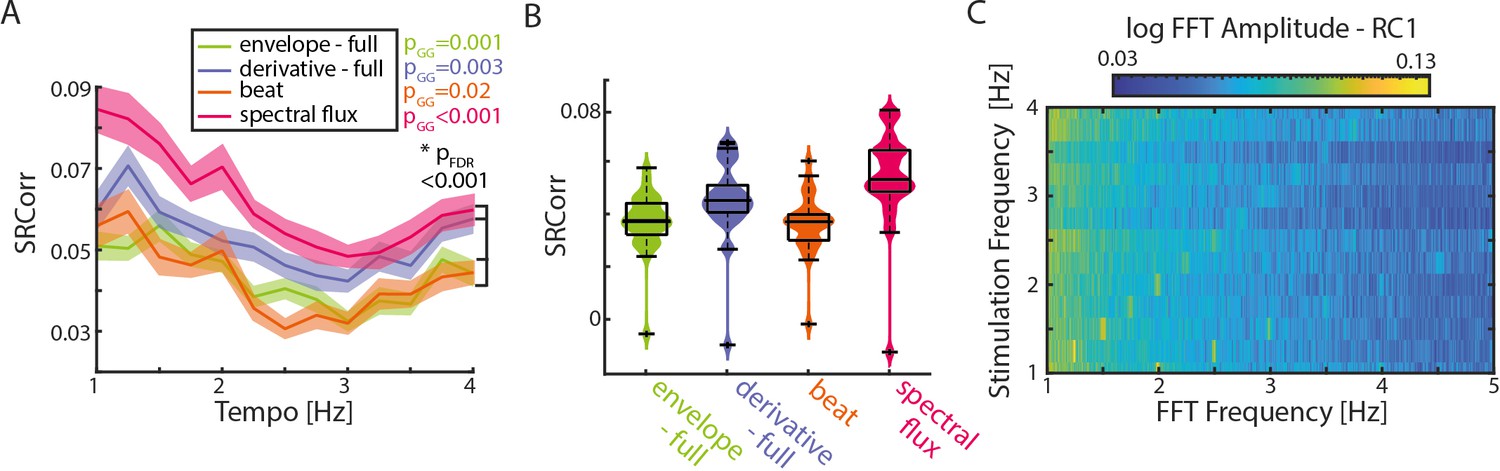
SRCorr and SRCoh in response to the full-band amplitude envelope and derivative.
(A) Mean SRCorr across stimulation tempi and musical features (± SEM). Similar to Figure 2B of the main manuscript, the full-band amplitude envelope (Hilbert transform) and resultant first derivative were used. Significance between tempi was assessed using a repeated-measure ANOVA (with Greenhouse-Geiser correction if applicable). (B) SRCorr across musical features. Statistically significant differences were identified between all musical feature combinations except between the envelope and beat onsets using a repeated-measure ANOVA (pFDR <0.001, median, 25th and 75th percentiles). (C) Colormap of the fast Fourier Transform (FFT) of the first reliable component (RC1) across stimulation tempi. Note that the colorbar is in a logarithmic scale.
Figure 2—figure supplement 2

Individual data examples for the SRCorr and SRCoh.
(A) Each plot shows the mean z-scored SRCorr of one participant across stimulation tempi. Each line represents the average of one musical feature (± SEM). (B) Illustrative color plots of the normalized SRCoh in response to the spectral flux across stimulation tempi (1–4 Hz) of the same four participants as in (A). Z-scoring was based on the surrogate distribution.
Figure 3 with 3 supplements
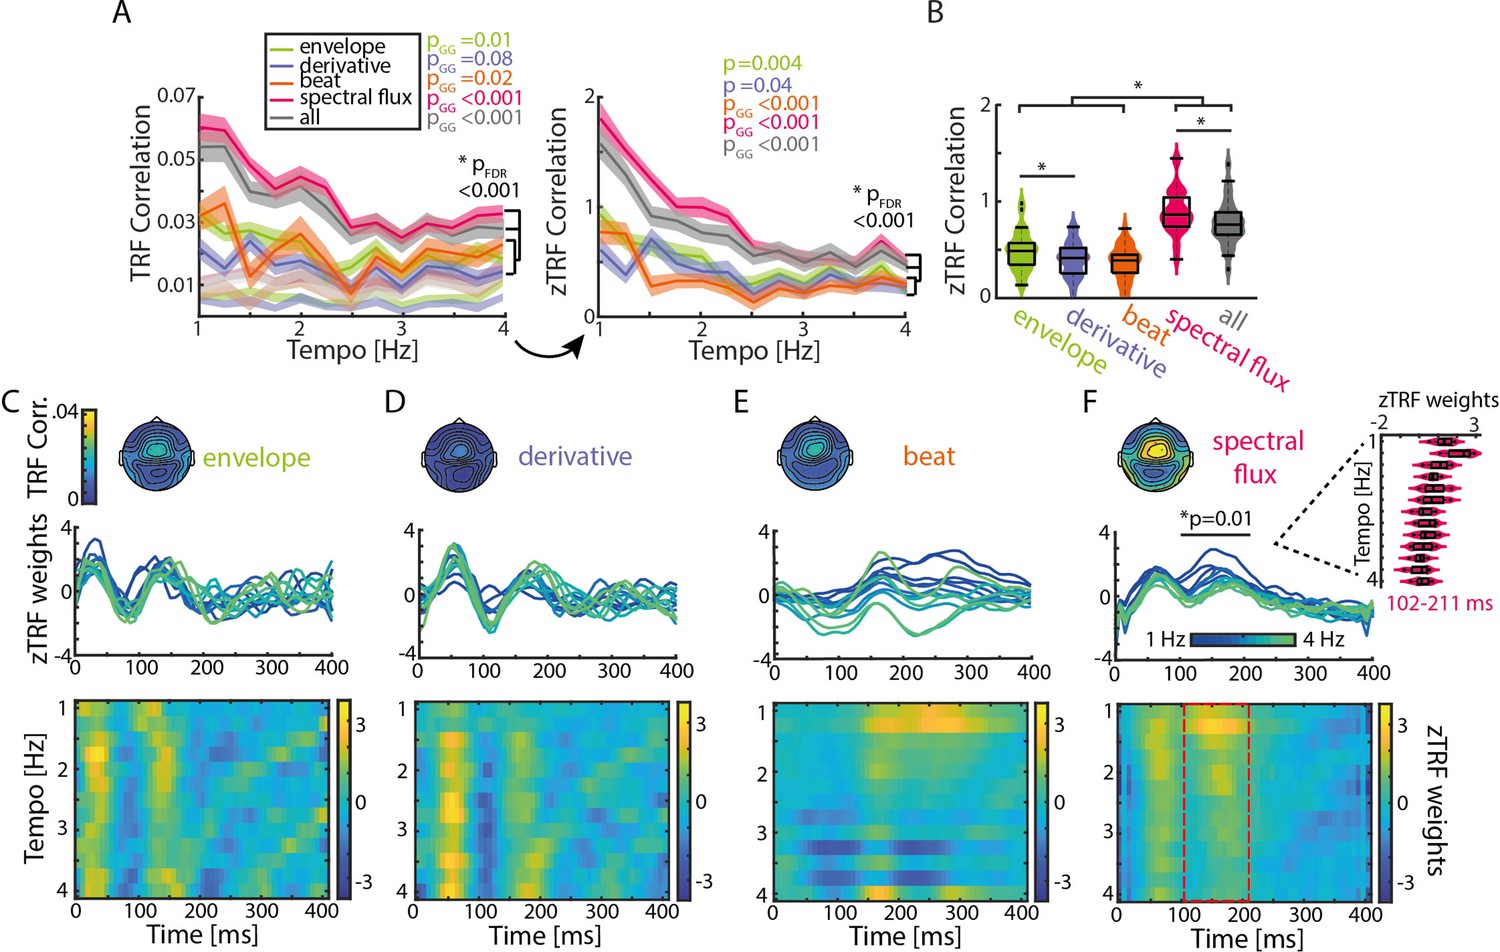
TRFs are tempo dependent.
(A) Mean TRF (± SEM) correlations as a function of stimulation tempo per stimulus feature (p-values next to the legend correspond to a repeated-measure ANOVA across tempi for every musical feature and the p-value below to the slope comparison of a linear regression model). TRF correlations were highest for spectral flux and combined musical features for slow tempi. The TRF correlations were z-scored based on a surrogate distribution (right panel). (B) Violin plots of the TRF correlations across musical features. Boxplots illustrate the median, 25th and 75th percentiles (n=34). Significant pairwise musical feature comparisons were calculated using a repeated-measure ANOVA with follow-up Tukey’s test, *pFDR <0.001. (C) Top panel: Topographies of the TRF correlations and TRF time lags (0–400ms) in response to the amplitude envelope. Each line depicts one stimulation tempo (13 tempi between 1 Hz, blue and 4 Hz, green). Lower panel: Colormap of the normalized TRF weights of the envelope in the same time window across stimulation tempi. (D) Same as (C) for the first derivative, (E) beat onsets and (F) spectral flux. Cluster-based permutation testing was used to identify significant tempo-specific time windows (red dashed box, p<0.05). Inset: Mean TRF weights in response to the spectral flux for time lags between 102 and 211ms (n=34, median, 25th and 75th percentile).
-
Figure 3—source data 1
Source data of the TRF correlations and weights.
- https://cdn.elifesciences.org/articles/75515/elife-75515-fig3-data1-v1.zip
Figure 3—figure supplement 1
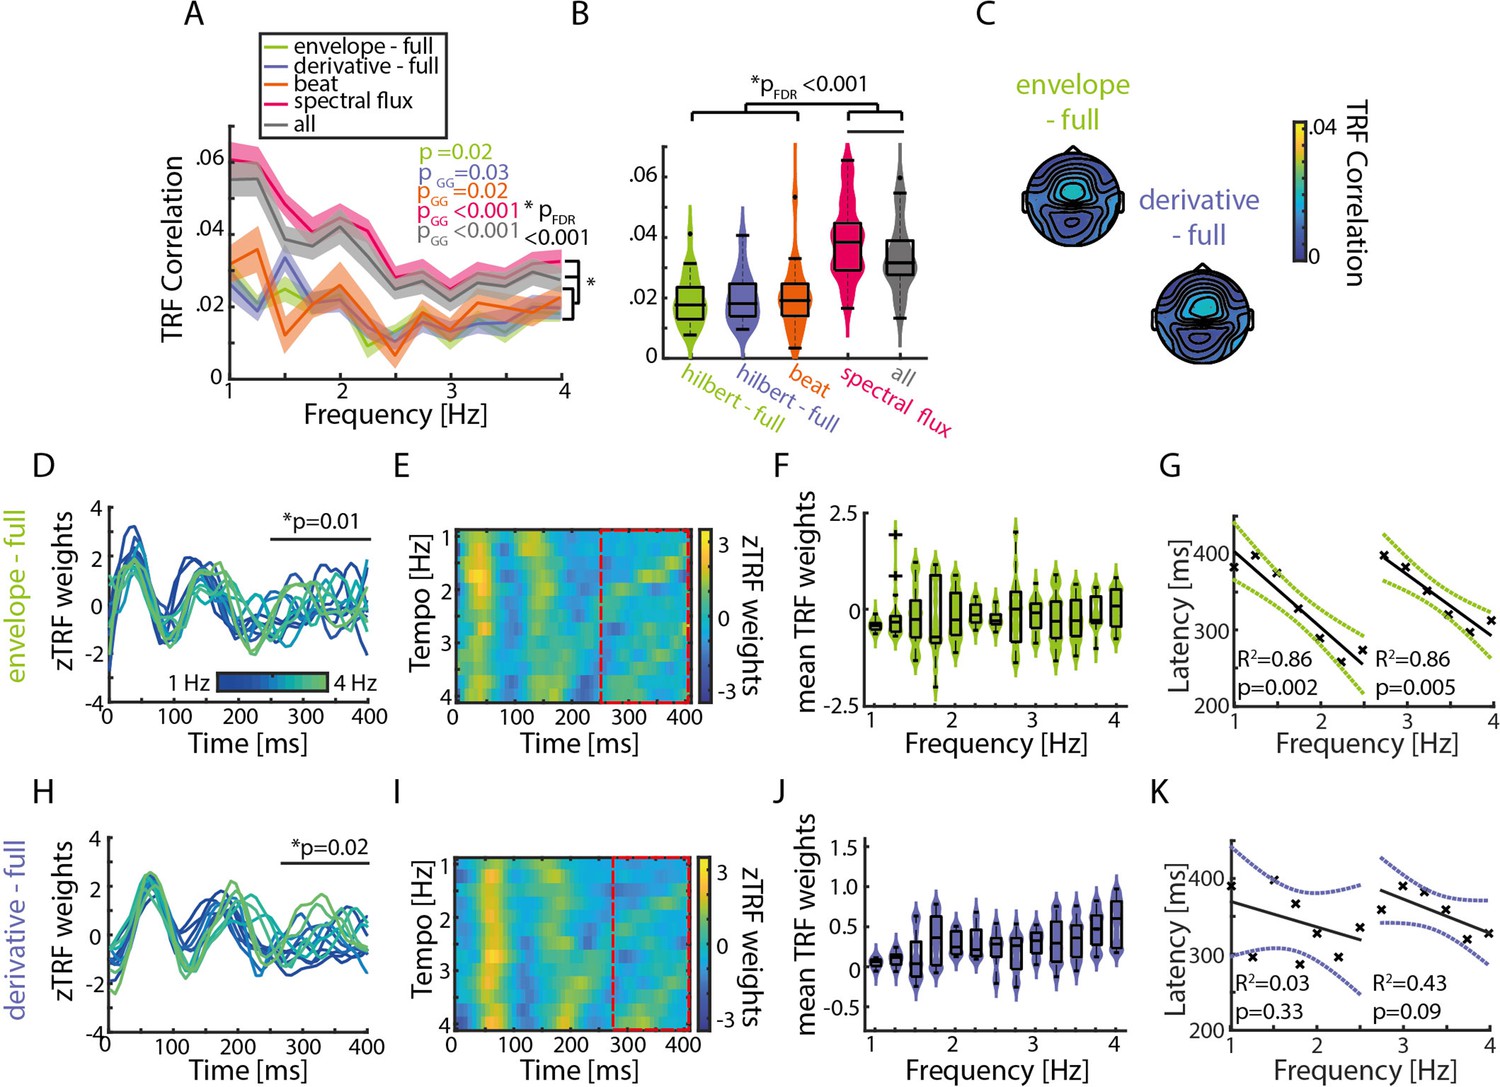
TRFs in response to the full-band amplitude envelope and first derivative show similar patterns as the gammatone filtered musical features.
(A) Mean TRF correlations across stimulation tempi and musical features (± SEM). (B) TRF correlations across musical features. Violin plots indicate the median, 25th and 75th percentiles (n=34, repeated-measure ANOVA; *pFDR <0.001). Similarly to the gammatone filtered features, the full-band envelope and derivative show significantly smaller TRF correlations in comparison to the spectral flux and the combination of all features. (C) Auditory topographies of the TRF correlations in response to the full-band features. (D) TRF weights for time lags between 0 and 400ms of the Hilbert envelope. Cluster-based permutation testing was used to identify significant time lag windows (envelope: 250–400ms, p=0.01; derivative: 281–400ms, p=0.02). Each line represents one stimulation tempo (n=13, blue, 1 Hz - green, 4 Hz). (E) Colormaps of the TRF weights over the same time lags for the envelope. Red dashed lines highlight significant time windows. (F) Average TRF weights from the significant time lag window for the envelope (n=34, median, 25th and 75th percentile). (G) Latency of the P3 peak located in the significant time lag window across stimulation tempi for the full-band envelope TRFs. The latencies were divided into two subgroups (1–2.5 Hz and 2.75–4 Hz) and a regression fit into the data. (H)-(K) Same as (D)-(G) for the first derivative.
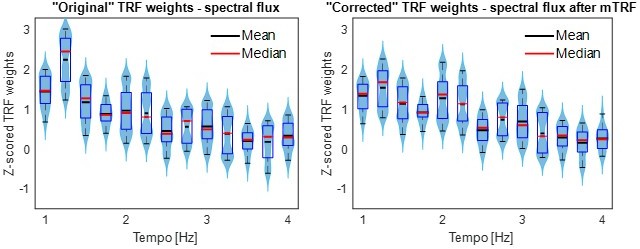
Figure 3—figure supplement 2

Corrected TRF weights of the spectral flux after removing the effects of the other musical features.
(A) TRF weights in response to the spectral flux. To calculate those weights, a multivariate TRF approach based on the amplitude envelope, first derivative and beat onsets was used and the resulting TRF predictions were subtracted from the ‘actual’ EEG data. The residual EEG data was used to compute the spectral TRF model. (B) Similarly to the main Figure 3F the TRF weights at the previously calculated significant time window were plotted as a function of tempo. The boxplots indicate the median, 25th and 75th percentile (n=34).
Figure 3—figure supplement 3

No differences in TRFs correlations between more vs. less modulated music.
(A) TRF correlations for up to three trials per participant when the original music tempo ≈ manipulated music tempo (labelled ‘Original’) vs. when the manipulated music tempo was faster than the original music segments (‘Slow’). For this analysis, different trials for the different stimulation subgroups from the same stimulation tempo condition (here: 2.25 Hz) were used (nori = 91; nslow = 96 trials). In the right plot the TRF correlation were z-scored based on the surrogate distribution on a per trials basis. No significant differences were observed between groups (repeated-measures ANOVA). (B) Same as (A), but here the original tempo was at a slower tempo and was contrasted against music segments that were originally faster and were manipulated to be played at a 1.5 Hz (nori = 57; nfast = 58 trials). The boxplots indicate the median, 25th and 75th percentile.
Figure 4 with 1 supplement
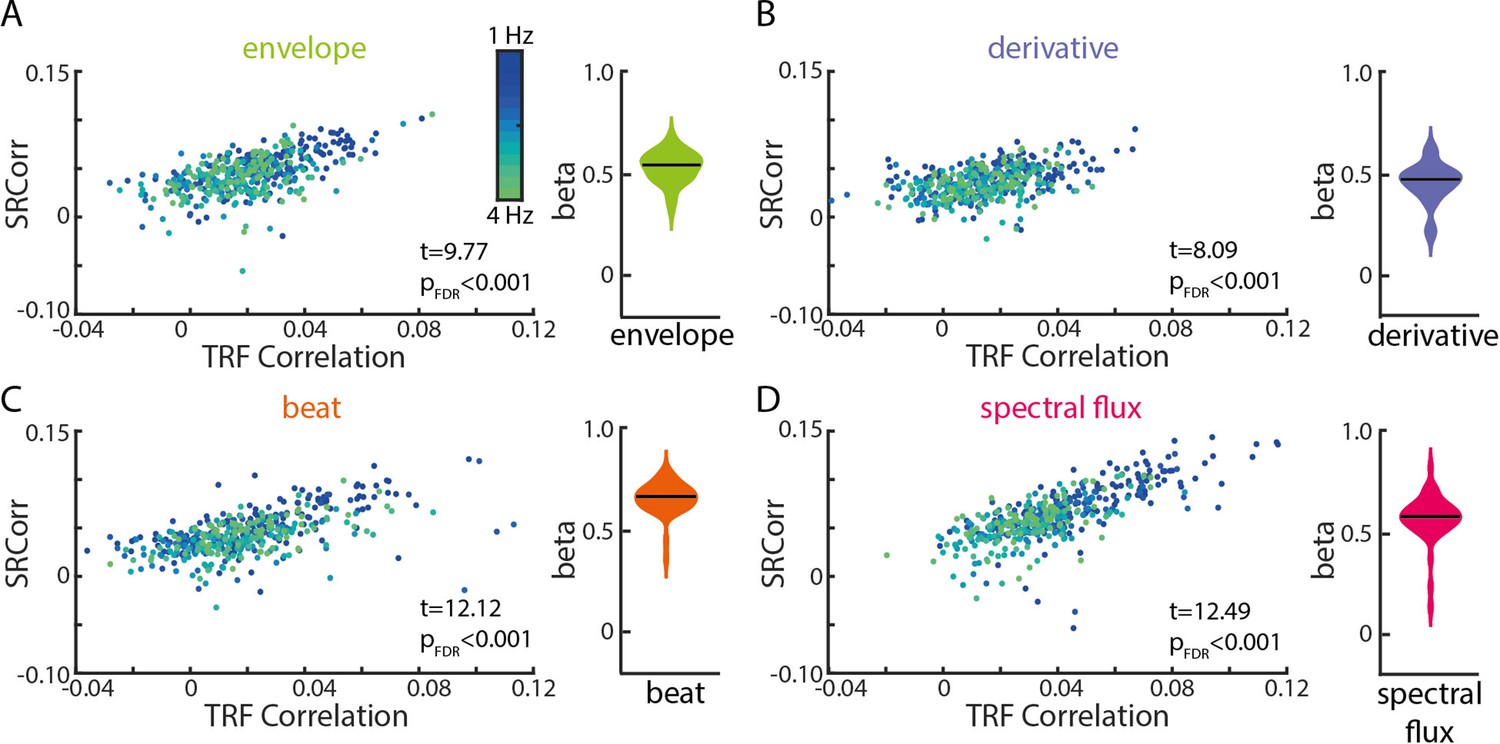
Significant relationships between SRCorr and TRF correlations for all musical features.
(A) Linear-mixed effects models of the SRCorr (predictor variable) and TRF correlations (response variable) in response to the amplitude envelope. Each dot represents the mean correlation of one participant (n=34) at one stimulation tempo (n=13) (=grouping variables; blue, 1 Hz-green, 4 Hz). Violin plots illustrate fixed effects coefficients (β). (B)-(D) same as (A) for the first derivative, beat onsets and spectral flux. For all musical features, the fixed effects were significant.
-
Figure 4—source data 1
Source data for comparing the results of the TRF and RCA-based measures.
- https://cdn.elifesciences.org/articles/75515/elife-75515-fig4-data1-v1.mat
Figure 4—figure supplement 1

Significant relationships between SRCoh and TRF correlations for all musical features at the stimulation tempo and first harmonic.
(A) Linear-mixed effects models of the SRCoh (predictor variable) and TRF correlations (response variable) in response to the amplitude envelope at the intended stimulation tempo (left, dark grey) and first harmonic (right, light grey). Each dot represents the mean correlation of one participant (n=34) at one stimulation tempo (n=13) (=grouping variables; blue, 1 Hz-green, 4 Hz). Violin plots illustrate fixed effects coefficients (β). (B)-(D) same as (A) for the first derivative, beat onsets and spectral flux. For all musical features, the fixed effects were significant (pFDR <0.01). Model comparisons were implemented based in the Likelihood ratio test (LRStat, p<0.001).
Figure 5 with 3 supplements
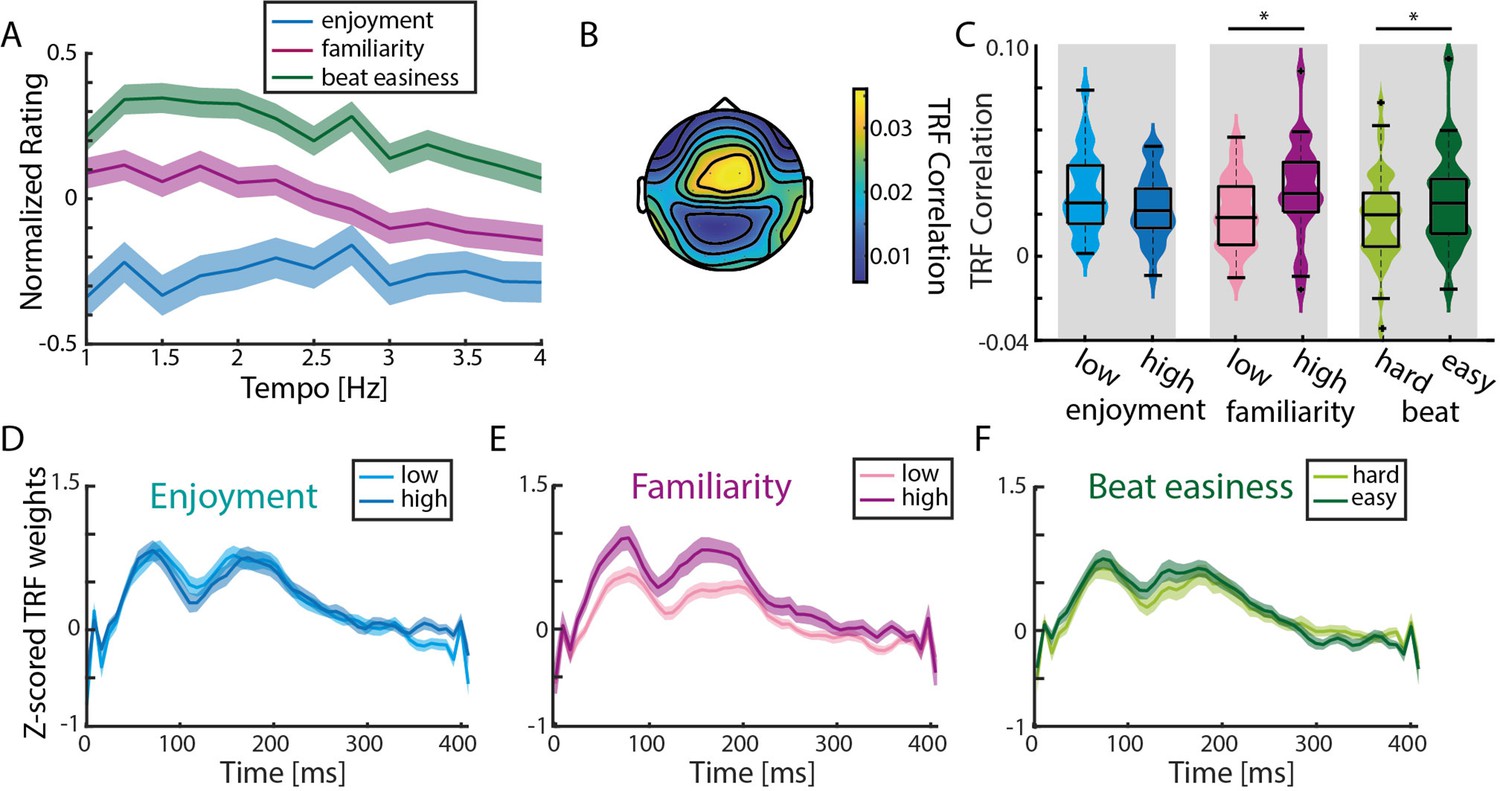
TRF correlations are highest in response to familiar songs.
(A) Normalized (to the maximum value per rating/participant), averaged behavioral ratings of enjoyment, familiarity and easiness to tap to the beat (± SEM). No significant differences across tempo conditions were observed (repeated-measure ANOVA with Greenhouse-Geiser correction). (B) Mean TRF correlations topography across all ratings (based on the analysis of 15 trials with highest and lowest ratings per behavioral measure). (C) Violin plots of TRF correlations comparing low vs. highly enjoyed, low vs. highly familiar, and subjectively difficult vs. easy beat trials. Strongest TRF correlations were found in response to familiar music and music with an easy-to-perceive beat (n=34, paired-sample t-test, *pFDR <0.05). Boxplots indicate median, 25th and 75th percentile. (D) Mean TRFs (± SEM) for time lags between 0–400ms of more and less enjoyable music songs. (E)-(F) Same as (D) for trials with low vs. high familiarity and difficult vs. easy beat ratings.
-
Figure 5—source data 1
Source data of the behavioral ratings and TRF correlations.
- https://cdn.elifesciences.org/articles/75515/elife-75515-fig5-data1-v1.zip
Figure 5—figure supplement 1

Significant differences of FFT amplitudes at stimulus-relevant frequencies between differently rated trials.
Z-scored average FFT amplitudes at the stimulation tempo and first harmonic of the 15 highest vs. lowest ratings per behavioral rating category (n=34, low vs. highly enjoyed, low vs. highly familiar, and subjectively difficult vs. easy beat trials). Significant differences were observed for all pairwise comparisons (paired-sample t-test, pFDR≈0.01).
Figure 5—figure supplement 2

Musical training did not have an effect on TRF correlations regardless of the musical feature.
Scatter plot between the general sophistication index (F7, Gold-MSI) and mean TRF correlations per participant (n=34). No significant correlations between the Gold-MSI and TRF correlations were observed in response to the (A) amplitude envelope, (B) first derivative, (C) beat onsets and (D) spectral flux.
Figure 5—figure supplement 3

Music tapping rate across participants.
(A)-(B) Illustrative histograms of the relative number of trials per tapped music rate of two participants with a fitted skewed Gaussian. The modes indicate the preferred music tapping rate and the width the shape of the fitted Gaussian. (C) Mean music-tapping histogram across all participants (n=29, 5 participants were excluded from the music tapping analysis due to inconsistent taps). The mean preferred tapping frequency was 1.55 Hz.
Author response image 1
Author response image 2

Author response image 3
Tables
Appendix 1—table 1
Overview over the music stimuli.
Parameters of stimulus creation for all 72 musical stimulus segments. The columns indicate 1. the stimulus number, 2. title of the musical piece, 3. the Artist of each musical piece, 4. the CD each piece was taken from (available at Qobuz Downloadstore), 5. timestamp of the music segment onset relative to the start of the recording [min.sec,ms], 6. duration of the music segment [sec] relative to the start of the music segment, 7. original tempo of excerpt [BPM; beats per minute] based on the taps of the authors and their colleagues and 8. frequency range [Hz] of the tempo-modulation (in 0.25 Hz steps) for each music piece.
| No. | Title | Artist | CD | Start [min] | Duration [sec] | Tempo [BPM/Hz] | Range [Hz] | |
|---|---|---|---|---|---|---|---|---|
| 1 | Abba Medley | Super Troopers | Instrumental Pop Hits | 7.30,71 | 22,99 | 136.09 / | 2.27 | 1.5–3.75 |
| 2 | Abba Medley | Super Troopers | Instrumental Pop Hits | 8.59,57 | 21,69 | 135.92 / | 2.27 | 1.75–4 |
| 3 | All is Alive | Francesco P. | Instrumental Hits, Vol.1 | 1.22,85 | 21,41 | 128.27 / | 2.14 | 1.5–4 |
| 4 | All is Alive | Francesco P. | Instrumental Hits, Vol.1 | 2.06,72 | 21,62 | 127.98 / | 2.13 | 1.5–4 |
| 5 | Apache | The Shadows | Rock Story "Instrumental Versions" | 0.39,59 | 14,78 | 135.22 / | 2.25 | 1.75–4 |
| 6 | Apache | The Shadows | Rock Story "Instrumental Versions" | 0.54,25 | 21,60 | 133.86 / | 2.23 | 1.75–4 |
| 7 | La Bikina | Rubén Fuentes Gasson | Bachata | 0.47,49 | 14,99 | 124.83 / | 2.08 | 1.75–4 |
| 8 | Bulldog | The Ventures | Rock Story "Instrumental Versions" | 0.06,15 | 18,13 | 151.33 / | 2.52 | 2–4 |
| 9 | Careless Whisper | Mads Haaber | Instrumental Pop Hits | 2.41,93 | 25,50 | 76.93 / | 1.28 | 1–2.75 |
| 10 | Cocaine | Corben Cassavette | Instrumental Pop Hits | 1.39,29 | 25,74 | 105.13 / | 1.75 | 1.5–4 |
| 11 | Dark Place | Beataddictz | Street Beatz, Vol.2 | 0.20,83 | 22,22 | 92.13 / | 1.54 | 1–3.75 |
| 12 | F.B. I. | The Shadows | Rock Story "Instrumental Versions" | 0.20,59 | 15,31 | 140.05 / | 2.33 | 1.25–4 |
| 13 | Five Trips | Tr3ntatr3 Giri | Instrumental Hits, Vol.1 | 1.48,79 | 16,48 | 123.24 / | 2.05 | 1.5–4 |
| 14 | Guybo | Eddie Cochran | Rock Story "Instrumental Versions" | 0.18,99 | 16,28 | 110.00 / | 1.83 | 1.5–3 |
| 15 | Gypsy Salsa, Cha Cha Beat | Corp Latino Dance Group | Hot Latin Dance | 1.57,06 | 24,26 | 100.04 / | 1.67 | 1.5–3 |
| 16 | Highway Riderz | Beataddictz | Street Beatz, Vol.2 | 0.19,61 | 30,30 | 97.13 / | 1.62 | 1–4 |
| 17 | In Go | Chuck Berry | Rock Story "Instrumental Versions" | 0.26,10 | 24,00 | 116.30 / | 1.94 | 1.5–4 |
| 18 | Oh by Jingo! | Chet Atkins | Rock Story "Instrumental Versions" | 0.07,47 | 23,59 | 120.55 / | 2.01 | 1–3.5 |
| 19 | Keep It 1,000 | Beataddictz | Street Beatz, Vol.2 | 1.13,87 | 25,10 | 78.06 / | 1.30 | 1–3 |
| 20 | The Last Day | Beataddictz | Street Beatz, Vol.2 | 1.27,40 | 22,52 | 88.13 / | 1.47 | 1–2.5 |
| 21 | For the Last Time | Beataddictz | Street Beatz, Vol.2 | 1.16,88 | 26,21 | 74.86 / | 1.25 | 1–3.25 |
| 22 | Lights Out | Beataddictz | Street Beatz, Vol.2 | 0.32,12 | 21,60 | 89.12 / | 1.49 | 1.25–3.5 |
| 23 | I like | Francesco P. | Instrumental Hits, Vol.1 | 1.34,19 | 27,95 | 112.13 / | 1.87 | 1.25–3.75 |
| 24 | Dark Line | Alex Cundari | Instrumental Hits, Vol.1 | 0.37,81 | 19,75 | 106.08 / | 1.77 | 1.25–3 |
| 25 | Live Forever | The Wonderwalls | Instrumental Pop Hits | 1.16,28 | 22,61 | 90.11 / | 1.50 | 1.5–3.75 |
| 26 | Lucy in the Sky with Diamonds | Ricardo Caliente | Instrumental Pop Hits | 2.43,55 | 23,93 | 81.11 / | 1.35 | 1–3.5 |
| 27 | Monalisa | Ken Laszlo | Instrumental Hits, Vol.1 | 1.13,37 | 29,79 | 129.97 / | 2.17 | 1.5–4 |
| 28 | Monalisa | Ken Laszlo | Instrumental Hits, Vol.1 | 2.13,01 | 28,80 | 130.02 / | 2.17 | 1.5–4 |
| 29 | Can't Fight the Moonlight | Jon Carran | Instrumental Pop Hits | 1.10,02 | 18,56 | 97.95 / | 1.63 | 1.5–3.75 |
| 30 | Muy Tranquilo | Gramatik | Muy Tranquilo | 2.05,1 | 26,59 | 90.04 / | 1.50 | 1–3.25 |
| 31 | No Mercy | Beataddictz | Street Beatz, Vol.2 | 0.12,15 | 26,41 | 76.11 / | 1.27 | 1–3.5 |
| 32 | I'm A Pusha | Beataddictz | Street Beatz, Vol.2 | 0.11,07 | 22,60 | 85.15 / | 1.42 | 1–3.25 |
| 33 | Rockin' the Blues Away | Tiny Grimes Quintet | Rock Story "Instrumental Versions" | 0.05,61 | 20,84 | 141.05 / | 2.35 | 1.5–4 |
| 34 | The Rocking Guitar | Ini Kamoze | Rock Story "Instrumental Versions" | 0.17,39 | 16,21 | 118.66 / | 1.98 | 1.5–3.25 |
| 35 | Country Rodeo Song | Marco Rinaldo | Country Instrumental Mix | 1.46,35 | 27,70 | 112.94 / | 1.88 | 1.5–3.75 |
| 36 | I Shot the Sheriff | Corben Cassavette | Instrumental Pop Hits | 0.19,52 | 25,54 | 94.12 / | 1.57 | 1.25–4 |
| 37 | Sing Sing Sing | Benny Goodman | Sing Sing Sing | 0.18,23 | 36,01 | 108.68 / | 1.81 | 1.5–3 |
| 38 | Si Una Vez | Pete Astudillo | Bachata | 0.46,54 | 16,95 | 124.54 / | 2.08 | 1.5–3 |
| 39 | I'm Still Standing | Ricardo Caliente | Instrumental Pop Hits | 0.39,14 | 21,72 | 86.04 / | 1.43 | 1.25–2.75 |
| 40 | Streets On Fire | Beataddictz | Street Beatz, Vol.2 | 0.23,33 | 24,99 | 81.16 / | 1.35 | 1–3.75 |
| 41 | Tequila | The Champs | Rock Story "Instrumental Versions" | 1.02,85 | 21,45 | 89.40 / | 1.49 | 1–3 |
| 42 | Vegas Dream | Vegas Project | Instrumental Hits, Vol.1 | 1.13,73 | 22,73 | 128.08 / | 2.13 | 1.5–3.25 |
| 43 | I Can't Wait | Alex Cundari | Instrumental Hits, Vol.1 | 0.23,73 | 24,08 | 83.59 / | 1.39 | 1–2.5 |
| 44 | Who Dat | Beataddictz | Street Beatz, Vol.2 | 1.15,58 | 24,50 | 87.10 / | 1.45 | 1–3.25 |
| 45 | Abba Medley | Super Troopers | Instrumental Pop Hits | 0.28,38 | 27,05 | 136.09 / | 2.27 | 1.25–4 |
| 46 | Abba Medley | Super Troopers | Instrumental Pop Hits | 5.09,89 | 21,71 | 136.09 / | 2.27 | 1–3 |
| 47 | Abba Medley | Super Troopers | Instrumental Pop Hits | 6.03,59 | 20,64 | 136.09 / | 2.27 | 1.5–4 |
| 48 | La Bikina | Rubén Fuentes Gasson | Bachata | 1.18,31 | 46,00 | 124.83 / | 2.08 | 1.75–4 |
| 49 | Bulldog | The Ventures | Rock Story "Instrumental Versions" | 0.44,98 | 19,20 | 151.33 / | 2.52 | 2–4 |
| 50 | Bulldog | The Ventures | Rock Story "Instrumental Versions" | 1.21,25 | 38,85 | 151.33 / | 2.52 | 2–4 |
| 51 | Careless Whisper | Mads Haaber | Instrumental Pop Hits | 3.09,44 | 24,41 | 76.93 / | 1.28 | 1–2.75 |
| 52 | Dark Place | Beataddictz | Street Beatz, Vol.2 | 1.45,73 | 35,10 | 92.13 / | 1.54 | 1–3.75 |
| 53 | F.B. I. | The Shadows | Rock Story "Instrumental Versions" | 0.37,30 | 20,91 | 140.05 / | 2.33 | 1.5–4 |
| 54 | Guybo | Eddie Cochran | Rock Story "Instrumental Versions" | 0.36,31 | 17,53 | 110.00 / | 1.83 | 1.5–3 |
| 55 | Highway Riderz | Beataddictz | Street Beatz, Vol.2 | 0.59,19 | 20,40 | 97.13 / | 1.62 | 1–4 |
| 56 | In Go | Chuck Berry | Rock Story "Instrumental Versions" | 0.48,42 | 26,80 | 116.30 / | 1.94 | 1.5–4 |
| 57 | Oh by Jingo! | Chet Atkins | Rock Story "Instrumental Versions" | 0.40,89 | 23,00 | 120.55 / | 2.01 | 1.25–3.5 |
| 58 | Live Forever | The Wonderwalls | Instrumental Pop Hits | 1.41,02 | 34,00 | 90.11 / | 1.50 | 1.25–3.5 |
| 59 | Live Forever | The Wonderwalls | Instrumental Pop Hits | 3.35,72 | 25,80 | 90.11 / | 1.50 | 1.25–3.5 |
| 60 | Lucy in the Sky with Diamonds | Ricardo Caliente | Instrumental Pop Hits | 3.06,40 | 23,00 | 81.11 / | 1.35 | 1–3.5 |
| 61 | Can't Fight the Moonlight | Jon Carran | Instrumental Pop Hits | 1.42,26 | 21,82 | 97.95 / | 1.63 | 1.5–3.75 |
| 62 | No Mercy | Beataddictz | Street Beatz, Vol.2 | 0.50,16 | 26,74 | 76.11 / | 1.27 | 1–3.5 |
| 63 | No Mercy | Beataddictz | Street Beatz, Vol.2 | 2.33,53 | 26,41 | 76.11 / | 1.27 | 1–3.5 |
| 64 | Rockin' the Blues Away | Tiny Grimes Quintet | Rock Story "Instrumental Versions" | 0.47,65 | 25,50 | 141.05 / | 2.35 | 1.5–4 |
| 65 | Rockin' the Blues Away | Tiny Grimes Quintet | Rock Story "Instrumental Versions" | 1.12,78 | 36,07 | 141.05 / | 2.35 | 1.5–4 |
| 66 | The Rocking Guitar | Ini Kamoze | Rock Story "Instrumental Versions" | 0.33,58 | 15,08 | 118.66 / | 1.98 | 1.5–3.25 |
| 67 | Country Rodeo Song | Marco Rinaldo | Country Instrumental Mix | 2.13,99 | 24,03 | 112.94 / | 1.88 | 1.5–3.75 |
| 68 | Sing Sing Sing | Benny Goodman | Sing Sing Sing | 1.08,65 | 18,87 | 108.68 / | 1.81 | 1.5–3 |
| 69 | Sing Sing Sing | Benny Goodman | Sing Sing Sing | 2.46,03 | 36,29 | 108.68 / | 1.81 | 1.5–3 |
| 70 | Si Una Vez | Pete Astudillo | Bachata | 1.03,70 | 29,27 | 124.54 / | 2.08 | 1.5–3 |
| 71 | Streets on fire | Beataddictz | Street Beatz, Vol.2 | 2.00,63 | 38,00 | 81.16 / | 1.35 | 1–3.75 |
| 72 | I Can't Wait | Alex Cundari | Instrumental Hits, Vol.1 | 1.10,71 | 34,48 | 83.59 / | 1.39 | 1–2.5 |
Additional files
Download links
A two-part list of links to download the article, or parts of the article, in various formats.
Downloads (link to download the article as PDF)
Open citations (links to open the citations from this article in various online reference manager services)
Cite this article (links to download the citations from this article in formats compatible with various reference manager tools)
Neural synchronization is strongest to the spectral flux of slow music and depends on familiarity and beat salience
eLife 11:e75515.
https://doi.org/10.7554/eLife.75515


