Loss of full-length dystrophin expression results in major cell-autonomous abnormalities in proliferating myoblasts
- School of Pharmacy and Biomedical Sciences, University of Portsmouth, United Kingdom
- INSERM UEVE UMR861, I-STEM, AFM, France
- Laboratory of Pharmacogenomics, Maj Institute of Pharmacology PAS, Poland
- School of Computing, Engineering and Digital Technologies, Teesside University, United Kingdom
- Laboratory of Cellular Metabolism, Nencki Institute of Experimental Biology, Poland
- Centre for Enzyme Innovation, University of Portsmouth, United Kingdom
- CNRS, I-STEM, AFM, France
Figures
Figure 1 with 1 supplement
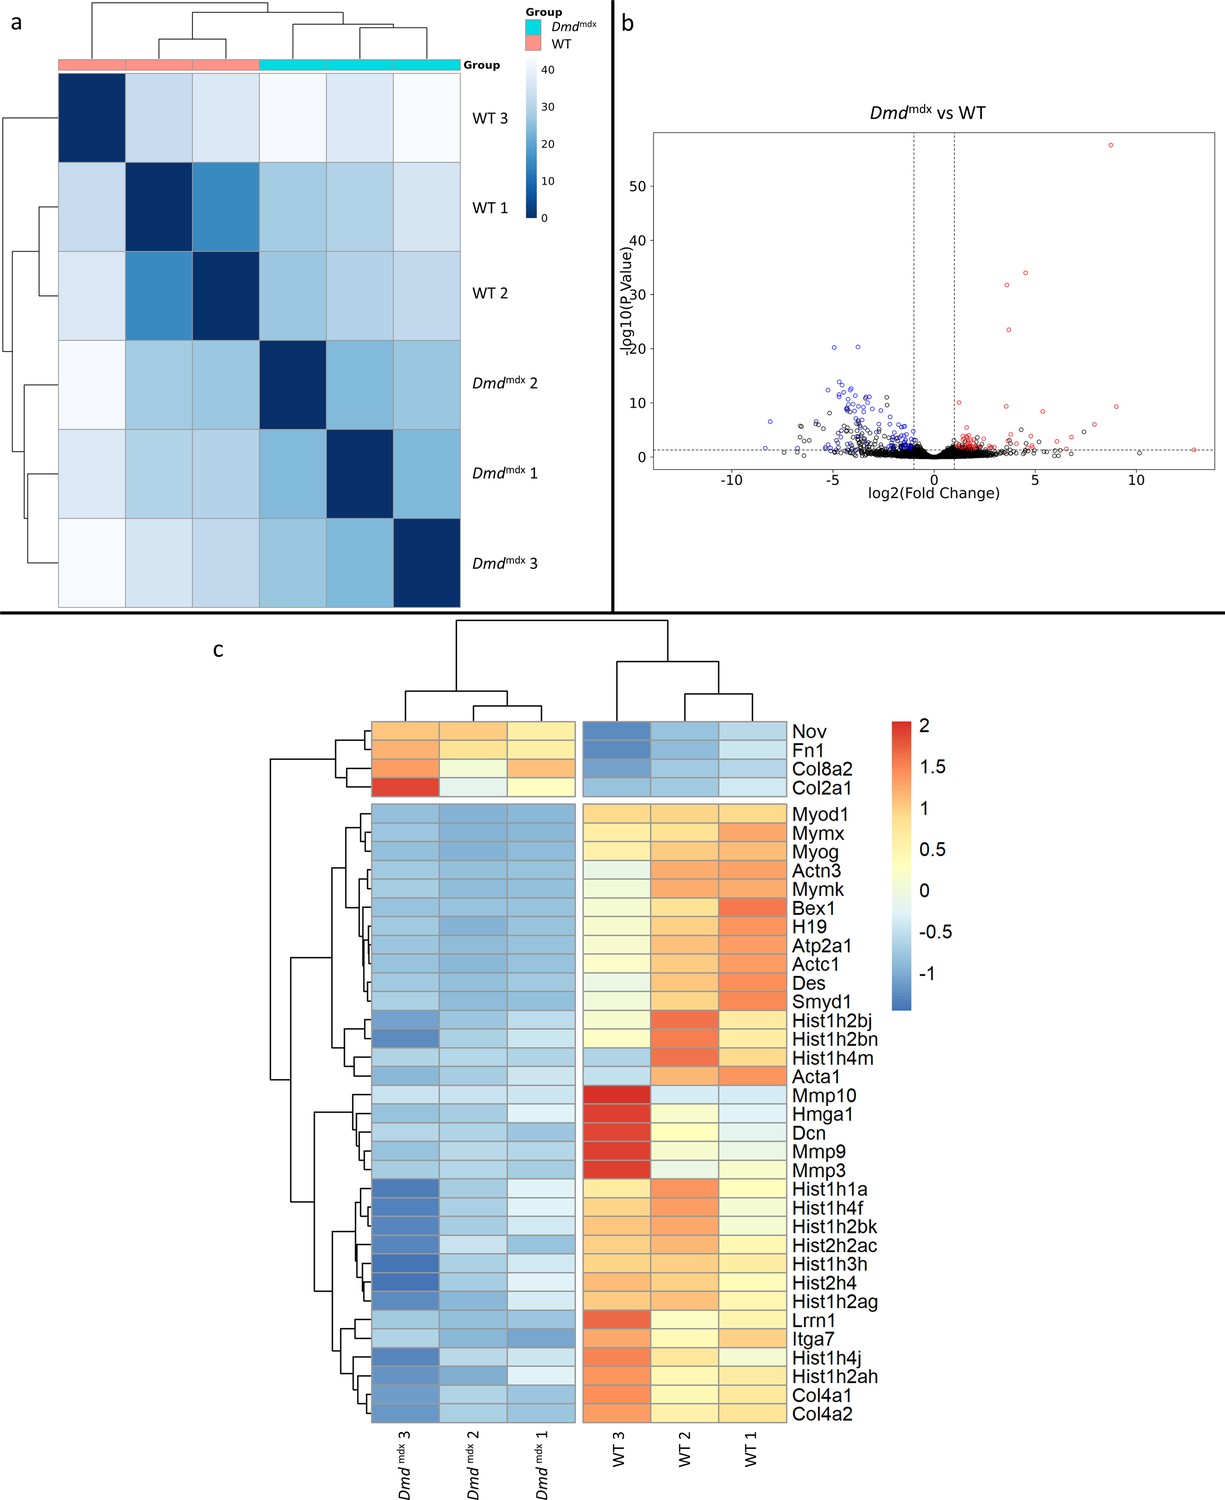
Differential gene expression between Dmdmdx and WT mouse primary myoblasts.
(a) Sample-based hierarchical clustering heatmap based on the top 500 genes with the highest standard deviation for Dmdmdx vs. WT based on RNA-Seq data. Colour represents dissimilarity between samples, based on the Euclidean distance, from dark blue (0) for identical samples to white (40) for the most distinct. (b) Volcano plot for Dmdmdx versus WT primary mouse myoblast differential gene expression analysis. Circles represent individual genes, with colour representing significance and direction of dysregulation (blue-significantly downregulated; red-significantly upregulated; black-not significantly dysregulated). Circle position represents fold change on a log2 scale for the x-axis and adjusted p-value on a -log10 scale for the y-axis. Horizontal dotted line represents the threshold of an adjusted p-value of 5.0e-2 or lower, while the vertical dotted lines represent the threshold for the absolute log2 fold change of 1. (c) Clustered heatmap of genes of interest from the dysregulated gene list of Dmdmdx vs. WT primary myoblasts. Colour represents the z-score such that each gene has a mean of 0 and standard deviation of 1 to allow direct comparisons.
Figure 1—figure supplement 1
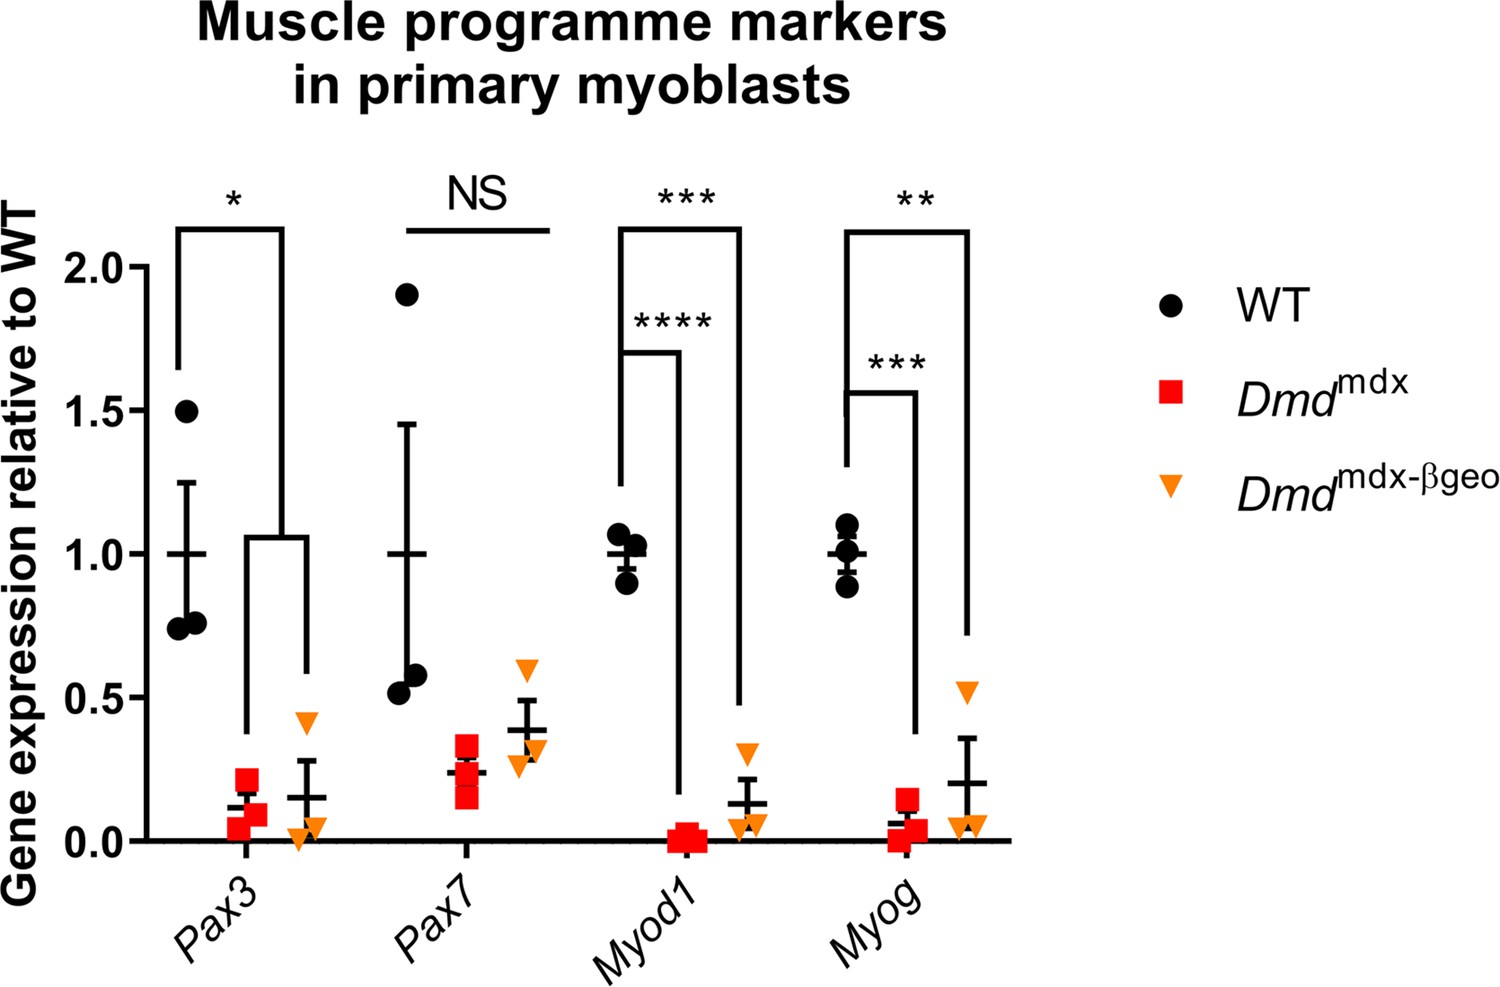
Differential expression of muscle programme markers in primary myoblasts from Dmdmdx and Dmdmdx-βgeo mice.
Results of qPCR expression analyses of indicated markers relative to wild type, normalized to Gapdh, shown as individual datapoints for biological replicates. Error bars represent mean ± SEM, n=3, *=p < 5.0e-2, **=p ≤ 1.0e-2, ***=p ≤ 1.0e-3, ****=p ≤ 1.0e-4 (Student’s unpaired t-test).
Figure 2
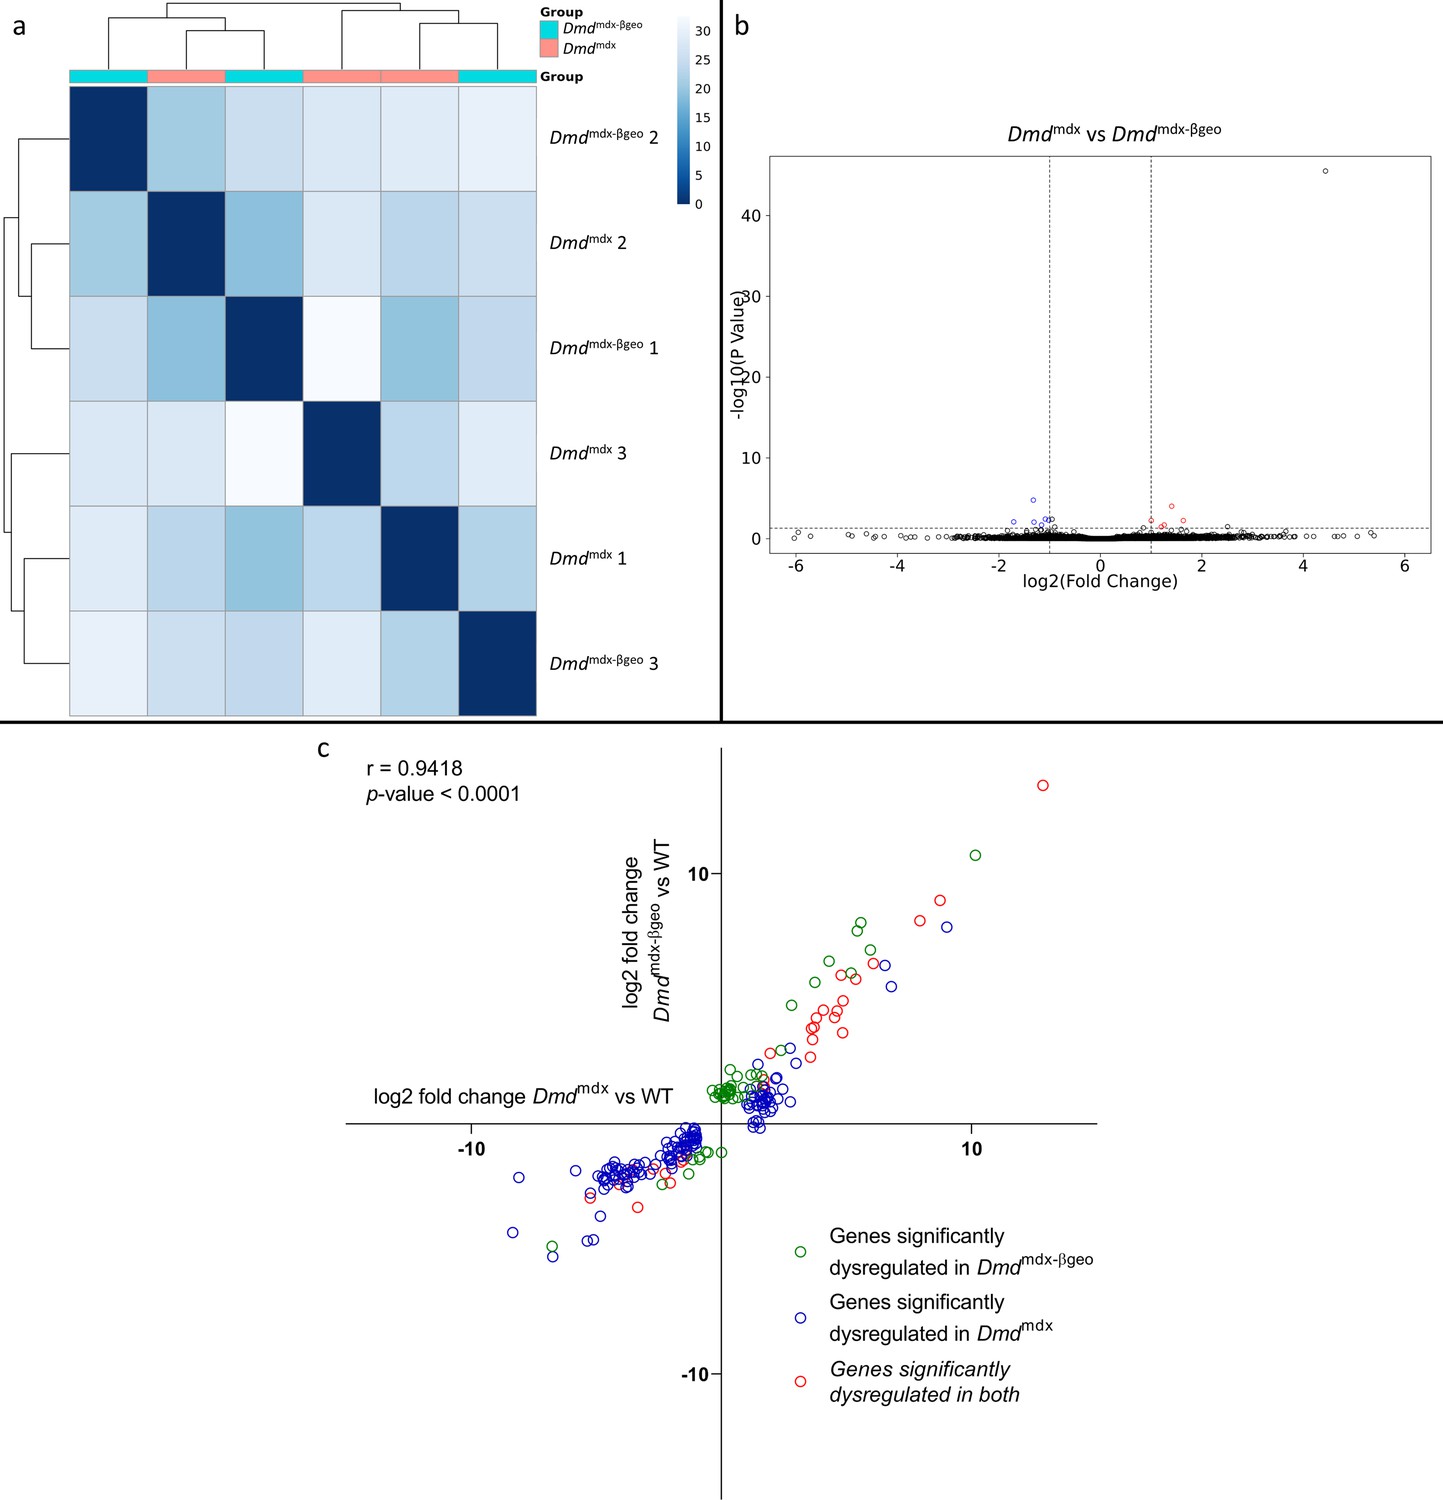
Correlation of significantly dysregulated gene expressions between Dmdmdx and Dmdmdx-βgeo vs WT.
(a) Sample-based hierarchical clustering heatmap based on the top 500 genes with the highest standard deviation for Dmdmdx-βgeo vs. Dmdmdx Colour represents dissimilarity between samples based on the Euclidean distance, from dark blue (0) for identical samples to white (40) for the most distinct. Note the absence of sample segregation into two groups corresponding to genotypes. (b) Volcano plot for Dmdmdx-βgeo vs. Dmdmdx primary mouse myoblast differential gene expression analysis. Circles represent individual genes, with colour representing significance and direction of dysregulation (blue-significantly downregulated; red-significantly upregulated; black-not significantly dysregulated). Circle position represents fold change on a log2 scale for the x-axis and adjusted p-value on a -log10 scale for the y-axis. Horizontal dotted line represents the threshold of an adjusted p-value of 5.0e-2 or lower while the vertical doted lines represent the threshold for the absolute log2 fold change of 1. (c) log2 fold change values (Dmdmdx versus WT on the x-axis and Dmdmdx-βgeo versus WT on the y-axis) for genes significantly dysregulated in one or both dystrophic primary mouse myoblasts vs. WT. Pearson’s correlation coefficients (r) and p-value are shown. Green circles represent genes significantly dysregulated in Dmdmdx-βgeo vs. WT, blue circles represent genes significantly dysregulated in Dmdmdx vs. WT and red circles represent gernes significantly dysregulated in both.
Figure 3
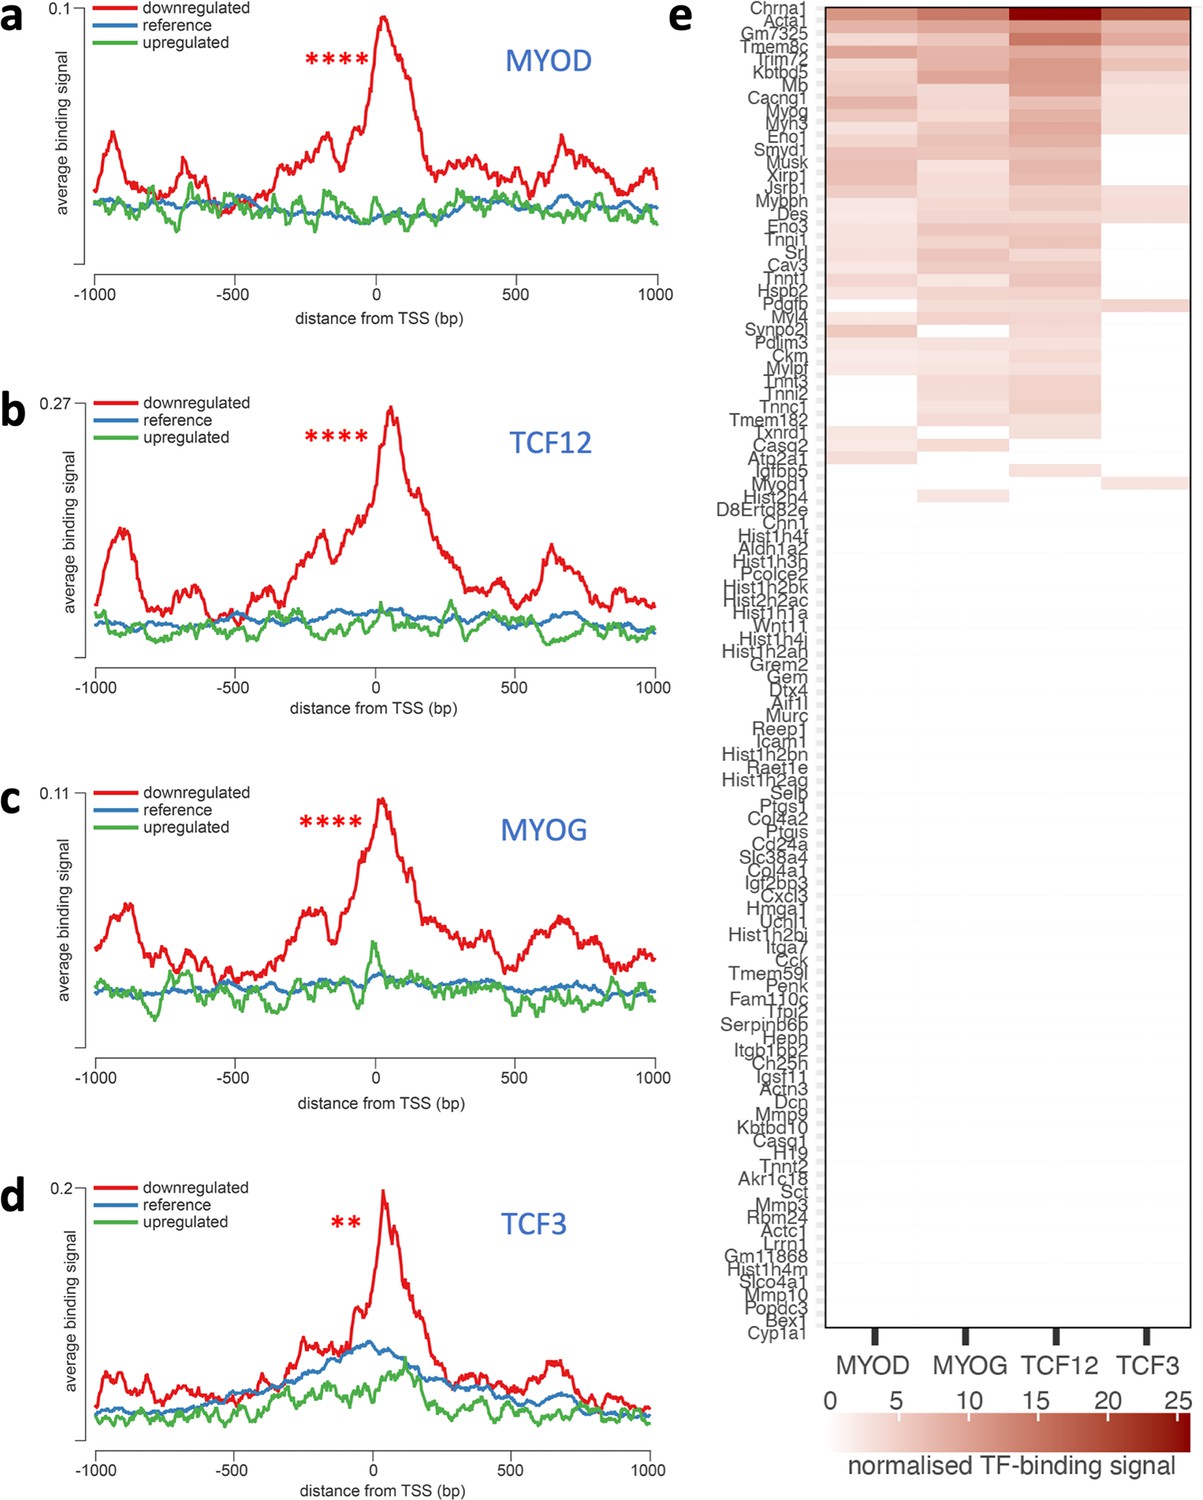
Overrepresentation of TF binding sites in genes downregulated in Dmdmdx myoblasts.
Averaged ChIP-Seq signal histograms for each of the significantly overrepresented TFBS in downregulated genes. Histograms are centred around the transcription start site (TSS) of each gene. x-axis – distance upstream and downstream from the TSS of each gene, y-axis - ChIP-Seq signal for each location averaged for all gene promoters in the submitted list; red line - downregulated genes, blue line - upregulated genes, green line - reference signal (based on 1000 random gene promoters); Bonferroni-corrected p-value of TF signal overrepresentation vs reference: ***<1.0e-3; **<1.0e-2. (a) MYOD (adjusted p-value: 2.9e–21, track GEO accession GSM915165), (b) TCF12 (1e–19, GSM915178), (c) MYOG (5.6e–19, GSM915164); (d) TCF3 (0.0033, GSM915177); (e) Heatmap of normalised TF-binding signal for each of the TFs overrepresented in genes downregulated in Dmdmdx myoblasts. Genes that did not show significant binding above background (as provided by the seqinspector tool) were assigned TF binding signal of 0.
Figure 4 with 1 supplement
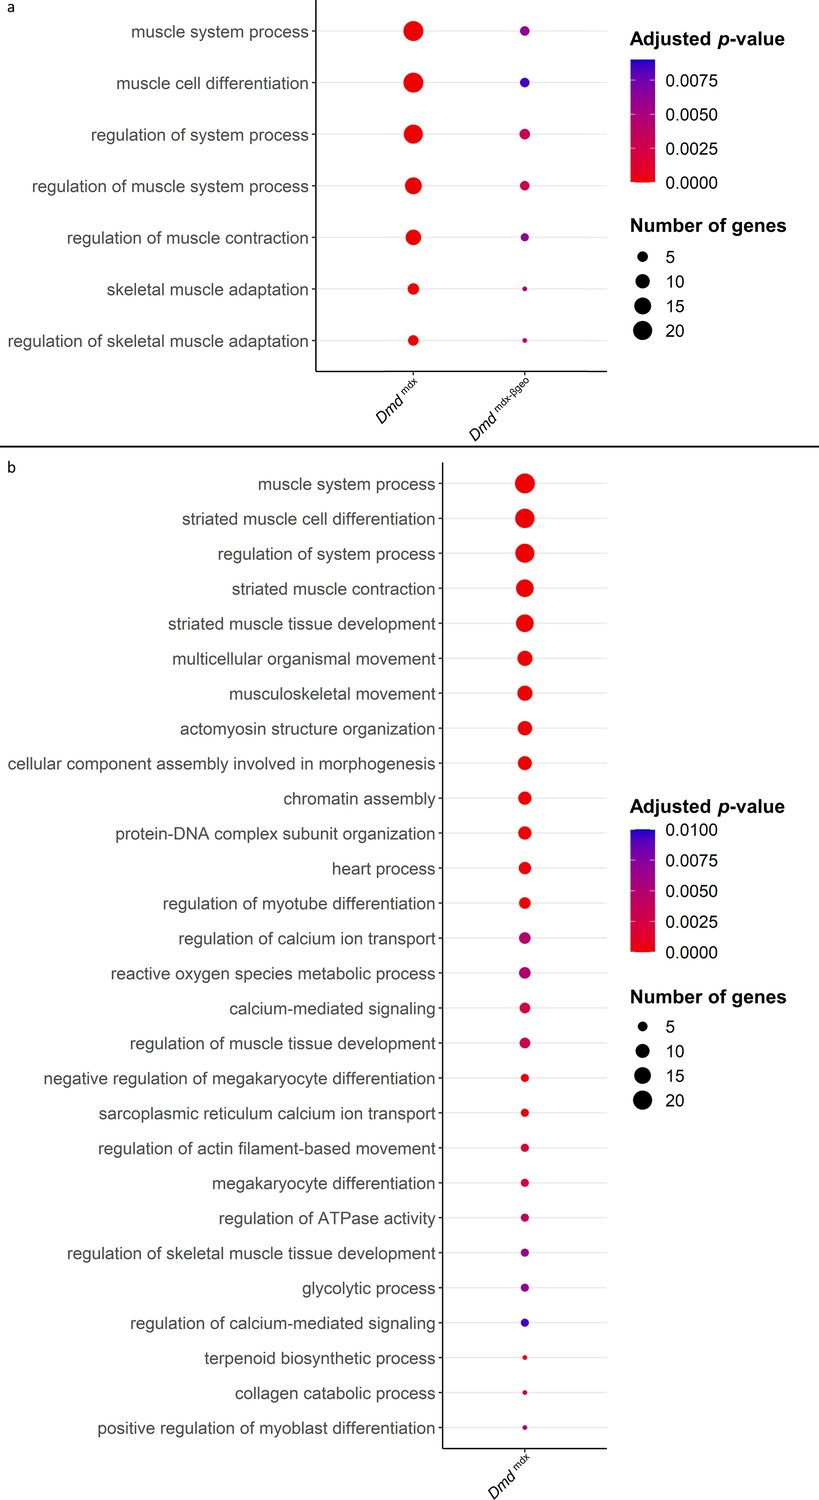
Results of GO category enrichment analysis for biological processes on significantly downregulated gene lists from Dmdmdx and Dmdmdx-βgeo versus WT differential gene expression analyses.
(a) Bubble plot of the overlapping GO categories enriched in Dmdmdx and Dmdmdx-βgeo versus WT downregulated genes lists. Bubble size represents the number of genes from the downregulated gene lists belonging to the GO category and the bubble colour depicts the adjusted p-value from red (0) to blue (8.0e-3). (b) Bubble plot of GO categories enriched in Dmdmdx versus WT downregulated genes lists following REVIGO redundancy filtering (see Methods). Bubble size represents the number of genes from the downregulated gene lists belonging to the GO category and the bubble colour depicts the adjusted p-value from red (0) to blue (1.0e-2).
Figure 4—figure supplement 1

Immunodetection of the sarcomeric myosin heavy chain 4 in Dmdmdx and BL/10 in differentiated spheroids.
Representative immunofluorescence micrographs of sections across spheroids differentiated for 7 days showing presence of MYH4 protein (green). Cell nuclei stained with DAPI (blue). Scale (bar = 50 µm).
Figure 5 with 1 supplement
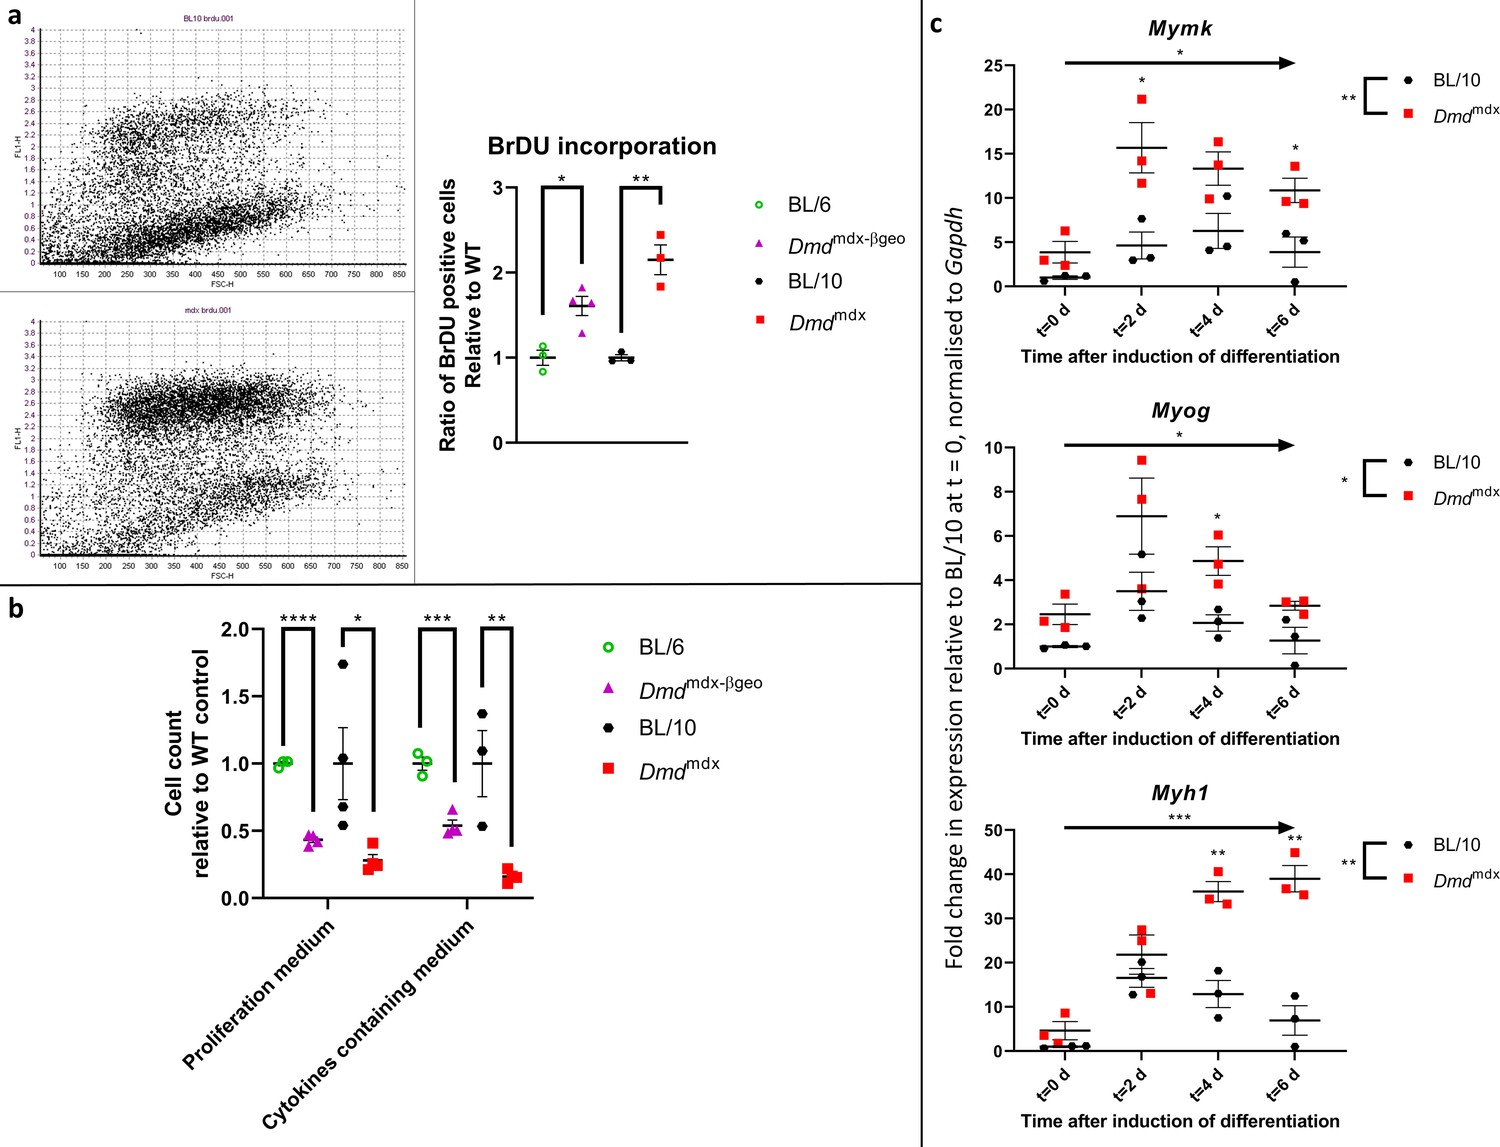
Dystrophic primary myoblasts show functional abnormalities.
(a) Proliferation analysis in myoblasts from Dmdmdx, Dmdmdx-βgeo, C57BL/10 and C57BL/6 mice using a BrdU incorporation assay. (Left) Representative examples of BrdU flow cytometric dot plots from C57BL/10 and Dmdmdx cells after 6 hr of incorporation, with FL-1 channel corresponding to BrdU fluorescence intensity and FSC channel denoting the cell size. (Right) Graph showing significantly increased proliferation of dystrophic myoblasts presented as ratio of BrdU-positive dystrophic cells relative to the respective wild type controls. Errors bars represent mean ± SEM, n=3 or 4, *=p ≤ 5.0e-2, **=p < 1.0e-2 (Student’s unpaired t-test). (b) Cell chemotaxis analysis in myoblasts from Dmdmdx, Dmdmdx-βgeo, and respective wild-type controls. Cells were seeded on a trans-well insert and allowed to penetrate towards the bottom well containing either proliferation medium or serum-free medium complemented with cytokines. Graph shows significantly reduced chemotaxis of dystrophic myoblasts represented as the relative number of cells present on the well-side of the membrane after 12 hr. Error bars represent mean ± SEM, n=3 or 4, *=p < 5.0e-2, **=p < 1.0e-2 and ***=p < 1.0e-3 (Student’s unpaired t-test). (c) Altered expression of differentiation markers in Dmdmdx compared to C57BL/10 myoblasts. Results of qPCR expression analyses of Myh1, Myog, and Mymk markers at specific timepoints over the 6-day period of spheroid differentiation. Individual values for biological replicates normalised to Gapdh expression and relative to wild type values at the commencement of differentiation (t=0) are shown. Error bars represent mean ± SEM, n=3, *=p ≤ 5.0e-2, **=p < 1.0e-2 and ****=p < 1.0e-4 (two-way ANOVA was used to determine the statistical significance between groups and time-points over the 6-day period and Fisher’s LSD was used to determine which timepoints exhibited a significant difference between groups).
Figure 5—figure supplement 1
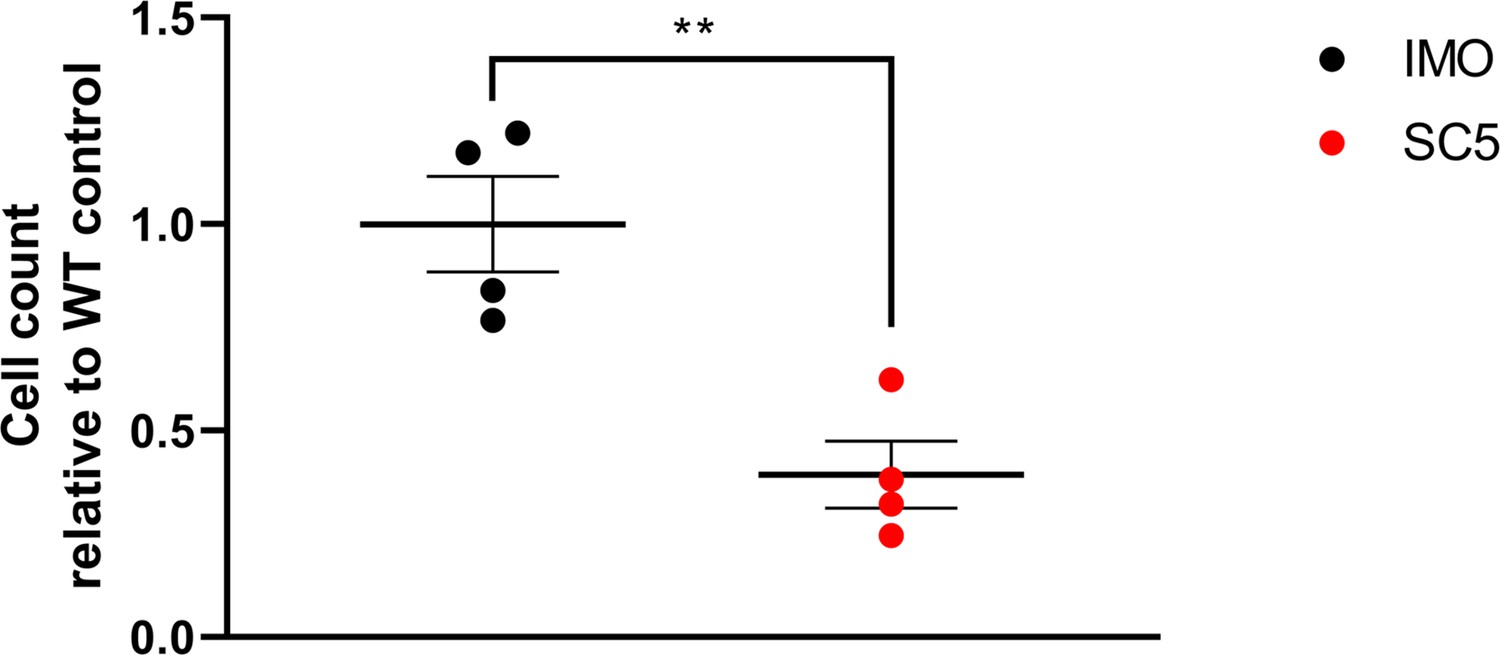
Decreased cell chemotaxis of dystrophic established mouse myoblasts.
In the trans-well assay, cells were migrating towards the well containing proliferation medium. Graph shows relative values of individual replicates revealing significantly reduced movement of dystrophic cells compared to their WT equivalent. Error bars represent mean ± SEM, n=4, **=p < 1.0e-2 (Student’s unpaired t-test).
Figure 6
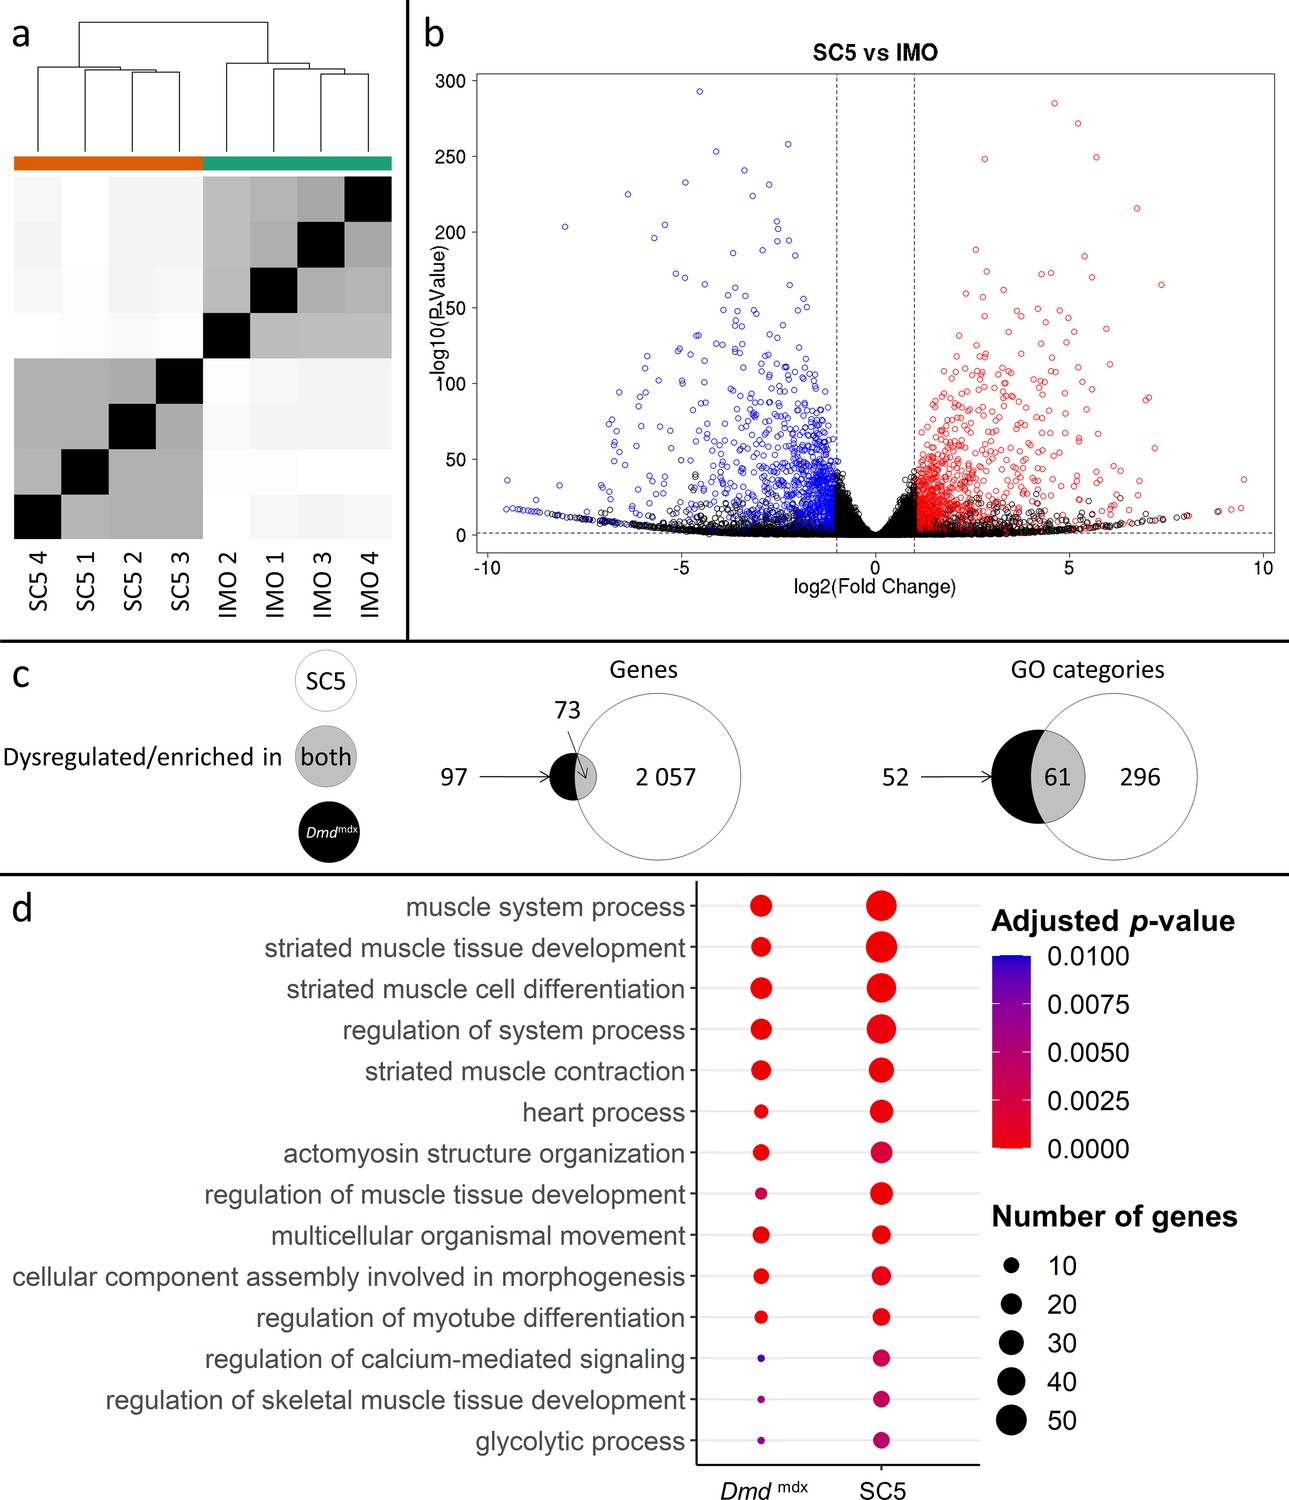
Correlation of significantly dysregulated gene expressions between mouse dystrophic and WT myoblast cell lines (SC5 vs.IMO) and of significantly enriched GO categories in the downregulated gene list for primary Dmdmdx myoblasts and corresponding cell lines.
(a) Sample-based hierarchical clustering heatmap, colour represents dissimilarity between samples based on the Euclidean distance, from black for identical samples to white for more distinct samples. (b) Volcano plot, showing the results of differential expression analysis between SC5 and IMO. Circles represent individual genes, with their colour representing significance and direction of dysregulation (blue-significantly downregulated; red-significantly upregulated; black-not significantly dysregulated). Circle position represents fold change on a log2 scale for the x-axis and adjusted p-value on a -log10 scale for the y-axis. Horizontal dotted line represents the threshold of an adjusted p-value of 5.0e-2 while the vertical doted lines represent the threshold for the absolute log2 fold change of 1. (c) Venn diagrams representing the overlap between genes dysregulated in SC5 and primary Dmdmdx myoblasts vs. WT as well as the overlap between GO categories for biological processes overrepresented in both downregulated gene lists. Number in the white circle enumerates dysregulated genes or enriched GO categories in SC5 vs. IMO, black circle those of Dmdmdx vs. WT and grey area numbers represent overlap between these two sets. (d) Bubble plot of the overlapping GO categories following redundancy filtering applied to the 61 categories identified (panel c). Bubble size represents the number of genes from the downregulated gene lists belonging to the category and bubble colour represents the adjusted p-value from red (0) to blue (1.0e-2).
Figure 7
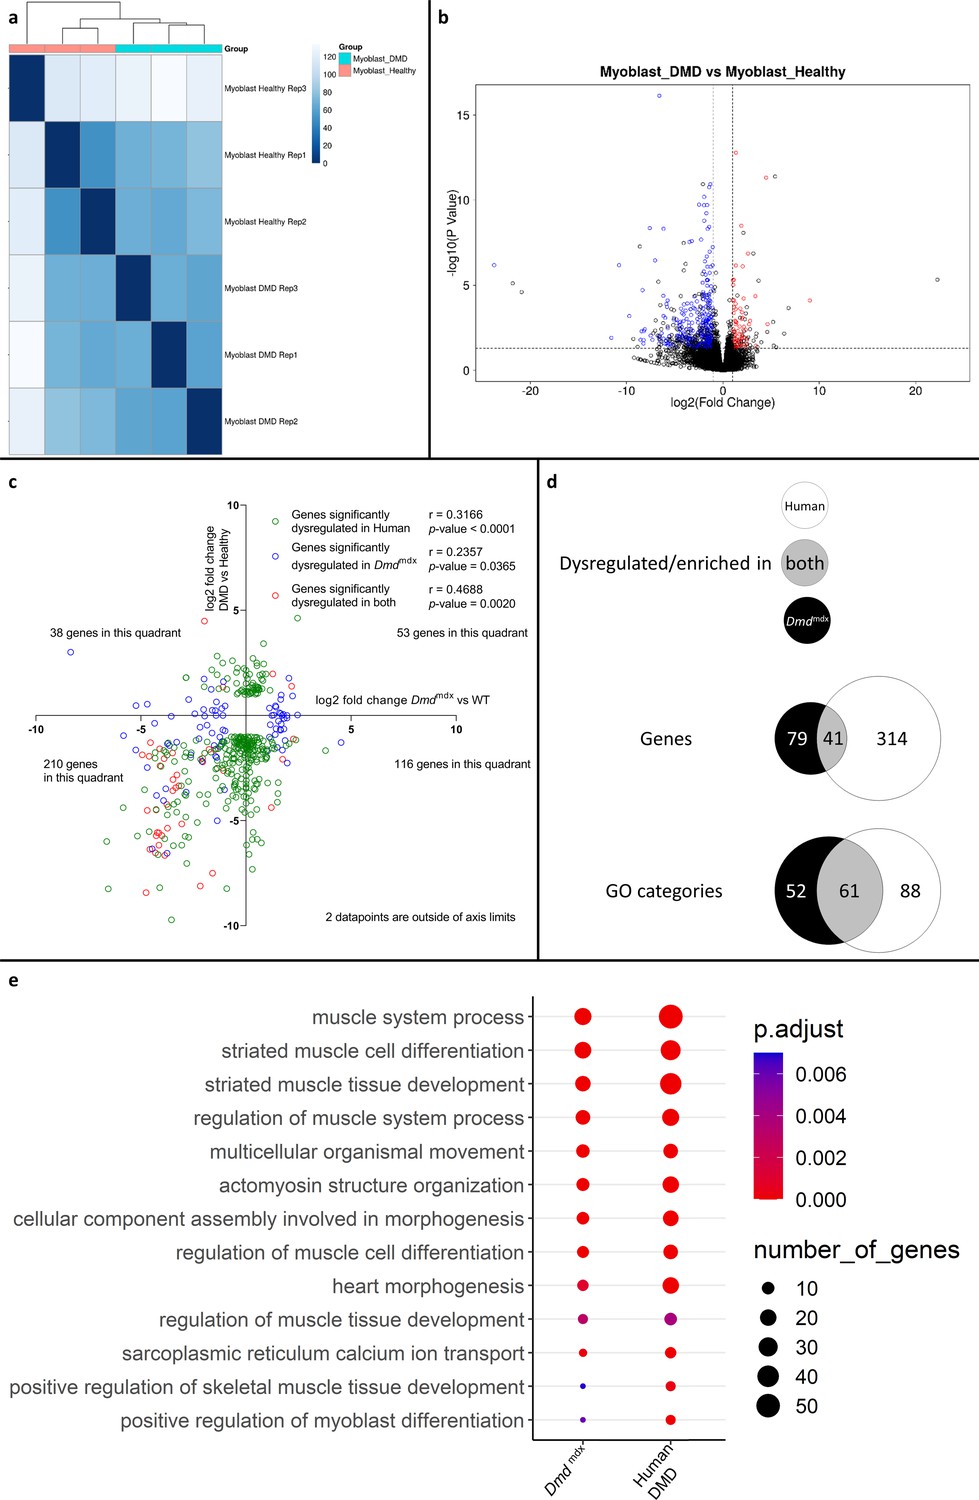
Correlation of significantly dysregulated gene expressions between human and mouse dystrophic and WT primary myoblasts and of the corresponding significantly enriched GO categories in the downregulated gene list for the human and Dmdmdx myoblast data.
(a) Sample-based hierarchical clustering heatmap, represented as described before. (b) Volcano plot, showing the results of differential expression analysis between DMD and healthy myoblasts. Circles represent individual genes, with their color representing significance and direction of dysregulation (blue-significantly downregulated; red-significantly upregulated; black-not significantly dysregulated). Circle position represents fold change on a log2 scale for the x-axis and adjusted p-value on a -log10 scale for the y-axis. Horizontal dotted line represents the threshold of an adjusted p-value of 5.0e-2 while the vertical doted lines represent the threshold for the absolute log2 fold change of 1. (c) log2 fold change values (Dmdmdx versus WT on the x-axis and human DMD versus WT on the y-axis) for genes significantly dysregulated in one or both dystrophic vs. WT primary myoblasts. Pearson’s correlation coefficients (r) and p-values are shown. Green circles represent genes significantly dysregulated in DMD, blue circles represent genes significantly dysregulated in Dmdmdx vs. WT and red circles represent genes significantly dysregulated in both. The number of genes found in each quadrant is shown. (d) Venn diagrams representing the overlap between genes dysregulated in primary human DMD and Dmdmdx myoblasts vs. WT as well as the overlap between GO categories for biological processes overrepresented in both downregulated gene lists. Number in the white circle enumerates dysregulated genes or enriched GO categories in human DMD vs. healthy, black circle those of Dmdmdx vs. WT and grey area numbers represent overlaps between these two sets. (e) Bubble plot of the overlapping GO categories following redundancy filtering applied to the 61 categories identified (panel d). Bubble size represents the number of genes from the downregulated gene lists belonging to the GO category and the bubble colour depicts the adjusted p-value from red (0) to blue (7.0e-3).
Figure 8
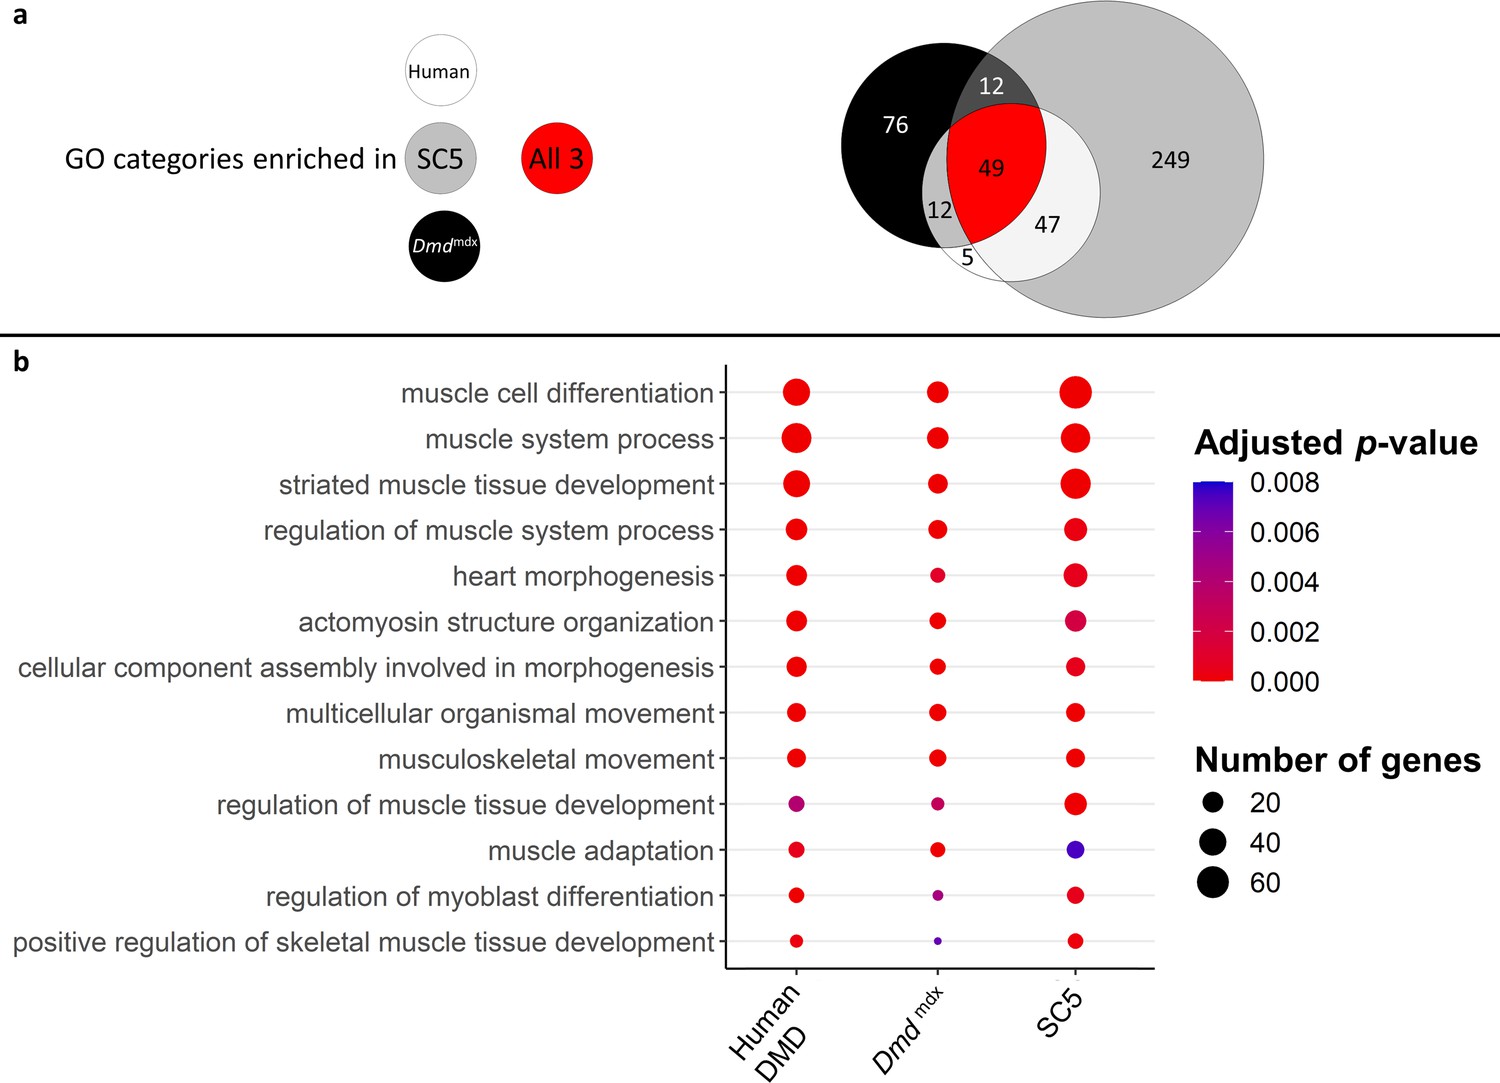
Correlation of enriched GO categories between primary Dmdmdx mouse myoblasts, Dmdmdx mouse myoblast cell line, and human primary DMD myoblasts.
(a) Venn diagram representing the overlap between GO categories for biological processes overrepresented in downregulated gene lists in primary human DMD, Dmdmdx myoblasts and established Dmdmdx myoblast cell line (SC5). Numbers in each area enumerate enriched GO categories in individual datasets and those overlapping (see the graphic legend). (b) Bubble plot of the overlapping GO categories following redundancy filtering applied to the 49 categories identified (panel a). Bubble size represents the number of genes from the downregulated gene lists belonging to the given GO category and bubble colour depicts the adjusted p-value from red (0) to blue (8.0e-3).
Figure 9 with 1 supplement
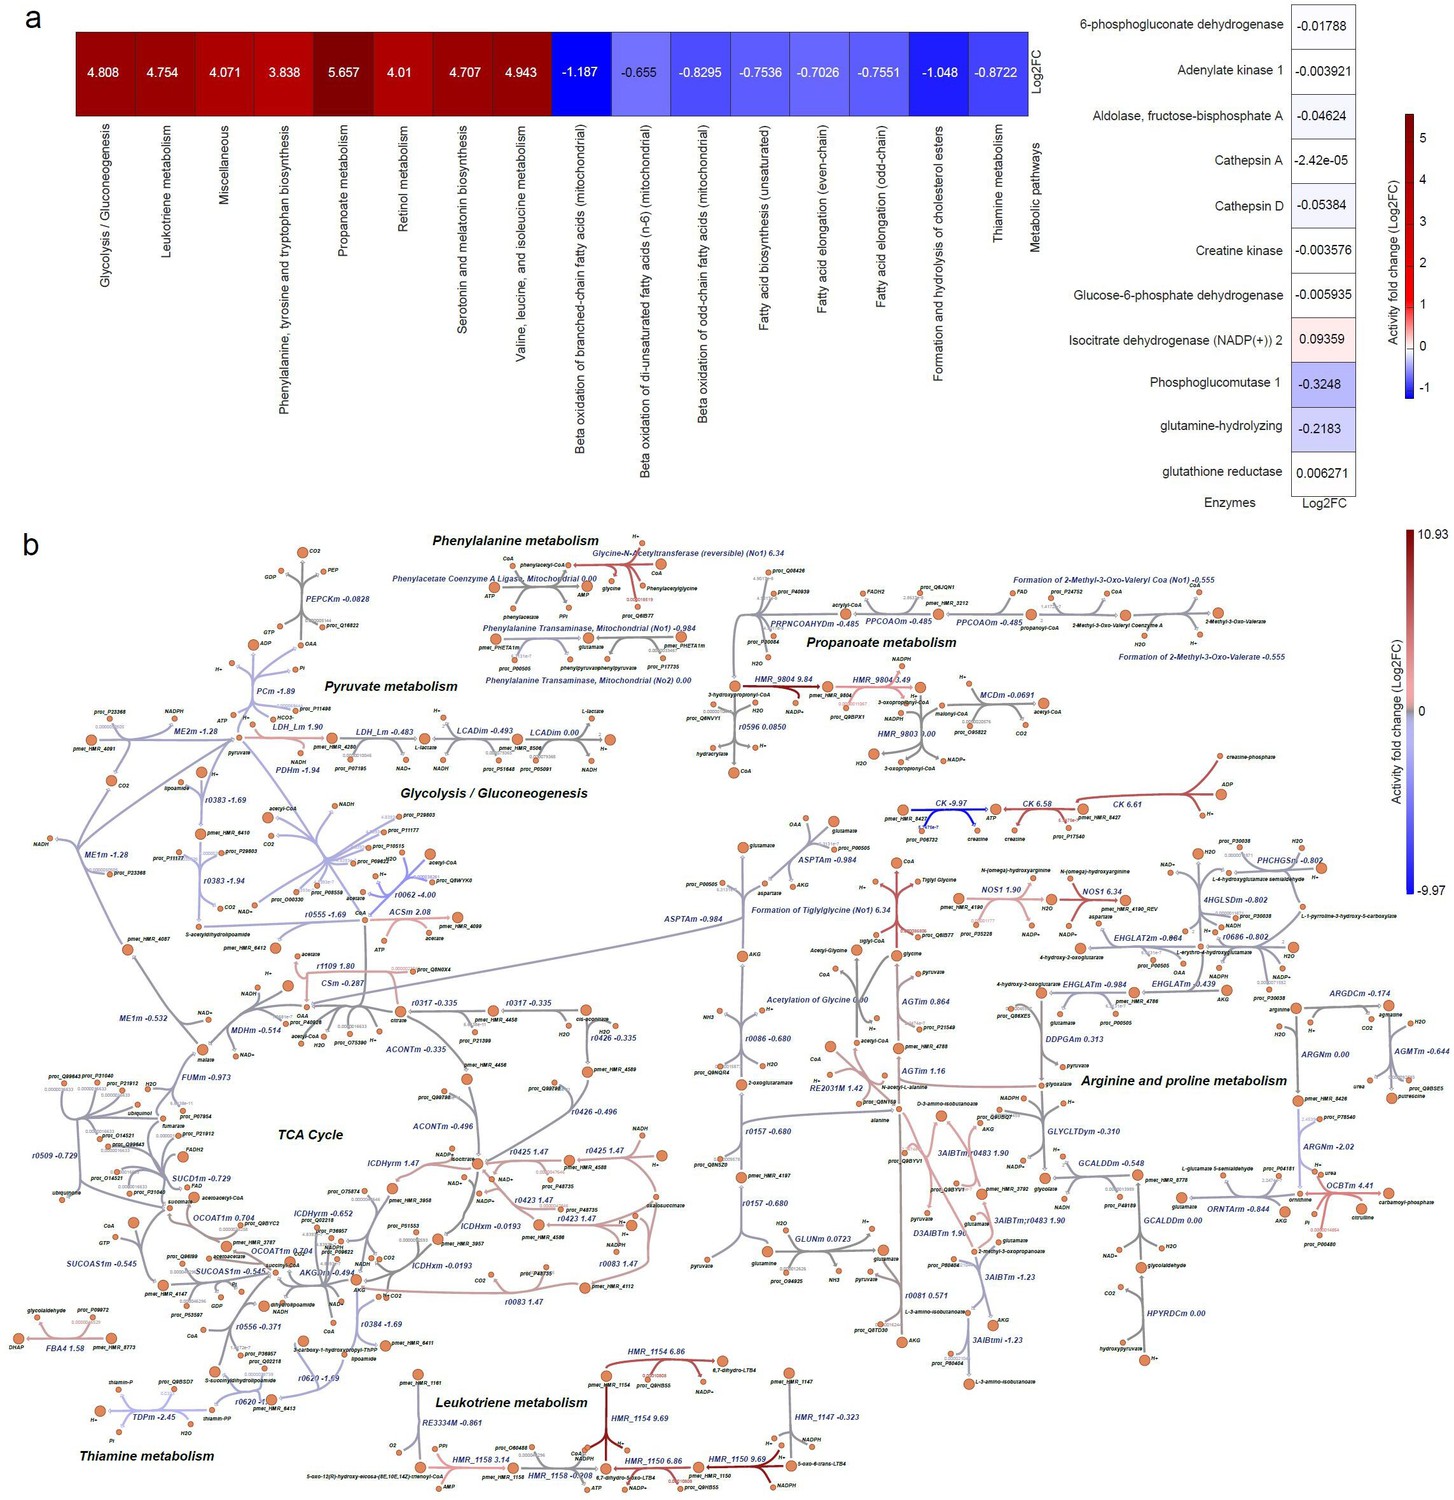
Metabolic pathway alterations in DMD primary myoblasts.
The differential log2FC of DMD-specific metabolic model was compared with respect to the healthy Human metabolic model. (a) Heatmap representing the differential metabolic activity of the pathways and proteins. (Left) Differential flux change of metabolic pathways. (Right) Flux fold change of the activity of enzymes, represented by proteins. (b) Visualisation of the alteration in the reactions in metabolic pathways. The red colour represents the upregulated or overactive metabolic pathways, and the blue colour represents the downregulated or underactive metabolic pathways. The full names of the reactions presented in Figure 10 are provided in Supplementary file 4.
Figure 9—figure supplement 1
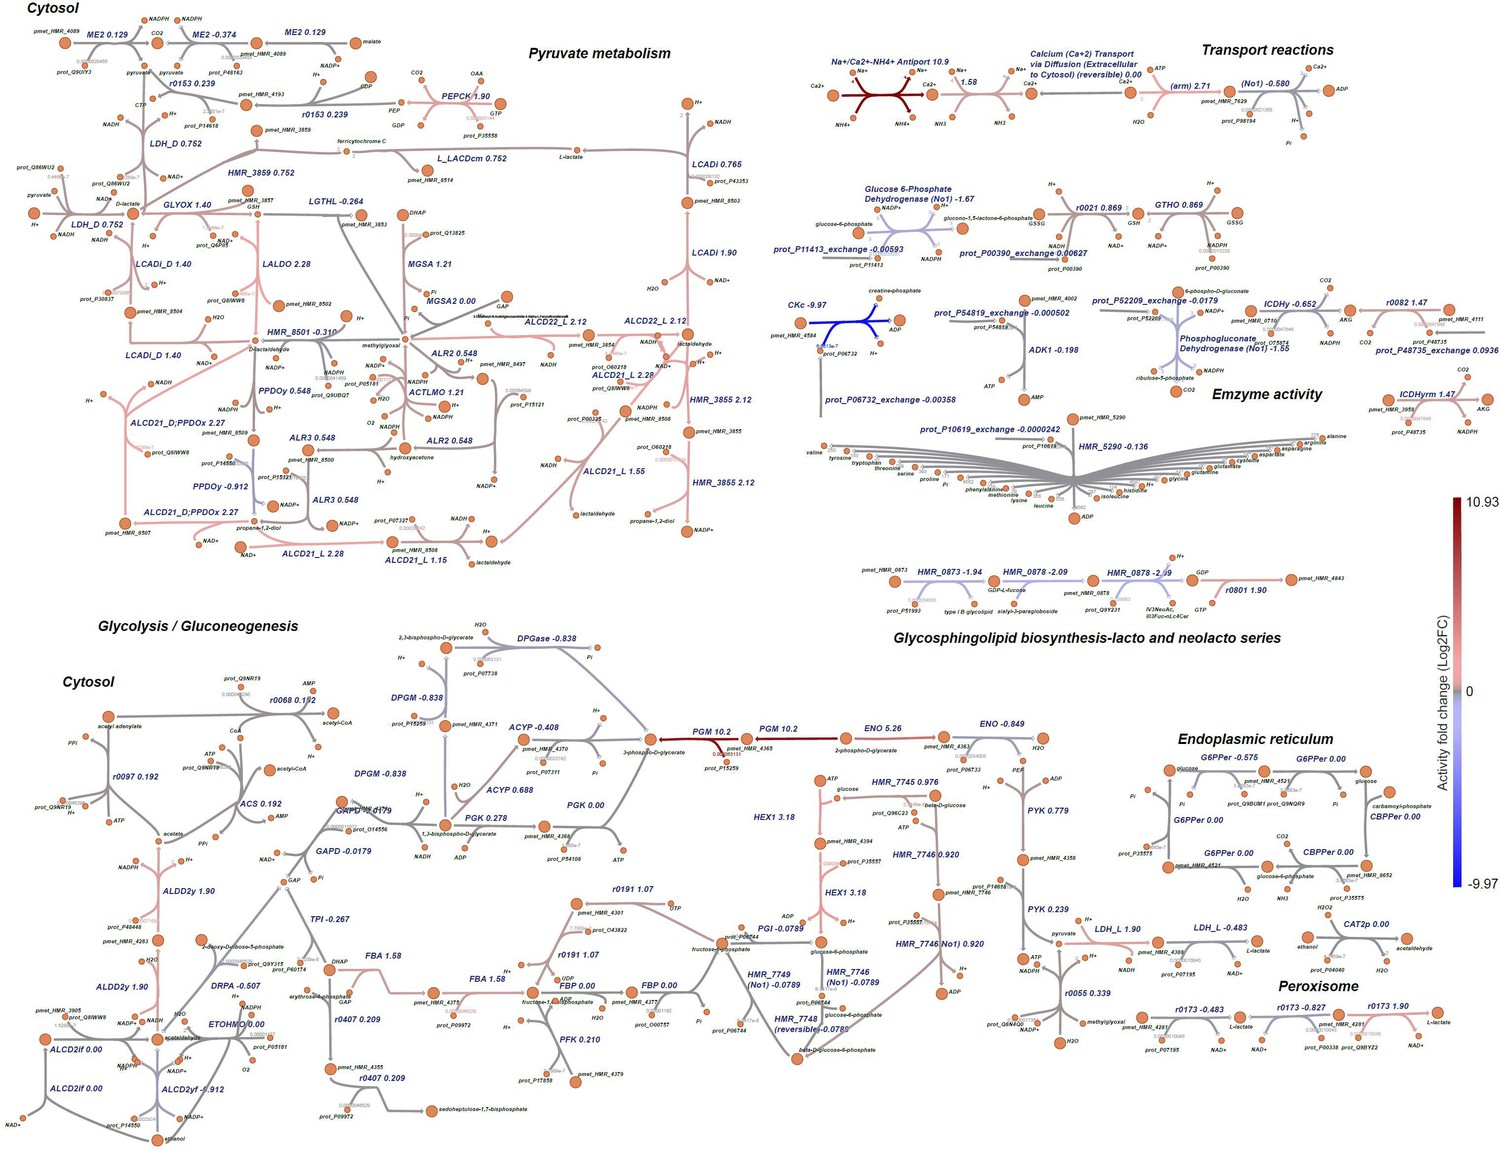
Differential metabolic pathway and reaction analysis.
Visualisation of the alteration in the reactions in pyruvate metabolism, glycolysis/gluconeogenesis metabolic pathway and glycosphingolipid biosynthesis-lacto and neolacto series pathway, transport reactions and enzyme activities. The red colour represents the upregulated or overactive metabolic pathways, and blue the downregulated or underactive ones. See Supplementary file 4 for the full name of the reactions.
Figure 10
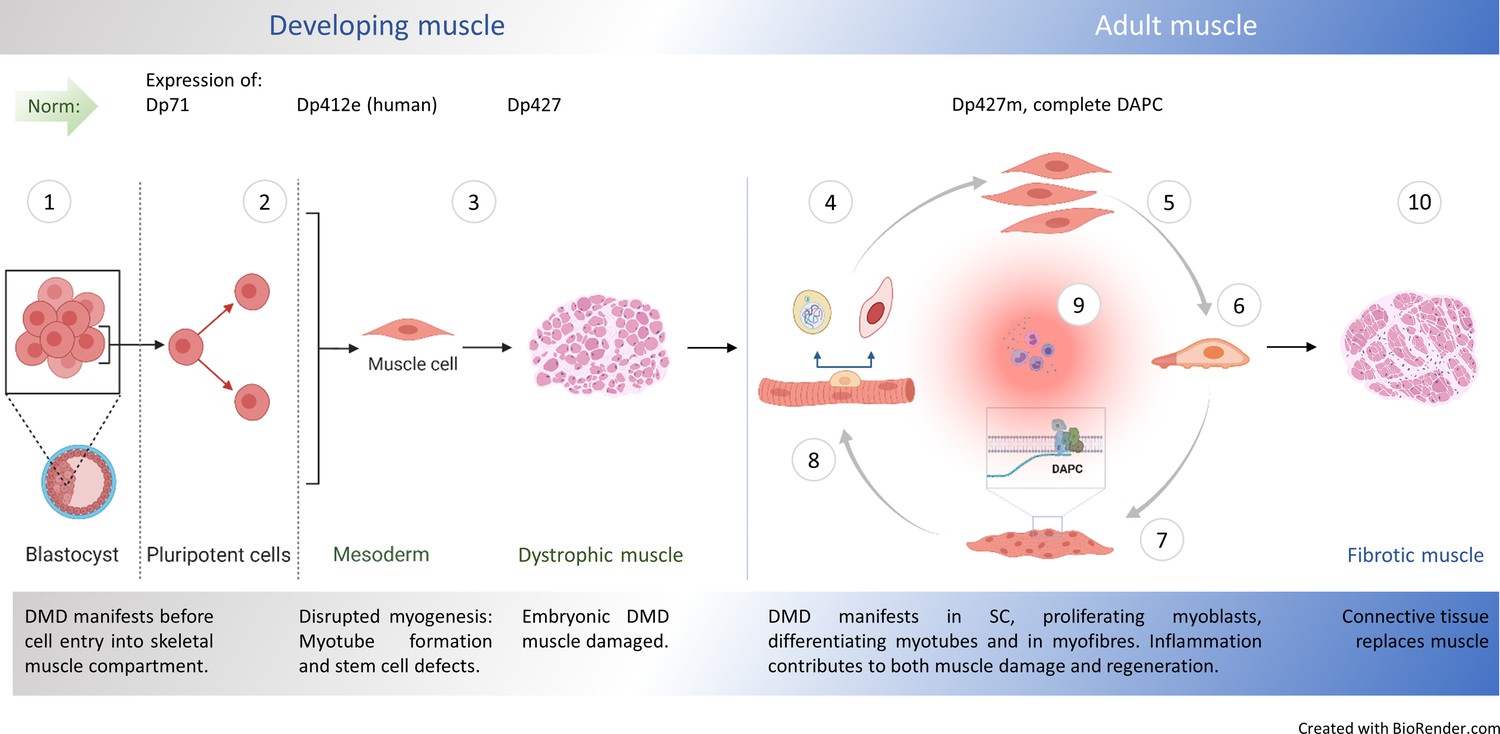
Natural history of DMD.
① Embryonic stem cells (ES) express dystrophin Dp71 Rapaport et al., 1992 but its loss is not linked with arrested development. Yet, minor admixture of ES lacking Dp427 results in severe dystrophy Gonzalez et al., 2017: Defects in myogenic stem cells (SC) descendant from DMD ES must be responsible, because in myofibre syncytium, lack of dystrophin caused by small proportion of DMD nuclei would be compensated and damage prevented. Early mesoderm committed human cells express Dp412e Massouridès et al., 2015 and ② DMD manifests before entry into the skeletal muscle compartment Mournetas et al., 2021. ③ DMD abnormalities are found in dystrophic human Toop and Emery, 1977; Emery, 1977; Vassilopoulos and Emery, 1977, dog Nguyen et al., 2002, zebrafish Bassett et al., 1977 and mouse embryos, with stem cell dysfunctions (hyperproliferation and death), disrupted myotube formation Merrick et al., 2009 and fibrosis as intrinsic features in developing muscle Mournetas et al., 2021. Typical dystrophic abnormalities (e.g. high serum CK) occur in new-borns years before diagnosis van Dommelen et al., 2020; Pescatori et al., 2007. In adult muscle, healthy myogenic cells, myotubes and myofibres express Dp427 and DAPC assembles in differentiating fibres, supporting their functions. Impaired muscle regeneration occurs due to: ④ Cell-autonomous defects in dystrophic satellite cells (SC) affecting asymmetric cell divisions Sacco et al., 2010; Dumont et al., 2015b; Dumont et al., 2015a, ⑤ hyperproliferation of dystrophic myoblasts (this work) and purinergic hypersensitivity Górecki, 2016; Young et al., 2012, ⑥ anomalous migration of DMD myoblasts: reduced under physiological conditions (this work) but augmented in the inflammatory environment Young et al., 2018 and ⑦ accelerated dystrophic myoblast differentiation (this work and Yablonka-Reuveni and Anderson, 2006) with defects in differentiating myotubes lacking Dp427 Shoji et al., 2015. ⑧ Resulting mature muscle lacking DAPC show contraction-induced injury but dystrophin ablation in fully differentiated myofibres does not trigger muscular dystrophy Rader et al., 2016; Ghahramani Seno et al., 2008. ⑨ Chronic inflammation exacerbates muscle damage Sinadinos et al., 2015; Howard et al., 2021; Al-Khalidi et al., 2018, but specific inflammatory mediators are also needed for regeneration Tidball, 2017. ⑩ Muscle fibrosis intensifies, as the progressing loss of regenerative potential results in myofibres being replaced by the connective tissue.
Appendix 1—figure 1
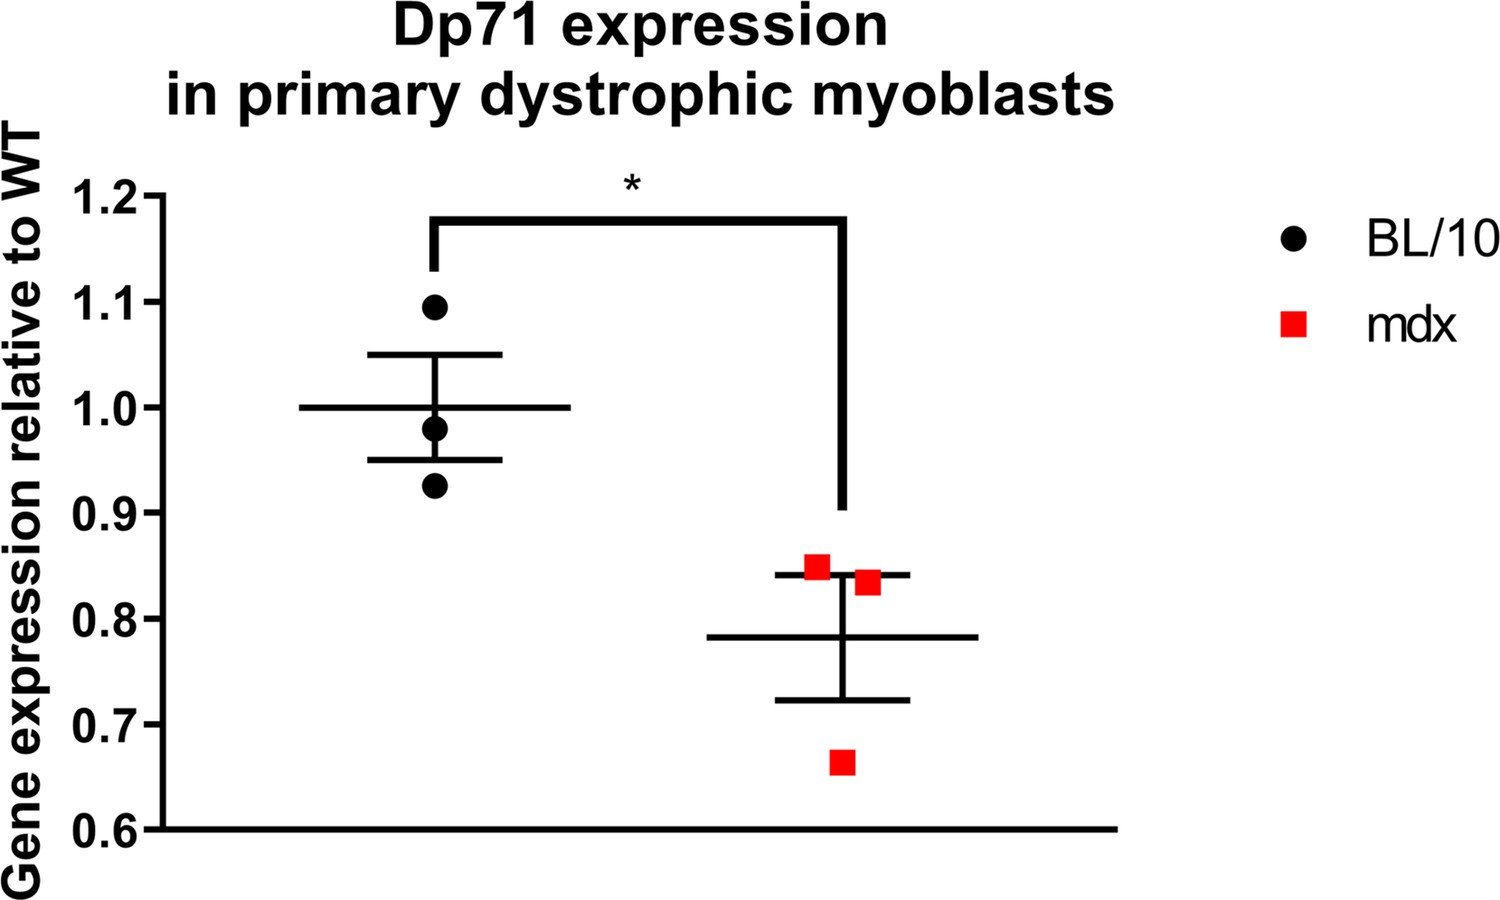
Decreased expression of Dp71 transcript in primary myoblasts from Dmdmdx mice.
Results of qPCR expression assay shown as normalised individual datapoints for biological replicates relative to wild type, normalised to Gapdh. Error bars represent mean ± SEM, n=3, *=p < 5.0e-2 (Student’s unpaired t-test).
Appendix 1—figure 2
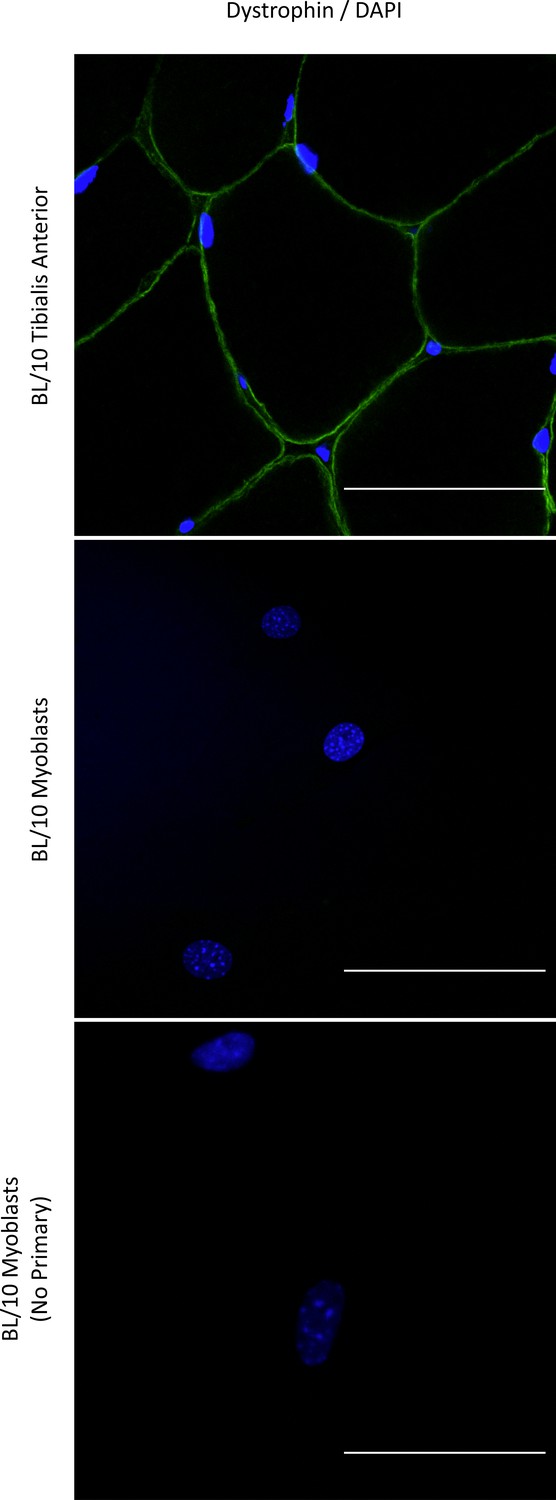
Immunodetection of Dp427 in WT primary mouse myoblasts.
Representative immunofluorescence micrographs of sections across C57BL/10 tibialis anterior muscle and primary Dmdmdx myoblasts stained with an antibody detecting epitopes in exons 31/32 of Dp427. Note the expected immunofluorescence signal (green) under the sarcolemma of myofibers and absence of any discernible dystrophin immunoreactivity in myoblasts in culture, reacted and imaged under conditions identical to those used for muscle sections. Negative (no primary antibody) control shown to indicate the signal specificity. Cell nuclei stained with DAPI (blue). Scale bar = 50 μm.
Appendix 1—figure 3
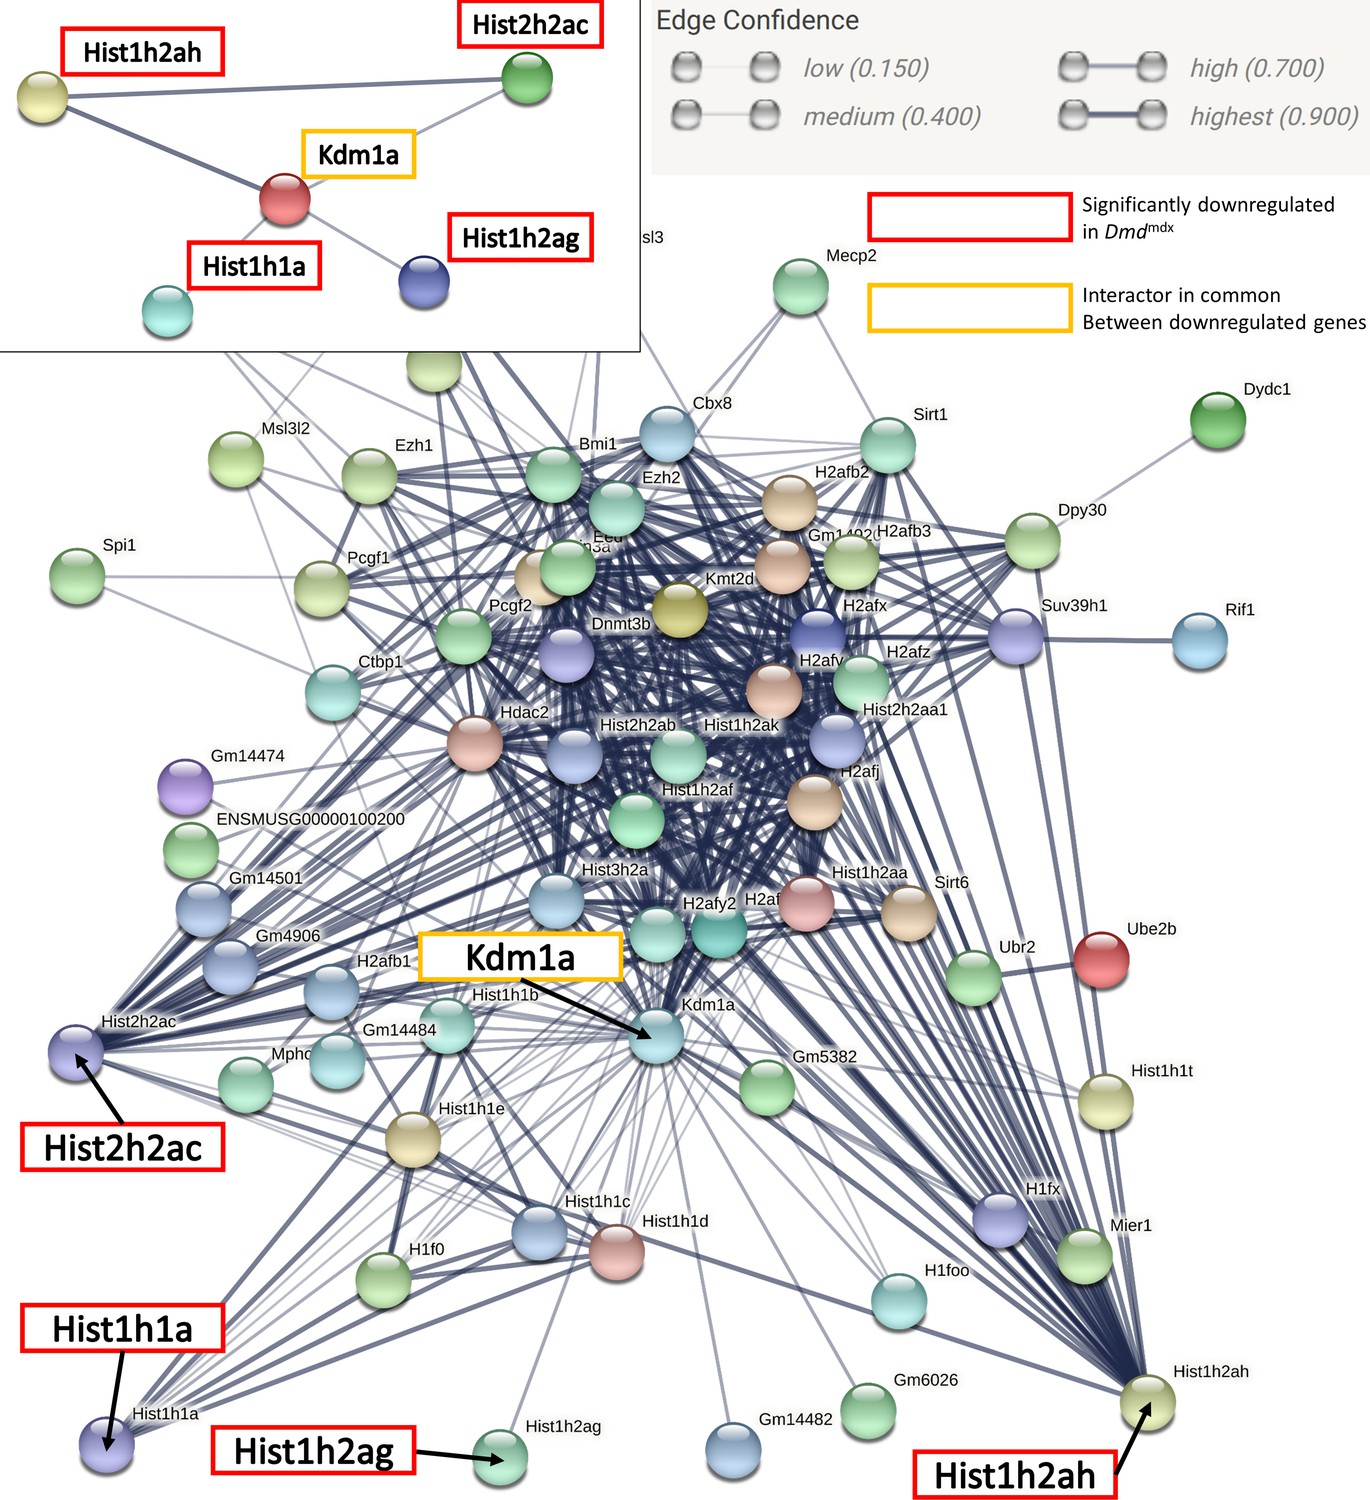
STRING interaction diagram of genes in the GO category: Negative regulation of gene expression, epigenetic.
Interaction network representing genes in GO:0045814. Each node depicts a gene; edges between nodes indicate interactions between protein products of the corresponding genes and the aggregated interaction scores from experimental data and interaction databases (see the Edge Confidence graphic legend for details). Genes significantly downregulated in dystrophic myoblasts are highlighted in red and the common interactor between all significantly downregulated genes (Kdma1) is highlighted in yellow. Isolated nodes are not shown.
Appendix 1—figure 4
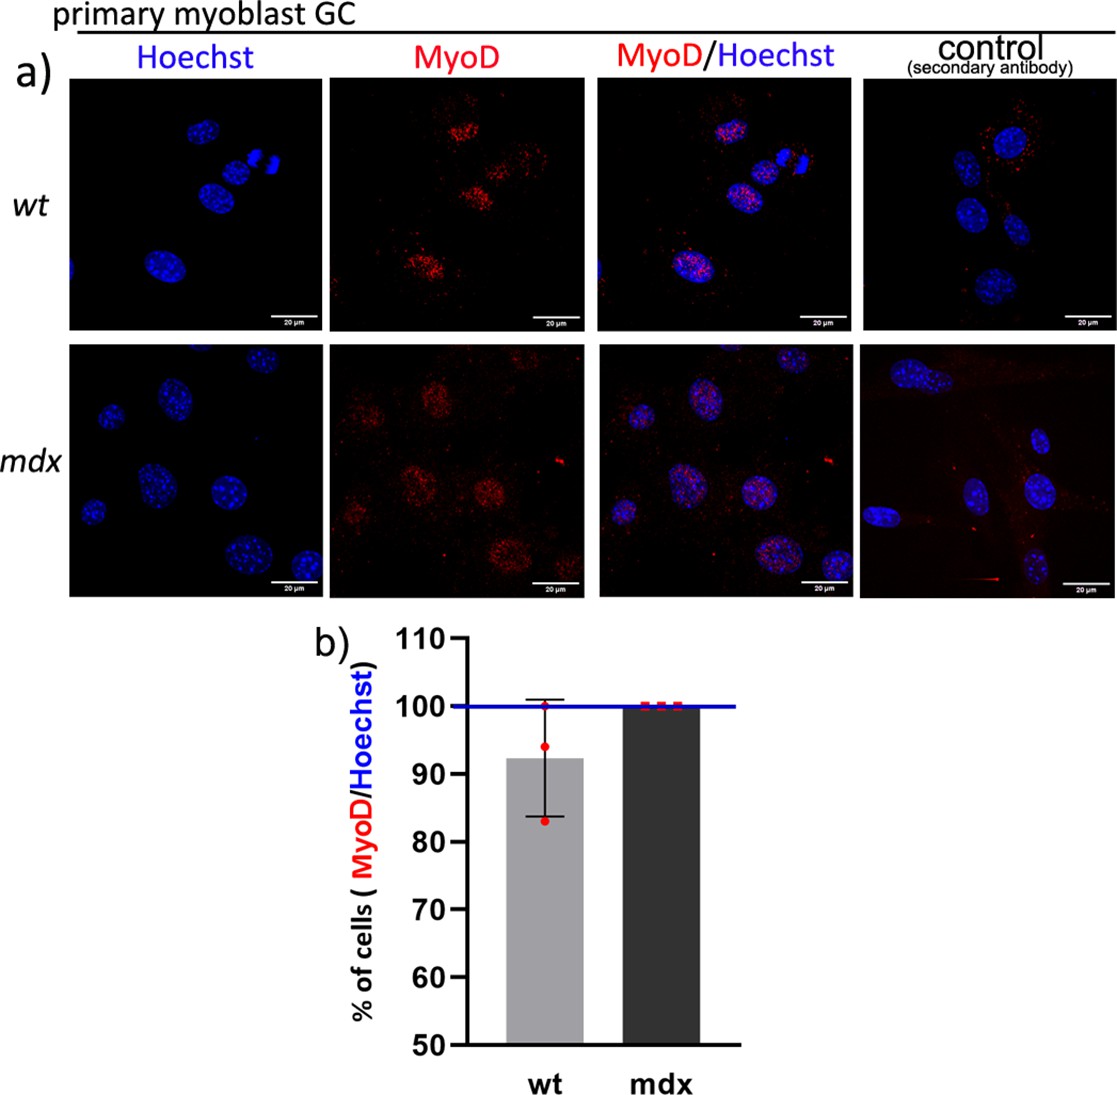
The purity of myoblasts isolated from the gastrocnemius muscle.
(a) Example MyoD staining (red signal) and Hoechst nuclear labelling (blue) in primary myoblast cultures isolated from mdx and wild-type gastrocnemii. Representative immunofluorescent image from three tiles are presented and the negative control (no primary antibody) is also shown. (Size bar = 20 μm). (b) Graph showing percentage of cells positive for MyoD from the total number of cells identified by the nuclei labelling with Hoechst enumerated using the counter cells function in the ImageJ software. The purity of wt and mdx myoblast cultures was between 93% and 100%. Error bars represent the mean number of cells with SD for three tile images and the difference is not statistically significant.
Additional files
-
Supplementary file 1
Includes 9 tables detailing the bioinformatics analyses.
1–1: Genes significantly dysregulated in Dmdmdx vs. WT primary myoblasts. From left to right, columns show ENSEMBL gene id, gene symbol, log2 fold change between Dmdmdx and WT primary myoblasts, adjusted p-value as output by DESeq2, average FPKM for Dmdmdx and WT groups. Genes are ordered from most downregulated to most upregulated. 1–2: Tabulation of genes significantly dysregulated in Dmdmdx-βgeo vs. WT primary myoblasts. From left to right, columns show ENSEMBL gene id, gene symbol, log2 fold change between Dmdmdx-βgeo and WT primary myoblasts, adjusted p-value as output by DESeq2, average FPKM for Dmdmdx-βgeo and WT groups. Genes are ordered from most downregulated to most upregulated. 1–3: GO categories significantly enriched in the downregulated gene lists from primary Dmdmdx vs. WT and Dmdmd-βgeo vs. WT. Columns A and D show the GO category ID, columns B and E show GO category description and columns C and F show adjusted p-value for GO categories enriched in the significantly downregulated genes in primary Dmdmdx and Dmdmdx-βgeo myoblasts, respectively. GO categories are ordered from the lowest (top) to the highest (bottom) p-value for each analysis and GO categories significantly enriched in both analyses are highlighted in red. 1–4: Genes significantly dysregulated in SC5 (dystrophic) vs. IMO (WT) myoblast cell line. From left to right, columns show ENSEMBL gene id, gene symbol, log2 fold change between SC5 and IMO primary myoblasts, adjusted p-value as outputted by DESeq2, average FPKM for SC5 and IMO groups. Genes are ordered from most downregulated to most upregulated. 1–5: GO categories significantly enriched in the downregulated gene lists from primary Dmdmdx vs. WT and SC5 vs. IMO cell lines. Columns A and D show the GO category ID, columns B and E show GO description and columns C and F show adjusted p-value for GO categories enriched in the significantly downregulated genes in SC5 myoblast cell line and primary Dmdmdx myoblasts, respectively. GO categories are ordered from the lowest (top) to the highest (bottom) p-value for each analysis and GO categories significantly enriched in both analyses are highlighted in red. 1–6: Genes significantly dysregulated in DMD vs. healthy primary human myoblasts. From left to right, columns show ENSEMBL gene id, gene symbol, log2 fold change between DMD and healthy human primary myoblasts, adjusted p-value as outputted by DESeq2, average FPKM for human DMD and health groups. Genes are ordered from most downregulated to most upregulated. 1–7: GO categories significantly enriched in the downregulated gene lists from dystrophic vs. WT human primary myoblasts and Dmdmdx vs. WT mouse primary myoblasts. Columns A and D show GO category ID, columns B and E show GO category description and columns C and F show adjusted p-values for GO categories enriched in the significantly downregulated genes in primary human DMD and mouse Dmdmdx myoblasts, respectively. GO categories are ordered from the lowest (top) to the highest (bottom) p-value for each analysis and GO categories significantly enriched in both analyses are highlighted in red. 1–8: Interactions between genes in the GO category GO:0045814: “Negative regulation of gene expression, epigenetic” generated in STRING. Columns A and B show nodes connected by an edge, column C shows the interaction score if one has been determined experimentally, column D shows the interaction score if an interaction is present in a database feeding into STRING and column E shows the combined interaction score. 1–9: Primers used in real-time quantitative PCR analysis. Primers were designed specifically except Gapdh primer set, which was taken from Otto et al., 2017.
- https://cdn.elifesciences.org/articles/75521/elife-75521-supp1-v1.xlsx
-
Supplementary file 2
Includes the tables detailing the identification of putative molecular regulators of genes altered in Dmdmdx myoblasts.
The overrepresentation of binding sites for transcriptional regulators in the promoter region of the altered transcripts was identified using the seqinspector online resource (see Materials and methods). 2 A TFBS analysis results for transcripts upregulated in Dmdmdx myoblasts. Column legend: id - ChIP-Seq track id; name - TF name, followed by the index of ChIP-Seq track for this TF; p-value - t-test p-value for overrepresentation of ChIP-Seq signal; Bonferroni - Bonferroni-corrected p-value; foldchange - a ratio of ChIP-Seq signal averaged across all promoters in the gene list versus 1000 random gene promoters; backgroundmean - averaged signal from the track across 1000 random gene promoters; querymean - averaged signal across all promoters from the submitted list. 2-B. TFBS analysis results for transcripts downregulated in Dmdmdx myoblasts. columns - as in A. 2 C top 10 genes for each of the significantly overrepresented TFs for transcripts downregulated in Dmdmdx. 2-D to 2 G TFBS analysis results (column legend as in A) for the following gene lists: upregulated in Dmdmdx-βgeo; downregulated in Dmdmdx-βgeo; upregulated in SC-5; downregulated in SC-5. 2 H gene lists as submitted to the seqinspector tool, including gene symbols that were translated for database compatibility.
- https://cdn.elifesciences.org/articles/75521/elife-75521-supp2-v1.xlsx
-
Supplementary file 3
Includes tables detailing the transcriptomic and enzyme-constrained flux rate of metabolic pathways and processes, and enrichment analysis results.
- https://cdn.elifesciences.org/articles/75521/elife-75521-supp3-v1.xls
-
Supplementary file 4
Includes the table detailing the full name of reactions presented in the metabolic map views (Figure 9 and Figure 9—figure supplement 1).
- https://cdn.elifesciences.org/articles/75521/elife-75521-supp4-v1.csv
-
Transparent reporting form
- https://cdn.elifesciences.org/articles/75521/elife-75521-transrepform1-v1.docx
Download links
A two-part list of links to download the article, or parts of the article, in various formats.
Downloads (link to download the article as PDF)
Open citations (links to open the citations from this article in various online reference manager services)
Cite this article (links to download the citations from this article in formats compatible with various reference manager tools)
Loss of full-length dystrophin expression results in major cell-autonomous abnormalities in proliferating myoblasts
eLife 11:e75521.
https://doi.org/10.7554/eLife.75521


