Progressive axonopathy when oligodendrocytes lack the myelin protein CMTM5
- Department of Neurogenetics, Max Planck Institute of Experimental Medicine, Germany
- Electron Microscopy Core Unit, Max Planck Institute of Experimental Medicine, Germany
- Proteomics Group, Max Planck Institute of Experimental Medicine, Germany
- Translational Neuroproteomics Group, Department of Psychiatry and Psychotherapy, University Medical Center Göttingen, Georg-August-University, Germany
- Institute for Auditory Neuroscience, University Medicine Göttingen, Germany
- Functional Imaging Laboratory, German Primate Center, Leibniz Institute for Primate Research, Germany
- Institute of Developmental Biology and Neurobiology, Johannes Gutenberg University, Germany
- Abberior Instruments Gmbh, Germany
Figures
Figure 1 with 1 supplement

Identification of CMTM5 as a central nervous system (CNS) myelin protein.
(A) Immunoblot analysis of CMTM5 in myelin biochemically purified from the brains C57/Bl6 mice at the age of 75 days (P75) compared to brain lysate with the same amount of protein loaded onto the gel. Note that CMTM5 is enriched in myelin. Known myelin proteins PLP, CNP, and SIRT2 are detected as markers. Shown are three biological replicates. (B) Immunohistochemistry and confocal microscopy of spinal cord sections of mice at P75. Note that CMTM5 (magenta) labeling was consistent with localization in myelin surrounding beta-III tubulin (TUJ1)-immunopositive axons (yellow) in CTRL (Cmtm5fl/fl) mice. CMTM5 labeling was not detected in myelin of mice lacking Cmtm5 expression in mature oligodendrocytes (Cmtm5fl/fl;CnpCre/Wt, cKO). Scale bar, 2 µm. (C, D) Immunoblot analysis of CMTM5 in brain lysate (C) and biochemically purified myelin (D) of young and aged mice. Note that CMTM5 abundance in brain lysate increases coinciding with developmental myelination (D). Shown is one biological replicate per age. PLP, CNP, and SIRT2 were detected as markers. P, postnatal day; m, months.
Figure 1—figure supplement 1
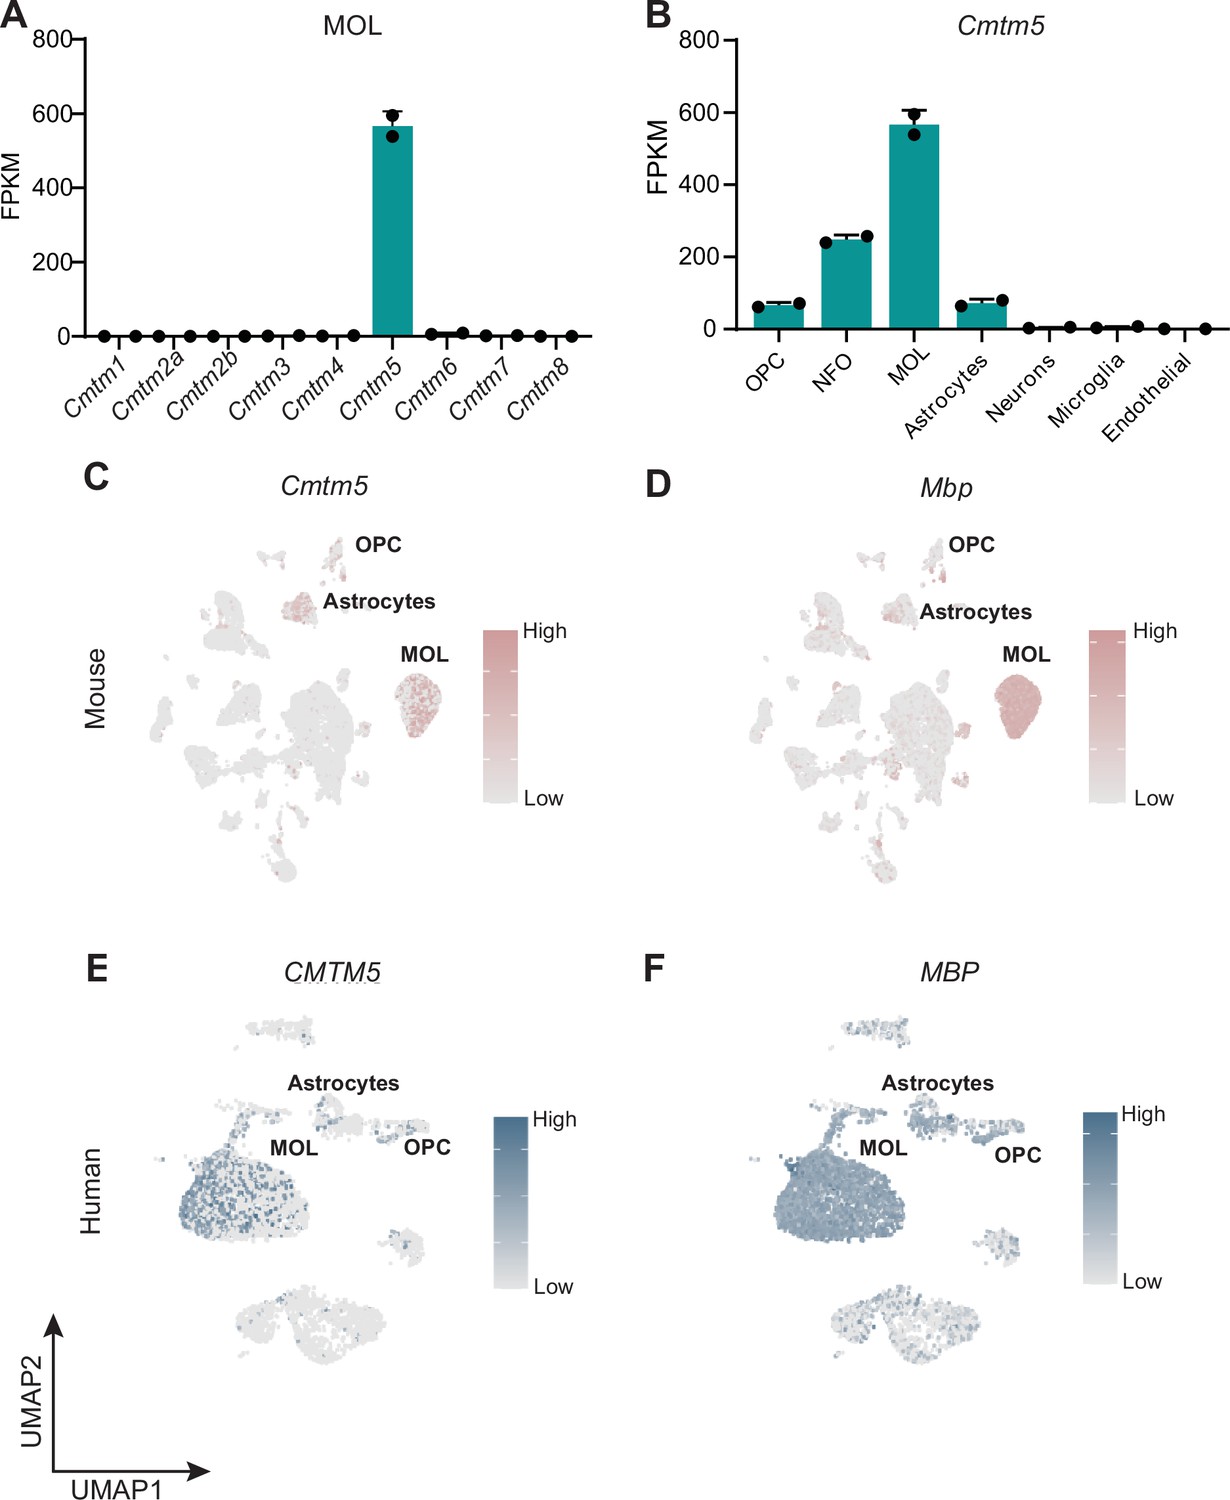
Cmtm5 mRNA is expressed in mature oligodendrocytes (MOL) of mice and humans.
(A, B) Abundance of Cmtm5 mRNA according to bulk RNAseq data of cells immunopanned from mouse cortices (Zhang et al., 2014). Note that among all members of the CMTM family, only Cmtm5 mRNA is considerably expressed in MOL (A). Increasing Cmtm5 mRNA expression coincides with maturation of cells of the oligodendrocyte lineage (B). OPC, oligodendrocyte precursor cells; NFO, newly formed oligodendrocyte; FPKM, fragments per kilobase per million mapped fragments. Data represented as mean ± SEM. (C, D) Uniform manifold approximation and projection (UMAP) feature plots of scRNAseq data derived from a previously published dataset (Zhou et al., 2020) show enriched expression of Cmtm5 mRNA in MOL of mice (C). Mbp serves as a marker gene for MOL in mice (D). (E, F) UMAP feature plots of scRNAseq data derived from a previously published dataset (Jäkel et al., 2019) show enriched expression of CMTM5 mRNA in MOL of the white matter in disease-unaffected human control samples (E). MBP serves a marker gene for human MOL (F).
-
Figure 1—figure supplement 1—source data 1
Numerical data for Figure 1—figure supplement 1.
- https://cdn.elifesciences.org/articles/75523/elife-75523-fig1-figsupp1-data1-v1.xlsx
Figure 2 with 1 supplement
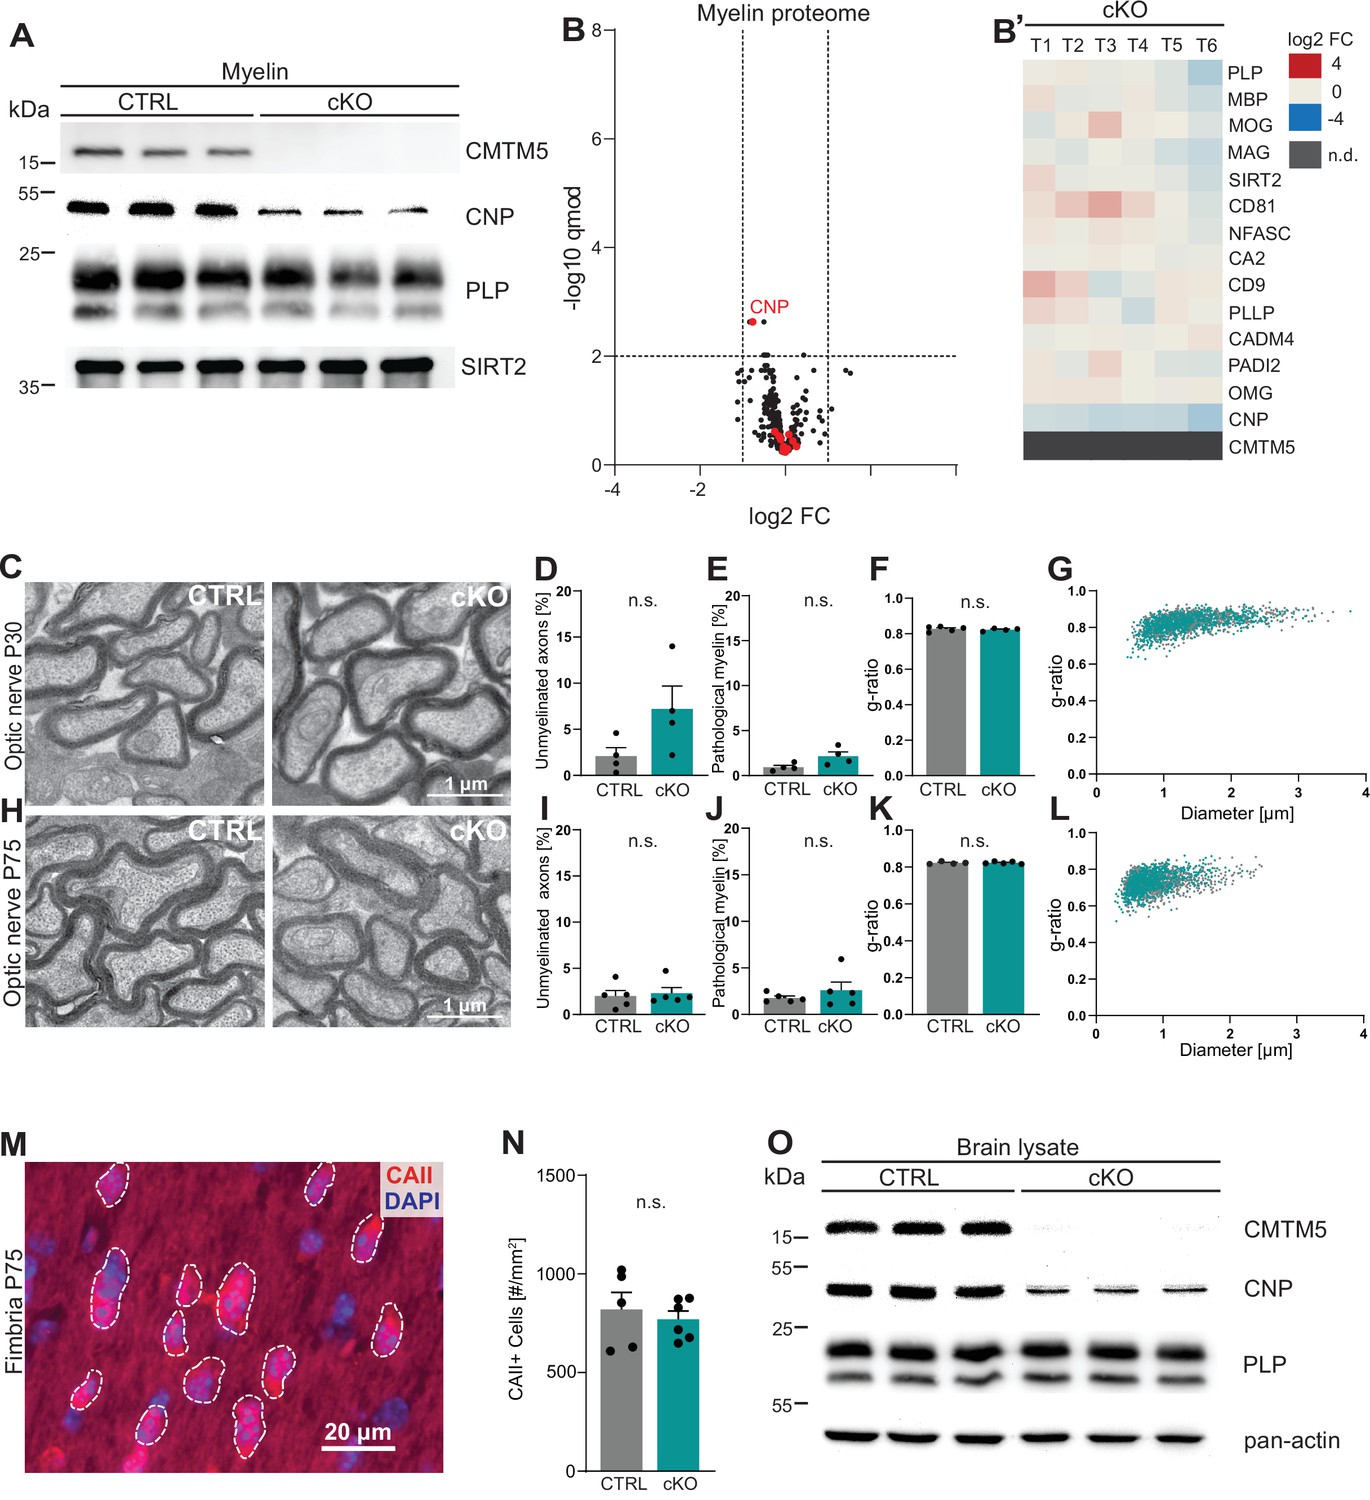
CMTM5 is not essential for myelin biogenesis and composition.
(A) Immunoblot analysis shows that CMTM5 is undetectable in myelin purified from the brains of Cmtm5fl/fl;CnpCre/Wt (cKO) mice at postnatal day 75 (P75). CNP, PLP, and SIRT2 were detected as markers. Shown are three biological replicates per genotype. (B, B’) Quantitative proteome analysis of brain myelin reveals largely similar myelin composition in Cmtm5 cKO and CTRL mice. Analyzed were n = 3 mice per genotype and two technical replicates per mouse (see Figure 2—source data 1). (B) Volcano plot with data points representing log2-fold change and -log10-transformed q-values of 428 identified proteins in Cmtm5 cKO compared to CTRL myelin. Red dots highlight known myelin proteins. Stippled lines indicate thresholds. CMTM5 is not displayed because it was not identified in Cmtm5 cKO myelin. (B’) Heatmap showing the relative abundance of selected known myelin proteins in Cmtm5 cKO compared to control myelin. Data represents n = 3 mice per genotype analyzed as two technical replicates per mouse (T1–T6). Note that the relative abundance of most myelin proteins was essentially similar in Cmtm5 cKO and CTRL myelin. In agreement with the immunoblot analysis in (A), the abundance of CNP was about halved in Cmtm5 cKO myelin reflecting that the Cre driver line (CnpCre/Wt) possesses only one Cnp allele. CMTM5 was not detected (n.d.) in Cmtm5 cKO myelin. (C–L) Electron micrographs and quantitative assessment of myelin in CTRL and Cmtm5cKO optic nerves at postnatal day 30 (P30) (C–G) and P75 (H–L). Scale bar, 1 µm. Percentage of unmyelinated axons (D, I) and pathological myelin profiles is similar between the groups (E, J). Data correspond to all axons (on average more than 1500 axons) from 18 to 20 nonoverlapping random EM images from 4 to 5 animals per group. Two-tailed Student’s t-test. (D) p=0.1003; (E) p=0.0598; (I) p=0.3937; (J) p=0.7269. Mean g-ratio (F, K) is similar between the experimental groups at P30 and P75. Data corresponds to 180–200 axons randomly selected from 18 to 20 EM images for each mouse. n = 4–5 mice per group. Two-tailed Student’s t-test. (F) p=0.5839; (K) p=0.8821. (G, L) Scatter plot showing g-ratios in relation to respective axonal diameters. No apparent shift between the experimental groups is detectable. (M, N) Immunohistochemistry and genotype-dependent quantification of carbonic anhydrase 2 (CAII) immune-positive oligodendrocytes in a representative white matter tract (hippocampal fimbria) at P75. (M) Representative fluorescence micrograph, stippled lines encircle CAII-positive cells. Scale bar, 20 µm. (N) Number of CAII immunopositive cells number is similar in the fimbria of CTRL and Cmtm5 cKO mice. n = 5–6 mice per group, unpaired Student’s t-test p=0.5971. Bar graphs give mean ± SEM; data points in bar graphs represent individual mice. (O) Immunoblot analysis shows that CMTM5 is virtually undetectable in brain lysate of Cmtm5fl/fl;CnpCre/Wt (cKO) mice at 12 months. CNP, PLP, and actin were detected as markers. Shown are three biological replicates per genotype.
-
Figure 2—source data 1
Label-free quantification of proteins in CNS myelin fractions from Cmtm5 cKO and control mice.
- https://cdn.elifesciences.org/articles/75523/elife-75523-fig2-data1-v1.xlsx
-
Figure 2—source data 2
Numerical data for Figure 2.
- https://cdn.elifesciences.org/articles/75523/elife-75523-fig2-data2-v1.xlsx
Figure 2—figure supplement 1
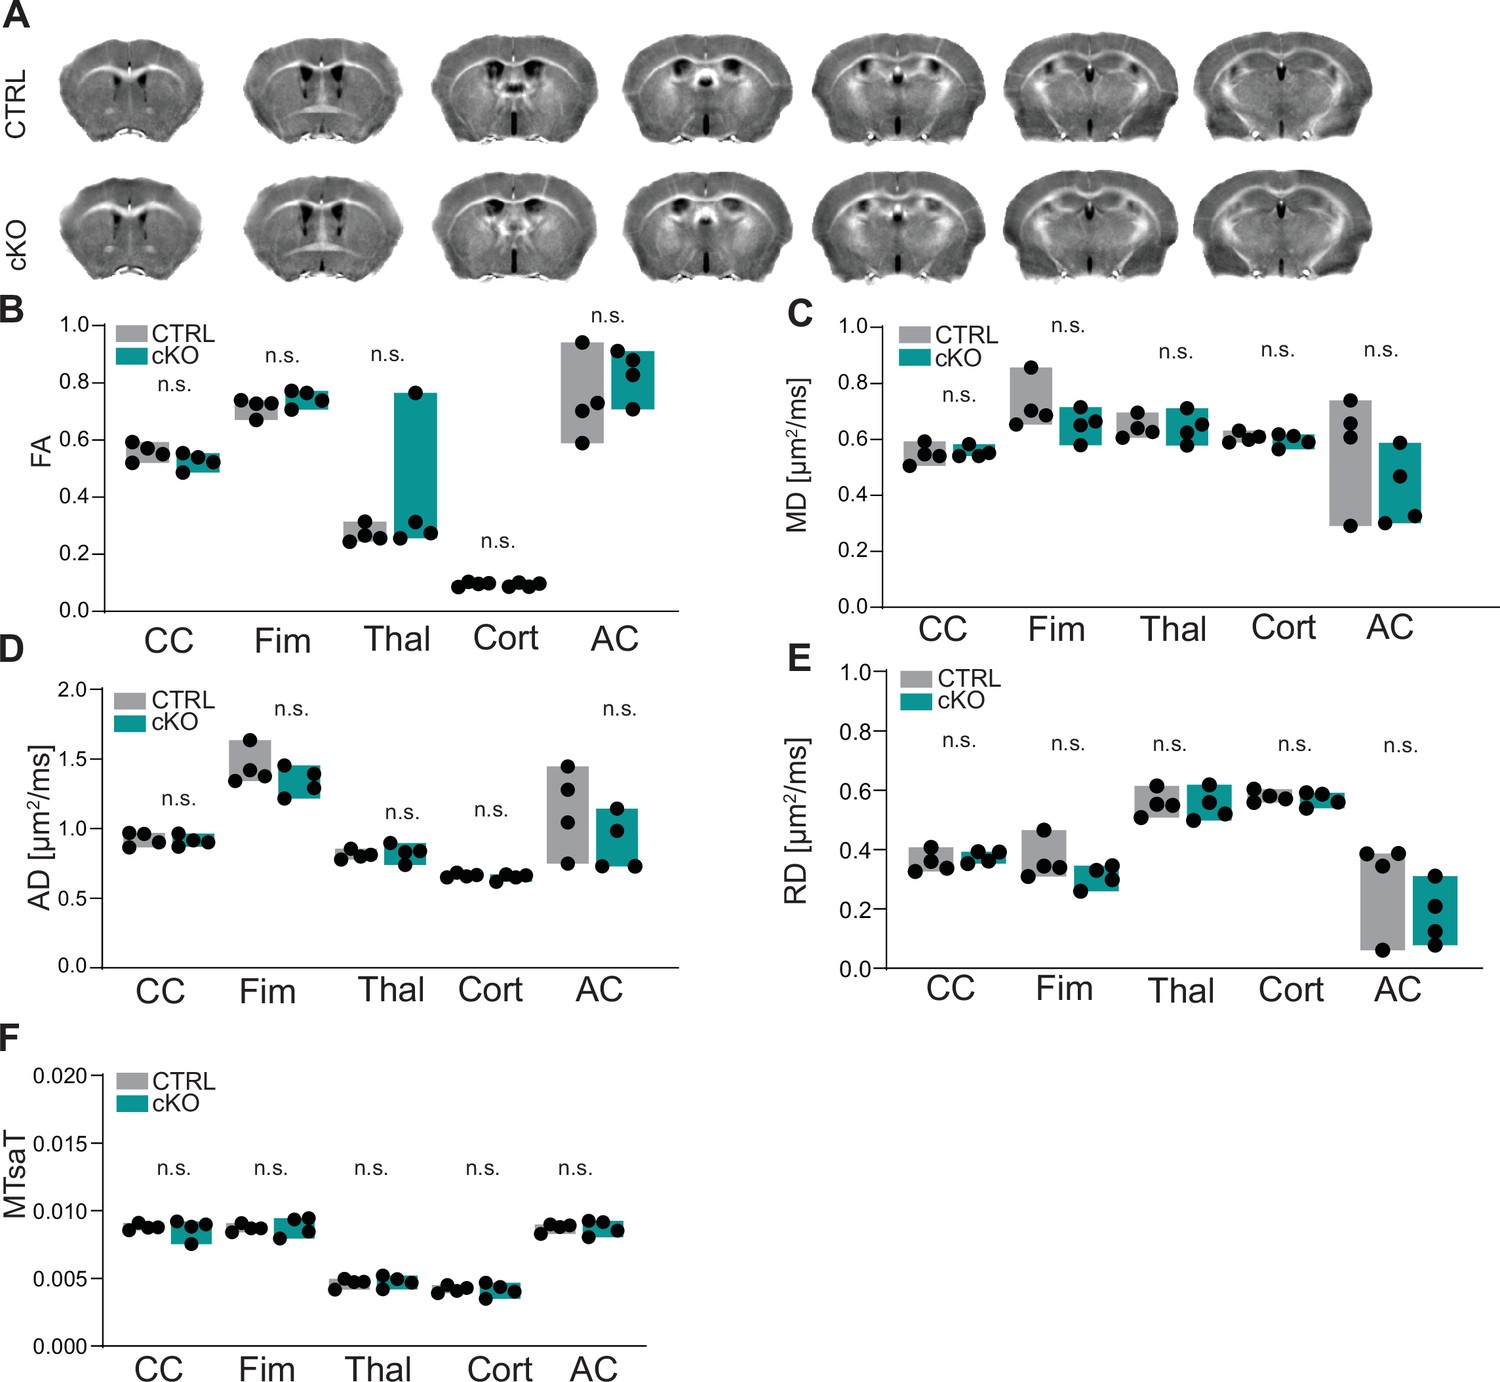
Magnetic resonance imaging (MRI) of the brains of Cmtm5 cKO mice.
(A) MRI-based morphometry of brains from CTRL and Cmtm5 cKO mice at 8 months of age. Shown are representative genotype averaged (four mice per genotype) effective transverse relaxation rate (R2*)MRI images. (B–E) Diffusion tensor imaging (DTI) indicates unchanged fractional anisotropy (FA), mean diffusivity (MD), axial diffusivity (AD), and radial diffusivity (RD) in white and gray matter in brains of Cmtm5 cKO and CTRL mice. CC, corpus callosum; Fim, fimbria; Thal, thalamus; Cort, cortex; AC, anterior commissure. n = 4 per genotype. Precise p-values are given in the statistics section. (F) Magnetization transfer saturation index (MTsaT) is unaltered in Cmtm5 cKO compared to CTRL mice. Exact p-values are listed in the statistics section. All graphs give mean ± SEM; all data points represent individual mice.
-
Figure 2—figure supplement 1—source data 1
Numerical data for Figure 2—figure supplement 1.
- https://cdn.elifesciences.org/articles/75523/elife-75523-fig2-figsupp1-data1-v1.xlsx
Figure 3 with 3 supplements

Cmtm5 deletion in oligodendrocytes causes axonopathy.
(A, B) Electron micrographs and genotype-dependent quantitative assessment of CTRL and Cmtm5 cKO optic nerves at postnatal day 75 (P75). Scale bar, 1 µm. (A) Arrowheads point at pathological axons. (B) Quantification of pathological profiles reveals progressive axonopathy in optic nerves of Cmtm5 cKO mice. n = 4–5 mice per group, 18–20 random nonoverlapping electron micrograph images analyzed, Two-tailed Student’s t-test. Postnatal day 30 (P30) p=0.0011; P75 p=0.0191 with Welch’s correction; 12 months p<0.0001. (C) Quantitative assessment of axonal density on semithin optic nerve sections. n = 4–5 mice per group, data represents mean axon number in five 55 µm2 rectangles per mouse randomly distributed over the entire optic nerve. Axon numbers are significantly reduced at 12 months of age according to two-tailed Student’s t-test. P30 p=0.1288; P75 p=0.5993; 12 months p=0.0499. (D–F) Electron micrographs and genotype-dependent quantitative assessment of spinal cord dorsal white matter in CTRL and Cmtm5 cKO mice at 12 months. Scale bar = 1 µm. (E) Number of pathological profiles is increased in spinal cord dorsal white matter of Cmtm5 cKO mice at 12 months. n = 3–7 mice per group, 16–20 14.84 µm2 rectangles per mouse randomly distributed over the spinal cord dorsal white matter. (F) Axonal density assessed on electron micrographs of spinal cord dorsal white matter at 12 months. Trend toward reduced axon numbers in Cmtm5 cKO did not reach significance according to two-tailed Student’s t-test p=0.3341. n = 3–7 mice per group, data represents mean axon number in 5–728 µm2 rectangles per mouse randomly distributed over the spinal cord dorsal white matter. All bars show mean ± SEM; all data points represent individual mice.
-
Figure 3—source data 1
Numerical data for Figure 3.
- https://cdn.elifesciences.org/articles/75523/elife-75523-fig3-data1-v1.xlsx
Figure 3—figure supplement 1
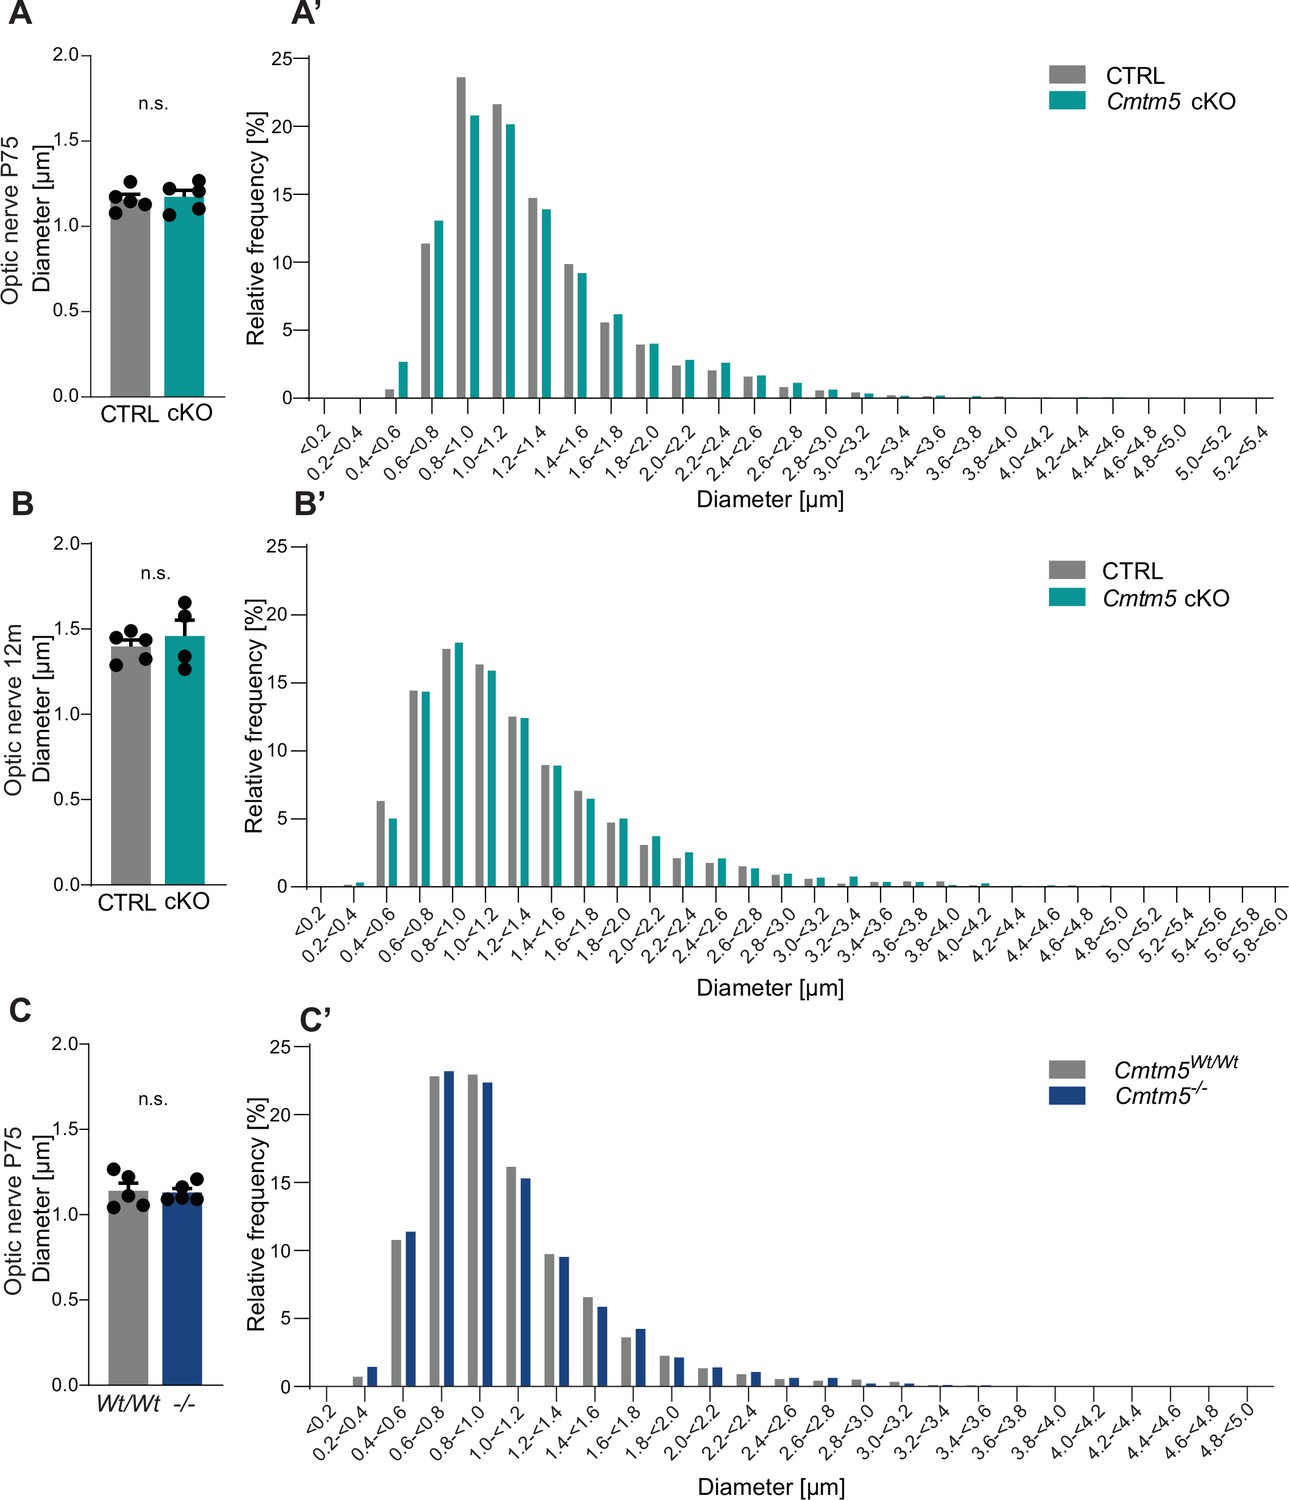
Cmtm5 deletion in oligodendrocytes does not affect the calibers of healthy-appearing axons.
(A–C) Quantitative assessment of mean axonal diameters in the optic nerves of Cmtm5 cKO mice, Cmtm5-/- mice, and respective controls. Mean axonal diameters are similar between CTRL and Cmtm5 cKO mice at ages postnatal day 75 (P75) (A) and 12 months (B) as well as between Cmtm5-/- and control mice at age P75 (C). Two-sided Student’s t-test. (A) p=0.7514, (B) p=0.5315, and (C) p=0.8496. 700–800 optic nerve axons on 18–20 electron micrographs were analyzed per mouse in 4–5 mice per genotype and age. All bars show mean ± SEM; all data points represent individual mice. (A’–C’) Frequency distributions of pooled axonal diameters in optic nerves of Cmtm5 cKO mice, Cmtm5-/- mice, and respective controls. No apparent shift in axonal diameters was detected between CTRL and Cmtm5 cKO mice at ages P75 (A’) and P365 (B’) as well as between Cmtm5-/- and control mice at age P75 (C’). Axonal diameters are the same as used for analysis of mean axonal diameters in (A–C) but represent pools per genotype and timepoint.
-
Figure 3—figure supplement 1—source data 1
Numerical data for Figure 3—figure supplement 1.
- https://cdn.elifesciences.org/articles/75523/elife-75523-fig3-figsupp1-data1-v1.xlsx
Figure 3—figure supplement 2
Magnetic resonance spectroscopy (MRS) of the corpus callosum of Cmtm5 cKO mice.
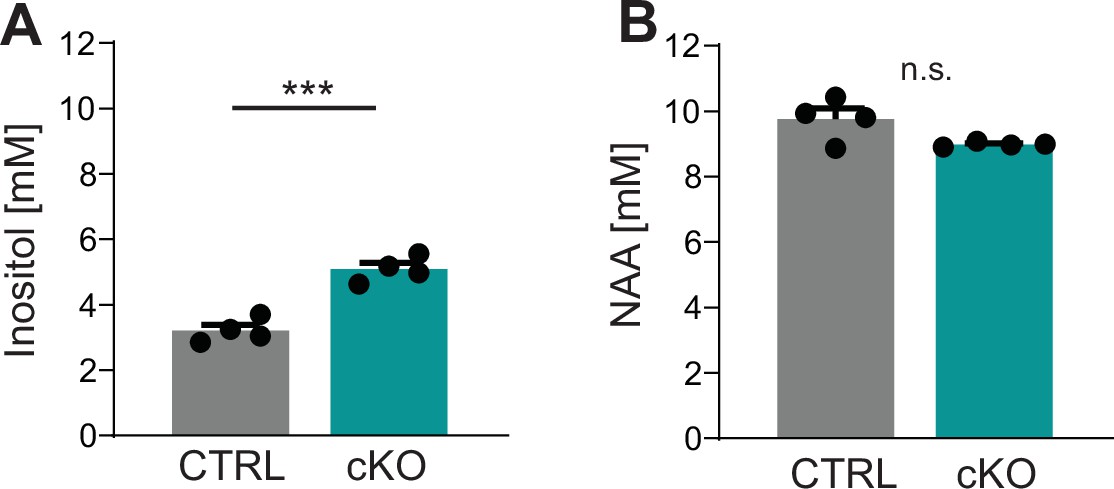
(A, B) Spectroscopy of key metabolic markers myo-inositol (for microglia and astrocytes, in A) and N-acetyl-aspartate (NAA, for axon/neurons, in B). (A) The concentration of inositol is significantly increased in the corpus callosum of Cmtm5 cKO mice compared to controls. Two-tailed Student’s t-test of the mean p=0.0004. (B) NAA levels are unchanged in the corpus callosum of Cmtm5 cKO mice compared to controls. Two-tailed Student’s t-test of the mean p=0.057. All bar graphs give mean ± SEM; all data points represent individual mice.
-
Figure 3—figure supplement 2—source data 1
Numerical data for Figure 3—figure supplement 2.
- https://cdn.elifesciences.org/articles/75523/elife-75523-fig3-figsupp2-data1-v1.xlsx
Figure 3—figure supplement 3
Secondary neuropathology following Cmtm5 deletion.
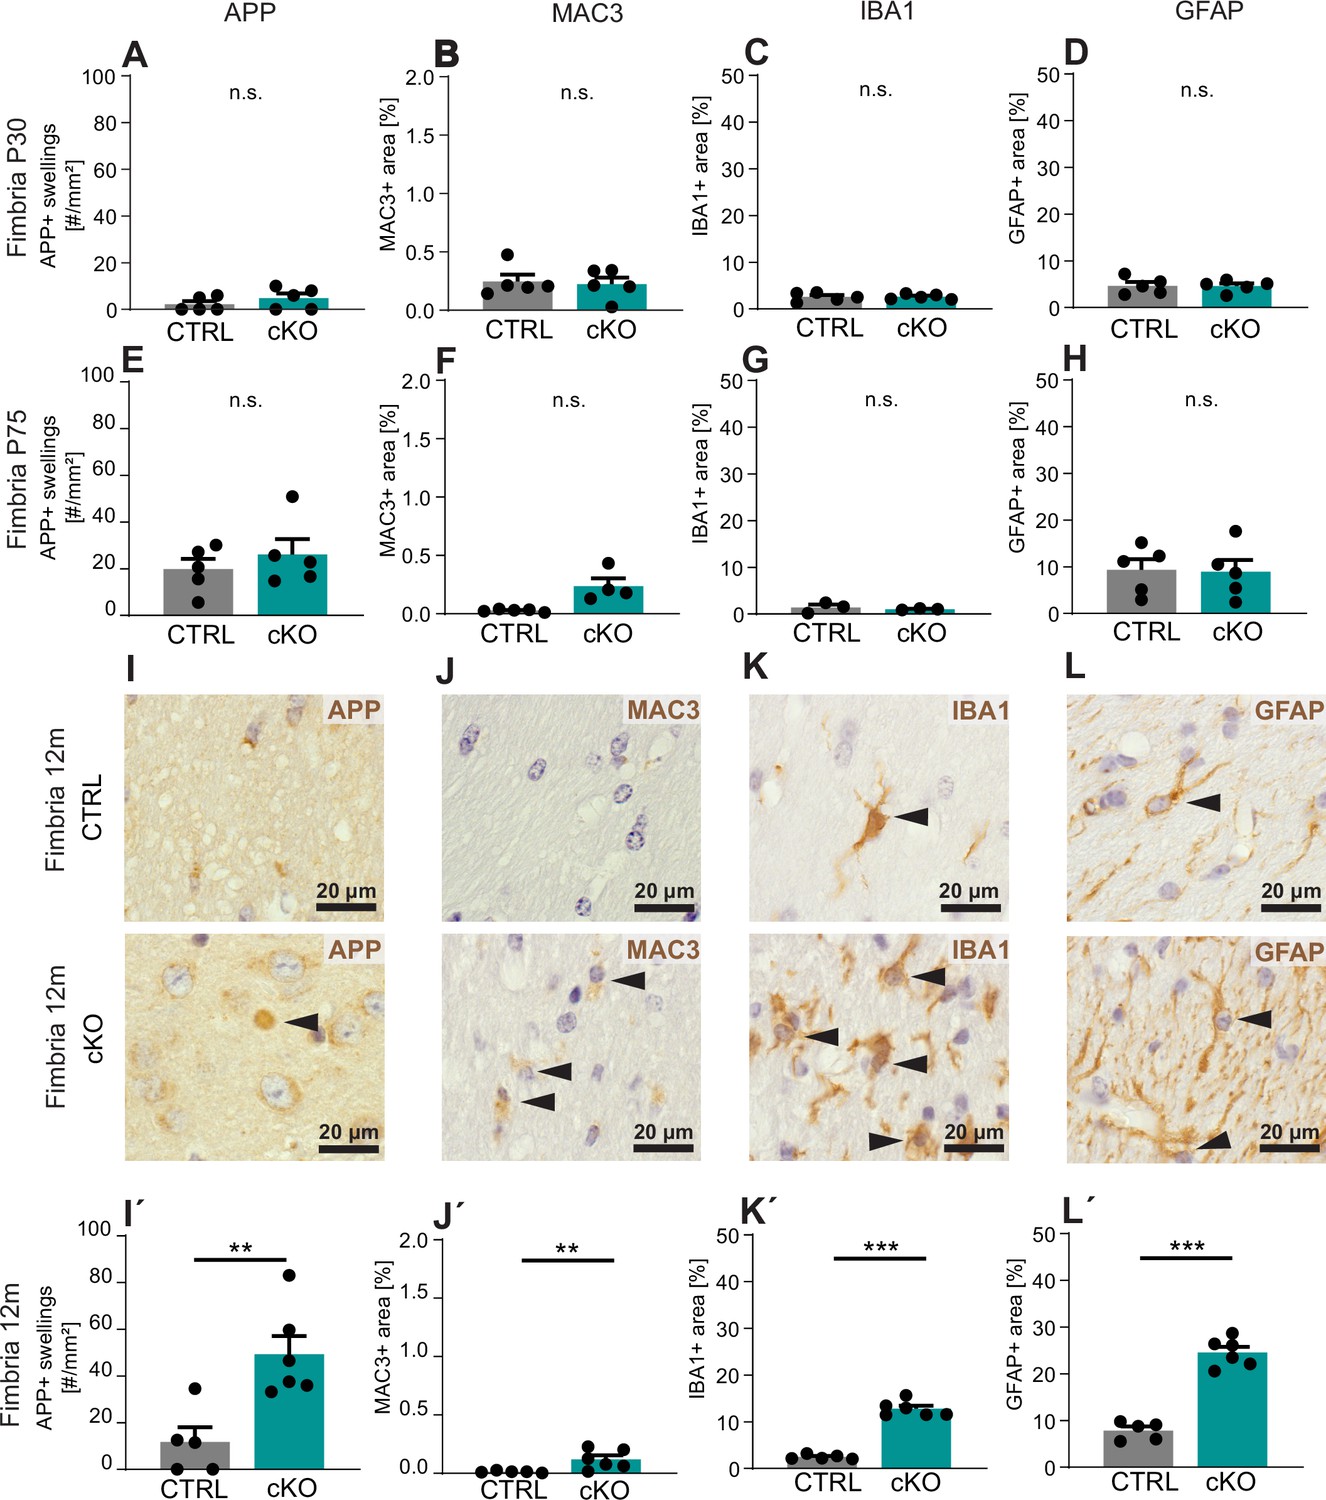
Quantitative assessment of immunohistochemistry detecting neuropathological markers in a representative white matter tract (hippocampal fimbria) using markers for axonal swellings (APP), microglia (MAC3, IBA1), and astroglia (GFAP) at ages postnatal day 30 (P30) (A–D), postnatal day 75 (P75) (E–H), and 12 months (I–L, I’–L’). Given is the number of APP-immunopositive axonal swellings (A, E, I’) and the relative area of immunopositivity for MAC3 (B, F, J’), IBA1 (C, G, K’), and GFAP (D, H, L’). Representative micrographs are displayed for 12 months (I–L). Note that Cmtm5 cKO fimbriae display a significant increase of all assessed neuropathological markers at 12 months of age. n = 3–6 mice per group, Two-tailed Student’s t-test. (A) p=0.3225; (B) p=0.7901; (C) p=0.9480; (D) p=0.9152; (E) p=0.4413; (F) with Welch’s correction p=0.0525; (G) with Welch´s correction p=0.9049; (H) p=0.6270; (I’) p=0.0055; (J’) with Welch´s correction p=0.0251; (K’) with Welch’s correction p<0.0001; (L’) p<0.0001. Bar graphs, mean ± SEM.
-
Figure 3—figure supplement 3—source data 1
Numerical data for Figure 3—figure supplement 3.
- https://cdn.elifesciences.org/articles/75523/elife-75523-fig3-figsupp3-data1-v1.xlsx
Figure 4
Focused ion beam-scanning electron microscopy (FIB-SEM) analysis specifies pathological profiles in Cmtm5 cKO mice.
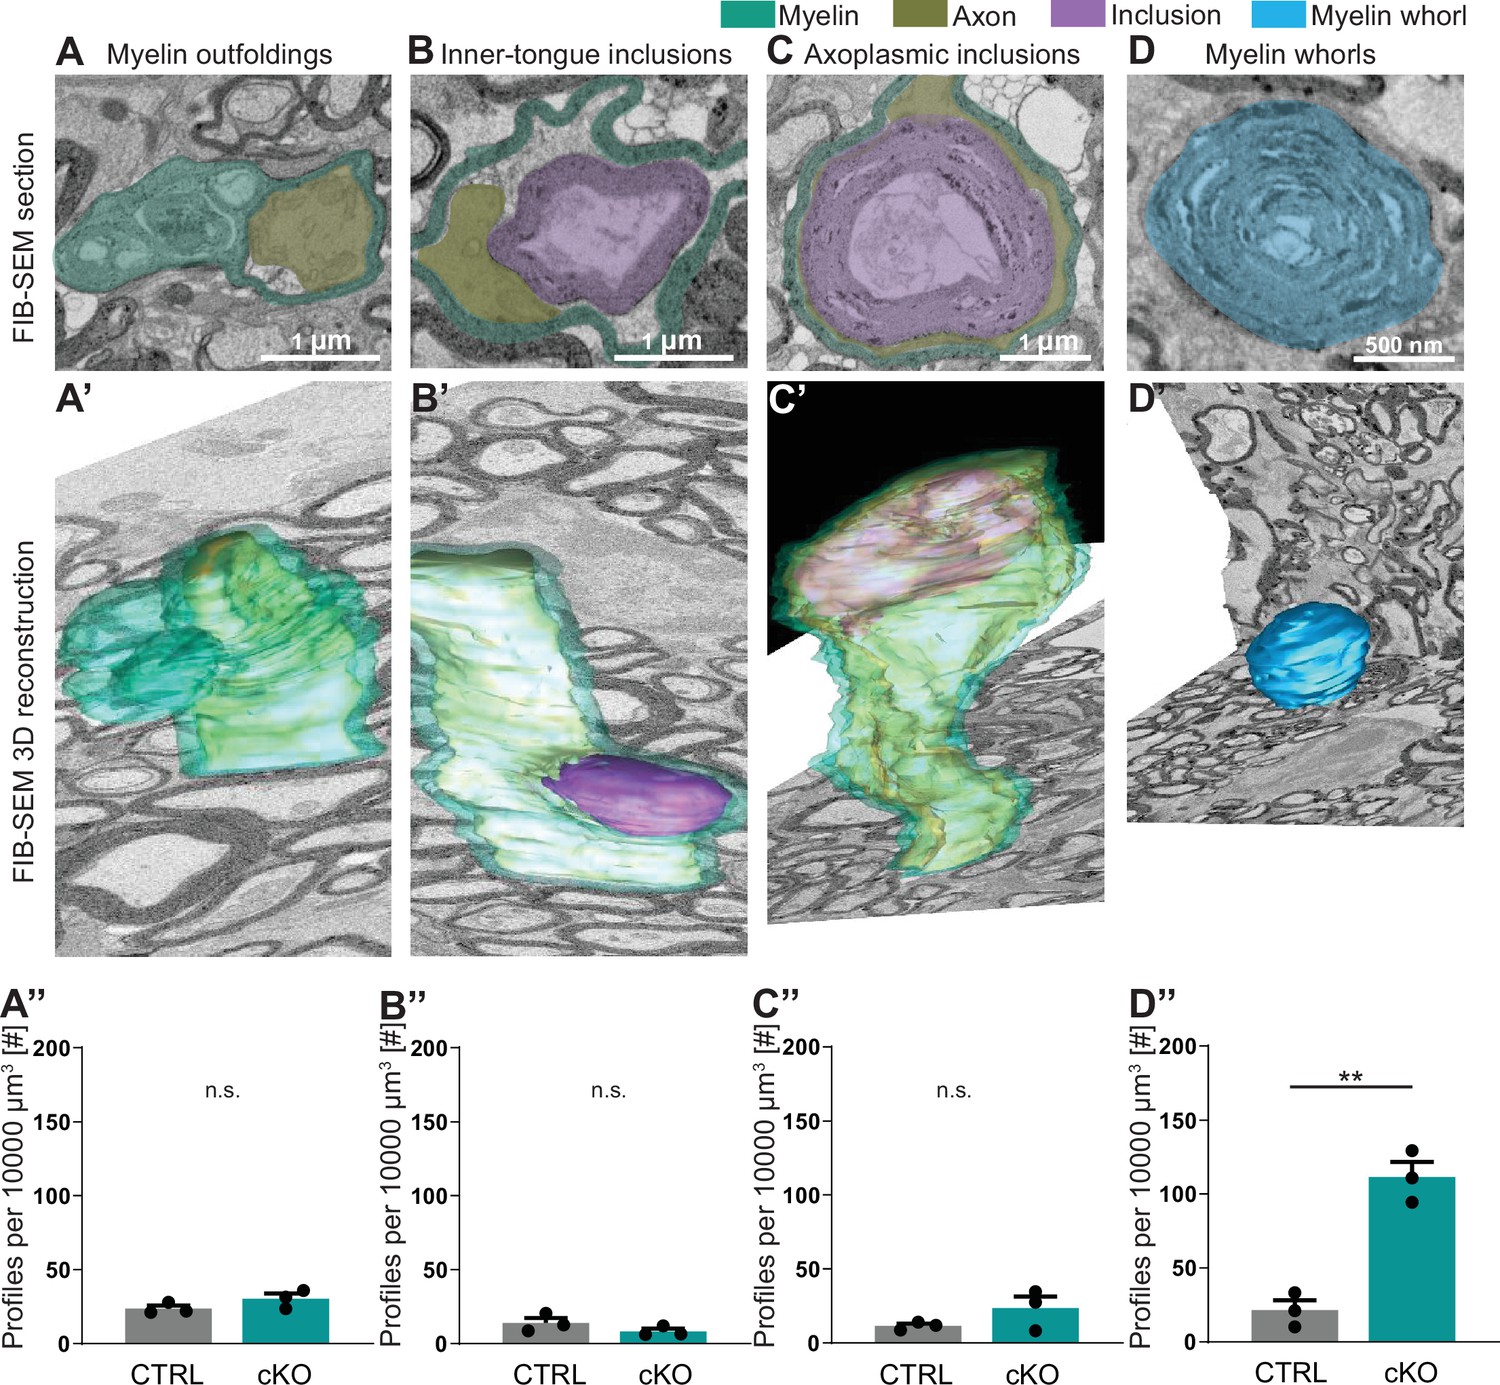
FIB-SEM micrographs (A–D) and three-dimensional (3D) reconstruction (A’–D’) of pathological profiles in Cmtm5 cKO optic nerve at 12 months of age. (A–C) Scale bar = 1 µm. (D) Scale bar = 500 nm. Myelin (cyan), axons (gold), inclusion (purple), and myelin whorls (blue) are highlighted. Pathological profiles include myelin outfoldings, inclusions in the inner tongue, inclusions completely engulfed by axoplasm, and myelin whorls. Analysis of the entire 3D volumes reveals that the relative number of myelin whorls is significantly increased in Cmtm5 cKO mice. FIB-SEM stacks of optic nerves of three mice per genotype were analyzed. Normalized volume = 10,000 µm3. Two-tailed Student’s t-test. (A’’) p=0.1882; (B’’) p=0.2190; (C’’) p=0.2111; (D’’) p=0.0017. Scale bars 1 µm in (A–C), 500 nm in (D). Bar graphs give mean ± SEM.
-
Figure 4—source data 1
Numerical data for Figure 4.
- https://cdn.elifesciences.org/articles/75523/elife-75523-fig4-data1-v1.xlsx
Figure 5

Electroretinography (ERG) and visually evoked potentials (VEPs) of Cmtm5 cKO mice.
(A–D) ERG. (A) ERG waveforms in response to light flashes at 0.25 cd-s/m2 from 11 Cmtm5 cKO (grand average turquoise, SEM shaded) and 10 CTRL mice (grand average gray, SEM shaded). (B) ERG thresholds are similar between CTRL and Cmtm5 cKO. Unpaired Student’s t-test of the mean ± SEM p=0.13. (C, D) Amplitudes of the ERG a- and b-waves in response to light flashes of varying intensities in Cmtm5 cKO (n = 11, turquoise) and CTRL mice (n = 11, gray; mean ± SEM) are similar between genotypes. Two-way ANOVA. (C) p=0.42, (D) p=0.79. Analysis was performed at 8.5 months of age. (E–H) VEPs. (E) VEP in response to light flashes at 0.01 cd-s/m2 from 10 Cmtm5 cKO (grand average turquoise, SEM shaded) and 9 CTRL mice (grand average gray, SEM shaded) display comparable waveforms dominated by a broad negative wave in both genotypes. (F) VEP thresholds are not significantly different between CTRL and Cmtm5 cKO. Unpaired Student’s t-test of the mean ± SEM with Welch’s correction p=0.33. (G, H) VEP latencies and amplitudes in response to light flashes of varying intensities in Cmtm5 cKO (n = 10, turquoise) and CTRL mice (n = 8, gray; means ± SEM). Note that Cmtm5 cKO and CTRL mice show similar VEP latencies but Cmtm5 cKO mice display reduced VEP amplitudes compared to CTRL mice. Two-way ANOVA. (G) p=0.61, (H) p=0.005. Analysis was performed at 8.5 months of age.
-
Figure 5—source code 1
Code used for analysis of visually evoked potential (VEP) and electroretinography (ERG) in Figure 5.
- https://cdn.elifesciences.org/articles/75523/elife-75523-fig5-code1-v1.zip
-
Figure 5—source data 1
Numerical data for Figure 5.
- https://cdn.elifesciences.org/articles/75523/elife-75523-fig5-data1-v1.xlsx
Figure 6 with 1 supplement

Axonopathy in constitutive and tamoxifen-induced Cmtm5 mutants.
(A–C) Analysis of mice lacking Cmtm5 expression from all cells (Cmtm5-/- mice) and respective controls. (A) Immunoblot confirms absence of CMTM5 in myelin purified from the brains of Cmtm5-/- mice. CNP and SIRT2 were detected as controls. (B) Representative electron micrographs (EMs) of Cmtm5-/- and respective control optic nerves. Arrowhead points at pathological profile. Scale bar, 1 µm. (C) Quantitative assessment of 18–20 random nonoverlapping EMs from 4 to 6 mice per group. Note the progressive increase in pathological appearing axons in optic nerves of Cmtm5-/- mice. Postnatal day 75 (P75): p=0.0406 by two-sided Student’s t-test with Welch’s correction; postnatal day 365 (P365): p<0.0001 two-sided Student’s t-test. (D–F) Analysis of mice lacking Cmtm5 expression in mature oligodendrocytes upon induction by tamoxifen (Cmtm5fl/fl;PlpCreERT2, iKO) and respective tamoxifen-injected CreERT2-negative controls (Cmtm5fl/fl, CTRL). (D) Immunoblot of myelin purified from the brains of mice 4 months post tamoxifen injection (PTI). Note that the abundance of CMTM5 is strongly reduced in Cmtm5 iKO myelin. PLP and SIRT2 were detected as controls. (E) Representative EMs of Cmtm5 iKO and CTRL optic nerves. Arrowhead points at pathological profile. Scale bar, 1 µm. (F) Quantification of pathological profiles (20 nonoverlapping random images per mouse, n = 5 mice per genotype). Number of pathological profiles is significantly increased 4 months PTI (p=0.0282 by two-sided Student’s t-test with Welch’s correction). Bar graphs give mean ± SEM; data points represent individual mice.
-
Figure 6—source data 1
Numerical data for Figure 6.
- https://cdn.elifesciences.org/articles/75523/elife-75523-fig6-data1-v1.xlsx
Figure 6—figure supplement 1
Absence of evidence that the abundance of CMTM5 is altered in central nervous system (CNS) myelin of Plp- or Cnp-deficient mice.
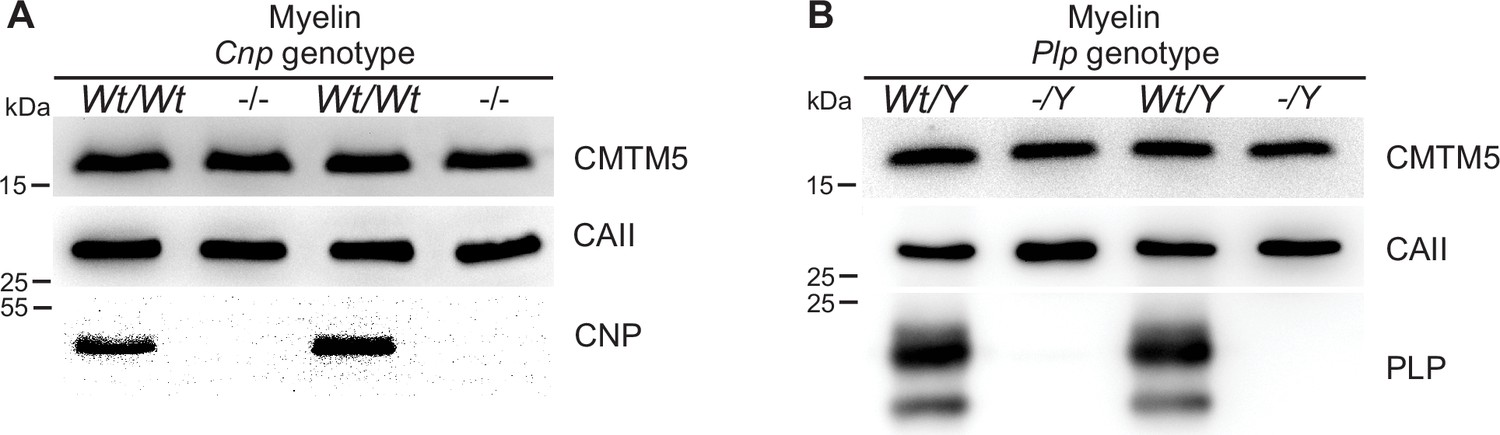
(A, B) Immunoblot analysis of myelin purified from the brains of Cnp-/- (A) and Plp-/Y (B) mice and respective controls at postnatal day 75 (P75). Note that the relative abundance of CMTM5 in myelin appears similar. Blots show n = 2 mice per genotype. Carbonic anhydrase 2 (CAII) served as control.
Figure 7

Axonopathy upon Cmtm5 deletion counteracted by the WldS mutation.
(A) Retinae dissected from Cmtm5 cKO and CTRL mice were immunolabeled with antibodies detecting RBPMS as a marker for retinal ganglion cells (RGCs). Image representative of n = 3 retinae. Scale bar = 500 µm. (B) Magnification of the inner, middle, and outer parts of the retina. (C) Quantitative assessment indicates that the number of RGCs is similar between Cmtm5 cKO and CTRL mice. Retinae of 12-month-old mice were analyzed. Data represent the mean of three nonoverlapping areas assessed for each zone (inner, middle, outer retina), as indicated by the white boxes in (A). Unpaired two-sided Student’s t-test inner part: p=0.8484; middle part: p=0.5211; outer part: p=0.2912. (D, E) Electron micrographs (EMs) and genotype-dependent quantification of pathological profiles in the optic nerves of Cmtm5-/- and Cmtm5Wt/Wt control mice in dependence of the heterozygous presence of the WldS mutation (symbolized WldS+) at 6 months of age. Representative EMs; arrowheads point at pathological profiles. Scale bar, 1 µm. (E) Quantification of pathological profiles in the optic nerves of 6-month-old mice. Note that Cmtm5 deletion causes an increased number of pathological profiles, which is reduced by the presence of the WldS mutation (symbolized WldS+). Data correspond to optic nerves from 4 to 5 mice per group and 20 random nonoverlapping EM images analyzed. Unpaired two-sided Student’s t-test Cmtm5Wt/Wt: p=0.5107; Cmtm5-/-: p=0.0014. Bar graphs give mean ± SEM; data points represent individual mice.
-
Figure 7—source data 1
Numerical data for Figure 7.
- https://cdn.elifesciences.org/articles/75523/elife-75523-fig7-data1-v1.xlsx
Tables
Table 1
Comparison of neuropathological features in Cmtm5-, Cnp-, and Plp-mutant mice.
Neuropathological features in Cmtm5 cKO,Cnp-/-, and Plp-/Y mice and key references are given. APP, amyloid precursor protein.
| Feature | Cmtm5 mutants | Cnp mutants | Plp mutants |
|---|---|---|---|
| Myelinated axons (%) | Normal | Reduced | Reduced |
| Myelin thickness | Normal | Trend to thinner myelin | Normal-appearing |
| Myelin structure | Normal | Inner-tongue swellings, myelin outfoldings | Lamella splittings, myelin outfoldings |
| Axonopathy | Early onset, progressive | Early onset, progressive | Early onset, progressive |
| Modified by WldS | Reduction of pathology | No effect | No effect |
| APP+ axonal swellings | Late onset | Early onset | Early onset |
| Microgliosis | Late onset | Early onset | Early onset |
| Astrogliosis | Late onset | Early onset | Early onset |
| References | This study | Edgar et al., 2009; Lappe-Siefke et al., 2003; Patzig et al., 2016; Rasband et al., 2005 | Edgar et al., 2004; Griffiths et al., 1998; Klugmann et al., 1997; Patzig et al., 2016 |
Table 2
Antibody information.
IHC, immunohistochemistry; IB, immunoblot.
| Antigen | Host species | Method, dilution | Source and Cat# |
|---|---|---|---|
| α-Actin | Mouse | IB 1:1000 | Millipore |
| α-APP | Mouse | IHC 1:1000 | Chemicon (#MAB348) |
| α-CAII | Rabbit | IB 1:500,IHC 1:300 | Ghandour et al., 1980 |
| α-CMTM5 | Rabbit | IB 1:1000 | ProteinTech (custom made)Sequence: YRTELMPSTTEGD |
| α-CMTM5 | Rabbit | IHC 1:200 | Pineda (custom made)Sequence: CAFKIYRTELMPSTTEGDQQ |
| α-CNP | Mouse | IB 1:1000 | Sigma-Aldrich (#SAB1405637) |
| α-GFAP | Mouse | IHC 1:200 | Novo Castra (#NCL-L-GFAP-GA5) |
| α-IBA1 | Goat | IHC 1:1000 | Abcam (#ab5076) |
| α-MAC3 | Rat | IHC 1:400 | Pharmingen (#553322) |
| α-PLP | Rabbit | IB 1:2000 | A431 Jung et al., 1996 |
| α-RBPMS | Guinea pig | IHC 1:300 | Sigma-Aldrich (#ABN1376) |
| α-SIRT2 | Rabbit | IB 1:500 | Abcam (#ab67299) |
| α-TUJ1 | Mouse | IHC 1:1000 | Covance (#MMS-435P) |
| α-mouse HRP | Goat | IB 1:10,000 | Dianova (#115-03-003) |
| α-rabbit HRP | Goat | IB 1:10,000 | Dianova (#111-035-003) |
| α-rabbit Alexa555 | Donkey | IHC 1:1000 | Dianova (#SBA-3030-32) |
| α-guinea pig Alexa555 | Donkey | IHC 1:1000 | Dianova |
| α-mouse STAR-RED | Goat | IHC 1:200 | abberior (# STRED-1001-500UG) |
| α-rabbit STAR ORANGE | Goat | IHC 1:200 | abberior (# STORANGE-1002-500UG) |
Additional files
-
Transparent reporting form
- https://cdn.elifesciences.org/articles/75523/elife-75523-transrepform1-v1.docx
-
Source data 1
Source data displaying original immunoblots.
- https://cdn.elifesciences.org/articles/75523/elife-75523-data1-v1.zip
Download links
A two-part list of links to download the article, or parts of the article, in various formats.
Downloads (link to download the article as PDF)
Open citations (links to open the citations from this article in various online reference manager services)
Cite this article (links to download the citations from this article in formats compatible with various reference manager tools)
Progressive axonopathy when oligodendrocytes lack the myelin protein CMTM5
eLife 11:e75523.
https://doi.org/10.7554/eLife.75523


