Ca2+ inactivation of the mammalian ryanodine receptor type 1 in a lipidic environment revealed by cryo-EM
- Department of Physiology and Biophysics, Virginia Commonwealth University, United States
Figures
Figure 1 with 5 supplements
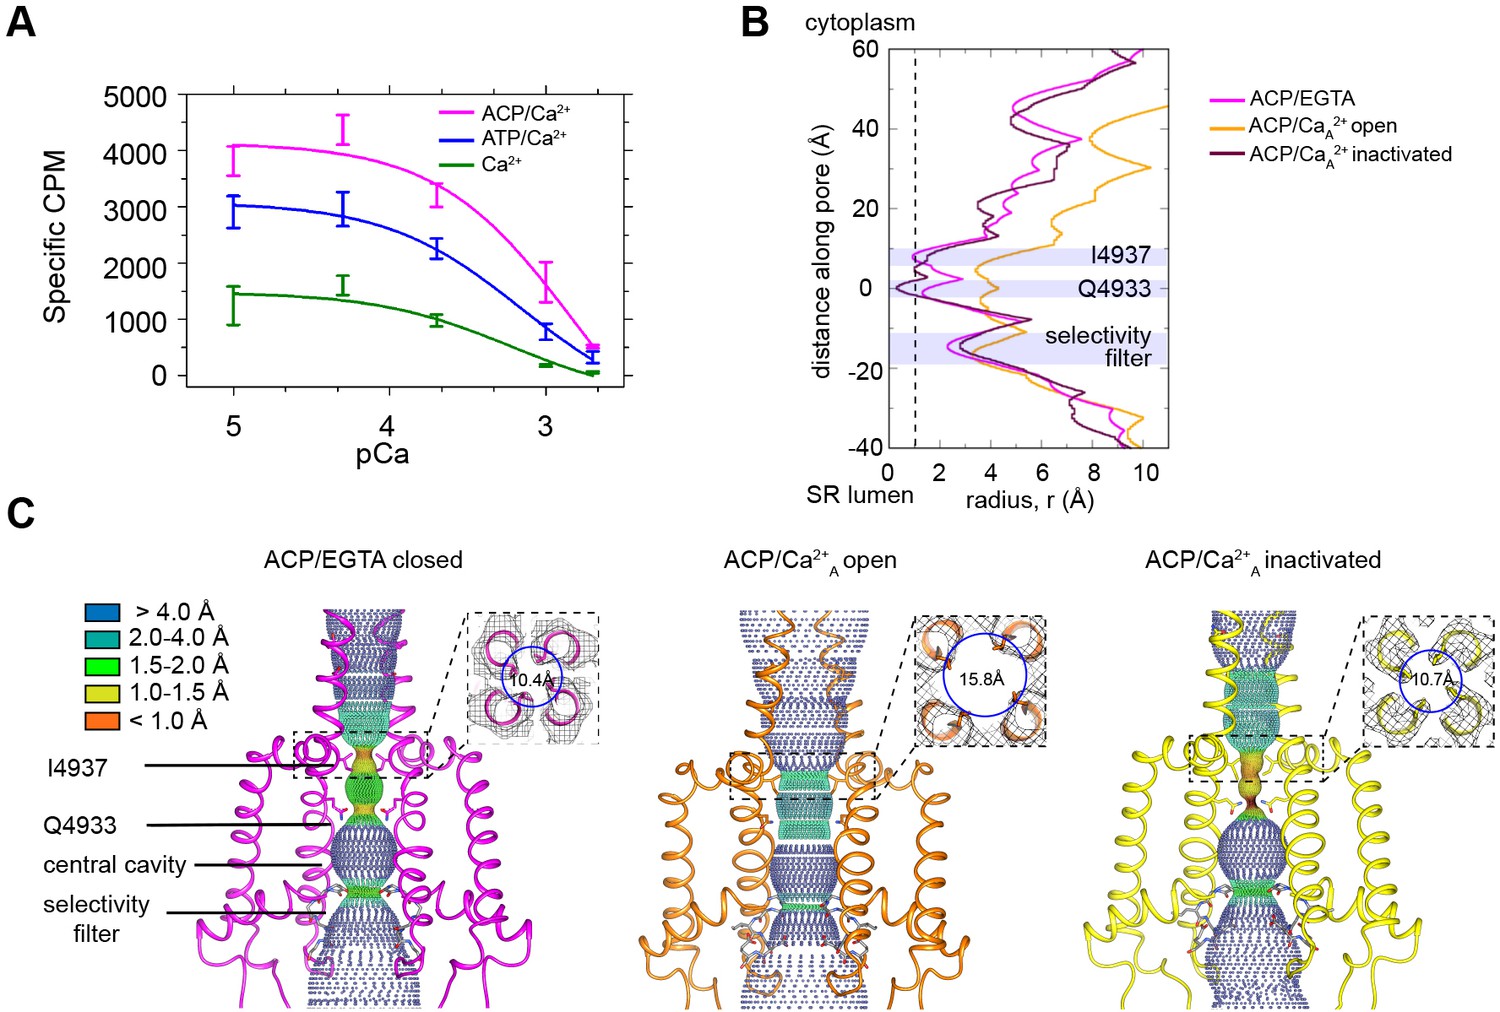
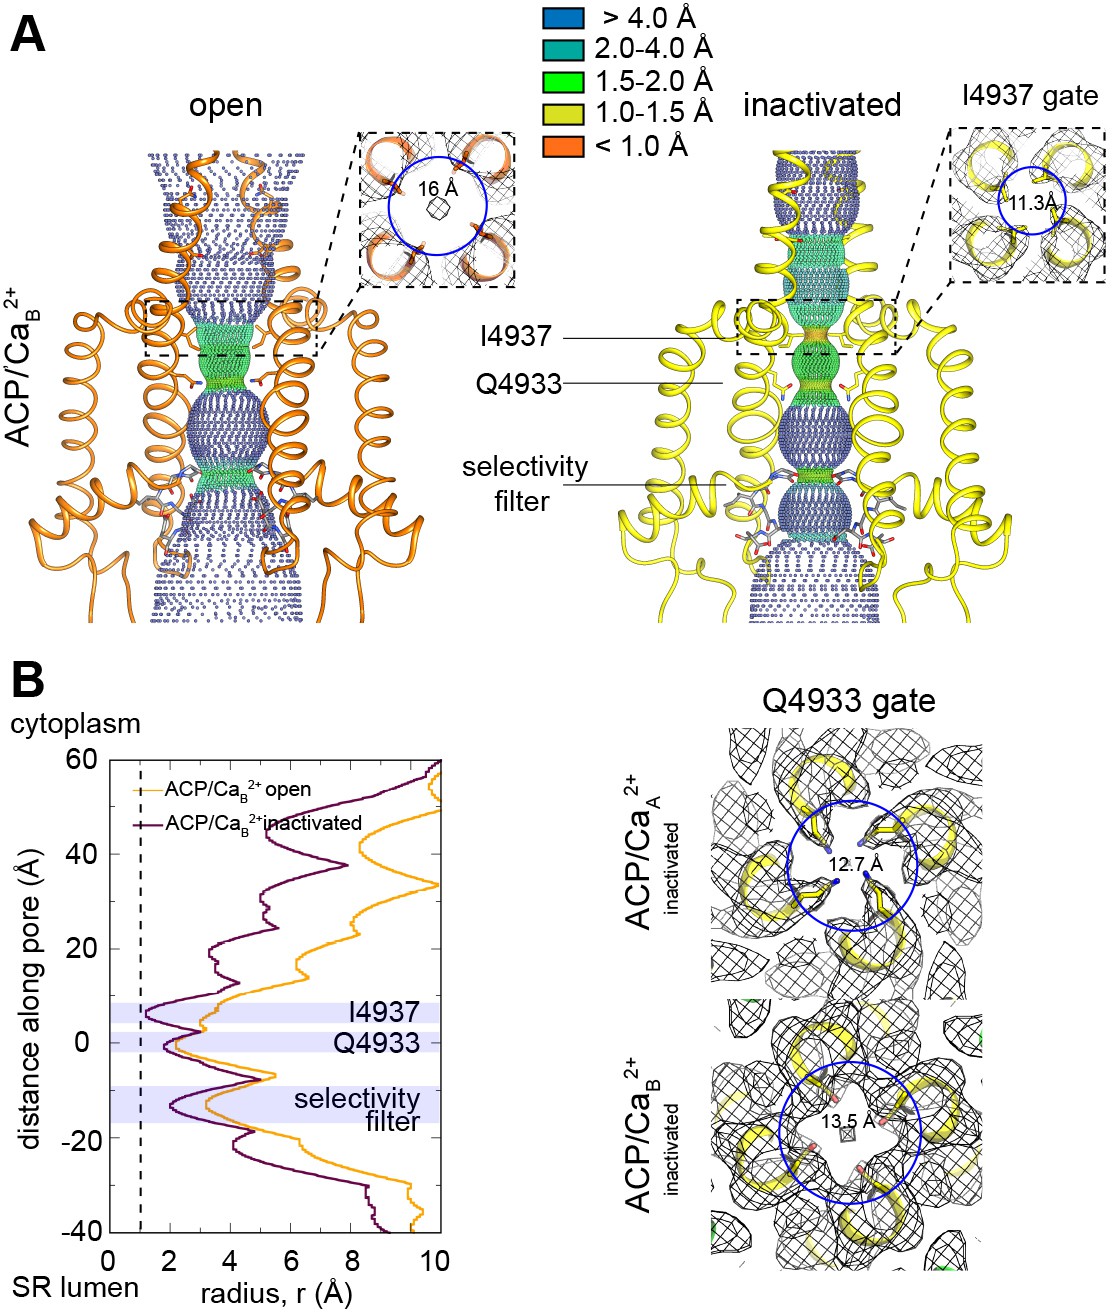
RyR1 at high Ca2+ concentration exhibits a mixture of open and inactivated conformations.
(A) Ryanodine binding of rabbit skeletal sarcoplasmic reticulum (SR) microsomes showing the Ca2+-induced inactivation of RyR1; activators ATP or ACP (2 mM) increased channel open probability by 3- and 4.5-fold, respectively. Ca2+ concentrations of 100 μM to 2 mM progressively decrease the probability of opening (Po). Mean specific [3H]-ryanodine binding ± SEM from four independent experiments. (B) Pore profile of RyR1-ACP/EGTA, and of open and inactivated conformations in the RyR1-ACP/Ca2+A dataset calculated with the program HOLE (Smart et al., 1993). The position of relevant landmarks is indicated with violet shadowing. Radius corresponding to a dehydrated Ca2+ ion shown with a dashed line. (C) Dotted surfaces of RyR1 ion permeation pathway in closed, open, and inactivated conformations, color-coded according to pore radius. Overlaid coordinates of the S5, S6, pore helices, and selectivity filter are shown for two diagonal protomers. Insets: cytoplasmic views of the Ile4937 constriction and corresponding pore diameter measured at the Cα backbone. Similar results were obtained for RyR1-ACP/Ca2+B (Figure 1—figure supplement 5).
Figure 1—figure supplement 1
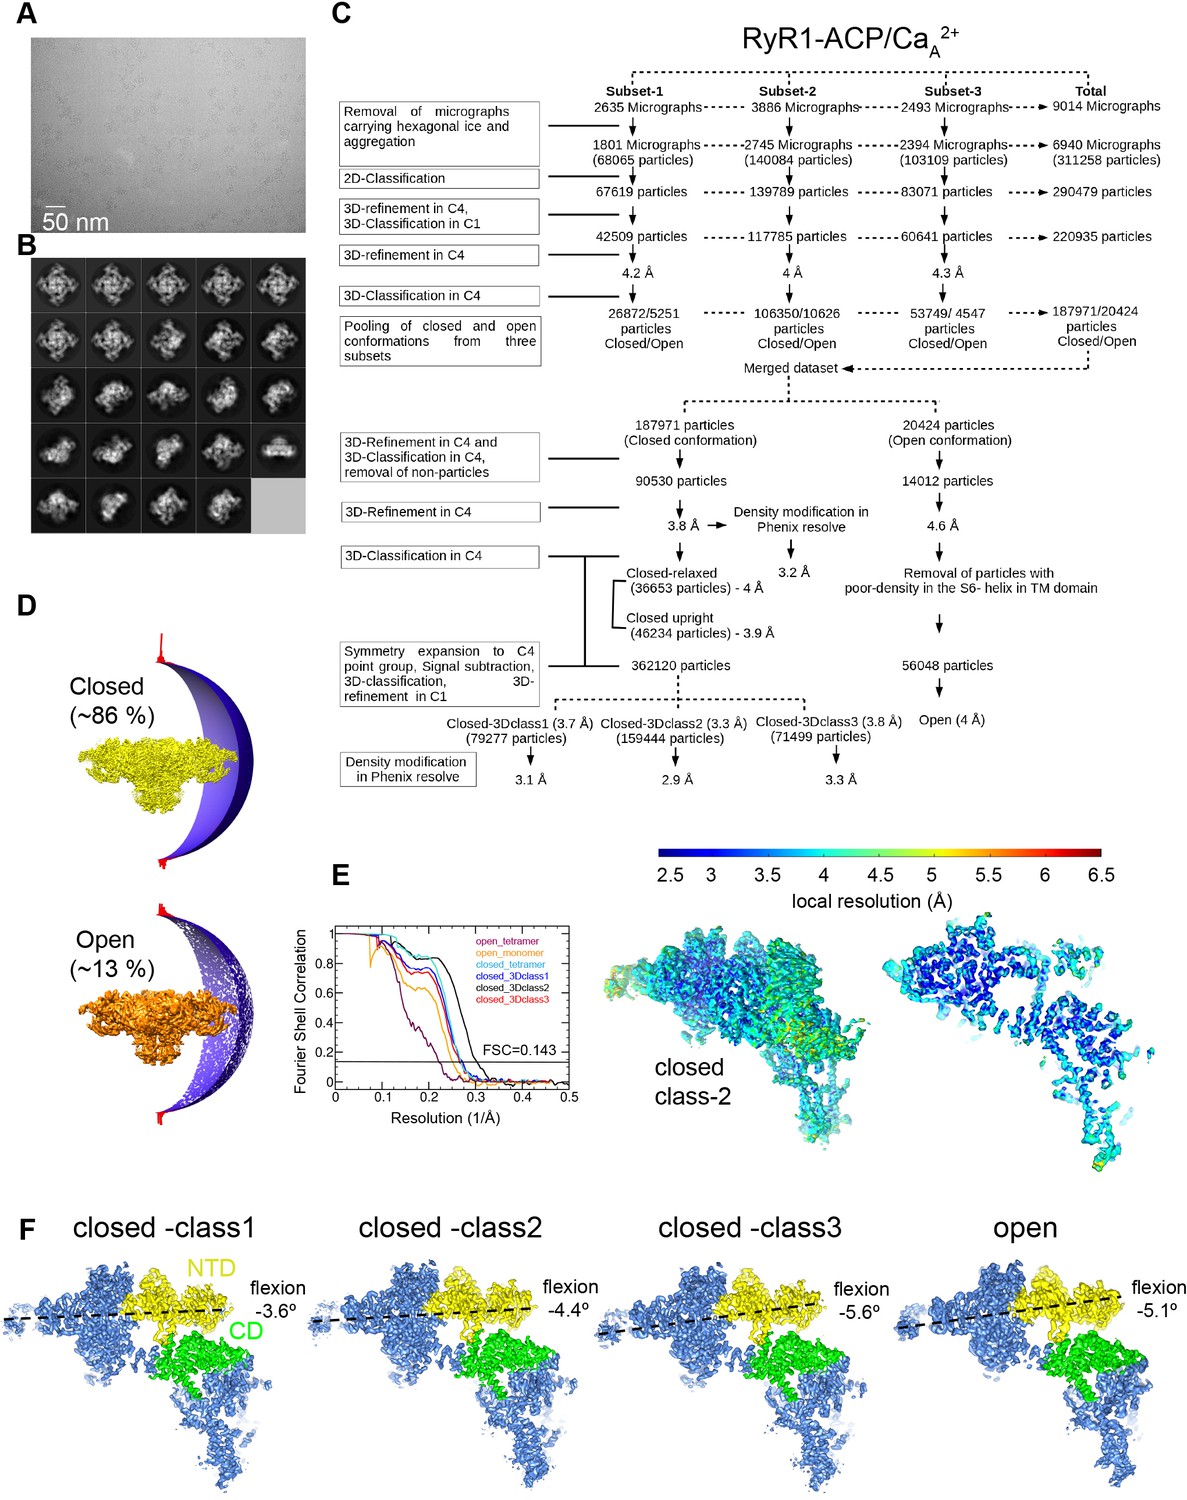
Image processing scheme for the RyR1-ACP/Ca2+A dataset.
(A) Representative micrograph collected on a Titan Krios at ×81,000 magnification with a K3 camera in counting mode. (B) Representative 2D class averages obtained by reference-free 2D classification in RELION. (C) Image processing workflow with tetrameric and single subunit-masked RyR1 particles in RELION. Overall resolution values obtained for the inactivated conformations after density modification in PHENIX.Resolve. (D) Euler angle distribution of the particles contributing to the RyR1-ACP/Ca2+ inactivated (3.8 Å resolution) and RyR1-ACP/Ca2+ open (4.6 Å resolution) maps. (E) Left: gold standard Fourier shell correlation prior to density modification. Right: local resolution of the symmetry-expanded maps calculated with ResMap. (F) Main 3D classes obtained from the focused 3D classification after symmetry expansion with NTD (N-terminal domain) and CD (Central domain) domains highlighted in yellow and green, respectively, with the pore axis on the right. Classification yielded one open conformation and three closed conformations that differ in the flexion angle of the cytoplasmic domain.
Figure 1—figure supplement 2
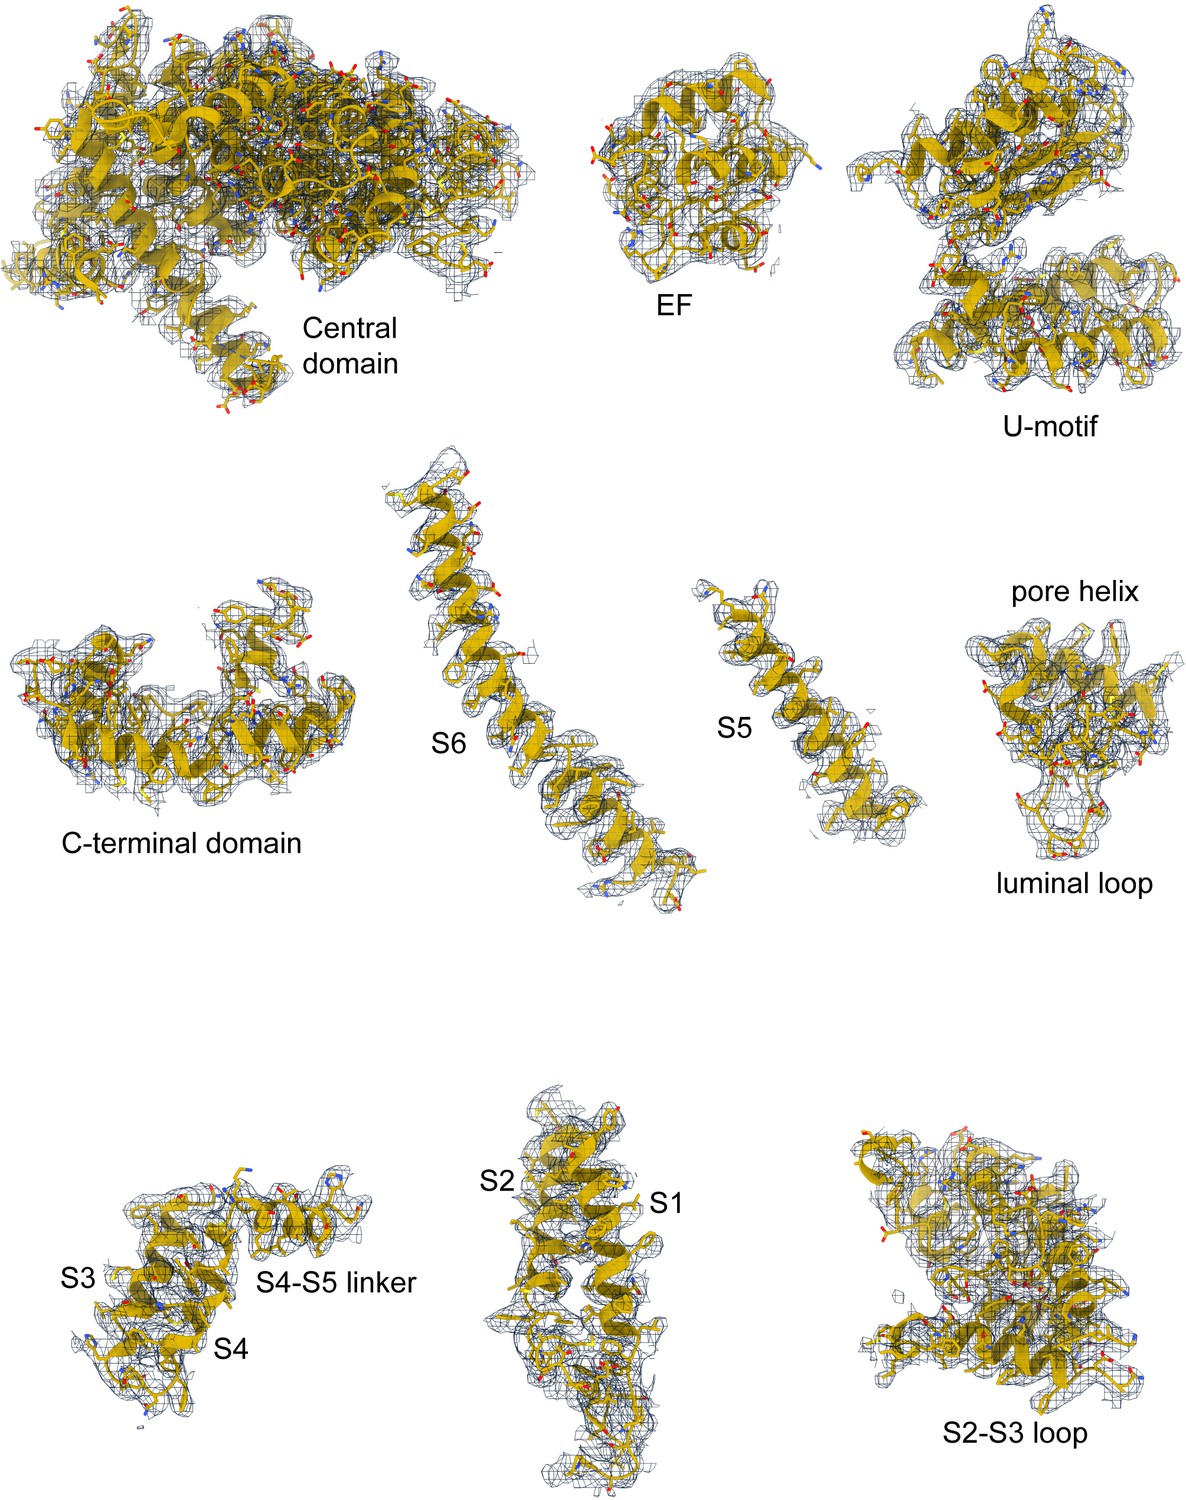
Correlation of RyR1-ACP/Ca2+A inactivated model with the cryogenic electron microscopy (cryo-EM) density.
Model quality for RyR1-ACP/Ca2+A inactivated in the consensus cryo-EM map; domains in the central and transmembrane regions are shown.
Figure 1—figure supplement 3
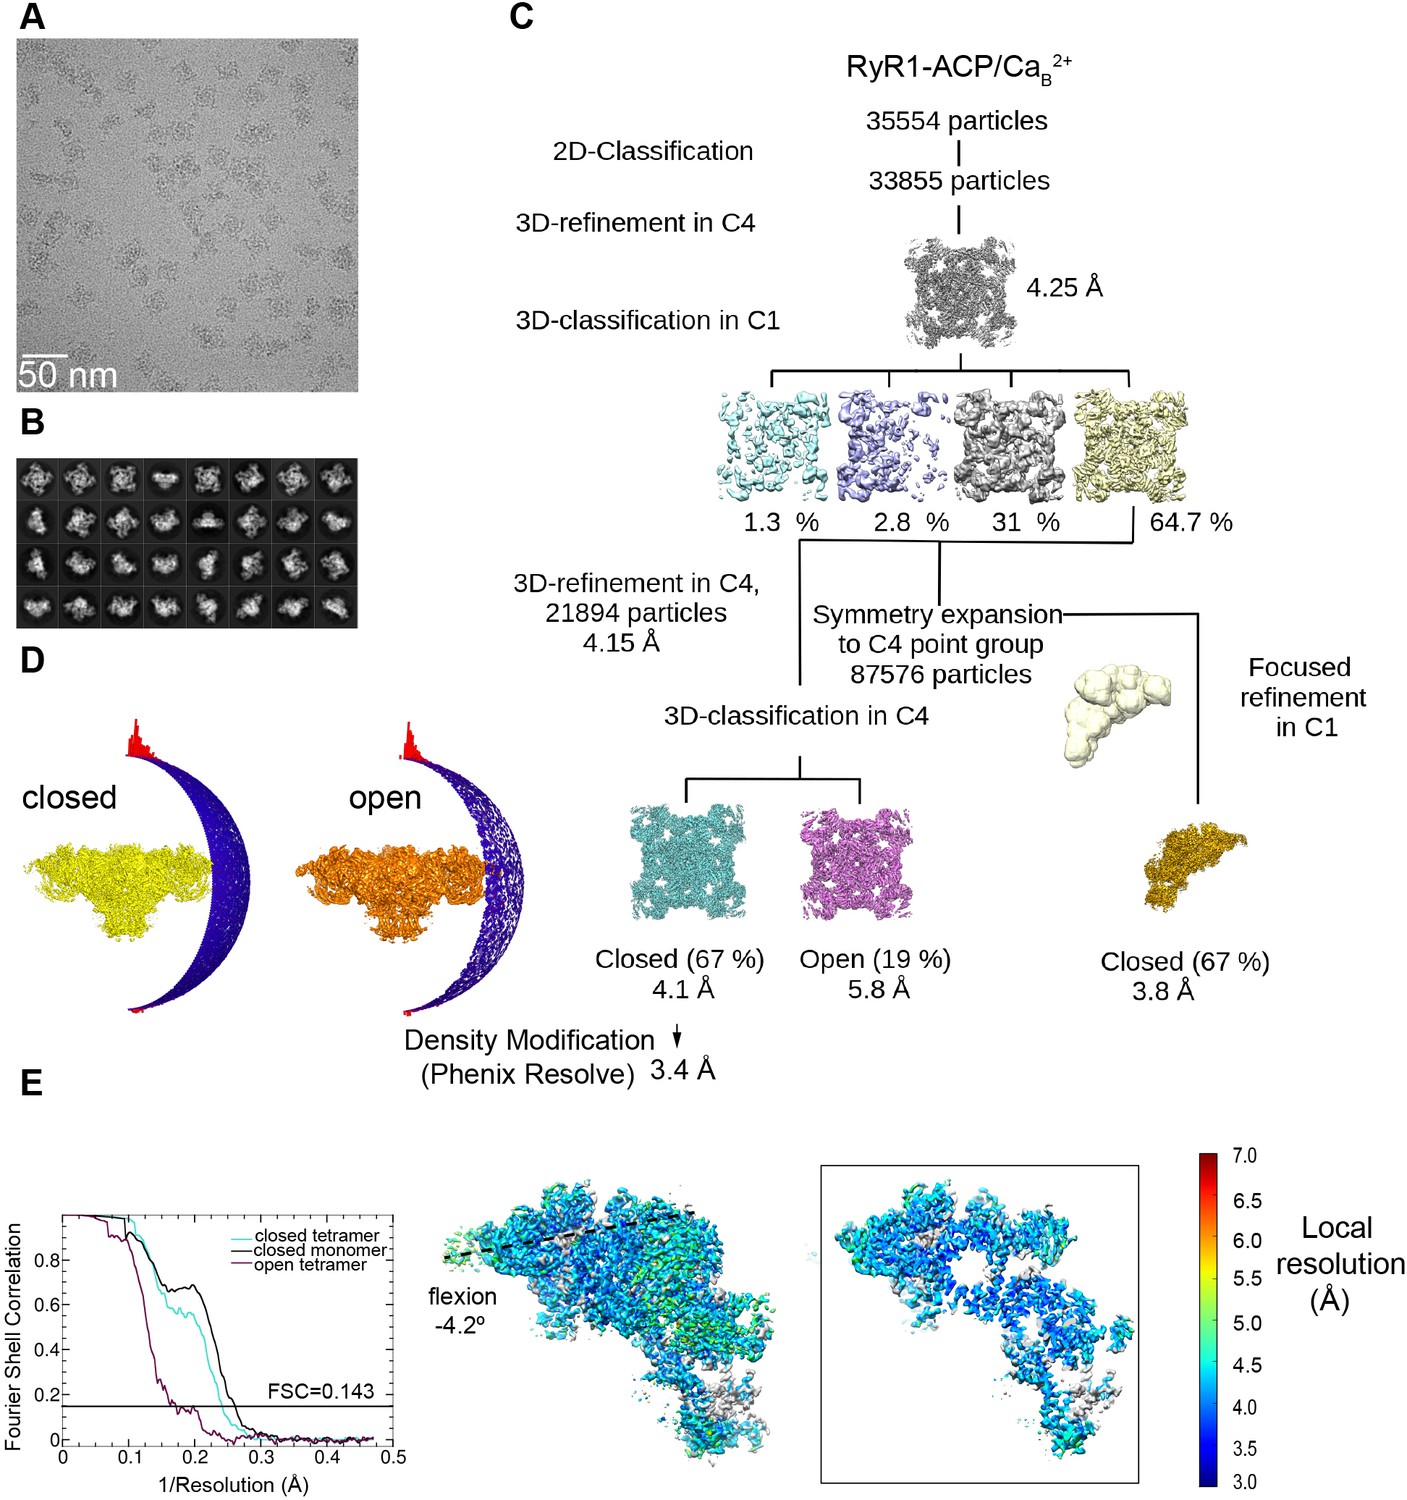
Image processing scheme for the RyR1-ACP/Ca2+B dataset.
(A) Representative micrograph collected on a Titan Krios at ×130,000 magnification with a K2 camera in super-resolution mode. (B) Representative 2D class averages obtained by reference-free 2D classification in RELION. Overall resolution values obtained for inactivated 3D class after a density modification in PHENIX.Resolve. (C) Workflow of image processing with tetramer and single subunit-masked particles carried out in RELION. (D) Euler angle distribution of the particles contributing to the RyR1-ACP/Ca2+B-inactivated and RyR1-ACP/Ca2+B open maps at 4.1 Å and 5.8 Å resolution, respectively. (E) Left: gold standard Fourier shell correlation prior to density modification. Right: local resolution of the symmetry-expanded map calculated with ResMap with flexion angle of the cytoplasmic domain indicated.
Figure 1—figure supplement 4
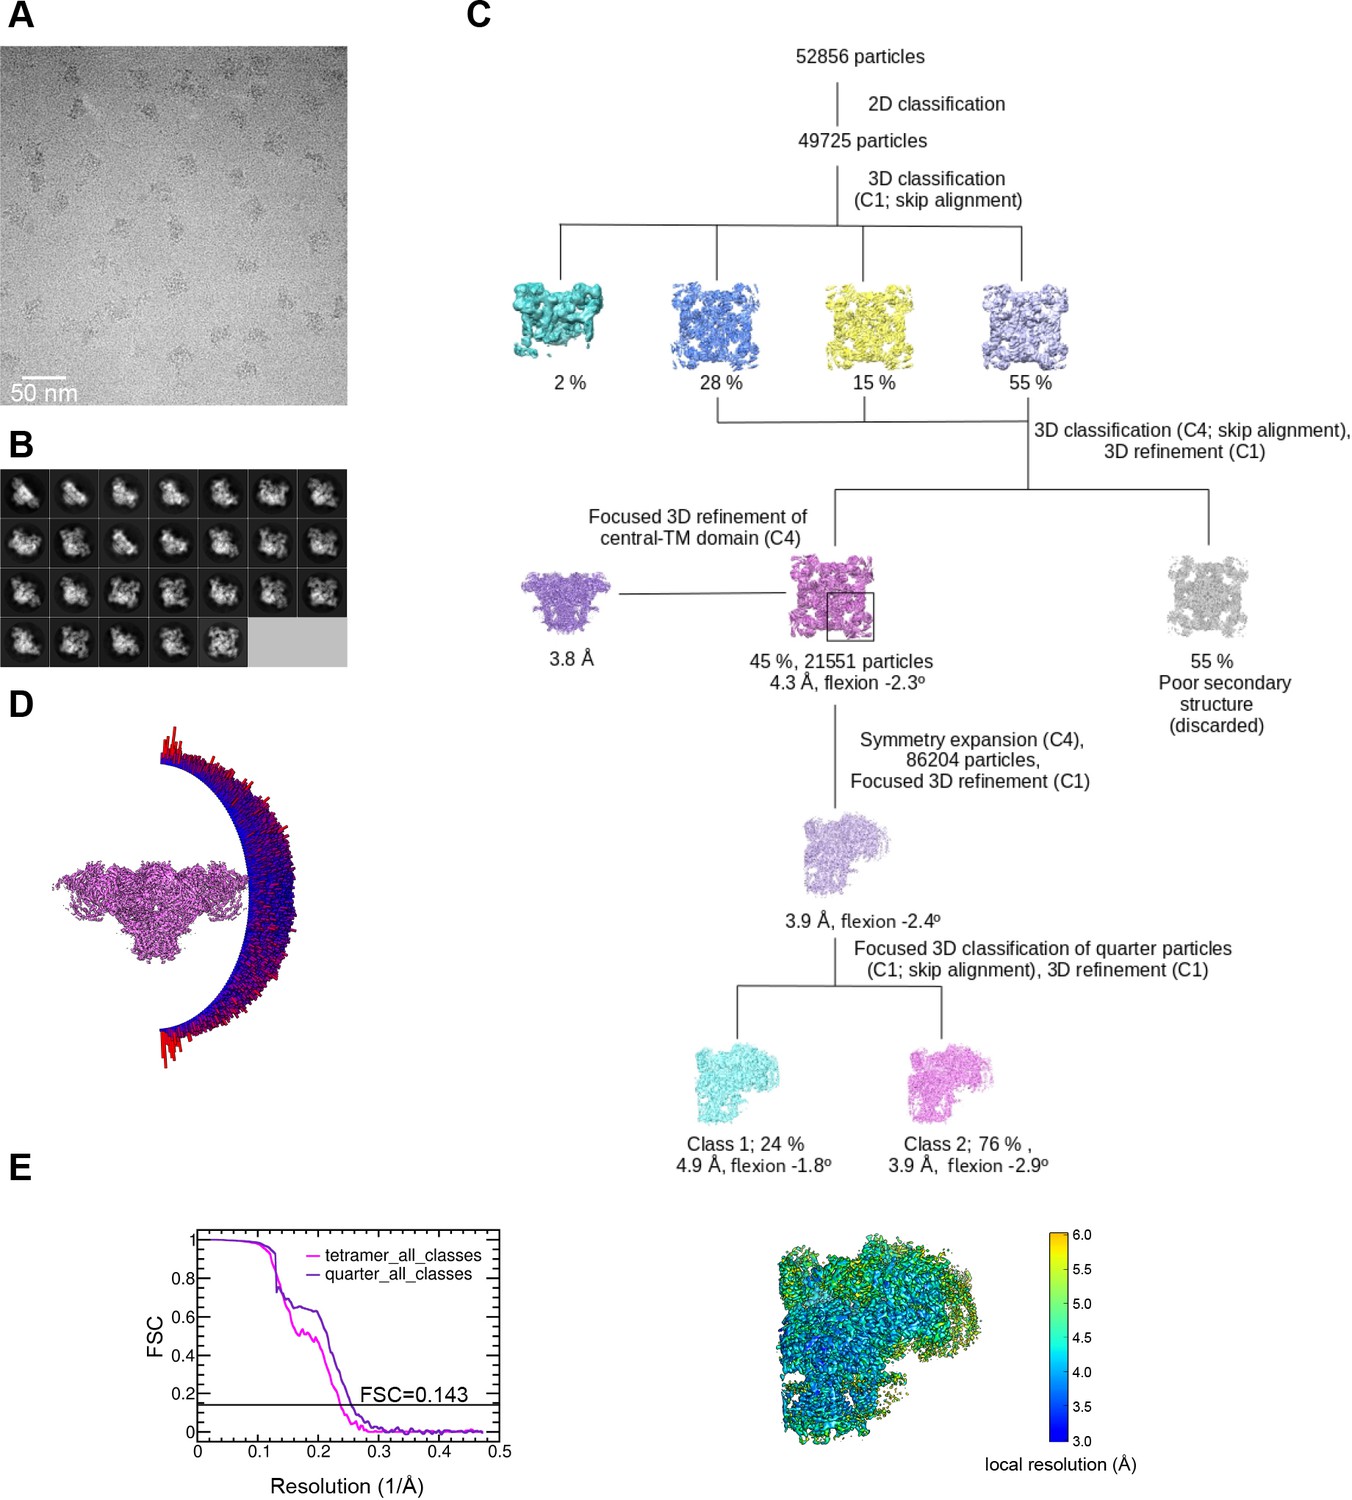
Image processing scheme for the RyR1-ACP/EGTA dataset.
(A) Representative micrograph collected on a Titan Krios at ×130,000 magnification with a K2 camera in super-resolution mode. (B) Representative 2D class averages obtained by reference-free 2D classification in RELION. (C) Image processing workflow including 3D classification focused on RyR1’s quarter carried out in RELION. (D) Euler angle distribution of the particles contributing to the 4.3 Å resolution 3D map. (E) Left: gold standard Fourier shell correlation. Right: local resolution of the symmetry-expanded map calculated with ResMap.
Figure 1—figure supplement 5
Pore conformation in the RyR1-ACP/Ca2+B dataset.
(A) Dotted surfaces of RyR1 ion-permeation pathway in open and inactivated conformations. Inset: fourfold cytoplasmic views of Ile4937 constriction and corresponding pore diameter (measured at Cα backbone) with respective cryogenic electron microscopy (cryo-EM) maps (mesh). (B) Left: pore profiles of inactivated and open conformations calculated with HOLE. Radius corresponding to a dehydrated Ca2+ ion is shown as a dotted line. Right: fourfold cytoplasmic views of the Gln4933 constriction in RyR1-ACP/Ca2+A and RyR1-ACP/Ca2+B pores with their respective cryo-EM maps.
Figure 2 with 3 supplements
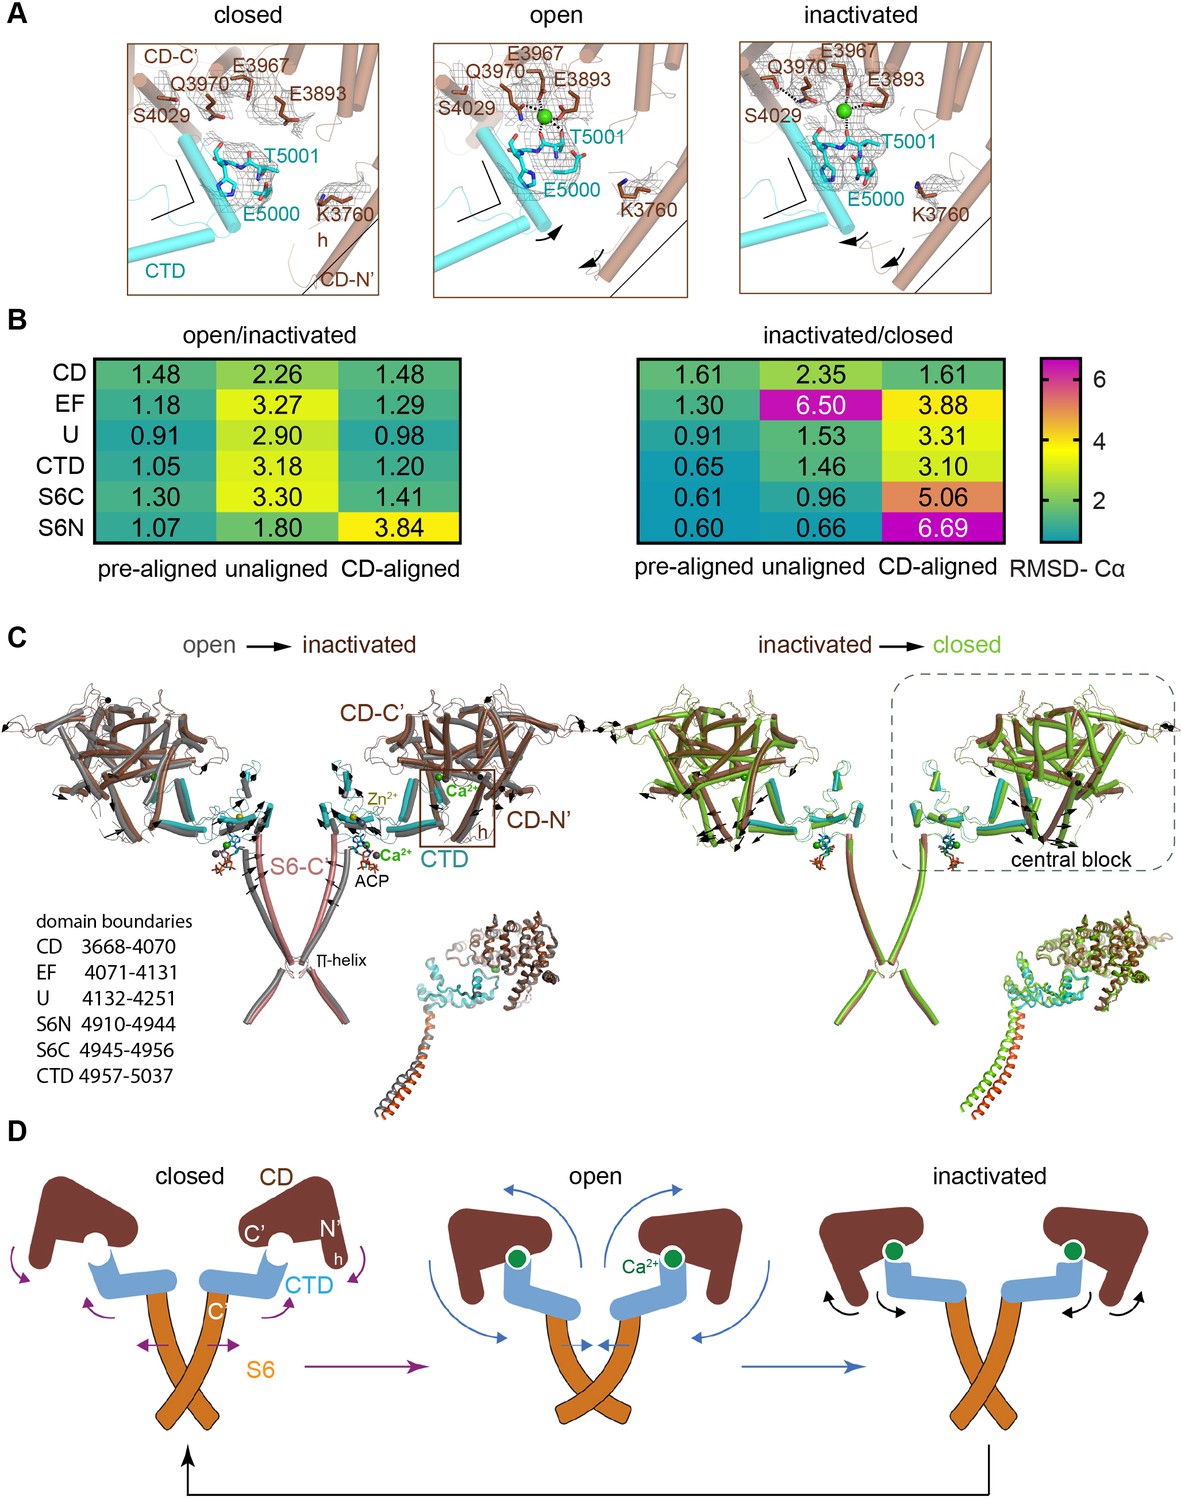
Inactivation of RyR1 involves out-of-plane rotation of the central block and rearrangement around the Ca2+ activation site.
(A) The high-affinity Ca2+-binding site in the CD/CTD interface with density around the Ca2+ site contoured at 4σ. Contacts within 2.8 Å from Ca2+, as well as additional contact Gln3970-Ser4029 within 3.6 Å, are represented by dashed lines. Channel axis is on the left. During the transition from open to inactivated conformations, the CD/CTD block tilts around the Ca2+-binding site such that the protruding fourth helix of the CD (h) and connected CTD tilt inward, while the CD-C′ tilts upward and away from the sarcoplasmic reticulum (SR) membrane – with Gln3970 separating from Ca2+ by ~6 Å. Arrows and stationary reference lines illustrate the conformational changes undergone with respect to the panel on the left. The region represented relative to the channel is highlighted with a square in panel (C). See Figure 2—figure supplement 1 for the corresponding space-filling representation. (B) Heat map showing Cα-backbone root mean square deviation (RMSD) (in Å) between domain pairs from respective conformations after aligning them (pre-aligned), in their native conformation (unaligned), and after aligning the protomers through their respective CD (CD-aligned). The RMSD difference between unaligned and pre-aligned represents the change caused by domain relocation. (C) Overlaid structures of the CD-CTD-S6 domains in different conformations; only two protomers shown for clarity. Left: in the transition from RyR1-ACP/Ca2+ open (gray) to RyR1-ACP/Ca2+ inactivated (colored), the CD-CTD block, ‘connected’ by Ca2+ coordination, undergoes an out-of-plane rotation around the Ca2+-binding site that pushes S6C′ toward the pore axis, closing the channel. Right: in the transition from RyR1-ACP/Ca2+ inactivated (colored) to RyR1-ACP/EGTA (green), Ca2+ unbinding disconnects the CD from the CTD. Structures at the bottom right of each panel show the comparison of the CD-CTD-S6C′ of the central block after forcing superimposition of their respective CDs. Residue boundaries for relevant domains are specified. (D) Schematics of the conformational changes from RyR1-ACP/EGTA (closed), to RyR1-ACP/Ca2+ open, to RyR1-ACP/Ca2+ inactivated. Activation, where Ca2+ binds to the high-affinity site, is required prior to inactivation. The CD-protruding fourth helix (3753–3769) is indicated by ‘h.’ Colored arrows indicate the conformational change toward the following structure.
Figure 2—figure supplement 1
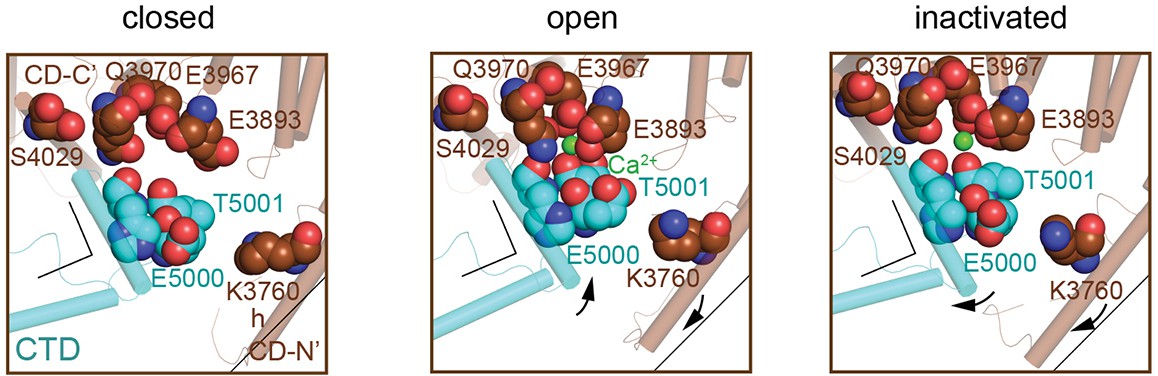
Reorganization of the high-affinity Ca2+-binding site at the CD/CTD interface under different conditions.
Ca2+-binding site in the CD/CTD interface in different conformations with involved residues shown with spheres. Residues Glu3983, Glu3967, Gln3970 (CD), and Thr5001 (CTD), within 2.8 Å from Ca2+ in the open state, are shown. In going from RyR1-ACP/Ca2+ open to RyR1-ACP/Ca2+ inactivated, Gln3970 switches its interaction from Ca2+ to Ser4029 (interaction within 3.6 Å). Arrows and stationary reference lines illustrate the conformational changes undergone with respect to the panel on the left. The region represented relative to the channel is highlighted with a square in Figure 2C; fourfold axis is on the left.
Figure 2—figure supplement 2
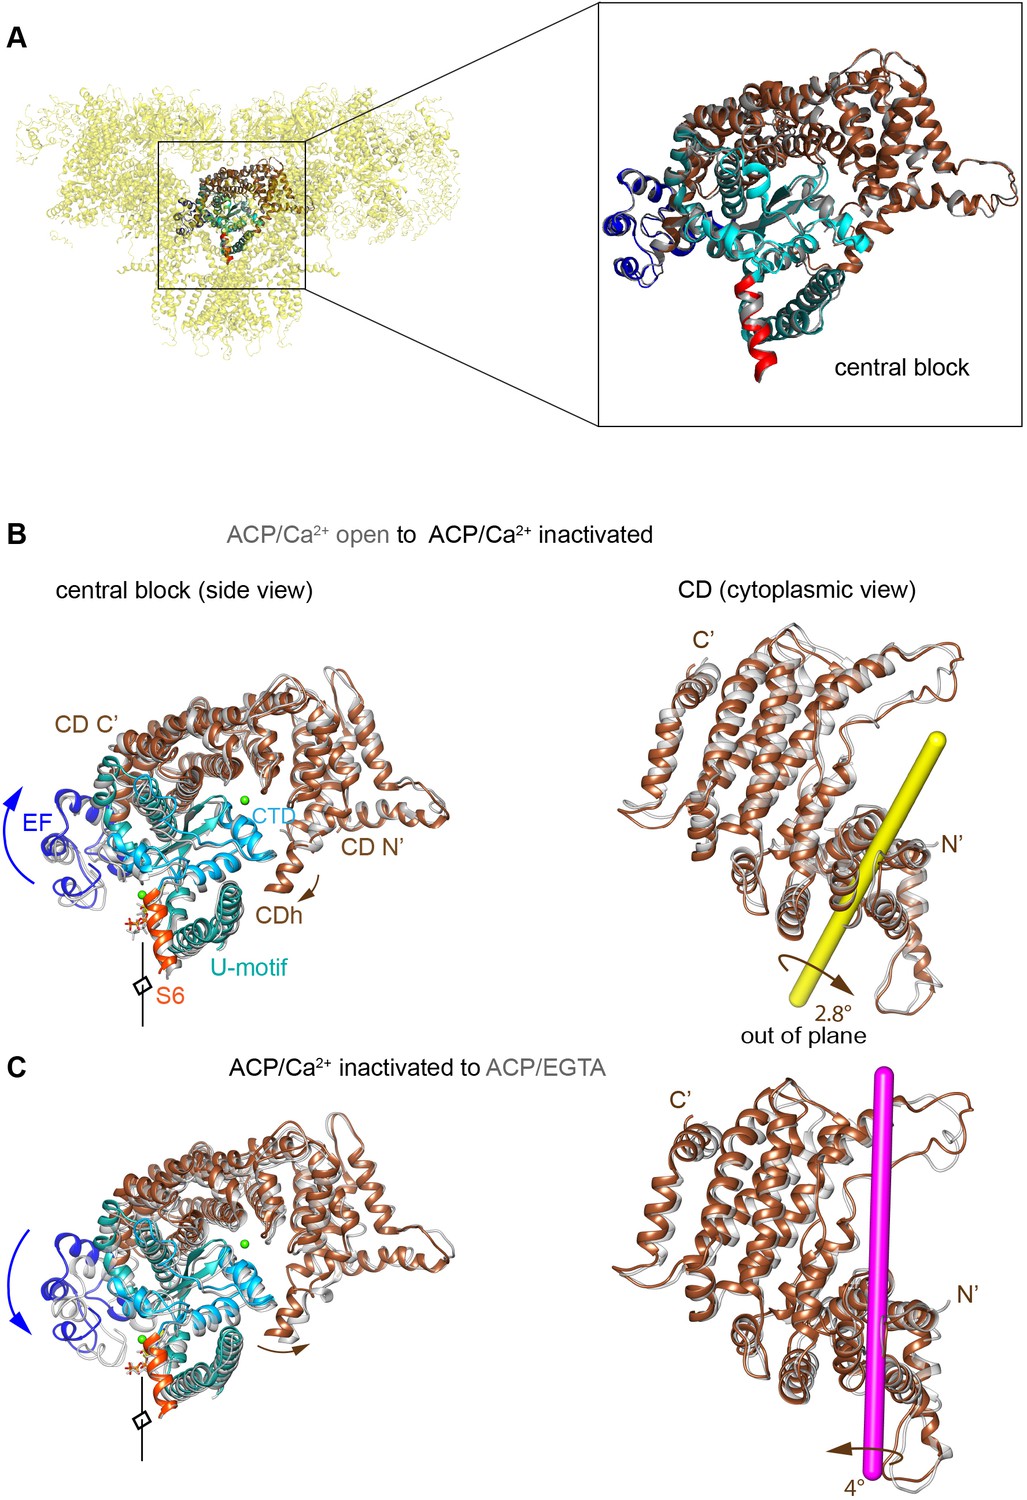
Rotation axes of the CD of RyR1 among the different conformational transitions.
(A) Reproducibility of the conformation of the ‘central block’ of RyR1-ACP/Ca2+ inactivated from two independent datasets (A and B, superimposed), with a root mean square deviation (RMSD) of 0.95 Å over the Cα atoms. The central block comprises the CD, EF hand, U-motif, S6C′, and CTD. (B) Transition from RyR1-ACP/Ca2+ open (gray) to RyR1-ACP/Ca2+ inactivated (colored) involves an out-of-plane rotation of the CD around the yellow-colored axis. This results in inward tilt in CD-N′ (brown arrows) and upward shift/tilt of CD-C′ and connected EF hand domain (blue arrows). Two orthogonal views are shown, and the fourfold axis on the left panels, in front of the structure, is indicated. (C) Transition from RyR1-ACP/Ca2+ inactivated (colored) to RyR1-ACP/EGTA closed (gray) involves out-of-plane rotation of the CD of RyR1 around the magenta-colored axis.
Figure 2—video 1
Ca2+-induced transitions in activation and inactivation.
During activation, Ca2+ coordination joins the CD and CTD-S6C′ region, separating the S6 four-helix bundle and opening the channel. High Ca2+-induced inactivation promotes out-of-plane rotation of the CD-CTD-S6C′ block. This pushes the S6 helices towards the pore axis, closing the channel. Only two protomers in diagonal are shown.
Figure 3
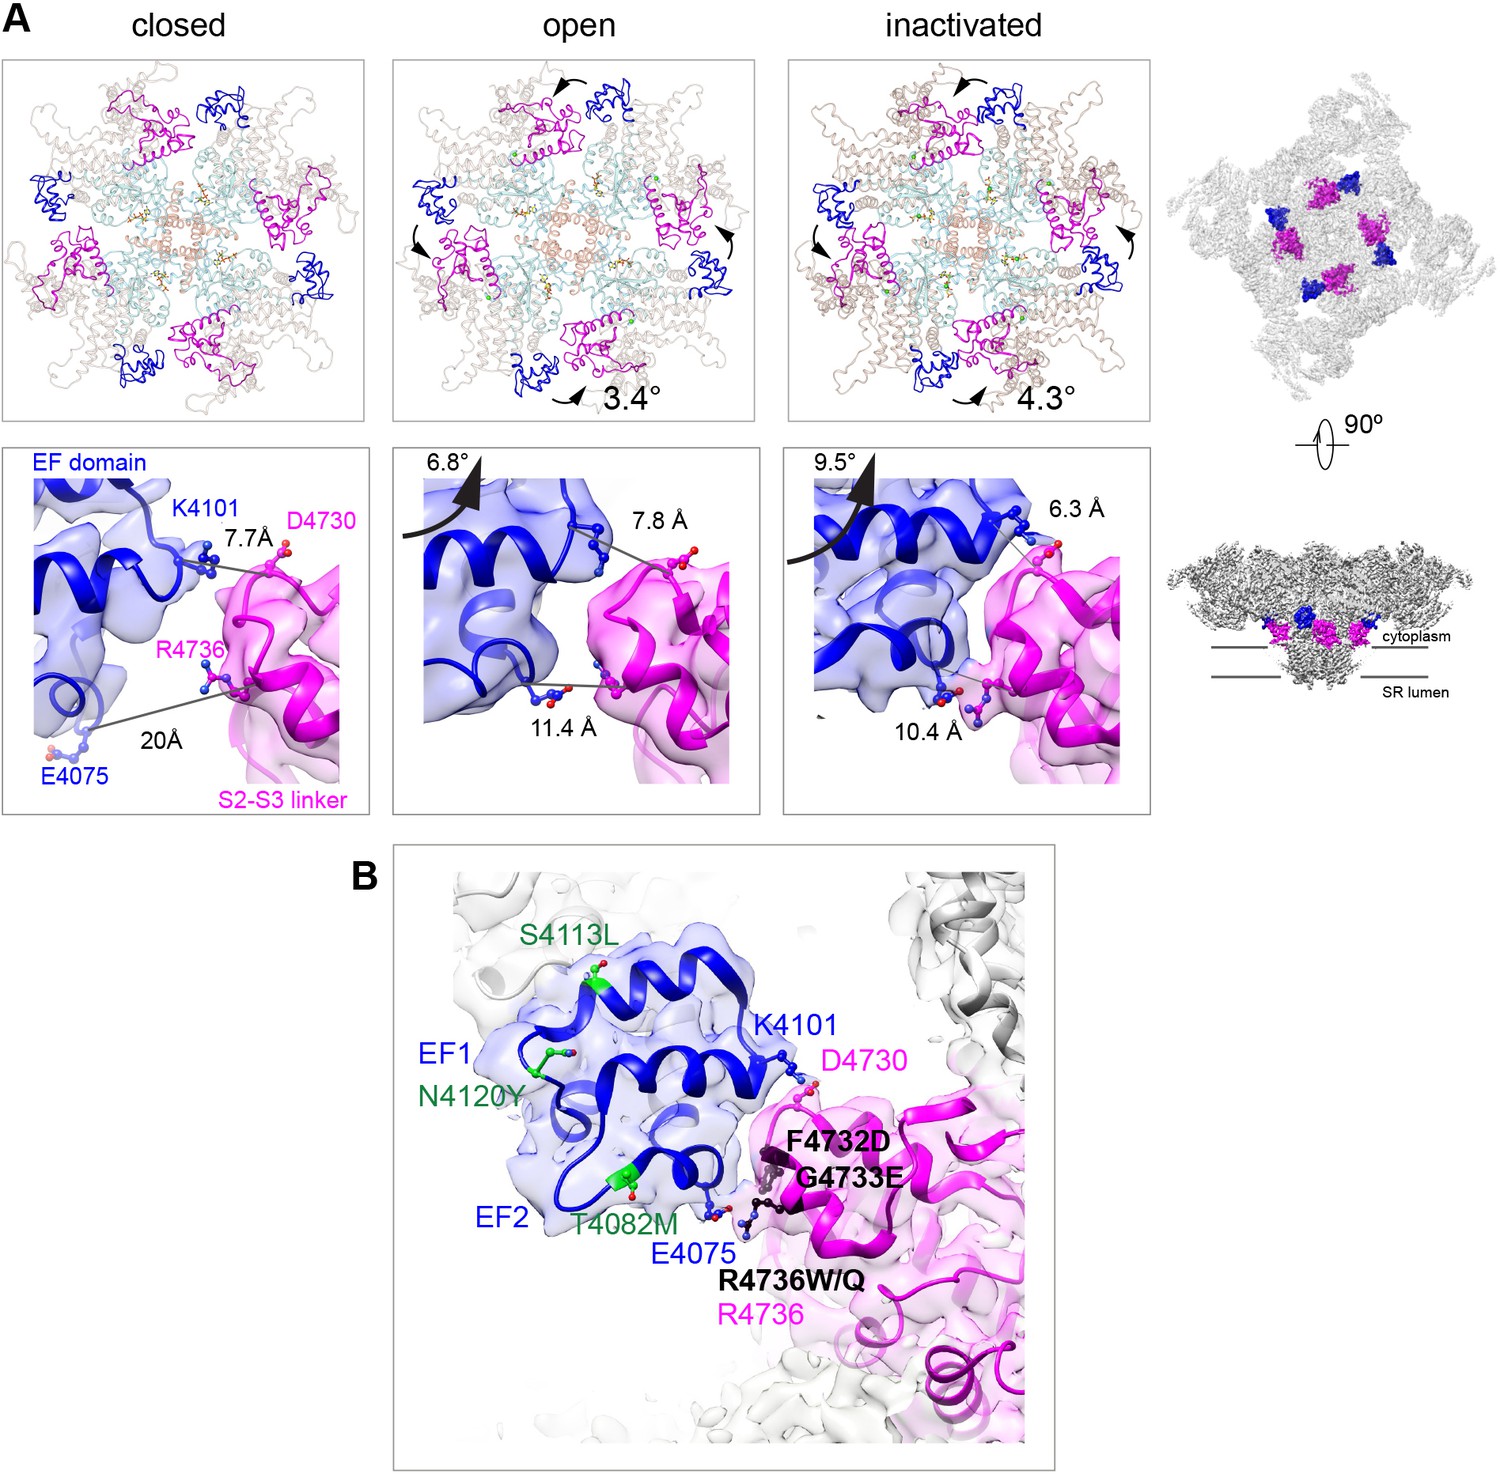
Two salt bridges between the EF hands and the S2–S3 loop are determinant for the inactivated state.
(A) Cytoplasmic sarcoplasmic reticulum (SR) view (top row) and side view (bottom row) highlighting the EF hand domain (blue) and S2–S3 loop (magenta) at the subunit interface. Counterclockwise in-plane and ascending out-of-plane rotations of the central region in the transition from RyR1-ACP/EGTA (closed) to RyR1-ACP/Ca2+ open brings the two domains closer together. Further rotation of the CD (tan color in top row) and its protruding EF hand domain in RyR1-ACP/Ca2+ inactivated brings the two domains in contact. The inter Cα-Cα contact distances illustrate the progressive approximation of the two domains. Two salt bridges, Lys4101-Asp4730 and Glu4075-Arg4736, form in the RyR1-ACP/Ca2+-inactivated conformation. The location of the domains in the context of RyR1 is shown on the right panels. (B) MH/CCD mutation sites in the interface between the EF hand domain and S2–S3 loop that abolish Ca2+-dependent inactivation (black) versus MH/CCD mutations without effect on inactivation (green). The two EF loops are indicated (EF1, EF2). Residues forming the salt bridges are labeled according to domain color. R4736, directly forming the salt bridge, is susceptible to MH mutation.
Figure 4 with 1 supplement
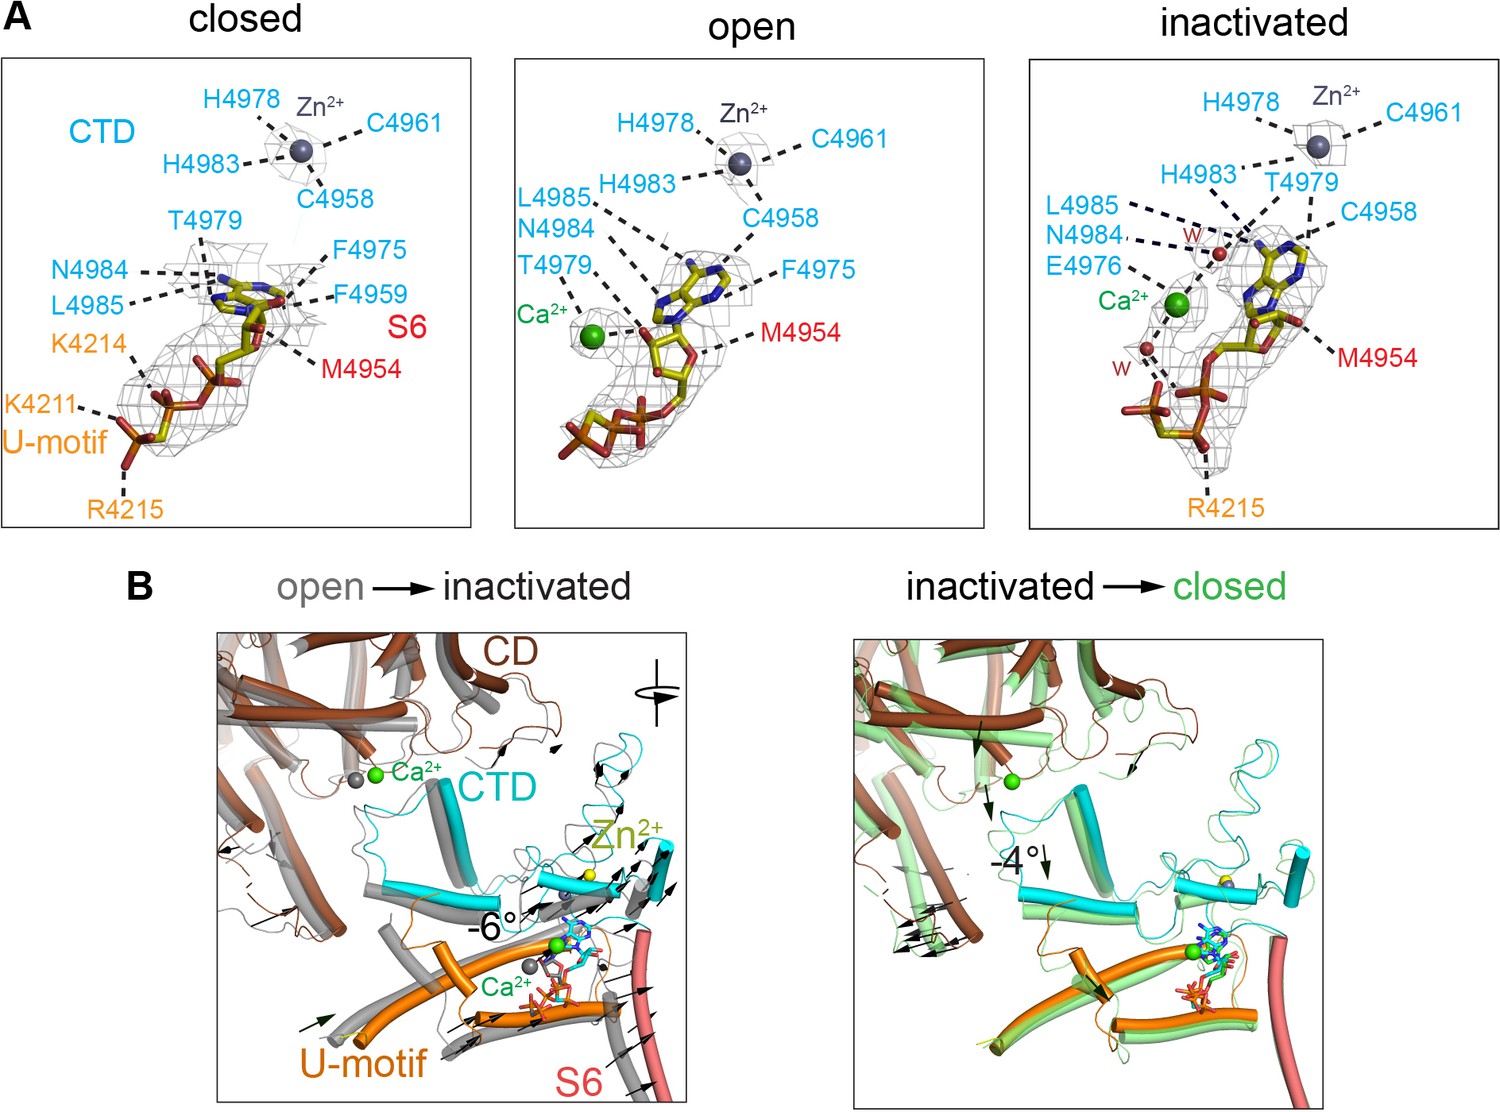
Changes in the interaction network of the nucleotide and complexed Ca2+.
The ATP-binding pocket is formed by the U-motif, CTD, and S6C′. (A) cryo-EM densities (gray mesh) of ACP in the different states represented at map significance values (root mean square deviation [RMSD] σ) above 12, 7, and 7, respectively. Residues within 4 Å of either ACP, Ca2+, or Zn2+ (from the CTD zinc finger) are color-coded according to domain. Notably, an interaction between His4983 (CTD) and ACP is only observed in the inactivated state. Fitted water densities (w) are represented in red. (B) Left: ACP goes deeper into the ATP-binding pocket in RyR1-ACP/Ca2+ inactivated (colored structure, blue ACP) as compared to the open state (gray structure, red ACP) due to a 6° rotation (see arrows). Right: absence Ca2+ in the closed state (green) causes release of the CTD from the CD, resulting in a 4° tilt of the CTD and U-motif (see arrows). Additional reorganization allows closer interaction between ACP and U-motif in the closed state.
Figure 4—figure supplement 1
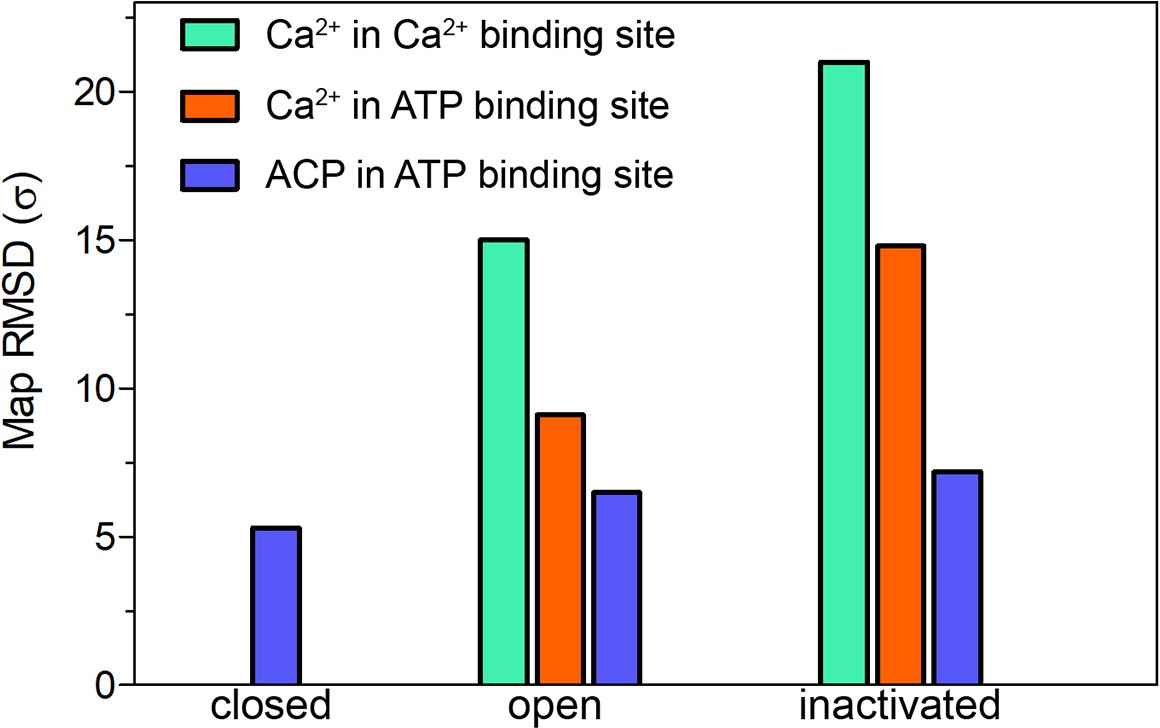
Map significance of the ACP and putative Ca2+ densities under different conditions.
Root mean square deviation (RMSD σ) values of the densities attributed to Ca2+ and ACP in the cryogenic electron microscopy (cryo-EM) maps of RyR1-ACP/EGTA closed, RyR1-ACP/Ca2+ open, and RyR1-ACP/Ca2+ inactivated.
Figure 5 with 2 supplements
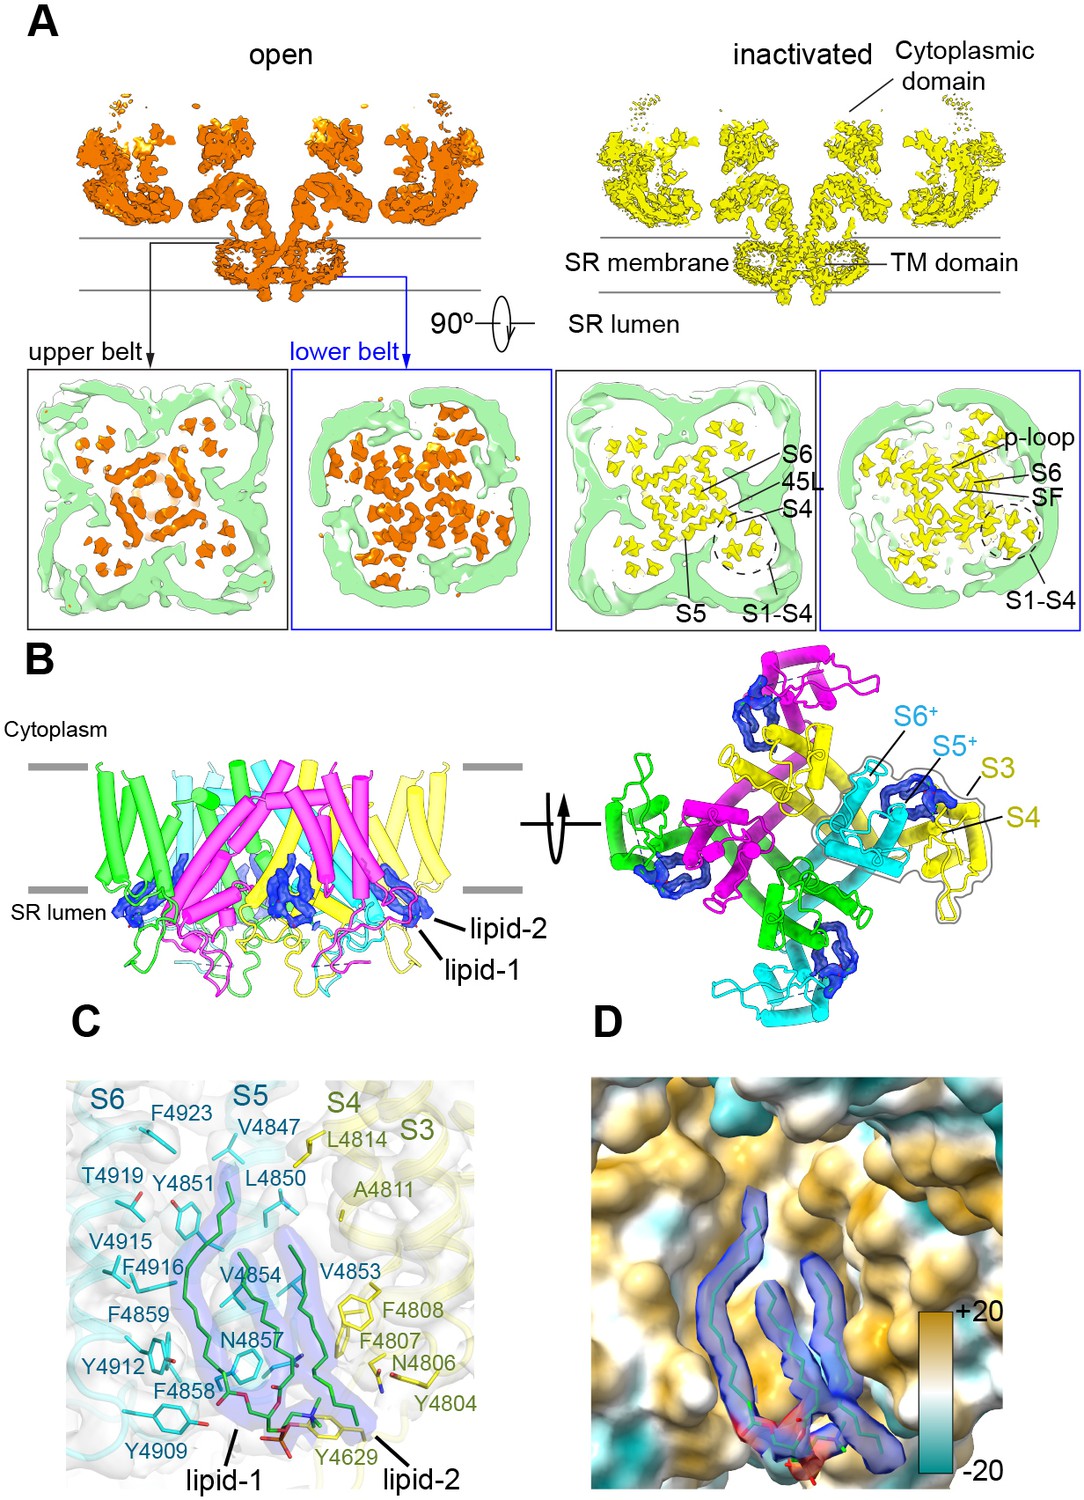
The nanodisc environment and visualization of lipids in a crevice of the transmembrane domain (TMD).
(A) Top: central slice of the side view of the RyR1-ACP/Ca2+A open and RyR1-ACP/Ca2+A-inactivated cryogenic electron microscopy cryo-EM maps highlighting the density corresponding to the upper and lower nanodisc belts. Bottom: corresponding views seen from the cytoplasmic direction. For clarity, the nanodisc density (green) was extracted and low-pass filtered to 7 Å resolution. The top belt of the nanodisc expands slightly to accommodate the conformational change; see also Figure 5—video 1. (B) Side and luminal views of the TMD of RyR1-ACP/Ca2+A inactivated with putative lipid densities shown in blue. (C) Lipid-binding pocket of RyR1-ACP/Ca2+A inactivated lined by lipophilic amino acids from S3 and S4 of the voltage sensor-like domain (S1–S4; yellow) and core helices S5 and S6 (cyan) from two different protomers. Amino acids within 5 Å from the lipids are shown (sticks) with their corresponding side chain densities. Densities corresponding to the lipids contoured at 8σ (in blue) are modeled as a PC (16:0-11:0) for lipid 1 and a 16C acyl chain for lipid 2. (D) Molecular lipophilicity potential of the surface lining the crevice, ranging from hydrophilic (cyan) to hydrophobic (golden). The hydrophobic tails of the lipids are shown in blue, and the negative electrostatic surface potential of the polar lipid head is shown in red.
Figure 5—figure supplement 1
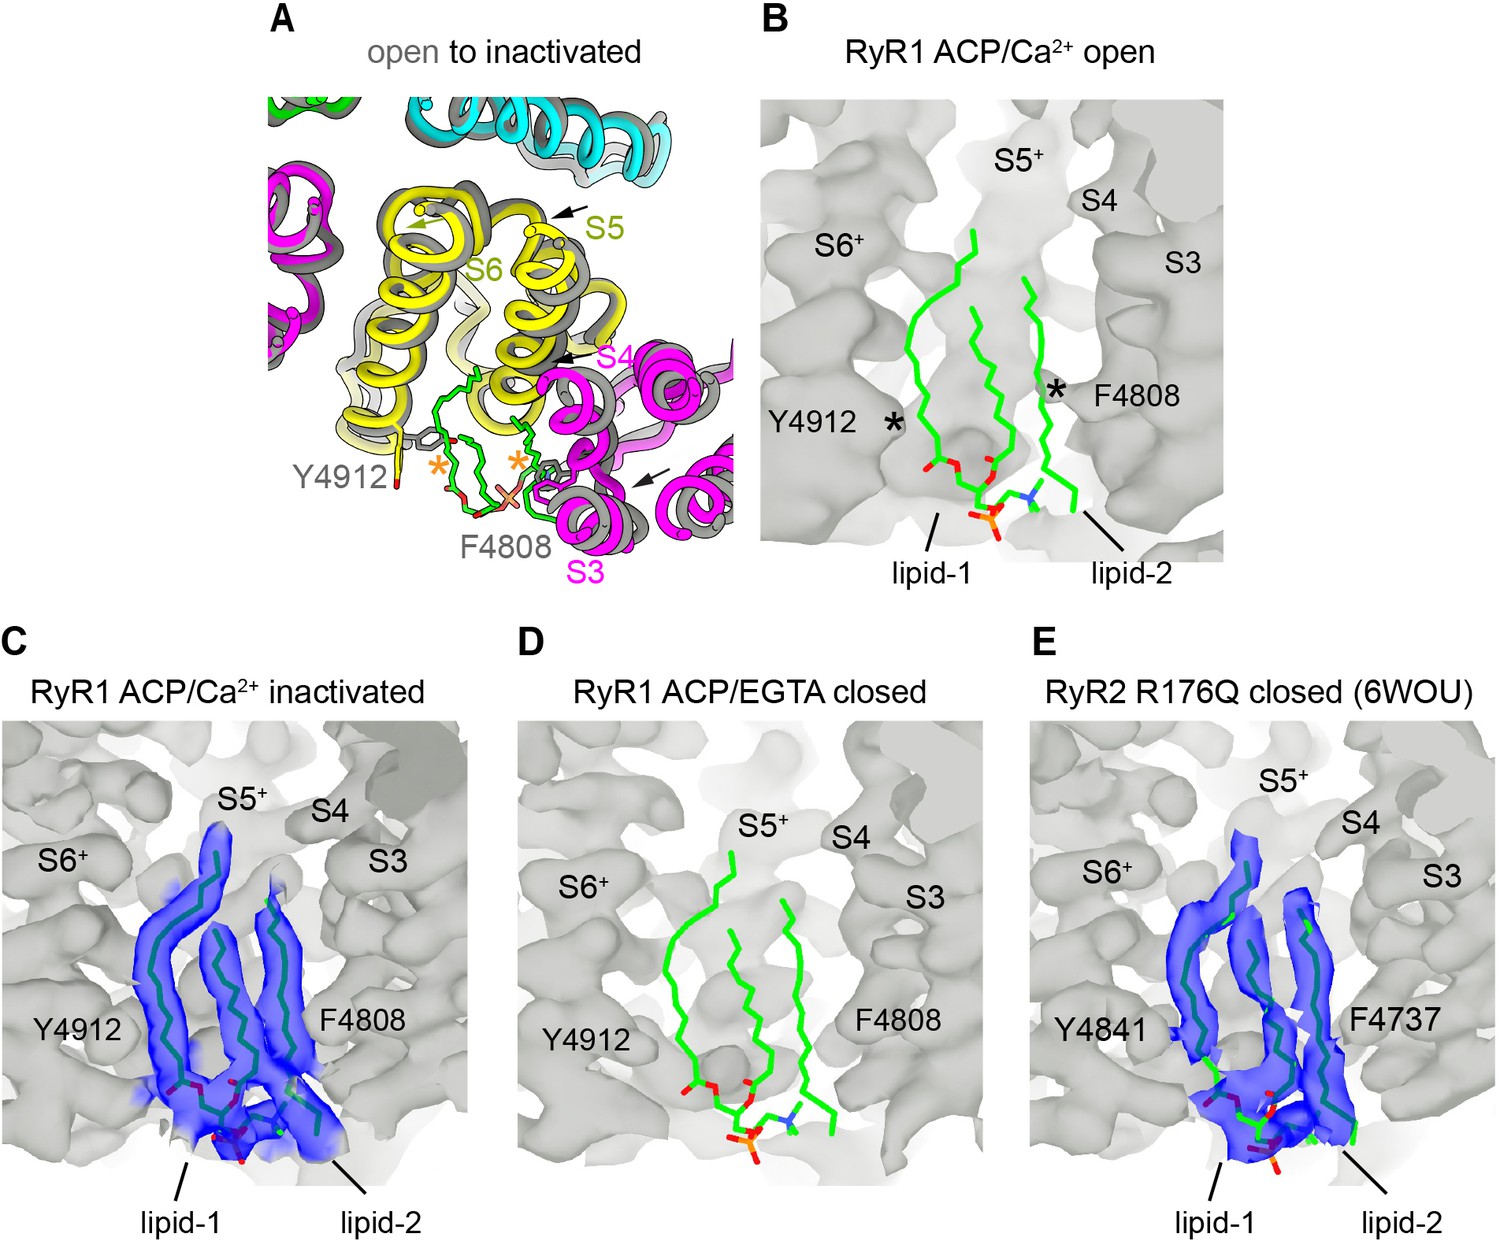
Lipid-binding pocket lined by the S3/S4 and S5+/S6+ helices in inactivated and closed structures of RyR suggests a conserved functional site.
(A) Cytoplasmic fourfold view of part of the transmembrane domain (TMD) showing the movement of the transmembrane helices S3, S4, and S5 (arrows) into the lipid pocket while transitioning from RyR1-ACP/Ca2+ open to inactivated conformations. No ordered lipids were observed in the open channel. Each subunit is displayed with a different color. (B) Side view of the lipophilic pocket in RyR1-ACP/Ca2+ open with overlaid lipid backbone extracted from the RyR1-ACP/Ca2+-inactivated conformation, showing expected steric hindrance of lipid 1 and lipid 2 with S6 and S4, respectively, as indicated with asterisks. See also Figure 6A, bottom panels. (C) Side view of RyR1-ACP/Ca2+ inactivated with resolved lipids. (D) Side view of the lipophilic pocket in RyR1-ACP/EGTA, with lower resolution but foreseeable lack of steric hindrance between protein and lipids. Overlaid lipid backbones are extracted from the inactivated conformation. (E) Side view of the lipophilic pocket in RyR2 closed at 3.27 Å resolution (PDB ID: 6WOU; Iyer et al., 2020) with lipids resolved in a comparable conformation to that found for RyR1 inactivated. Corresponding residues of interest are indicated. The + sign indicates transmembrane helices of the neighboring subunit.
Figure 5—video 1
Gating-induced conformational changes in nanodisc.
Conformational change in upper nanodisc belt while morphing from RyR1-ACP/Ca2+ inactivated to open conformations. The nanodisc can be seen expanding when transitioning to the open state. Volumes are low pass filtered and helices are displayed at a higher threshold for better visualization.
Figure 6
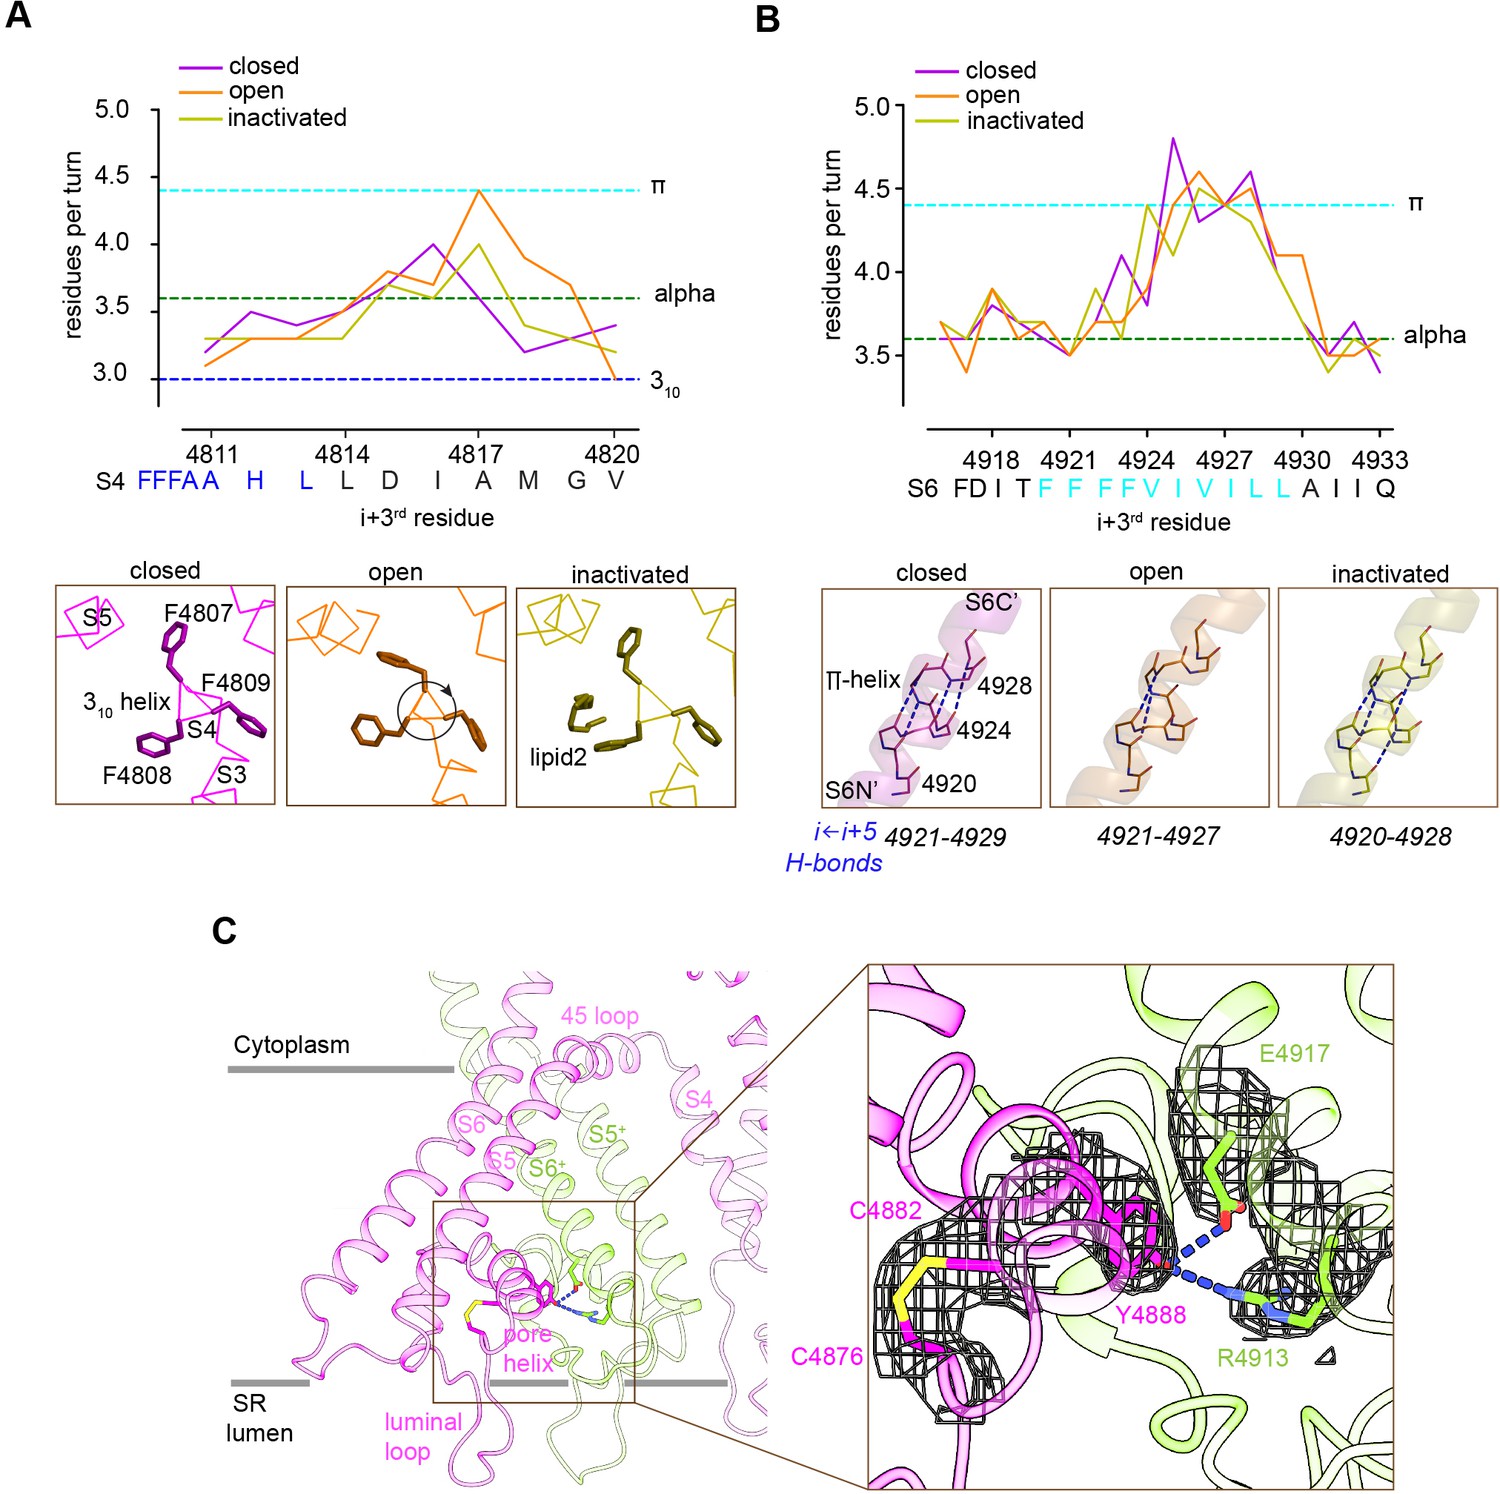
Local conformational changes in the transmembrane helices among closed, open, and inactivated conformations.
(A) Top: residues per turn for S4 reveals a 310 helix (4807–4813; blue dashed line) at its N′, and helical changes among the three conformations. Residues per turn are computed for a 3-residue moving window. Bottom: a segment of S4 displaying 310 helix in FFF (4807–4809). Uncoiling of the S4-C′ in the open structure rotates the FFF region, including Phe4808, which interacts with lipid 2 in the inactivated structure. (B) Top: the N′ region of S6 (residues 4920–4928) contains a tetra Phe motif (4920–4923) followed by a π-helix region. Bottom: the backbone hydrogen-bonding network in the π-helix region in the three distinct conformations; dashed lines show i ← i + 5 hydrogen bonds. (C) A Cys4876-Cys4882 disulfide bond formed between the luminal loop (4860–4878) and the pore helix (4879–4893) of the same subunit, and predicted hydrogen bonds between the P-loop (pore helix) and S6 from the neighboring subunit likely contribute to stabilize the luminal mouth of RyR1. The cryo-EM densities are shown in mesh.
Tables
Table 1
Summary of cryogenic electron microscopy (cryo-EM) data collection and image processing parameters.
| Dataset | RyR1ACP/EGTA closed | RyR1ACP/Ca22+A inactivated | RyR1ACP/Ca22+A inactivated class1 | RyR1ACP/Ca22+A inactivated class2 | RyR1ACP/Ca22+A inactivated class3 | RyR1ACP/Ca22+A inactivated CDTM | RyR1ACP/Ca22+A open | RyR1ACP/Ca22+A open CDTM | RyR1ACP/Ca22+B inactivated | RyR1ACP/Ca22+B open |
|---|---|---|---|---|---|---|---|---|---|---|
| Data acquisition | ||||||||||
| Microscope/detector | Krios/K2 | Krios/K3 | Krios/K2 | |||||||
| Voltage (kV) | 300 | 300 | 300 | |||||||
| Magnification | 130,000 | 81,000 | 130,000 | |||||||
| Defocus range (μm) | –1.2 to –2.2 | –1.25 to –2.5 | –1.25 to –2.5 | |||||||
| Pixel size (Å) (calibrated) | 1.06 (1.07) | 1.08 (1.105) | 1.06 (1.07) | |||||||
| Total electron dose (e/Å2) | 70 | 70 | 70 | |||||||
| Exposure time (s) | 12 | 4.4 | 14 | |||||||
| Number of frames | 60 | 50 | 50 | |||||||
| Total number of Micrographs | 1959 | 10,002 | 1346 | |||||||
| Image processing | ||||||||||
| Total number of particles selected | 52,856 | 311,258 | 35,554 | |||||||
| Final number of particles | 21,551 | 90,530 | 79,277 | 159,444 | 71,499 | 90,530 | 14,012 | 14,012 | 14,669 | 4160 |
| Reconstruction symmetry | C4 | C4 | C1 | C1 | C1 | C4 | C4 | C4 | C4 | C4 |
| Map resolution, FSC (0.143) (Å) (symmetry expanded map) | 4.3 (3.9) | 3.8 (3.5) | 3.7 | 3.3 | 3.8 | 3.5 | 4.6 (4.0) | 4.4 | 4.1 (3.8) | 5.8 |
| Map sharpening B-factor (Å2) (symmetry expanded map) | –132 | –150 (–144) | –125 | –102 | –123 | –142 | –168 (–135) | –144 | –111(–89) | –148 |
| EMDB ID | 22616 22597 | 25828 | 25831 | 25830 | 25832 | 25828* | 25829 | 25829* | 25833 | - |
-
*
Submitted as an additional map.
Table 2
Summary of model refinement and validation statistics.
| Dataset | RyR1ACP-EGTA | RyR1ACP/Ca22+A inactivated | RyR1ACP/Ca22+ A inactivated class1 | RyR1ACP/Ca22+ A inactivated class2 | RyR1ACP/Ca22+ A inactivated class3 | RyR1ACP/Ca22+ A open |
|---|---|---|---|---|---|---|
| RMS deviation (bonds) | 0.004 | 0.086 | 0.004 | 0.004 | 0.003 | 0.004 |
| RMS deviation (angle) | 0.919 | 0.812 | 0.893 | 0.788 | 0.848 | 0.766 |
| Ramachandran plot statistics (%) | ||||||
| Preferred | 92.39 | 93.38 | 93.85 | 95.54 | 94.13 | 94.90 |
| Allowed | 7.45 | 6.57 | 5.97 | 4.38 | 5.75 | 5.07 |
| Outliers | 0.16 | 0.05 | 0.19 | 0.08 | 0.12 | 0.03 |
| Clash-score | 7.58 | 7.65 | 5.62 | 3.90 | 4.94 | 4.60 |
| MolProbity score | 1.89 | 1.85 | 1.71 | 1.49 | 1.65 | 1.59 |
| PDB ID | 7K0T | 7TDG | 7TDJ | 7TDI | 7TDK | 7TDH |
Table 3
Differences between closed, open, and inactivated conformations.
| Conformation | Closed | Open | Inactivated |
|---|---|---|---|
| Pore | Closed | Open | Closed |
| Flexion angle (average) | –2.2° | –5.3° | –4.4° |
| In-plane rotation | 0 (reference) | Counterclockwise | Counterclockwise |
| High affinity Ca2+ 900 site | Empty | Occupied | Occupied |
| Ca2+ bound to ACP | No | Yes | Yes |
| CD/CTD | Disconnected | Connected | Connected |
| Position of CD-C′ | Down | Up/intermediate | Up |
| Position of CD-C′ | Up | Down/intermediate | Down |
| EF hand/S2–S3 loop | Separated | Separated | Form two salt bridges |
| S6 TMD helix (4921-4928) | π | π wide-short | π narrow-long |
| Lipids in TMD crevice | Present | Absent | Present |
-
TMD: transmembrane domain.
Key resources table
| Reagent type (species) or resource | Designation | Source or reference | Identifiers | Additional information |
|---|---|---|---|---|
| Strain, strain background (Oryctolagus cuniculus, mixed gender) | New Zealand White | Charles River | NZW 052 | |
| Recombinant DNA reagent | Membrane scaffold protein plasmid pMSP1E3D1 | Addgene | Cat# 20066 | |
| Chemical compound, drug | Ryanodine, [9,21-3H(N)]-, 250 µCi | PerkinElmer | Part# NET950250UC | |
| Chemical compound, drug | Adenosine-5'-[(α,β)-methyleno]diphosphate, Sodium salt | Jena Bioscience | Cat# NU-420-25 | |
| Chemical compound, drug | 16:0-18:1 PC(POPC) | Avanti Polar Lipids | Cat# 850457 | |
| Chemical compound, drug | 3-[(3-Cholamidopropyl) dimethylammonio]–1-propanesulfonate (CHAPS) | Sigma-Aldrich | Cat# 220201 | |
| Chemical compound, drug | HiTrap Heparin HP | Cytiva | Cat# 17-0406-01 | |
| Chemical compound, drug | L-α-phosphatidylcholine | Sigma-Aldrich | Cat# P3644 | |
| Chemical compound, drug | Sucrose | Sigma-Aldrich | Cat# S9378 | |
| Software, algorithm | Maxchelator | Bers et al., 2010 | https://somapp.ucdmc.ucdavis.edu/pharmacology/bers/maxchelator/CaMgATPEGTA-TS.htm | |
| Software, algorithm | MotionCor2 | Zheng et al., 2017 | ||
| Software, algorithm | Gctf | Zhang, 2016 | ||
| Software, algorithm | RELION-3.0 | Scheres, 2012 | ||
| Software, algorithm | PHENIX | Afonine et al., 2018 | http://www.phenix-online.org/ | |
| Software, algorithm | HELANAL | Bansal et al., 2000 | http://nucleix.mbu.iisc.ernet.in/helanalplus/index.html | |
| Software, algorithm | Coot | Emsley et al., 2010 | https://www2.mrc-lmb.cam.ac.uk/personal/pemsley/coot/ | |
| Software, algorithm | UCSF Chimera | Pettersen et al., 2004 | https://www.cgl.ucsf.edu/chimera/ | |
| Software, algorithm | UCSF ChimeraX | Pettersen et al., 2021 | https://www.cgl.ucsf.edu/chimerax/ | |
| Software, algorithm | PyMOL | Schrodinger, 2015 | https://pymol.org/2/ | |
| Software, algorithm | HOLE | Smart et al., 1993 | http://www.holeprogram.org/ | |
| Software, algorithm | Adobe Creative Cloud | Adobe | https://www.adobe.com/creativecloud/ | |
| Other | UltraAufoil –1.2/1.3 Holey-Gold 300 mesh grids | Quantifoil, Germany | https://www.quantifoil.com/products/ultrafoil |
Additional files
Download links
A two-part list of links to download the article, or parts of the article, in various formats.
Downloads (link to download the article as PDF)
Open citations (links to open the citations from this article in various online reference manager services)
Cite this article (links to download the citations from this article in formats compatible with various reference manager tools)
Ca2+ inactivation of the mammalian ryanodine receptor type 1 in a lipidic environment revealed by cryo-EM
eLife 11:e75568.
https://doi.org/10.7554/eLife.75568


